LOGAN: Local Group Bias Detection by Clustering
Abstract
Machine learning techniques have been widely used in natural language processing (NLP). However, as revealed by many recent studies, machine learning models often inherit and amplify the societal biases in data. Various metrics have been proposed to quantify biases in model predictions. In particular, several of them evaluate disparity in model performance between protected groups and advantaged groups in the test corpus. However, we argue that evaluating bias at the corpus level is not enough for understanding how biases are embedded in a model. In fact, a model with similar aggregated performance between different groups on the entire data may behave differently on instances in a local region. To analyze and detect such local bias, we propose LOGAN, a new bias detection technique based on clustering. Experiments on toxicity classification and object classification tasks show that LOGAN identifies bias in a local region and allows us to better analyze the biases in model predictions.
1 Introduction
Machine learning models such as deep neural networks have achieved remarkable performance in many NLP tasks. However, as noticed by recent studies, these models often inherit and amplify the biases in the datasets used to train the models Zhao et al. (2017); Bolukbasi et al. (2016); Caliskan et al. (2017); Zhou et al. (2019); Manzini et al. (2019); Blodgett et al. (2020).
To quantify bias, researchers have proposed various metrics to study algorithmic fairness at both individual and group levels. The former measures if a model treats similar individuals consistently no matter which groups they belong to, while the latter requires the model to perform similarly for protected groups and advantaged groups in the corpus.111For example, Zhao et al. (2018a) and Rudinger et al. (2018) evaluate the bias in coreference resolution systems by measuring the difference in score between cases where a gender pronoun refers to an occupation stereotypical to the gender and the opposite situation. In this paper, we argue that studying algorithmic fairness at either level does not tell the full story. A model that reports similar performance across two groups in a corpus may behave differently between these two groups in a local region.
For example, the performance gap of a toxicity classifier for sentences mentioning black and white race groups is .222 Performance in accuracy on the unintended bias detection task Conversation AI team (2019) This gap is only marginally larger than the performance gap of 2.4% when evaluating the model on two randomly split groups. However, if we evaluate the performance gap on the sentences containing the token “racist”, the performance gap between these two groups is as large as . Similarly, Zhao et al. (2017) report that a visual semantic role labeling system tends to label an image depicting cooking as woman cooking than man cooking. However, the model is, in fact, more likely to produce an output of man cooking when the agent in the image wears a chef hat. We call these biases exhibited in a neighborhood of instances local group bias in contrast with global group bias which is evaluated on the entire corpus.
To detect local group bias, we propose LOGAN, a LOcal Group biAs detectioN algorithm to identify biases in local regions. LOGAN adapts a clustering algorithm (e.g., K-Means) to group instances based on their features while maximizing a bias metric (e.g., performance gap across groups) within each cluster. In this way, local group bias is highlighted, allowing a developer to further examine the issue.
Our experiments on toxicity classification and MS-COCO object classification demonstrate the effectiveness of LOGAN. We show that besides successfully detecting local group bias, our method also provides interpretations for the detected bias. For example, we find that different topics lead to different levels of local group bias in the toxicity classification.
2 Related Work
Bias Evaluation
Researchers have proposed to study algorithmic fairness from both individual and group perspectives Dwork et al. (2012); Dwork and Ilvento (2018). To analyze group fairness, various metrics have been proposed. For example, demographic parity Dwork et al. (2012) requires the probability of the predictor making positive prediction to be independent of the sensitive attributes. However this metric cannot always guarantee fairness, as we can accept correct examples in one demographic group but make random guess in another one as long as we maintain the same acceptance ratio. To solve this problem, Hardt et al. (2016) propose new metrics, equalized odds and equalized opportunity, to measure the discrimination related to the sensitive attributes which require the predictions to be independent of the demographic attributes given true labels. In NLP, many studies use the performance gap between different demographic groups as a bias measurement Gaut et al. (2020); Kiritchenko and Mohammad (2018); Wang et al. (2019). The choice of bias metric depends on applications. In this work, we use performance gap as the bias evaluation metric. However, our approach can be generalized to other metrics.
Bias in NLP Applications
Recent advances in machine learning models boost the performance of various NLP applications. However, recent studies show that biases exhibit in NLP models. For example, researchers demonstrate that representations in NLP models are biased toward certain societal groups Bolukbasi et al. (2016); Caliskan et al. (2017); Zhao et al. (2018b, 2019); Zhou et al. (2019); May et al. (2019). Stanovsky et al. (2019) and Font and Costa-jussà (2019) show that gender bias exhibits in neural machine translations while Dixon et al. (2018) and Sap et al. (2019) reveal biases in text classification tasks. Other applications such as cross-lingual transfer learning Zhao et al. (2020) and natural language generation Sheng et al. (2019) also exhibit unintended biases.
3 Methodology
In this section, we first provide formal definitions of local group bias and then the details of the detection method LOGAN.
Performance Disparity
Assume we have a trained model and a test corpus that is used to evaluate the model. Let represents the performance of the model evaluated on the corpus . Based on the applications, the performance metric can be accuracy, AUC, false positive rates, etc. For the sake of simplicity, we assume each input example is associated with one of demographic groups (e.g., male or female), i.e., or .333In this paper, we consider only binary attributes such as gender = {male, female}, race = {white, black}. However, our approach is general and can be incorporated with any bias metric presented as a loss function. Therefore, it can be straightforwardly extended to a multi-class case by plugging the corresponding bias metric. As a running example, we take performance disparity as the bias metric. That is, if , then we consider that the model exhibits bias, where is a given threshold.
Definition of local group bias
We define local group bias as the bias exhibits in certain local region of the test examples. Formally, given a centroid in the input space, let and be the neighbor instances of in each group, where is a threshold. We call a model has local group bias if
| (1) |
While this definition is based on performance disparity, it is straightforward to extend the notion of local group bias to other bias metrics.
LOGAN
The goal of LOGAN is to cluster instances in such that (1) similar examples are grouped together, and (2) each cluster demonstrates local group bias contained in . To achieve this goal, LOGAN generates cluster by optimizing the following objective:
| (2) |
where is the clustering loss and is local group bias loss. is a hyper-parameter to control the trade-offs between the two objectives. if is assigned to the cluster ; otherwise. We introduce these two loss terms in the following.
Clustering objective
The loss is derived from a standard clustering technique. In this paper, we consider the K-Means clustering method Lloyd (1982). Specifically, the loss of K-Means is
| (3) |
is the mean of cluster . Note that our framework is general and other clustering techniques, such as Spectral clustering Shi and Malik (2000), DBSCAN Ester et al. (1996), or Gaussian mixture model can also be applied in generating the clusters. Besides, the features used for creating the clusters can be different from the features used in the model .
Local group bias objective
For the local group bias loss , the goal is to obtain a clustering that maximizes the bias metric within each cluster. In the following descriptions, we take the performance gap between different attributes (see Eq. (1)) as an example to describe the bias metric.
Let be the prediction of on . The local group bias loss is defined as the negative summation of performance gaps over all the clusters. If accuracy is used as the performance evaluation metric,
where is the indicator function.
Similar to K-Means algorithm, we solve Eq. (2) by iterating two steps: first, assign to its closest cluster based on current ; second, update based on current label assignment. We use k-means++ Arthur and Vassilvitskii (2007) for the cluster initialization and stop when the model converges or reaches enough iterations. To make sure each cluster contains enough instances, in practice, we choose a large ( in our case) and merge a small cluster to its closest neighbor. 444We merge the clusters iteratively and stop the procedure when all the clusters have at least 20 examples or only 5 clusters are left. For local group bias detection, we only consider clusters with at least 20 examples from each group.
4 Experiments
In this section, we show that LOGAN is capable of identifying local group bias, and the clusters generated by LOGAN provide an insight into how bias is embedded in the model.
4.1 Toxicity Classification
This task aims at detecting whether a comment is toxic (e.g. abusive or rude). Previous work has demonstrated that this task is biased towards specific identities such as “gay” Dixon et al. (2018). In our work, we use toxicity classification as one example to detect local group bias in texts and show that such local group bias could be caused by different topics in the texts.
Dataset
We use the official train and test datasets from Conversation AI team (2019). As the dataset is extremely imbalanced, we down-sample the training dataset and reserve 20% of it as the development set. In the end, we have , and examples for train, development and test, respectively. We tune and choose the one with the largest number of clusters showing local group bias.
Model
We fine-tune a BERT sequence classification model from Wolf et al. (2019) for 2 epochs with a learning rate , max sequence length and batch size . The model achieves accuracy on the whole test dataset.555The source code is available at https://github.com/uclanlp/clusters. We use sentence embeddings from the second to last layer of a pre-trained BERT model as features to perform clustering. We also provide clustering results based on the sentence embeddings extracted from a fine-tuned model in Appendix A.4.
| Race | Method | Acc-W | Acc-B | Bias |
|---|---|---|---|---|
| Global | 80.8 | 76.0 | 4.8 | |
| K-Means | 75.9 | 53.8 | 22.1 | |
| LOGAN | 76.7 | 55.2 | 21.5 | |
| Gender | Method | Acc-M | Acc-F | Bias |
| Global | 79.8 | 81.6 | 1.8 | |
| K-Means | 70.2 | 82.8 | 12.6 | |
| LOGAN | 80.2 | 57.1 | 23.1 |
Bias Detection
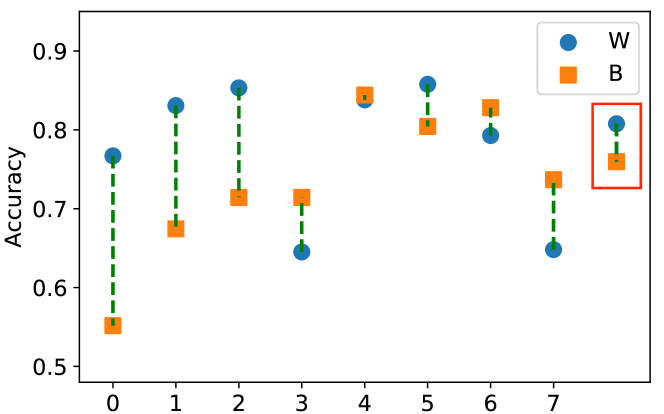
There are several demographic groups in the toxic dataset such as gender, race and religion. We focus on the binary gender (male/female) and binary race (black/white) in the experiments. For local group bias, we report the largest bias score among all the clusters. Figure 1 shows the accuracy of white and black groups in each cluster using LOGAN. The example bounded in the red box is the global accuracy of these two groups. Based on the results in Figure 1 and Table 1, we only detect weak global group bias in the model predictions. However, both K-Means and LOGAN successfully detect strong local group bias. In particular, LOGAN identifies a local region that the model has difficulties in making correct predictions for female group.
While we use the gap of accuracy as the bias metric, the clusters detected by LOGAN also exhibit local bias when evaluating using other metrics. Table 2 shows the gap of subgroup AUC scores over the clusters. Similar to the results in Table 1, K-Means and LOGAN detect local group bias. In particular, the first and the third clusters in Figure 1 also have larger AUC disparity than the global AUC gap. Similarly, the first three clusters in Figure 1 have a significantly larger gap of False Positive Rate across different groups than when evaluating on the entire dataset.
| Race | Method | AUC-W | AUC-B | Bias |
|---|---|---|---|---|
| Global | 0.870 | 0.846 | 0.024 | |
| K-Means | 0.836 | 0.679 | 0.157 | |
| LOGAN | 0.844 | 0.691 | 0.153 | |
| Gender | Method | AUC-M | AUC-F | Bias |
| Global | 0.896 | 0.924 | 0.028 | |
| K-Means | 0.828 | 0.922 | 0.094 | |
| LOGAN | 0.910 | 0.818 | 0.092 |
Bias Interpretation
To better interpret the local group bias, we run a Latent Dirichlet Allocation topic model Blei et al. (2003) to discover the main topic of each cluster. Table 3 lists the top 20 topic words for the most and least biased clusters using LOGAN under race attributes. We remove the words related to race attributes such as “white” and “black”. Other results are in Appendix A.2. We find that different topics in each cluster may lead to different levels of local group bias. For example, compared with the less biased group, the most biased group includes a topic on supremacy.
| Most Biased (21.5) | trump supremacist supremacists kkk |
| people party america racist | |
| president support vote sessions | |
| voters republican said obama | |
| man base bannon nationalists | |
| Least Biased (0.6) | people like get think know |
| say men see racist way | |
| good point right go person | |
| well make time said much |
Comparison between K-Means and LOGAN
We compare LOGAN with K-Means using the following 3 metrics. “Inertia” sums over the distances of all instances to their closest centers which is used to measure the clustering quality. We normalize it to make the inertia of K-Means . To measure the utility of local group bias detection, we look at the ratio of clusters showing a bias score at least 666We choose as it is close to the averaged bias score plus standard deviation when we randomly split the examples into two groups over 5 runs. (BCR) as well as the ratio of instances within those biased clusters (BIR). Table 4 shows that LOGAN increases the ratio of clusters exhibiting non-trivial local group bias by a large margin with trivial trade offs in inertia.
| Inertia | BCR | BIR | Bias | |
|---|---|---|---|---|
| K-Means | 1.0 | 62.5% | 58.2% | 12.4% |
| LOGAN | 1.002 | 75.0% | 71.8% | 12.0% |
4.2 Object Classification
We conduct experiments on object classification using MS-COCO Lin et al. (2014). Given one image, the goal is to predict if one object appears in the image. Following the setup in Wang et al. (2019), we exclude person from the object labels.
Dataset
Model
We use the basic model from Wang et al. (2019) for this task, which adapts a standard ResNet-50 pre-trained on ImageNet with the last layer modified. We follow the default hyper-parameters of the original model.
Bias Detection and Interpretation
We evaluate bias in the predictions of the object classification model by looking at the accuracy gap between male and female groups for each object. In the analysis, we only consider objects with more than 100 images in the test set. This results in a total of 26 objects. Among the three methods, Global can only detect group bias at threshold (i.e., performance gap ) for 14 objects, while K-Means and LOGAN increase the number to 19 and 21 respectively.
Comparing LOGAN with K-Means, among all the 26 objects, the average inertia is almost the same (the ratio is 1.001). On average, 34.0% and 35.7% of the clusters showing local group bias at threshold (i.e. BCR) and the ratio of instances in those biased clusters (i.e., BIR) are 57.7% and 54.9% for K-Means and LOGAN, respectively.
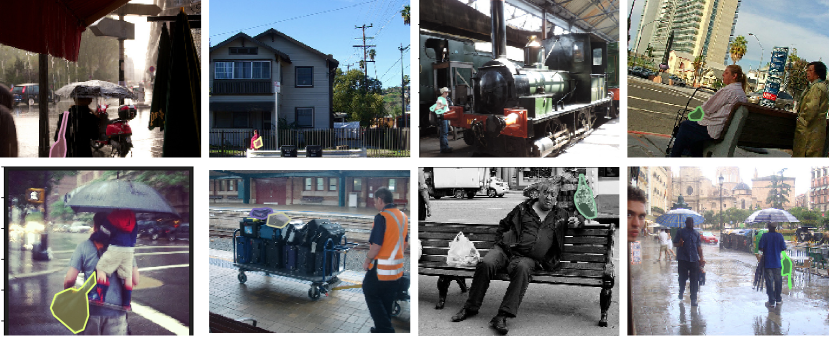
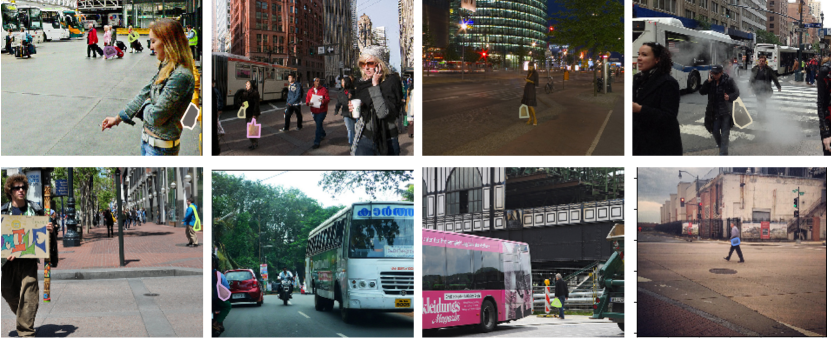
We further investigate the local groups discovered by LOGAN by comparing the images in the less biased local groups with the strong biased ones. We find that, for example, in the most biased local groups, the images often contain “handbag” with a street scene. In such a case, the model is more likely to correctly predict the agent in the image is woman (see Appendix A.5).
5 Conclusion
Machine learning models risk inheriting the underlying societal biases from the data. In practice, many works use the global performance gap between different groups as a metric to detect the bias. In this work, we revisit the coarse-grained metric for group bias analysis and propose a new method, LOGAN, to detect local group bias by clustering. Our method can help detect model biases that previously are hidden from the global bias metrics and provide an explanation of such biases.
We notice there are some limitations in LOGAN. For example, the number of instances in clusters could be uneven (see Appendix A.3).
Acknowledgment
This work was supported in part by National Science Foundation Grant IIS-1927554. We thank all the reviewers and members of UCLA-NLP and Plus labs for their feedback.
References
- Arthur and Vassilvitskii (2007) David Arthur and Sergei Vassilvitskii. 2007. k-means++: the advantages of careful seeding. In Proceedings of the eighteenth annual ACM-SIAM symposium on Discrete algorithms, pages 1027–1035. Society for Industrial and Applied Mathematics.
- Blei et al. (2003) David M Blei, Andrew Y Ng, and Michael I Jordan. 2003. Latent dirichlet allocation. Journal of machine Learning research, 3(Jan):993–1022.
- Blodgett et al. (2020) Su Lin Blodgett, Solon Barocas, Hal Daumé III, and Hanna Wallach. 2020. Language (technology) is power: A critical survey of “bias” in NLP. In Proceedings of the 58th Annual Meeting of the Association for Computational Linguistics, pages 5454–5476, Online. Association for Computational Linguistics.
- Bolukbasi et al. (2016) Tolga Bolukbasi, Kai-Wei Chang, James Y Zou, Venkatesh Saligrama, and Adam T Kalai. 2016. Man is to computer programmer as woman is to homemaker? debiasing word embeddings. In Advances in neural information processing systems, pages 4349–4357.
- Caliskan et al. (2017) Aylin Caliskan, Joanna J Bryson, and Arvind Narayanan. 2017. Semantics derived automatically from language corpora contain human-like biases. Science, 356(6334):183–186.
- Conversation AI team (2019) Conversation AI team. 2019. Jigsaw unintended bias in toxicity classification.
- Dixon et al. (2018) Lucas Dixon, John Li, Jeffrey Sorensen, Nithum Thain, and Lucy Vasserman. 2018. Measuring and mitigating unintended bias in text classification. In Proceedings of the 2018 AAAI/ACM Conference on AI, Ethics, and Society, pages 67–73.
- Dwork et al. (2012) Cynthia Dwork, Moritz Hardt, Toniann Pitassi, Omer Reingold, and Richard Zemel. 2012. Fairness through awareness. In Proceedings of the 3rd innovations in theoretical computer science conference, pages 214–226. ACM.
- Dwork and Ilvento (2018) Cynthia Dwork and Christina Ilvento. 2018. Group fairness under composition. In Proceedings of the 2018 Conference on Fairness, Accountability, and Transparency (FAT* 2018).
- Ester et al. (1996) Martin Ester, Hans-Peter Kriegel, Jörg Sander, Xiaowei Xu, et al. 1996. A density-based algorithm for discovering clusters in large spatial databases with noise. In Kdd, volume 96, pages 226–231.
- Font and Costa-jussà (2019) Joel Escudé Font and Marta R Costa-jussà. 2019. Equalizing gender bias in neural machine translation with word embeddings techniques. In Proceedings of the First Workshop on Gender Bias in Natural Language Processing, pages 147–154.
- Gaut et al. (2020) Andrew Gaut, Tony Sun, Shirlyn Tang, Yuxin Huang, Jing Qian, Mai ElSherief, Jieyu Zhao, Diba Mirza, Elizabeth Belding, Kai-Wei Chang, et al. 2020. Towards understanding gender bias in relation extraction. ACL.
- Hardt et al. (2016) Moritz Hardt, Eric Price, Nati Srebro, et al. 2016. Equality of opportunity in supervised learning.
- Kiritchenko and Mohammad (2018) Svetlana Kiritchenko and Saif M Mohammad. 2018. Examining gender and race bias in two hundred sentiment analysis systems. NAACL HLT 2018, page 43.
- Lin et al. (2014) Tsung-Yi Lin, Michael Maire, Serge Belongie, James Hays, Pietro Perona, Deva Ramanan, Piotr Dollár, and C Lawrence Zitnick. 2014. Microsoft coco: Common objects in context. In European Conference on Computer Vision. Springer.
- Lloyd (1982) Stuart Lloyd. 1982. Least squares quantization in pcm. IEEE transactions on information theory, 28(2):129–137.
- Manzini et al. (2019) Thomas Manzini, Yao Chong Lim, Yulia Tsvetkov, and Alan W Black. 2019. Black is to criminal as caucasian is to police: Detecting and removing multiclass bias in word embeddings. pages 615–621.
- May et al. (2019) Chandler May, Alex Wang, Shikha Bordia, Samuel R Bowman, and Rachel Rudinger. 2019. On measuring social biases in sentence encoders. arXiv preprint arXiv:1903.10561.
- Rudinger et al. (2018) Rachel Rudinger, Jason Naradowsky, Brian Leonard, and Benjamin Van Durme. 2018. Gender bias in coreference resolution. In Proceedings of the 2018 Conference of the North American Chapter of the Association for Computational Linguistics: Human Language Technologies, pages 8–14.
- Sap et al. (2019) Maarten Sap, Dallas Card, Saadia Gabriel, Yejin Choi, and Noah A Smith. 2019. The risk of racial bias in hate speech detection. In Proceedings of the 57th Annual Meeting of the Association for Computational Linguistics, pages 1668–1678.
- Sheng et al. (2019) Emily Sheng, Kai-Wei Chang, Premkumar Natarajan, and Nanyun Peng. 2019. The woman worked as a babysitter: On biases in language generation. In EMNLP (short).
- Shi and Malik (2000) Jianbo Shi and Jitendra Malik. 2000. Normalized cuts and image segmentation. IEEE Transactions on pattern analysis and machine intelligence, 22(8):888–905.
- Stanovsky et al. (2019) Gabriel Stanovsky, Noah A Smith, and Luke Zettlemoyer. 2019. Evaluating gender bias in machine translation. arXiv preprint arXiv:1906.00591.
- Wang et al. (2019) Tianlu Wang, Jieyu Zhao, Mark Yatskar, Kai-Wei Chang, and Vicente Ordonez. 2019. Balanced datasets are not enough: Estimating and mitigating gender bias in deep image representations. In International Conference on Computer Vision (ICCV).
- Wolf et al. (2019) Thomas Wolf, Lysandre Debut, Victor Sanh, Julien Chaumond, Clement Delangue, Anthony Moi, Pierric Cistac, Tim Rault, R’emi Louf, Morgan Funtowicz, and Jamie Brew. 2019. Huggingface’s transformers: State-of-the-art natural language processing. ArXiv, abs/1910.03771.
- Zhao et al. (2020) Jieyu Zhao, Subhabrata Mukherjee, Saghar Hosseini, Kai-Wei Chang, and Ahmed Hassan Awadallah. 2020. Gender bias in multilingual embeddings and cross-lingual transfer. ACL.
- Zhao et al. (2019) Jieyu Zhao, Tianlu Wang, Mark Yatskar, Ryan Cotterell, Vicente Ordonez, and Kai-Wei Chang. 2019. Gender bias in contextualized word embeddings. In Proceedings of the 2019 Conference of the North American Chapter of the Association for Computational Linguistics: Human Language Technologies, Volume 1 (Long and Short Papers).
- Zhao et al. (2017) Jieyu Zhao, Tianlu Wang, Mark Yatskar, Vicente Ordonez, and Kai-Wei Chang. 2017. Men also like shopping: Reducing gender bias amplification using corpus-level constraints. In Proceedings of the 2017 Conference on Empirical Methods in Natural Language Processing.
- Zhao et al. (2018a) Jieyu Zhao, Tianlu Wang, Mark Yatskar, Vicente Ordonez, and Kai-Wei Chang. 2018a. Gender bias in coreference resolution: Evaluation and debiasing methods. In Proceedings of the 2018 Conference of the North American Chapter of the Association for Computational Linguistics: Human Language Technologies, Volume 2 (Short Papers).
- Zhao et al. (2018b) Jieyu Zhao, Yichao Zhou, Zeyu Li, Wei Wang, and Kai-Wei Chang. 2018b. Learning gender-neutral word embeddings. In Proceedings of the 2018 Conference on Empirical Methods in Natural Language Processing.
- Zhou et al. (2019) Pei Zhou, Weijia Shi, Jieyu Zhao, Kuan-Hao Huang, Muhao Chen, Ryan Cotterell, and Kai-Wei Chang. 2019. Examining gender bias in languages with grammatical gender. In EMNLP.
Appendix A Appendices
A.1 Reproducibility
We describe the details of our two models here. For toxicity classification tasks, we run the model on a GeForce GTX 1080 Ti GPU for 2 epochs, which takes about 3 hours to finish the fine-tuning procedure. The accuracy for the dev dataset is 89.4 %. For MS-COCO object classification tasks, we use the basic model from https://github.com/uvavision/Balanced-Datasets-Are-Not-Enough. We train the model based on the default hyperparameters in this repo (for example, batch size is , learning rate is ). We get meanAP 52.3% and 53.1% for development and test, respectively. We attach partial code in the supplemental materials.
A.2 Topic words in different clusters
| Most biased (12.6) | white black people like |
| children abortion right get | |
| priests church take canada | |
| trump day think make | |
| young countries abortions time | |
| Least biased (0.4) | https http white trump |
| like abortion muslim years | |
| people religion time know | |
| read obama number go | |
| percent new said abortions |
| Most Biased (22.1) | trump supremacist supremacists |
| people kkk racist party sessions | |
| support america president vote | |
| said voters republican hate | |
| bannon right groups nazi | |
| Least Biased (0.03) | people like get think go |
| know say men make person | |
| right way good time well | |
| see racist point said race |
| Most Biased (23.1) | people like abortion think |
| know trump right get | |
| time make way see | |
| say said much care | |
| well life go right | |
| Least Biased (5.0) | people like trump get |
| church right know think | |
| time never way see | |
| years make children go | |
| abortion say rights good |
A.3 Local Bias Detection
| Gender | ID | #M | #F | M-acc | F-Acc | |
| 0 | 188 | 146 | 80.3 | 77.4 | 2.9 | |
| 1 | 144 | 103 | 86.1 | 85.4 | 0.7 | |
| 2 | 94 | 89 | 88.3 | 91.0 | 2.7 | |
| 3 | 189 | 193 | 77.2 | 76.7 | 0.5 | |
| 4 | 144 | 231 | 75.0 | 82.3 | 7.3 | |
| 5 | 202 | 319 | 83.7 | 85.9 | 2.2 | |
| 6 | 38 | 39 | 84.2 | 89.7 | 5.5 | |
| 7 | 124 | 244 | 70.2 | 82.8 | 12.6 | |
| 8 | 232 | 272 | 77.2 | 74.5 | 2.7 | |
| 9 | 41 | 40 | 85.4 | 85.0 | 0.4 | |
| Race | ID | #W | #B | W-acc | B-Acc | |
| 0 | 112 | 26 | 75.9 | 53.8 | 22.1 | |
| 1 | 116 | 41 | 81.0 | 70.7 | 10.3 | |
| 2 | 96 | 53 | 84.4 | 67.9 | 16.5 | |
| 3 | 128 | 59 | 72.7 | 72.9 | 0.2 | |
| 4 | 128 | 81 | 85.2 | 85.2 | 0 | |
| 5 | 192 | 75 | 88.0 | 80.0 | 8.0 | |
| 6 | 122 | 66 | 80.3 | 81.8 | 1.5 | |
| 7 | 63 | 40 | 69.8 | 75.0 | 5.2 |
| Gender | ID | #M | #F | M-acc | F-Acc | |
| 0 | 245 | 29 | 82.9 | 75.9 | 7.0 | |
| 1 | 172 | 41 | 78.5 | 63.4 | 15.1 | |
| 2 | 176 | 626 | 80.1 | 85.1 | 5.0 | |
| 3 | 212 | 70 | 78.3 | 64.3 | 14.0 | |
| 4 | 294 | 787 | 79.6 | 85.0 | 5.4 | |
| 5 | 216 | 52 | 78.7 | 61.5 | 17.2 | |
| 6 | 81 | 70 | 80.2 | 57.1 | 23.1 | |
| Race | ID | #W | #B | W-acc | B-Acc | |
| 0 | 103 | 29 | 76.7 | 55.2 | 21.5 | |
| 1 | 130 | 43 | 83.1 | 67.4 | 15.6 | |
| 2 | 109 | 56 | 85.3 | 71.4 | 13.9 | |
| 3 | 62 | 42 | 64.5 | 71.4 | 6.9 | |
| 4 | 142 | 77 | 83.8 | 84.4 | 0.6 | |
| 5 | 246 | 92 | 85.8 | 80.4 | 5.4 | |
| 6 | 111 | 64 | 79.3 | 82.8 | 3.5 | |
| 7 | 54 | 38 | 64.8 | 73.7 | 8.9 |
A.4 Results using embeddings extracted from a fine-tuned BERT model
In this section, we provide the results using the second to last layer embeddings from the fine-tuned BERT model to do local bias detection in Table 10 and 11.
| Gender | ID | #M | #F | M-acc | F-Acc | |
| 0 | 88 | 52 | 98.9 | 100 | 1.1 | |
| 1 | 155 | 140 | 95.5 | 98.6 | 3.1 | |
| 2 | 60 | 46 | 88.3 | 87.0 | 1.3 | |
| 3 | 237 | 362 | 99.2 | 99.2 | 0.0 | |
| 4 | 184 | 255 | 96.2 | 95.7 | 0.5 | |
| 5 | 130 | 191 | 26.2 | 31.9 | 5.8 | |
| 6 | 101 | 129 | 66.3 | 67.4 | 1.1 | |
| 7 | 169 | 192 | 99.4 | 99.5 | 0.1 | |
| 8 | 114 | 44 | 46.5 | 43.2 | 3.3 | |
| 9 | 158 | 264 | 58.2 | 66.7 | 8.4 | |
| Race | ID | #W | #B | W-acc | B-Acc | |
| 0 | 221 | 75 | 91.5 | 89.3 | 2.2 | |
| 1 | 81 | 47 | 60.5 | 59.6 | 0.9 | |
| 2 | 253 | 103 | 97.2 | 97.1 | 0.1 | |
| 3 | 165 | 71 | 78.8 | 76.1 | 2.7 | |
| 4 | 96 | 50 | 59.4 | 48.0 | 11.4 | |
| 5 | 61 | 29 | 72.1 | 89.7 | 17.5 | |
| 6 | 90 | 66 | 60.0 | 54.5 | 5.4 |
| Gender | ID | #M | #F | M-acc | F-Acc | |
| 0 | 31 | 342 | 45.2 | 78.1 | 32.9 | |
| 1 | 83 | 112 | 54.2 | 64.2 | 10.0 | |
| 2 | 92 | 353 | 75.0 | 97.8 | 22.7 | |
| 3 | 65 | 51 | 35.4 | 19.6 | 15.8 | |
| 4 | 102 | 68 | 83.3 | 79.4 | 3.9 | |
| 5 | 371 | 193 | 83.6 | 99.5 | 15.9 | |
| 6 | 34 | 84 | 26.5 | 33.3 | 6.86 | |
| 7 | 536 | 337 | 99.3 | 99.7 | 0.4 | |
| 8 | 57 | 72 | 33.3 | 44.4 | 11.1 | |
| 9 | 25 | 63 | 32.0 | 49.2 | 17.2 | |
| Race | ID | #W | #B | W-acc | B-Acc | |
| 0 | 24 | 59 | 62.5 | 96.6 | 34.1 | |
| 1 | 68 | 28 | 60.3 | 82.1 | 21.9 | |
| 2 | 77 | 29 | 58.4 | 86.2 | 27.8 | |
| 3 | 65 | 35 | 73.8 | 100 | 26.2 | |
| 4 | 82 | 31 | 63.4 | 90.3 | 26.9 | |
| 5 | 466 | 92 | 90.8 | 95.7 | 4.9 | |
| 6 | 35 | 63 | 85.7 | 49.2 | 36.5 | |
| 7 | 88 | 27 | 98.9 | 85.2 | 13.7 | |
| 8 | 52 | 77 | 61.5 | 32.5 | 29.1 |
A.5 Local Clusters for MS-COCO dataset
In this section, we show the local group bias analysis for MS-COCO objection classification tasks.