Creating a galaxy lacking dark matter in a dark matter dominated universe
Abstract
We use hydrodynamical cosmological simulations to show that it is possible to create, via tidal interactions, galaxies lacking dark matter in a dark matter dominated universe. We select dwarf galaxies from the NIHAO project, obtained in the standard Cold Dark Matter model and use them as initial conditions for simulations of satellite-central interactions. After just one pericentric passage on an orbit with a strong radial component, NIHAO dwarf galaxies can lose up to 80 per cent of their dark matter content, but, most interestingly, their central ( kpc) dark matter to stellar ratio changes from a value of , as expected from numerical simulations and abundance matching techniques, to roughly unity as reported for NGC1052-DF2 and NGC1054-DF4. The stellar velocity dispersion drops from before infall to values as low as . These, and the half light radius around 3 kpc, are in good agreement with observations from van Dokkum and collaborators. Our study shows that it is possible to create a galaxy without dark matter starting from typical dwarf galaxies formed in a dark matter dominated universe, provided they live in a dense environment.
keywords:
cosmology: theory – dark matter – galaxies: formation – galaxies: kinematics and dynamics – methods: numerical1 Introduction
A galaxy can be defined as a concentration of gas and stars sitting at the bottom of a dark matter potential well (e.g. Mo et al., 2010). In the current cosmological model, Dark Matter (DM) outnumbers baryons (gas and stars) by a factor of roughly one to five, and, at the zeroth order, galaxies are expected to reflect this mass ratio. Other effects also contribute to the depletion of baryons in a collapsed object, either by preventing gas from being accreted e.g the UV background (Bullock et al., 2001), or by expelling gas from the galaxy via supernova (SN) explosions (e.g. Tollet et al., 2019) and AGN feedback (e.g. Vogelsberger et al., 2014). As a result, galaxies are all mostly DM-dominated111This statement holds for galaxies in their outskirts where the enclosed mass is indeed dominated by a non-baryonic component. Closer to the center, galaxies display a wide range of mass fractions ranging from baryon to dark matter dominated (Courteau & Dutton, 2015)..
Such a prediction has been challenged by the discovery of two galaxies (NGC 1052-DF2 and NGC 1052-DF4: DF2 and DF4 hereafter) that seem to lack dark matter (van Dokkum et al., 2018; van Dokkum et al., 2019) in their central regions. These galaxies have a stellar mass of and are satellites of NGC 1052 (but see Montes et al., 2020, for a different interpretation for DF4), a massive ( ) elliptical galaxy (Müller et al., 2019).
Given their stellar mass, these objects are predicted to form in a dark matter halo of a mass (Moster et al., 2013); this mass translates into an expected (stellar) velocity dispersion of about 25 . Quite surprisingly, using the line-of-sight velocity of globular clusters up to a distance of 10 kpc, van Dokkum and collaborators have estimated a maximum velocity dispersion below 10 . When translated back into a mass, such a low velocity dispersion suggests a dark matter to stellar mass ratio of two to three, quite far from values of 30-40 at that radius expected from galaxy formation theory for a halo velocity dispersion of 25 (e.g. Behroozi et al., 2013). Note that the values of 400 for the dark matter to stellar mass ratio reported in the abstract of van Dokkum et al. (2018) is expected at the virial radius ( kpc); therefore, it is somewhat misleading to compare this value with results obtained on smaller scales ( kpc).
Several ideas have been advanced to explain these DM-deficient galaxies. For example, high speed collisions of gas rich dwarf galaxies (Silk, 2019; Shin et al., 2020) or self-interacting dark matter (Yang et al., 2020) might be possible channels for the formation of such objects. Since both observed galaxies are confirmed satellites of the same massive elliptical, a tidal origin may be the most plausible explanation.
Large numerical simulations have been extensively searched for the existence of dark matter deficient galaxies, with somewhat inconclusive results: Jing et al. (2019) used the EAGLE and Illustris simulations to find the 2 percent of the satellites in the mass range to be DM-poor. However, resolution limitations (for example, Jing et al. 2019 did not use the higher resolution EAGLE simulations as in Ploeckinger et al., 2018) restricted the use of a stellar mass to nearly a magnitude larger than the observed one (i.e. versus ). A similar exercise was carried out by Haslbauer et al. (2019) with the Illustris suite who found a much lower occurrence of DM-deficient galaxies, around 0.1 percent in the full simulated volume.
In order to overcome the limited resolution provided by large-volume simulations (at the scale of interest), Ogiya (2018) performed a series of controlled -body simulations of the tidal interaction between NGC 1052 and a smaller satellite galaxy aimed at representing the progenitor of DF2 and DF4. Under specific orbit conditions, these authors showed that it is indeed possible to preferentially remove dark matter from the satellite and hence create a DM-poor galaxy. While promising, this study used ad hoc assumptions about the DM and stellar profile of the satellites, with a spherical model for all the satellites in setting up the initial conditions for their numerical experiments. Cosmological numerical simulations, on the contrary, predict triaxial haloes on these scales (e.g., Butsky et al., 2016).
Towards a similar aim, we wish to combine state-of-the-art cosmological numerical simulations of galaxy formation from the NIHAO project (Numerical Investigations of Hundred Astrophysical Objects Wang et al., 2015) with hydrodynamical simulations of tidal interactions between a satellite galaxy and the central object. We shall use as initial conditions for the interaction simulations the output of fully cosmological hydrodynamical simulations of dwarf galaxy formation, and set them on radial orbits around a central potential aimed at reproducing the properties of NGC 1052. Besides the orbital trajectory of the satellite, no other free parameters are present in our simulations.
This paper is organized as follows: in Section 2, we describe the NIHAO sample and the set up for the central-satellite interaction simulations. In Section 3, we revisit the observational data for DF2 and DF4. Our results are then presented in Section 4, while Section 5 is devoted to summarizing and discussing our findings.
2 Simulations
We have selected our galaxies from the NIHAO (Numerical Investigation of Hundred Astrophysical Objects) sample, currently the the largest suite of high-resolution cosmological zoom-in simulations (Wang et al., 2015).
These simulations have been performed with the gasoline2 code (described in Wadsley et al., 2017) and include metal cooling, chemical enrichment, star formation and feedback from SN and massive stars (the so-called Early Stellar Feedback). The cosmological parameters have been set according to Ade et al. (2014), and each galaxy is resolved with roughly one million elements (dark matter, gas, and stars) within the virial radius.
NIHAO simulations can successfully reproduce a large variety of galaxy properties like the stellar-to-halo mass relation (Wang et al., 2015), the disc gas mass and disc size relation (Macciò et al., 2016), the Tully-Fisher relation (Dutton et al., 2017), the diversity of galaxy rotation curves (Santos-Santos et al., 2018), and the the satellite mass function of the Milky Way and M31 (Buck et al., 2019).
Using realistic cosmological hydrodynamical simulations as a starting point is one of the advantages of our work with respect to previous attempts to reproduce galaxies lacking dark matter. High-resolution cosmological simulations naturally provide realistic orbits for both the dark matter and the star particles. Moreover, they do not impose any (unrealistic) assumptions, such as spherical symmetry or dynamical equilibrium for the halo or the stellar disc. For example, galaxies with stellar masses around are seldom perfectly rotating discs, and they usually show a spheroidal disc component with substantial velocity dispersion (Wheeler et al., 2017; Frings et al., 2017).
We have selected three NIHAO galaxies, namely g5.05e10, g6.91e10, and g7.12e10 (hereafter G1, G2 and G3)222In the NIHAO project, the name of a galaxy reflects its total mass in the low resolution run., as initial conditions; these cover the stellar mass and size (half-light radius) range of DF2 and DF4. These simulations have all used the same resolution, with a dark matter and star mass resolution of and and a gravitational softening of pc and pc. The main structural properties of the three NIHAO galaxies are listed in Table 1. They have been extracted from the cosmological simulations at and cut at 2.5 times their virial radius (Macciò et al., 2019).
| Name | NIHAO | kpc) | |||
|---|---|---|---|---|---|
| name | [ ] | [ ] | [kpc] | [] | |
| G1 | g5.05e10 | 1.6 | 27.5 | ||
| G2 | g6.91e10 | 2.1 | 26.8 | ||
| G3 | g7.12e10 | 2.8 | 37.2 |
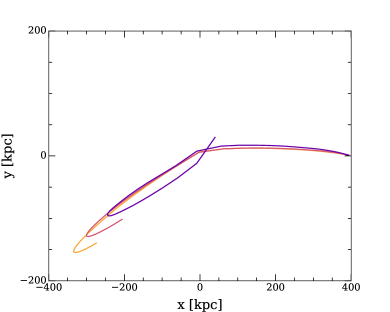
Following the approach of Ogiya (2018), we have set those galaxies on radial orbits around a central potential. All simulations start at a distance of 400 kpc from the center, which represents the virial radius of the host halo. Each orbit is defined by the initial velocity of the galaxy with respect to the virial velocity of the host halo ( ); all orbits are in the plane and hence have . A complete list of the orbital parameters is presented in Table 2; each orbit is evolved for 4.5 Gyr to mimic a typical infall time of the satellites around (Macciò & Fontanot, 2010). Fig. 1 shows three of the orbits (O1,O2 and O3) in the plane that will be analyzed in detail in this paper.
| Name | d [kpc] | symbol | |||
|---|---|---|---|---|---|
| O1 | -0.35 | 0.05 | 0.0 | 7 | |
| O2 | -0.25 | 0.05 | 0.0 | 7 | |
| O3 | -0.25 | 0.07 | 0.0 | 11 | |
| O4 | -0.4 | 0.04 | 0.0 | 31 | |
| O5 | -0.3 | 0.07 | 0.0 | 29 | |
| O6 | -0.35 | 0.04 | 0.0 | 10 | |
| O7 | -0.2 | 0.07 | 0.0 | 32 | |
| O8 | -0.4 | 0.05 | 0.0 | 31 |
The central potential is fully analytic and composed of two components: i) a dark matter halo with total mass of (Forbes et al., 2019) and concentration parameter of 8 (Dutton & Macciò, 2014) and ii) a Hernquist bulge to describe the stellar component (aka the central massive elliptical galaxy NGC1052), with a total mass of and a radius of 0.7 kpc (Müller et al., 2019).
All simulations were performed with the gasoline2 code (Wadsley et al., 2017) with the same set up used previously in Frings et al. (2017), which includes ram pressure, star formation, and stellar+SN feedback (see Frings et al., 2017, for more details). Due to their low mass, the satellite galaxies are quite gas poor and the inclusion of star formation and related feedback processes is of marginal importance for the results presented in this work.
3 Observational Data
The observations used in this work are based on the discovery papers of DF2 (van Dokkum et al., 2018) and DF4 (van Dokkum et al., 2019). For each observed galaxy, we use both measurements presented in these papers: the observed velocity dispersion (8.4 for DF2 and 5.8 for DF4) to which we assign a Poissonian error based on the number of globular clusters used to compute it, and the intrinsic velocity dispersion (3.2 for DF2 and 4.2 for DF4) and relative errors, as computed by the authors taking into account observational biases (see van Dokkum et al., 2018; van Dokkum et al., 2019, for more details).
For their two galaxies, DF2 and DF4, van Dokkum et al. (2018); van Dokkum et al. (2019) adopted the stellar mass-to-light ratio based on the assumption that the galaxies’ average stellar population would resemble that of a globular cluster (GC) with a metallicity [/H]=-1 and age of 11 Gyr. It was then confirmed by placing a stellar population at Mpc that matches the global properties of NGC1052–DF2 with the adopted .
On the other hand, for typical globular clusters, a metallicity [/H]=-1 corresponds to [Fe/H] (Thomas et al., 2011). Such a metallicity is quite high for dwarf galaxies (Kirby et al., 2015). Therefore, extrapolations involving GC SEDs may not be representative as the stellar populations of dwarf galaxies and GCs (measured through their SEDs) can differ significantly.
One may also obtain typical stellar population parameters of DF2 and DF4 by comparing with other dwarf galaxies. To arrive at a representative value of , we first transform the colour reported in van Dokkum et al. (2018) for DF2, namely , into the Johnson-Cousin333https://colortool.stsci.edu/uvis-filter-transformations colour of (this error does not account for the small transformation scatter). This colour is converted into a stellar mass-to-light colour via transformations calibrated for Local Group dwarf galaxies (Zhang et al., 2017). The resulting stellar for DF2 is . While this approach yields a smaller , the methodology does not rely on a globular cluster template.
In order to consider all possible ranges of stellar population in dwarf galaxies, we also compare with a large database of estimates for low-mass galaxies. A sample of 400 low-mass galaxies () from the MaNGA survey (Bundy et al., 2015) yields an average (Arora et al., in prep.). The colour-mass-to-light models in Zhang et al. (2017) were also used to transform colours of MaNGA galaxies into . The average, error, and models used in this calculation account for a full range of evolutionary histories of dwarf galaxies.
In order to obtain stellar masses for DF2 and DF4, we have adopted the value . We have also assumed a systematic error of 0.3 dex for the estimated stellar masses (Roediger & Courteau, 2015). Besides the uncertainty on , this systematic error accounts for the various assumptions involved in transforming light into mass (e.g. IMF, star formation histories, stellar population models, etc.; Courteau et al., 2014).
4 Results
The key observable in the DF2 and DF4 galaxies is the velocity dispersion of the stars that is then used to determine the total dynamical mass of the object and hence the luminous-to-dark mass ratio.
Initially, we searched the NIHAO database for galaxies naturally lacking DM. Fig. 2 shows the stellar velocity dispersion within 8 kpc vs stellar mass () for NIHAO galaxies; note that the value of 8 kpc for computing both quantities was chosen for consistency with observational data. None of the simulated galaxies have a velocity dispersion comparable to those of DF2 or DF4 in the same range ( ); the predicted velocity dispersion from the NIHAO simulations is close to 20-25 , while the observed values are below 10 .
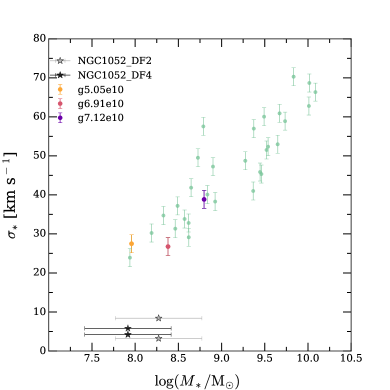
Fig. 2 suggests that some additional external effects are needed to bring simulations and observations into agreement, and since NIHAO galaxies have all been selected to be centrals and fairly isolated (see Wang et al., 2015, for more details), it is natural to study the effect of the environment. Given that DF2 and DF4 are both satellites of NGC1052, we want to study the effects of tidal interactions in details by performing high resolution central/satellite simulations.
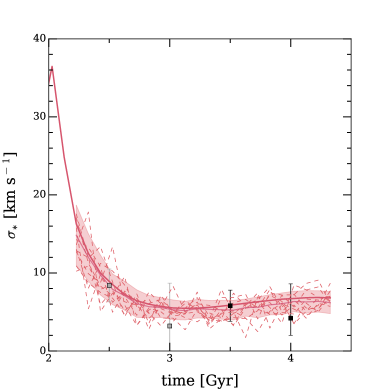
Fig. 3 shows the evolution of the stellar velocity dispersion () within 8 kpc from the center (consistent with the measurements of van Dokkum and collaborators) for G2 on the O2 orbit444All velocity dispersions shown in the paper are 1D and computed along the axis of the simulation.. The solid line represents computed using all stars within the selected radius, and agrees well with the observational points from van Dokkum et al. (2018); van Dokkum et al. (2019). On the other hand, the observed data are based on the measurements of the line of sight velocity of ten and seven globular clusters for DF2 and DF4, respectively; in order to match observations closely, we have also tried to select nine old and metal-poor stellar particles from our simulations, ensuring they have the same radial distribution as the globular cluster in DF2. The dashed line in Fig. 3 shows the velocity dispersion obtained this way, which is in good agreement with the mean velocity dispersion (from all stars). There is a scatter of about 2 quite independent of time (the scatter in the figure is based on 100 realizations of the nine point sampling, ten of those realizations are shown in the plot). We will use this scatter due to the limited number of velocity tracers in the following as the default error on the dispersion velocity.
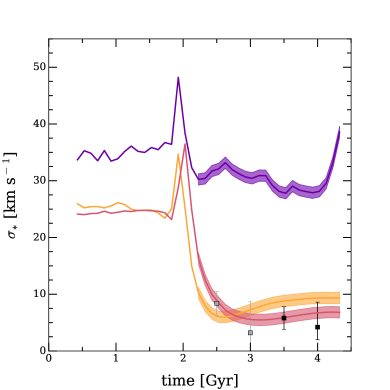
Despite being similar parameters, not all galaxy-orbit pairs are equally effective in reducing the dark matter fraction and/or the stellar velocity dispersion. Fig. 4 shows the change in as a function of time for three different orbit-galaxy pairs. Two of them have final values for the stellar velocity dispersion below 10 , while the galaxy on the O3 orbit, despite having a pericenter distance of few kpc, has an almost constant throughout the whole orbit, around 30 .
The change in the stellar velocity dispersion is related to a substantial change in the mass content in the inner regions of the galaxy. Fig. 5 shows the change in the dark-to-stellar mass ratio within a radius of 8 kpc over time.
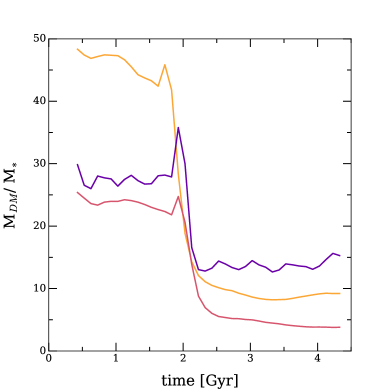
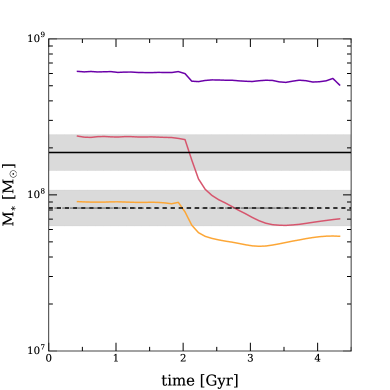
The galaxy orbit combinations with the strongest variation are the ones showing the largest reduction of the dark-to-stellar mass ratio, which drops by a factor larger than five in all cases. While the dark matter content is reduced by more than a factor of ten, the is much more resilient to tidal forces, as shown in Fig. 6. The stellar content of all galaxies is within a factor of few (on average ) with respect the initial one, showing a strong difference in the reaction of the inner ( kpc) distribution of DM and stars to tidal effects.
This difference in the response of the inner stellar component when compared with the inner dark matter one is related to the very different orbits that DM and stars have within the galaxy. Dark matter particles are on quite extended orbits (e.g. Jesseit, 2004), and particles that are in the inner region of the galaxy at a given time can move quite farther out in the halo at a later time and hence be subject to tidal stripping effects. On the contrary, stars are confined to the inner region and then shielded from tidal perturbations by the dark matter (e.g. Peñarrubia et al., 2010; Buck et al., 2019). This difference in the orbit distribution between stars and DM, is the key ingredient to preferentially remove dark matter instead of stars from the central region of a galaxy and then create an object that is almost dark matter free.
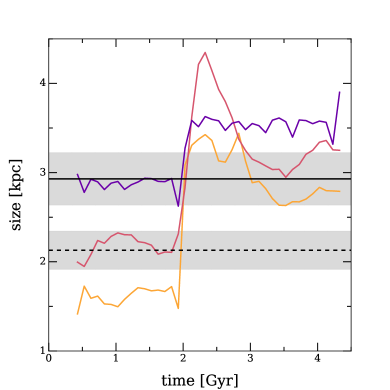
Another effect of tidal forces is to induce dynamical relaxation in the perturbed object (Chang et al., 2013), which usually leads to an increase in radius. Fig. 7 shows the behaviour of the stellar radius as a function of time and compare it to the observational values for DF2 and DF4.
In order to estimate the half-light radius, we first calculate the -band surface brightness profile for each galaxy in face-on alignment. The luminosity of every star particle, given its age, metallicity, and initial mass function, is assigned using the Padova simple stellar population model555http://stev.oapd.inaf.it/cgi-bin/cmd (Marigo et al., 2008; Girardi et al., 2010). We exclude any stars that are beyond the radial surface brightness threshold of 31 mag arcsec-2, consistent with the DRAGONFLY survey (Merritt et al., 2016). We then find the 2D radius within which half the -band light resides. Finally, we do not account for dust extinction, which would generally serve to reduce the simulated galaxy radii. It is worth noticing that the exact value of the surface brightness threshold does not strongly affect the estimated radius.
Our results show quite a large scatter in the response of G1, G2, and G3 to interaction with the central potential. It is interesting to see if this difference is due to the orbital parameters or to the intrinsic properties of the galaxies.
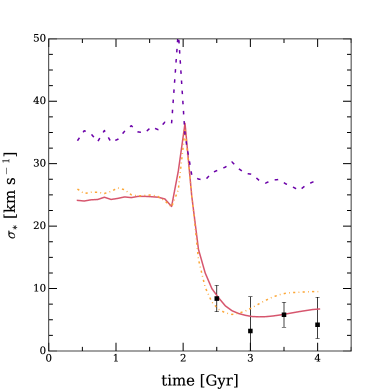
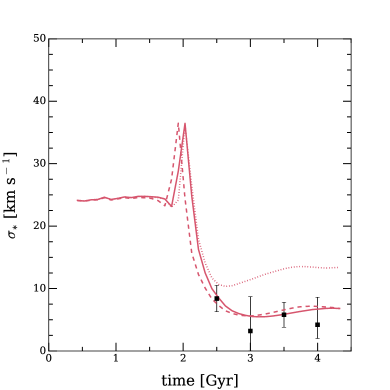
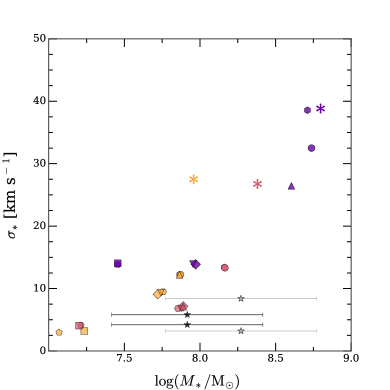
Fig. 8 presents the evolution of the stellar velocity dispersion either at a fixed orbit for the three galaxies or at a fixed galaxy on our three test orbits. More specifically, the top panel shows G1,G2 and G3 all on orbit O2, while the bottom panel shows galaxy G2 on orbits O1 (dashed line), O2 (solid line), and O3 (dotted line). Finally, Fig. 9 shows the results for the eight orbits (see Table 2) on the three galaxies; different symbols correspond to different orbits, while the color scheme is the same as in the previous plots.
As the figures make clear, no matter the orbit, G3 always has a final velocity dispersion above 14 , while G1 and G2 can reach dispersions well below 10 on several orbits. The properties of the galaxy are indeed more important than the parameters of the orbit in setting the evolution of stellar velocity dispersion.
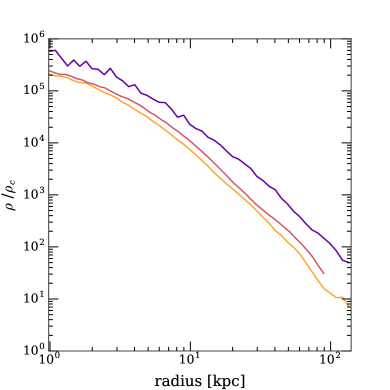
This is due to the more concentrated and partially “cuspier” dark matter density profile of G3 with respect to the other two galaxies, as shown in Fig. 10. All three galaxies have a density profile shallower than predicted by pure -body simulations (e.g. Dutton & Macciò, 2014). For example, the slopes of the density profile between 1 and 2 per cent of the virial radius are 0.33, 0.64, and 0.72 for the three galaxies, respectively (Macciò et al., 2020), while an NFW profile (Navarro et al., 1996) always yields slopes steeper than -1. Moreover, at all scales G3 has three to four times the mass of G1 or G2. These two effects make G3 more resilient to tidal forces (Read et al., 2006; Peñarrubia et al., 2008; Ogiya, 2018). As a consequence, the mass loss is reduced in G3, which then retains a larger velocity dispersion.
Finally, despite the substantial tidal perturbation experienced by the galaxies near the center of the potential and once observed at a distance of hundred kpc from the center (similar to DF2 and DF4), we stress that the simulated galaxies do not show any clear evidence of tidal effects (e.g. stellar streams, flares, etc.). They present rather smooth morphologies in agreement with the observed ones for DF2 and DF4.
5 Discussion and Conclusions
In two recent papers, van Dokkum and collaborators have reported the observation of two low-mass galaxies ( ) with an extremely low stellar central velocity dispersion ( ). This dispersion, when translated into a mass estimate and compared with the stellar mass within a radius of 8 kpc, seems to suggest a very low central dark matter content, almost consistent with no dark matter at all. This contrasts with predictions from simulations and abundance matching techniques (e.g. Moster et al., 2013) that predict galaxies in this range to live in much more massive dark matter haloes with velocity dispersion close to 30 and being strongly DM-dominated in their central regions (up to 30-40 times more dark than visible matter). These observations bring into question whether these DM-deficient galaxies can actually form in a DM-dominated universe (as implied by CMB observations Ade et al., 2014), or if they somehow challenge our current picture of galaxy and structure formation.
In this paper, we have used a combination of cosmological hydrodynamical simulations from the NIHAO project (Wang et al., 2015) and direct interaction simulations (Frings et al., 2017; Ogiya, 2018) to investigate whether tidal effects can explain the dynamical properties of DF2 and DF4 within the confines of the classical galaxy formation scenario (e.g. Somerville & Davé, 2015).
By comparing the observed velocities with the ones extracted from NIHAO galaxies, we have shown that objects with a as low as the ones in DF2 and DF4 cannot be reproduced by our current simulations of field galaxies (i.e. central objects), despite NIHAO having quite a strong ‘halo expansion’ as an effect of galaxy formation (Tollet et al., 2016; Macciò et al., 2020). Since both DF2 and DF4 are satellite galaxies of NGC 1052, a massive elliptical galaxy, there have been suggestions that tidal effects could reduce the central DM density (Ogiya, 2018; Jing et al., 2019).
In our paper, for the first time, we have combined high-resolution cosmological simulations (with more than elements to describe DM, gas and stars) with direct interaction simulations to study the effect of tidal forces on the DM distribution in DF2 and DF4 analogues.
By injecting cosmological galaxies on orbits with a strong radial component, we have created galaxies capable of reproducing all the key properties of DF2 and DF4. We have obtained a simulated central stellar velocity dispersion as low as , where the uncertainty arises from the random sampling of 10 globular cluster analogues for computing the velocity dispersion. Despite strong tidal effects near the center, simulated galaxies do not show evidence of tidal perturbations (e.g. stellar streams) once observed at a distance of few hundreds kpc from the center, in agreement with the position and morphology of DF2 and DF4.
The change in the stellar velocity dispersion from initial (i.e. in isolation) values around 30 to the final ones of few is related to the strong preferential removal of dark matter (with respect to stars) even from an inner region of 8 kpc in radius. The dark matter content is reduced by a factor of 20 to 100, while the stellar mass only changes by a factor of a few. As a result, the central DM to stellar mass ratio changes from 25-40 to values closer to unity. We ascribe this differential change to the different orbits of the central stellar and dark matter particles, with the latter being in more radially elongated trajectories making them more susceptible to tidal forces (e.g. Jesseit, 2004; Peñarrubia et al., 2010).
Overall, our study shows how it is possible to create, in a dense environment, galaxies with extremely low central velocity dispersions, with stellar masses and sizes consistent with those of DF2 and DF4. Galaxies lacking dark matter in a group environment may not represent a departure from current cosmological models. Further observational (Montes et al., 2020) and numerical investigations666A paper by Jackson et al. (2020) reaching similar conclusions was submitted on arXiv within seconds of our post. The calculation of the actual probability of such an event is beyond the scope of this work. must assess if the frequency of dark matter deficient galaxies is consistent with typical satellite orbit distributions predicted by hierarchical structure formation.
Data availability
The data underlying this article will be shared on reasonable request to the corresponding author.
Acknowledgements
The authors gratefully acknowledge the Gauss Centre for Supercomputing e.V. (www.gauss-centre.eu) for funding this project by providing computing time on the GCS Supercomputer SuperMUC at Leibniz Supercomputing Centre (www.lrz.de) and the High Performance Computing resources at New York University Abu Dhabi. AVM thanks J. Frings for sharing the software to set up the interaction simulations. TB acknowledges support from the European Research Council under ERC-CoG grant CRAGSMAN-646955. SC acknowledges funding from the Natural Science and Engineering Research Council of Canada via their Discovery Grant program.
References
- Ade et al. (2014) Ade P. A. R., et al., 2014, Astron. Astrophys., 571, A16
- Behroozi et al. (2013) Behroozi P. S., Wechsler R. H., Conroy C., 2013, ApJ, 770, 57
- Buck et al. (2019) Buck T., Macciò A. V., Dutton A. A., Obreja A., Frings J., 2019, MNRAS, 483, 1314
- Bullock et al. (2001) Bullock J. S., Kolatt T. S., Sigad Y., Somerville R. S., Kravtsov A. V., Klypin A. A., Primack J. R., Dekel A., 2001, MNRAS, 321, 559
- Bundy et al. (2015) Bundy K., et al., 2015, ApJ, 798, 7
- Butsky et al. (2016) Butsky I., et al., 2016, MNRAS, 462, 663
- Chang et al. (2013) Chang J., Macciò A. V., Kang X., 2013, MNRAS, 431, 3533
- Courteau & Dutton (2015) Courteau S., Dutton A. A., 2015, ApJ, 801, L20
- Courteau et al. (2014) Courteau S., et al., 2014, Reviews of Modern Physics, 86, 47
- Dutton & Macciò (2014) Dutton A. A., Macciò A. V., 2014, MNRAS, 441, 3359
- Dutton et al. (2017) Dutton A. A., et al., 2017, MNRAS, 467, 4937
- Forbes et al. (2019) Forbes D. A., Alabi A., Brodie J. P., Romanowsky A. J., 2019, MNRAS, 489, 3665
- Frings et al. (2017) Frings J., Macciò A., Buck T., Penzo C., Dutton A., Blank M., Obreja A., 2017, MNRAS, 472, 3378
- Girardi et al. (2010) Girardi L., et al., 2010, ApJ, 724, 1030
- Haslbauer et al. (2019) Haslbauer M., Dabringhausen J., Kroupa P., Javanmardi B., Banik I., 2019, A&A, 626, A47
- Jackson et al. (2020) Jackson R. A., et al., 2020, arXiv e-prints, p. arXiv:2010.02219
- Jesseit (2004) Jesseit R., 2004, PhD thesis, -
- Jing et al. (2019) Jing Y., Wang C., Li R., Liao S., Wang J., Guo Q., Gao L., 2019, MNRAS, 488, 3298
- Kirby et al. (2015) Kirby E. N., Simon J. D., Cohen J. G., 2015, ApJ, 810, 56
- Macciò & Fontanot (2010) Macciò A. V., Fontanot F., 2010, MNRAS, 404, L16
- Macciò et al. (2016) Macciò A. V., Udrescu S. M., Dutton A. A., Obreja A., Wang L., Stinson G. R., Kang X., 2016, MNRAS, 463, L69
- Macciò et al. (2019) Macciò A. V., Frings J., Buck T., Dutton A. A., Blank M., Obreja A., Dixon K. L., 2019, MNRAS, 484, 5400
- Macciò et al. (2020) Macciò A. V., Crespi S., Blank M., Kang X., 2020, MNRAS,
- Marigo et al. (2008) Marigo P., Girardi L., Bressan A., Groenewegen M. A. T., Silva L., Granato G. L., 2008, A&A, 482, 883
- Merritt et al. (2016) Merritt A., van Dokkum P., Abraham R., Zhang J., 2016, ApJ, 830, 62
- Mo et al. (2010) Mo H., van den Bosch F. C., White S., 2010, Galaxy Formation and Evolution
- Montes et al. (2020) Montes M., Infante-Sainz R., Madrigal-Aguado A., Román J., Monelli M., Borlaff A. S., Trujillo I., 2020, arXiv e-prints, p. arXiv:2010.09719
- Moster et al. (2013) Moster B. P., Naab T., White S. D. M., 2013, MNRAS, 428, 3121
- Müller et al. (2019) Müller O., et al., 2019, A&A, 624, L6
- Navarro et al. (1996) Navarro J. F., Eke V. R., Frenk C. S., 1996, MNRAS, 283, L72
- Ogiya (2018) Ogiya G., 2018, MNRAS, 480, L106
- Peñarrubia et al. (2008) Peñarrubia J., Navarro J. F., McConnachie A. W., 2008, ApJ, 673, 226
- Peñarrubia et al. (2010) Peñarrubia J., Benson A. J., Walker M. G., Gilmore G., McConnachie A. W., Mayer L., 2010, MNRAS, 406, 1290
- Ploeckinger et al. (2018) Ploeckinger S., Sharma K., Schaye J., Crain R. A., Schaller M., Barber C., 2018, MNRAS, 474, 580
- Read et al. (2006) Read J. I., Wilkinson M. I., Evans N. W., Gilmore G., Kleyna J. T., 2006, MNRAS, 366, 429
- Roediger & Courteau (2015) Roediger J. C., Courteau S., 2015, MNRAS, 452, 3209
- Santos-Santos et al. (2018) Santos-Santos I. M., Di Cintio A., Brook C. B., Macciò A., Dutton A., Domínguez-Tenreiro R., 2018, MNRAS, 473, 4392
- Shin et al. (2020) Shin E.-j., Jung M., Kwon G., Kim J.-h., Lee J., Jo Y., Oh B. K., 2020, ApJ, 899, 25
- Silk (2019) Silk J., 2019, MNRAS, 488, L24
- Somerville & Davé (2015) Somerville R. S., Davé R., 2015, ARA&A, 53, 51
- Thomas et al. (2011) Thomas D., Johansson J., Maraston C., 2011, MNRAS, 412, 2199
- Tollet et al. (2016) Tollet E., et al., 2016, MNRAS, 456, 3542
- Tollet et al. (2019) Tollet É., Cattaneo A., Macciò A. V., Dutton A. A., Kang X., 2019, MNRAS, 485, 2511
- Vogelsberger et al. (2014) Vogelsberger M., et al., 2014, MNRAS, 444, 1518
- Wadsley et al. (2017) Wadsley J. W., Keller B. W., Quinn T. R., 2017, MNRAS, 471, 2357
- Wang et al. (2015) Wang L., Dutton A. A., Stinson G. S., Macciò A. V., Penzo C., Kang X., Keller B. W., Wadsley J., 2015, MNRAS, 454, 83
- Wheeler et al. (2017) Wheeler C., et al., 2017, MNRAS, 465, 2420
- Yang et al. (2020) Yang D., Yu H.-B., An H., 2020, arXiv e-prints, p. arXiv:2002.02102
- Zhang et al. (2017) Zhang H.-X., Puzia T. H., Weisz D. R., 2017, ApJS, 233, 13
- van Dokkum et al. (2018) van Dokkum P., et al., 2018, Nature, 555, 629
- van Dokkum et al. (2019) van Dokkum P., Danieli S., Abraham R., Conroy C., Romanowsky A. J., 2019, ApJ, 874, L5