Computational study of crystal defects formation in Mo by machine learned molecular dynamics simulations
Abstract
In this work, we study the damage in crystalline molybdenum material samples due to neutron bombardment in a primary knock-on atom range of 0.5-10 keV at room temperature. We perform machine learned molecular dynamics (MD) simulations with a previously developed interatomic potential based on the Gaussian Approximation Potential (GAP) framework. We utilize a recently developed software workflow for fingerprinting and visualizing defects in damage crystal structures to analyze the damaged Mo samples by computing the formation of point defects during and after a collision cascade. As a benchmark, we report results for the total number of Frenkel pairs (a self-interstitial atom and a single vacancy) formed and atom displacement as a function of the PKA energy. A comparison to results obtained by using an Embedded Atom Method (EAM) potential is presented to discuss the advantages and limits of the machine learned MD simulations. The formation of Frenkel pairs follows a sublinear scaling law related to the PKA energy with to the GAP MD results and for the EAM simulations. Although the average number total defects is similar for both methods, we notice that MD potentials model different atomic geometries for the complex point defects, where the formation of crowdions is more favorable for the GAP potential. Finally, ion beam mixing results for GAP MD simulations are reported and discussed.
Keywords : Molybdenum, MD simulations, descriptor vectors, machine learning, material damage analysis, Gaussian Approximation potentials
1 Introduction
The design of next generation of fusion machines needs experimental exploration of different plasma facing materials (PFM) candidates and the support and validation of numerical modeling [1, 2]. Molybdenum has been selected as a candidate for a PFM due its high melting points, good resistance to deformation, and low sputtering yield under plasma irradiation [3]. Mo is used for diagnostic mirrors in fusion machines to deal with the harsh plasma environment and fluxes of neutrals and neutron radiation [1, 4]. In order to guide PFM experiments and to understand the mechanism of the interaction of plasma with materials, atomistic simulations based on the molecular dynamics (MD) method can be performed [5, 6, 7]. Serving, at the same time, to save laboratories and financial resources for carrying out the PFM experiments.
Several transition metals and alloys are traditionally modeled by the embedded atom method (EAM) potentials in MD simulations [8, 5, 9, 10], reproducing many material properties in good agreement with those measured experimentally. However, EAM and other traditional potentials are limited to fixed functional forms [8, 1] and can wrongly model some point defects that are energetically unstable, or lack physical meaning in material damaging processes [11]. For this reason, interatomic potentials computed by using machine learning (ML) methods are now increasingly used to perform MD simulations with an accuracy close to Density Functional Theory [12, 13, 14]. Being systematically improved towards the accuracy of the training data set. The goal of the present work is to numerically model the damage in crystalline Mo samples due to plasma irradiation by utilizing the recently developed ML interatomic potentials by Byggmästar et al. [15]. Thus, we perform MD simulations to emulate neutron bombardment at intermediate primary knock-on atom energies providing an understanding about the modeling of the re-crystallization process after the collision cascade, which has been an issue for numerical simulations based on fixed functional forms [11, 12].
Our paper is organized as follows: in Sec. 2 we briefly discuss the theory to develop the machine learned (ML) potential [15] for Mo, and the software workflow for fingerprinting and visualizing defects in damaged crystal structures (FaVAD) [16, 17] that is applied to quantify and classify the damage in Mo samples [18]. Our results for the total number of points defects, Frenkel pairs and atomic displacement are presented in Sec. 3. We examine the limitations and advantages of our new ML interatomic potential by comparing to MD simulations results obtained by EAM potentials. Finally, in section 4, we provide concluding remarks.
2 Methods
Interatomic potentials based on machine learning (ML) methods are not restricted to an analytical form and can be systematically improved towards the accuracy of the training data set. In order to model collision cascades, the ML potential must be able to treat realistic short-range dynamics defined by its repulsive part. In addition, the correct structure of the liquid phase and re-crystallization process should be well described, to accurately emulate atomic mixing together with defect creation and annihilation during the collision cascade. In this work, we use the ML interatomic potential for Molybdenum that was recently developed [15] within the Gaussian Approximation Potential (GAP) framework [13, 19]. Here, the total energy of a system of atoms is expressed as
| (1) |
where is a purely repulsive screened Coulomb potential, and is the machine learning contribution. is constructed using a two-body and the many-body Smooth Overlap of Atomic Positions (SOAP) descriptor [13]. is the number of descriptor environments for the -atom system (i.e. number of pairs for the two-body descriptor and number of atoms for the many-body descriptor). The ML part of the potential is given by
| (2) | |||||
where are prefactors that set the energy ranges of the ML predictions; is the kernel function representing the similarity between the atomic environment of the -th and -th atoms; is a coefficient obtained from the fitting process; and is the normalized descriptor vector of the local atomic environment of the -th atom (See Sec 2.3). In the computation of the ML potential the descriptors for two bodies, 2b, is utilized to take into account most of the interatomic bond energies, while the many-body, mb, contributions are treated by the SOAP descriptor. More details about the computation of the ML potentials for Mo can be found in Ref. [15].
2.1 MD simulations
Machine learning based MD simulations are performed to model neutron bombardment processes at different PKA energy values to analyze damage in crystalline materials. We compare results to those obtained by the Embedded Atom Method (EAM) [10] by considering similar numerical parameters to explore the advantages and limitations of the new GAP interatomic potential. For this, we first define a simulation box as a pristine Mo crystalline sample based on a body-centered-cubic (bcc) unit cell with a lattice constant of Å according to DFT calculations for computing the GAP potentials and those reported in the literature [20]. This value is slightly higher than the experimental measurement [21]. Then, the numerical sample is prepared by a process of energy optimization and thermalization to 300 K using the Langevin thermostat, with the time constant of 100 fs. [22]. The room temperature is used in our work to perform numerical simulations as close as possible to the experiments of material damaging [1]. The MD simulation is started by assigning a kinetic energy to a Mo atom located at the center of the numerical sample in a range of 0.5-10 keV of PKA. For each PKA energy value, the projectile travels on ten different crystal orientation: , , , and 7 cases for , where are random numbers uniformly distributed in an interval of . The Velocity Verlet integration algorithm is utilized to model the collision cascade, which is performed for 6 ps, followed by an additional relaxation time of 4 ps. Electronic stopping, Se correction is included in our MD simulations due to the high PKA energy range considered in this work. The electronic stopping powers [23] were obtained from SRIM-2013 [24] using the default values for material properties.
The MD simulations were done in the High Performance Computing Center of the Max Planck Institute and the institutional cluster of the Stony Brook University by using the Large-scale Atomic/Molecular Massively Parallel Simulator (LAMMPS) [25] with the Quantum mechanics and Interatomic Potential package (QUIP) [26] that is used as an interface to implement machine learned interatomic potentials based on GAP [13]. We also perform MD simulations by using an embedded-atom method potential [9, 10]. This MD potential is denoted as EAM in this work and has previously been applied to study the sputtering of single-crystalline Mo surfaces by Mon () projectiles in the total energy range of 0.125-4 keV.
In order to ensure accurate time integration in the high-energy collision dynamics. We use an adaptive timestep that is implemented in LAMMPS with a maximum () of 4 fs. to assure that the maximum displacement of the Mo atoms per step is less than 0.01 Å. In Tab. 1, we report the numerical parameters for performing the MD simulations, and the time step used in the simulations as a function of the PKA.
-
PKA (keV) Num. atoms Box size (nm) 0.5-2 25 392 (7.24, 7.24, 7.55) 5 55 800 (9.51, 9.51, 9.82) 10 104 044 (11.72, 11.72, 12.04)
2.2 Identification of point defects and vacancies
The damage in the Mo sample is analyzed by a software workflow for fingerprinting and visualizing defects in damaged crystal structures (FaVAD) [16, 17], where the local atomic environment of the -th atom of the material sample is described by a descriptor vector (DV), . Here, the atom density around the -th atom is expressed by a sum of a truncated Gaussian density functions with the difference vector between the atoms and , entering the exponent [19],
| (3) | |||||
| (4) |
which is then approximated in terms of spherical harmonic functions, , and a set of basis functions in radial directions as [19, 18]. The sum over the order of the squared modulus of the coefficients is invariant under rotations around the central atom [27]. It is given by
| (5) |
where denotes the complex conjugate of . Here each component of the vector corresponds to one of the index triplets . The normalized DV is used throughout this work and calculated within the multi-body descriptor framework called ’Smooth Overlap of Atomic Positions’ (SOAP), which implements Eqs. 3 to 5 with the Gaussian Approximation potential (GAP) [13].
Once the DVs of all the atoms of the damaged material are computed, we calculate the distance between the two corresponding DVs, to the atomic local environment of a defect free and thermalized material sample [18, 16] as follows
| (6) |
where is the mean DV of the defect free sample; and is the associated co-variance matrix of the DV components [28, 18]. This calculation allows us to identify atoms outside of lattice positions that are then classified as point defects. The identification of vacancies is done by defining a numerical sampling grid of points with being the number of equispaced points in the , and directions, respectively [18]. Followed by a computation of the nearest neighbor distance between the position of the damaged sample atoms and the sampling grid points. Points where the distance to the nearest atom exceeds a given threshold describes the spatial volume of the identified vacancy [16, 17].
3 Results and Discussion
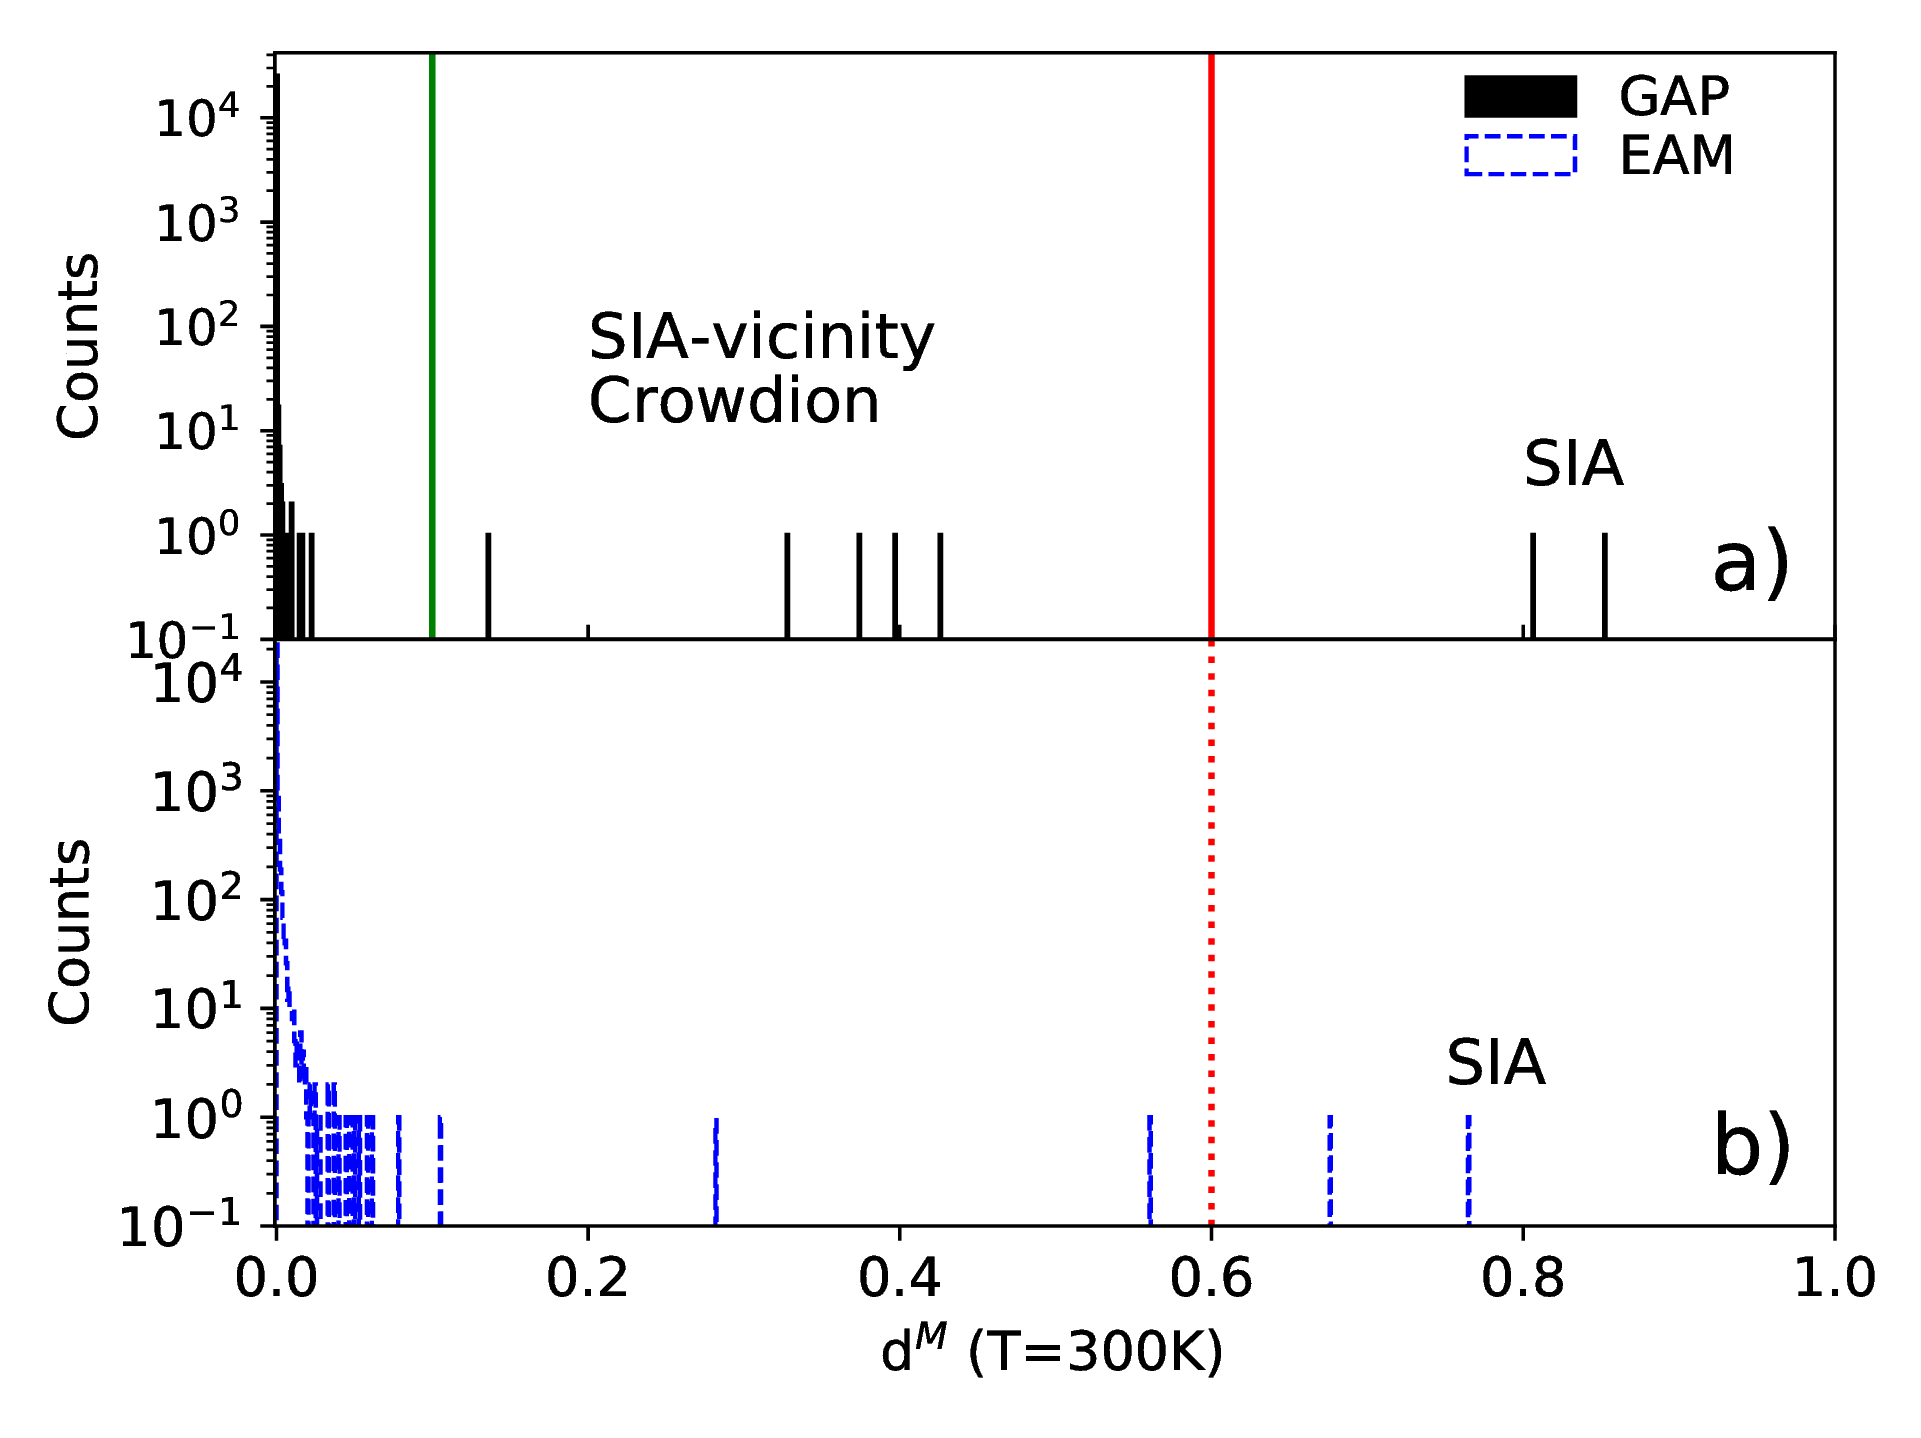
In order to analyze the damage in the Mo sample. We first perform a single MD simulation at 500 eV on the velocity direction, with the GAP and EAM potentials for 10 ps of simulations time. The final frame of the simulation contains the information of the point defects formed at the lowest PKA energy value of our study. Then, we analyze the damaged Mo sample by computing the DVs of all the Mo atoms with FaVAD, followed by the comparison to a defect free sample that is thermalized to 300 K.
In Fig. 1 we present results for the distance difference, , between the DVs of the damaged Mo materials and the set of reference DVs obtained by using FaVAD. The MD simulation performed with GAP presents two Mo atoms with the largest distance difference, that allows us to set a threshold at 0.6 for further analyzes. A Mo atom with distance difference bigger than a value of 0.6 is quantified as a self-interstitial atom (SIA) for all the MD simulations. We also identify Mo atoms in the vicinity of the SIA with a distance difference in the range of 0.1 to 0.6. Although these atoms are not quantified as SIA, they provide information about the atomic arrangement of more complex point defects like a crowdion in this case, where four atoms share three lattice sites. For the EAM case, two Mo atoms are also identified as potential SIA by FaVAD. However, the atomic geometry of this point defects is associated to a dumbbell defect where two atoms share a lattice site, observed in the Fig. 1b) where only a couple of Mo atoms have a distance difference in the range of 0.2 to 0.6. The GAP and EAM MD simulations report the same number of SIA, but the atomic geometry of the modeled defects is different. Besides that, the re-crystallization of the Mo sample is well modeled by the GAP potentials, where the majority of the Mo atoms have an atomic local environment similar to the the defect free and thermalized Mo sample, which is noted in the upper panel of the same figure.
3.1 Crystal defects formation as a function of the simulation time
The interatomic MD potentials need to be capable to model the formation of point defects at different PKA energies assigned to the projectile. More complex defects can be found for high PKA energy values. For this reason, we increase the features of FaVAD to compute the DVs of all the atoms of the sample at different time steps of MD simulations. Point defects can be identified by comparing their DVs to those for the defect-free sample thermalized to 300 K. In order to show this new feature, we perform MD simulations at PKA energies of 10 keV and 1 keV on the velocity direction. The information of the damage of the material is obtained as an output data from the MD simulation at a time step of 0.1 ps for 1-3 ps, where the collision cascade mechanisms mainly happen [29]; a 0.5 ps for 3-6 ps; and a final 1.0 ps for relaxing the damaged sample.
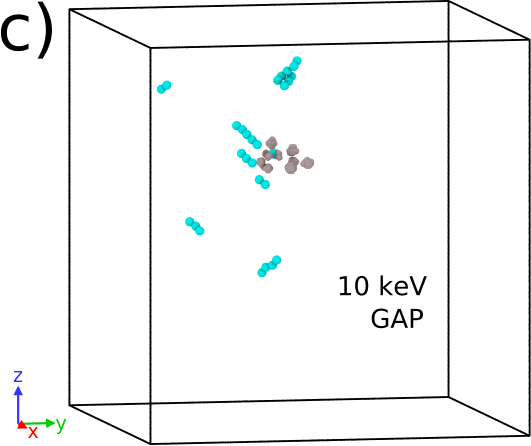
In Fig. 2a), we present results for the quantification of point defects formed as a function of the simulation time at 1 (empty symbols) and 10 (solid symbols) keV of PKA with the GAP and EAM potentials. FaVAD is applied to identify and quantify the point defects with a distance difference threshold of for all cases, where is observed that Mo atoms have the highest probability to be considered as actual defects [11]. Although the profiles presented by the MD simulations at 10 keV are similar, the maximum number of displaced atoms is located at 0.8 and 1.1 ps for the GAP and EAM respectively. At the end of the MD simulations, a total of 42 displaced atoms are reported for the GAP modeling and 35 Mo atoms are identified as defects by utilizing the EAM potential. The geometry of the identified point defects for the GAP MD simulations are shown in Fig. 2c), where SIA and crowdions are presented by green spheres and vacancies are depicted as gray spheres. The machine learning based MD potential produces a majority of crowdion defects rather than dumbbells, as will be discussed later. At a PKA of 1 keV, the dynamics presented by the displacement atoms is notable different at 1-7 ps where the re-crystallization of the material sample is carried out. Being well modelled by the GAP framework (Fig. 2a). However, both MD potentials report the same number of three stable point defects at the end of the MD simulation.
In Fig. 2a), three phases of a collision cascade are identified for cascades at a PKA energy of 10 keV by computing the average velocity, , of the total identified displaced atoms, , as a function of the simulation time as
| (7) |
where and are the instantaneous velocities of the -th displaced atom taken from the output data of the MD simulations. By considering the longitudinal velocity of sound in Mo that varies from 5.4 to 6.25 km/s at a temperature of 300 K [30], we can define a supersonic collision cascade phase where . Thus, at the beginning of the MD simulation (0.1-0.4 ps) the average velocity of the displaced atoms is 1.5 to 3 times bigger than , which is a similar phase range reported for iron samples [31] and Fe-Ni alloys [29]. In this supersonic phase, highly energetic atoms start colliding and transferring kinetic energy to their nearest neighbor atoms. At this lapse of time, atoms with supersonic velocities creates stable point defects in the sample, then some of them can be identified as Frenkel pairs, for example. More Mo atoms are displaced from their lattice position and the starting kinetic energy of the projectile is distributed among more Mo atoms, followed by loss of kinetic energy by the Mo atoms that were already displaced. This process lead the Mo sample to the Sonic phase in the time lapse of 0.4 to 1.1 ps. The sonic wave does not create stable point defects, leading to a liquid phase inside the Mo sample which is well modeled by the GAP potential due to the inclusion of liquid samples at different pressures in the training data [15]. For collisions at 10 keV, we noticed that the number of displaced atoms at the limit between the supersonic and sonic phases is proportional to the total number of SIA at the end of the simulation time, as expected and reported in the literature for damage in materials [29]. The last phase of the collision simulation is called the thermalization phase and defined when the average velocity of the displaced atoms is . In this phase the material sample is re-crystallized and cools down to its initial room temperature.
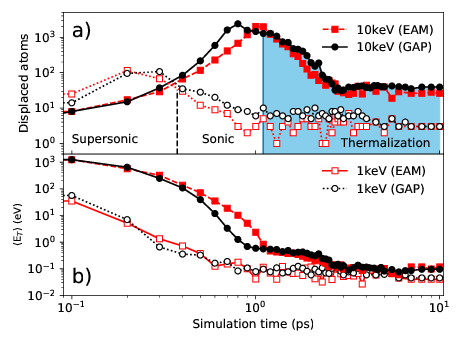
In Fig. 2b) we report results for the average kinetic energy (KE) of displaced Mo atom as a function of the simulation time for PKA energy values of 1 and 10 keV with the GAP and EAM potentials. The KE of the -th displaced Mo atom is calculated as with as the Mo mass. Followed by the computation of the average KE of all the displaced Mo atoms as . We notice that at the beginning of the MD simulation the projectile transfers its kinetic energy to its nearest neighbor atoms which starts the supersonic shock-wave. After 1.1 ps of simulation time, the average kinetic energy is almost constant, which represents the thermalization process of the sample for all the MD simulations at both PKA energy values. However, EAM and GAP model the expansion of the sonic wave and the energy landscape of defects differently, which leads to the formation of different atomic geometry for the identified SIAs and Mo atoms in their vicinity at the end of the MD simulation. The formation of dumbbell SIA defects is more favorable in the MD simulations with the EAM potential.
3.2 Classification and quantification of crystal defects as a function of the PKA energy
We perform MD simulations in a PKA energy range of 0.5 to 10 keV for several velocity directions with the GAP and EAM potentials. The comparison of the modeling of the formation of point defects after collision cascade modeled by these potentials provide an insight of the advantages and limits of the GAP MD potentials over traditional ones (EAM potentials). In Fig. 3 and 4 we present the average number of point defects, , and its standard deviation, as a function of the PKA, , which are calculated as:
| (8) |
with as the number of defects for a given velocity direction, , and as the total number of MD simulations performed. The defects are identified by FaVAD as a function of the PKA energy.
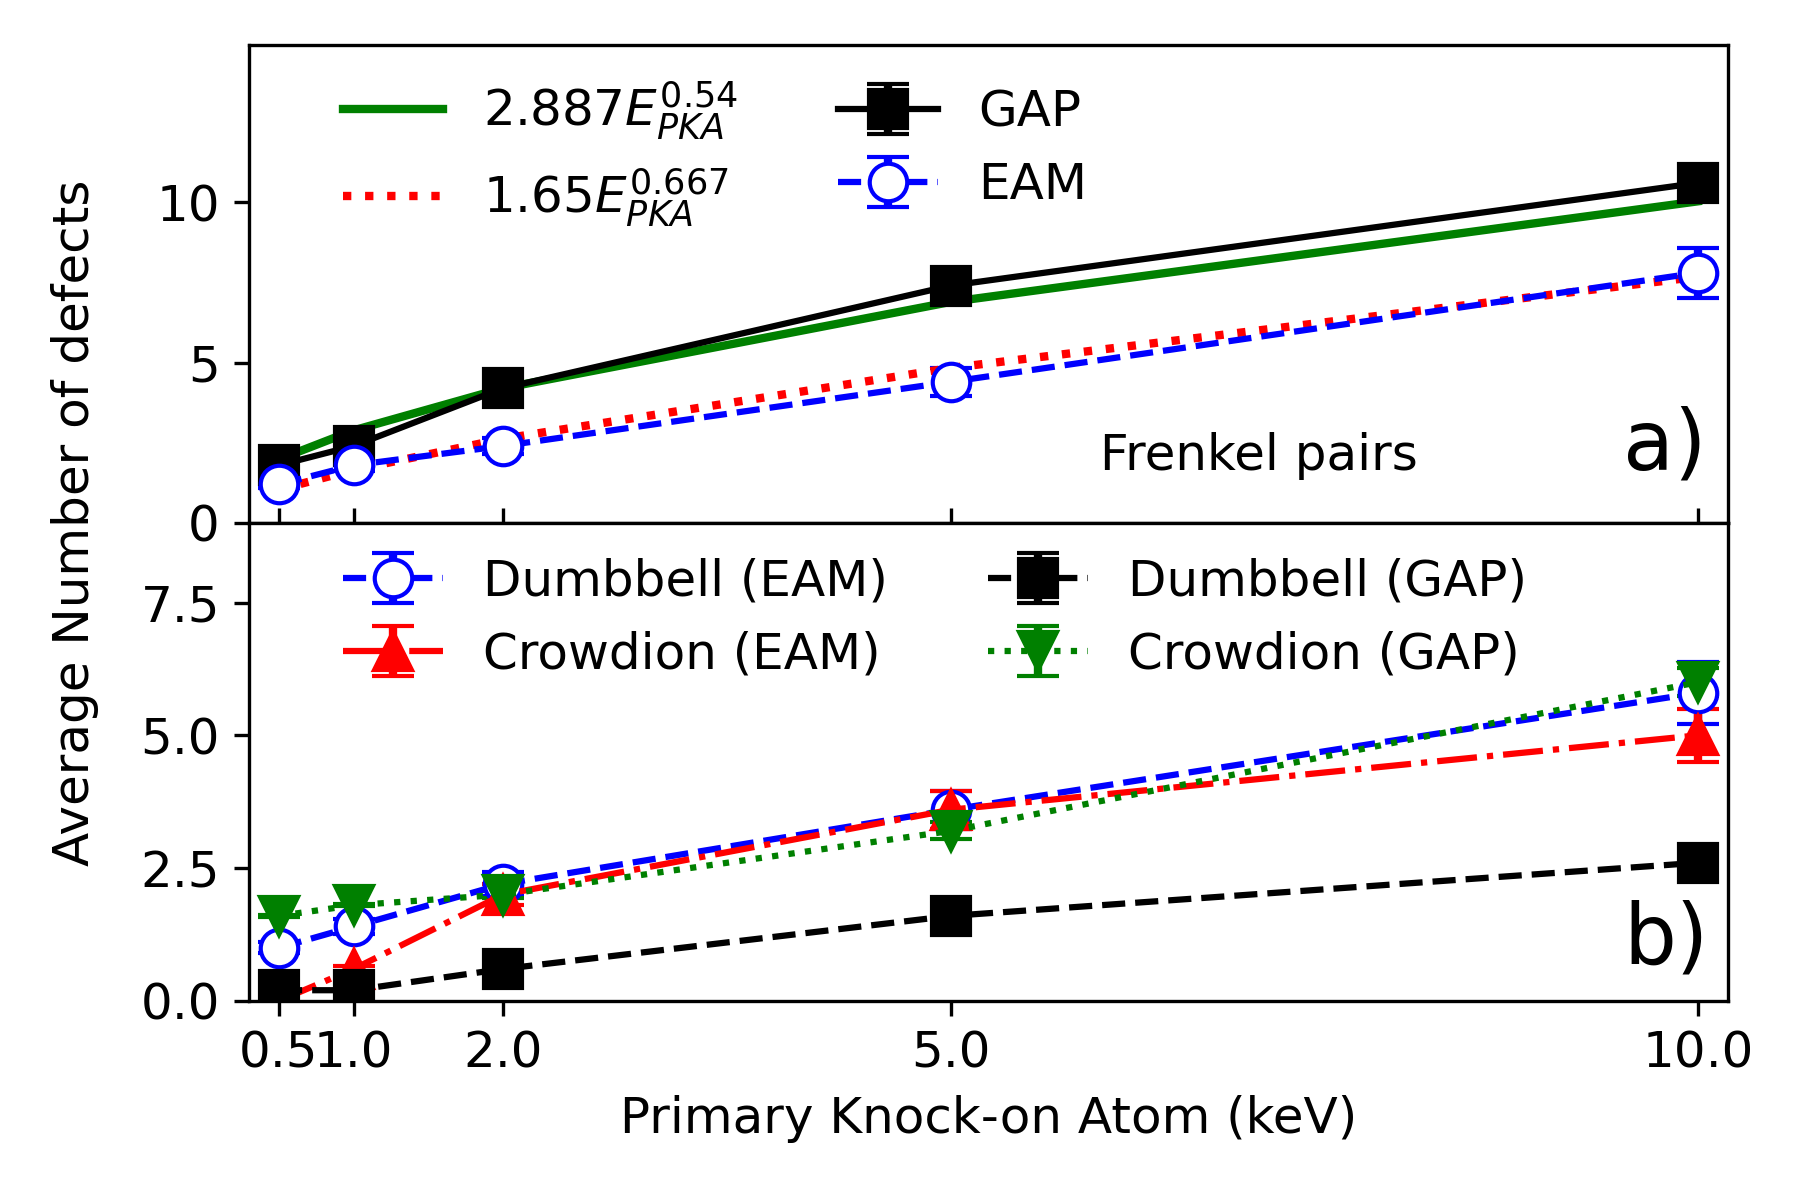
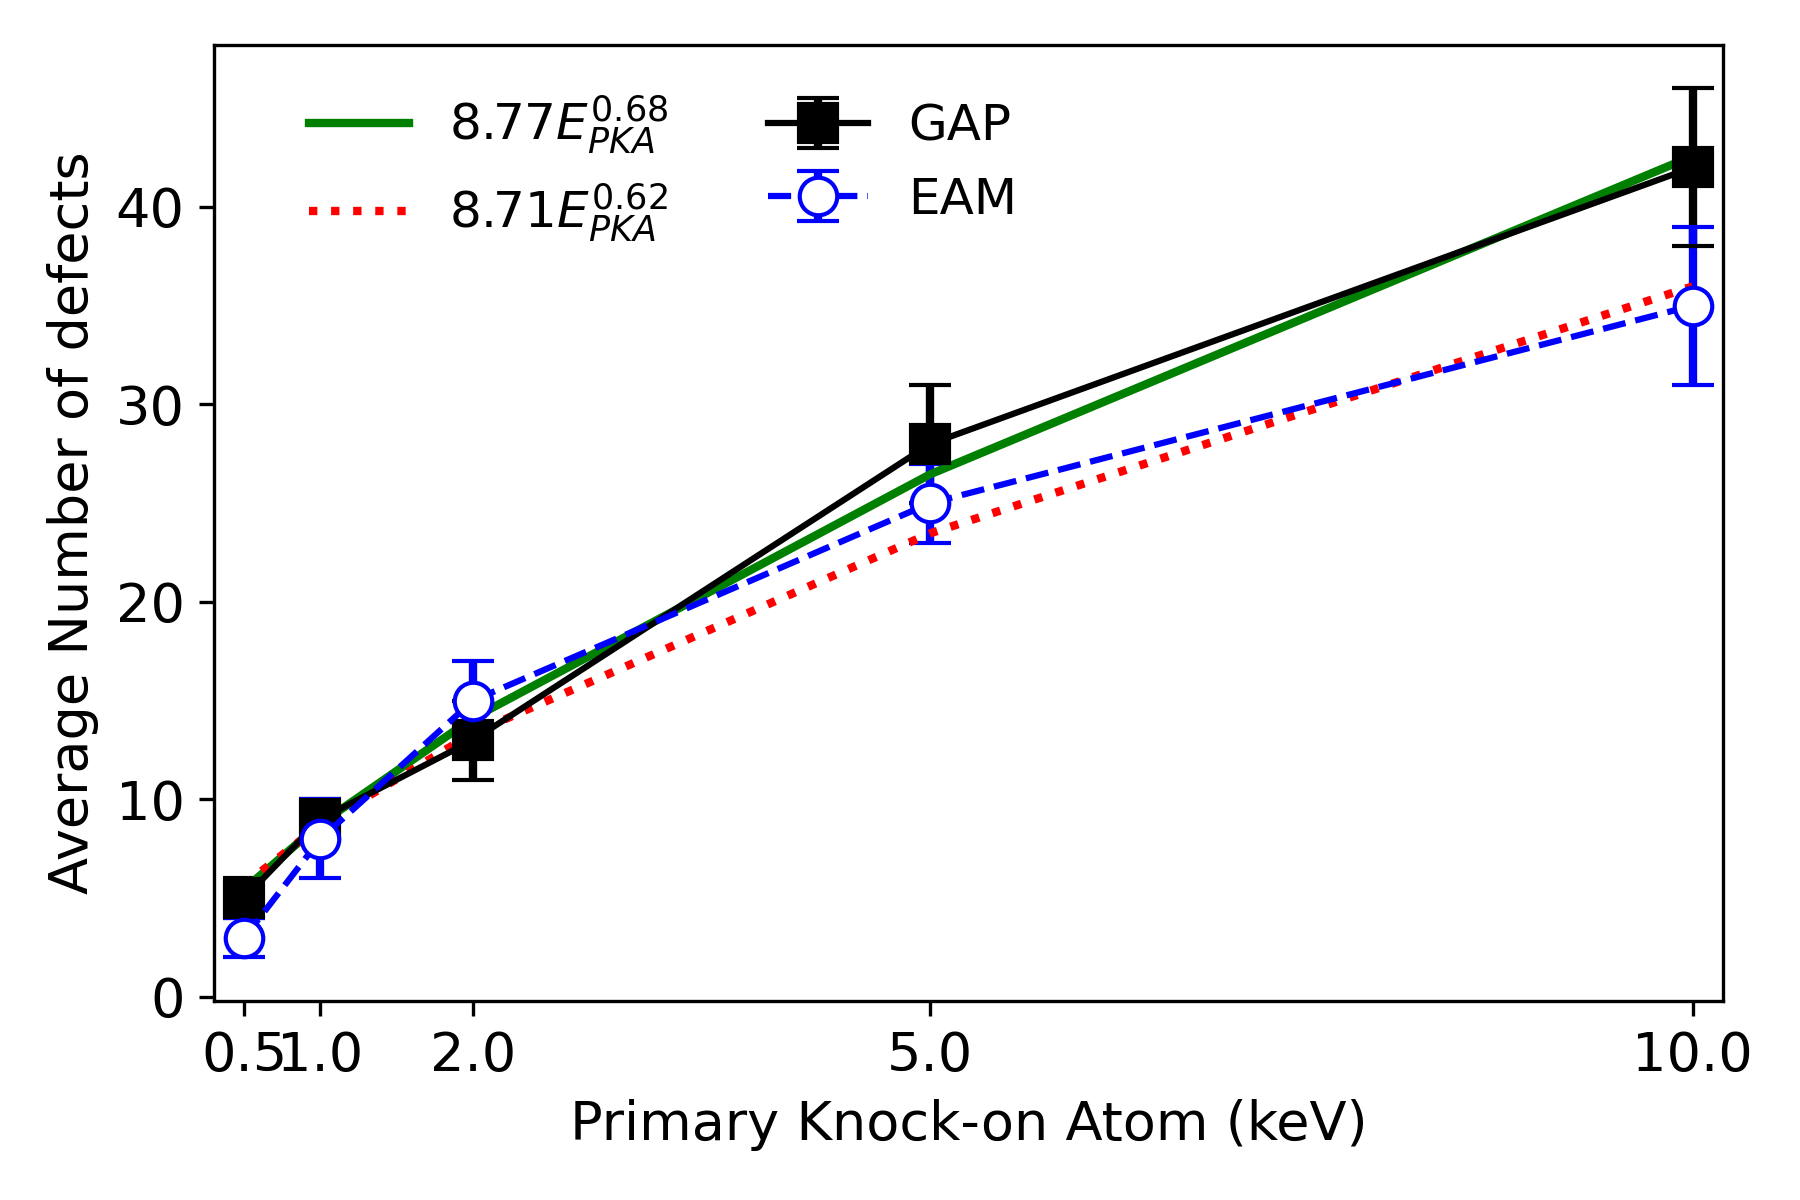
Fig. 3a) shows the average number of Frenkel pairs as a function of the PKA energy, modeled by the GAP and EAM potentials. This value is related to the average number of single vacancies found in the damage Mo sample. FaVAD has to identify the formation of a stable SIA and a vacancy to quantify this kind of defect. Usually Mo atoms with a are identified by FaVAD as SIA and quantified by using Eq. 8, and Mo atoms in their vicinity indicate the formation of a crowdion or dumbbell defects. The average number of Frenkel pairs can be fitted to a scaling law proposed by Setyawan et al. [32] that quantifies the number of point defects formed in damaged samples as: , where is the PKA energy value, and and are fitting parameters. In our case, a good approximation to our GAP data is found by applying the damped least-square method with fitting parameters and , where the associated correlation factor is . We also fit the EAM results with and and a correlation factor of .
-
GAP potential PKA (keV) Defect 0.5 1 2 5 10 Frenkel Pairs Crowdion Dumbbell 0 0 1 1 2 1 3 2 SIA Vicinity 0 0 2 1 10 1 11 2 Total AT-EAM-FS potential PKA (keV) Defect 0.5 1 2 5 10 Frenkel Pairs Crowdion 0 Dumbbell SIA Vicinity 4 1 5 1 Total
In Fig. 3b) we show results for the average number of dumbbells and crowdions as a function of the PKA energy. Here, the number of crowdions are quantified by identifying four Mo atoms sharing three lattice positions, while dumbbells are detected when two Mo atoms share one lattice position by FaVAD [11], with a . We notice that the formation of crowdions is more favorable for collision cascades simulated by the GAP potential, while dumbbells are formed for all the PKA energy values with the EAM potential. This is not a surprise, since the EAM potential incorrectly predicts dumbbells to be lower in energy than crowdions or dumbbells [9]. The GAP describes the relative formation energies of all SIA defects in a good agreement with Density Functional Theory results [15], and correctly reproduces the dumbbell as the most stable SIA [33]. The dumbbell is a tilted SIA that easily migrates along the chain of atoms in a zigzag-like motion [33], fluctuating between dumbbell and crowdion configurations, both of which FaVaD detects and identifies.
In Table 2, we present the number of crystal defects as a function of the PKA energy for GAP and EAM MD simulations, as a reference. Frenkel pairs (SIA + single vacancy) are counted for Mo atoms with maximum DV distance difference. Single vacancies are quantified and identified by the KD-tree algorithm included in FaVAD. Identified crowdions and dumbbells are also tabulated. The total number of defects is calculated as: Frenkel Pairs+ 3 Crowdion + Dumbbell + SIA vicinity and are shown in Fig. 4. There is a fair agreement between GAP and EAM MD results at PKA energies lower than 5 keV. However, for high impact energy values, the discrepancy between the obtained results is due to the formation of crowdions which is more favorable for the GAP potentials (10 keV). A fitting curve is included to the total number of defects as: with and for GAP and and for EAM, resulting in a correlation factor of for both MD potentials.
3.3 Ion beam mixing
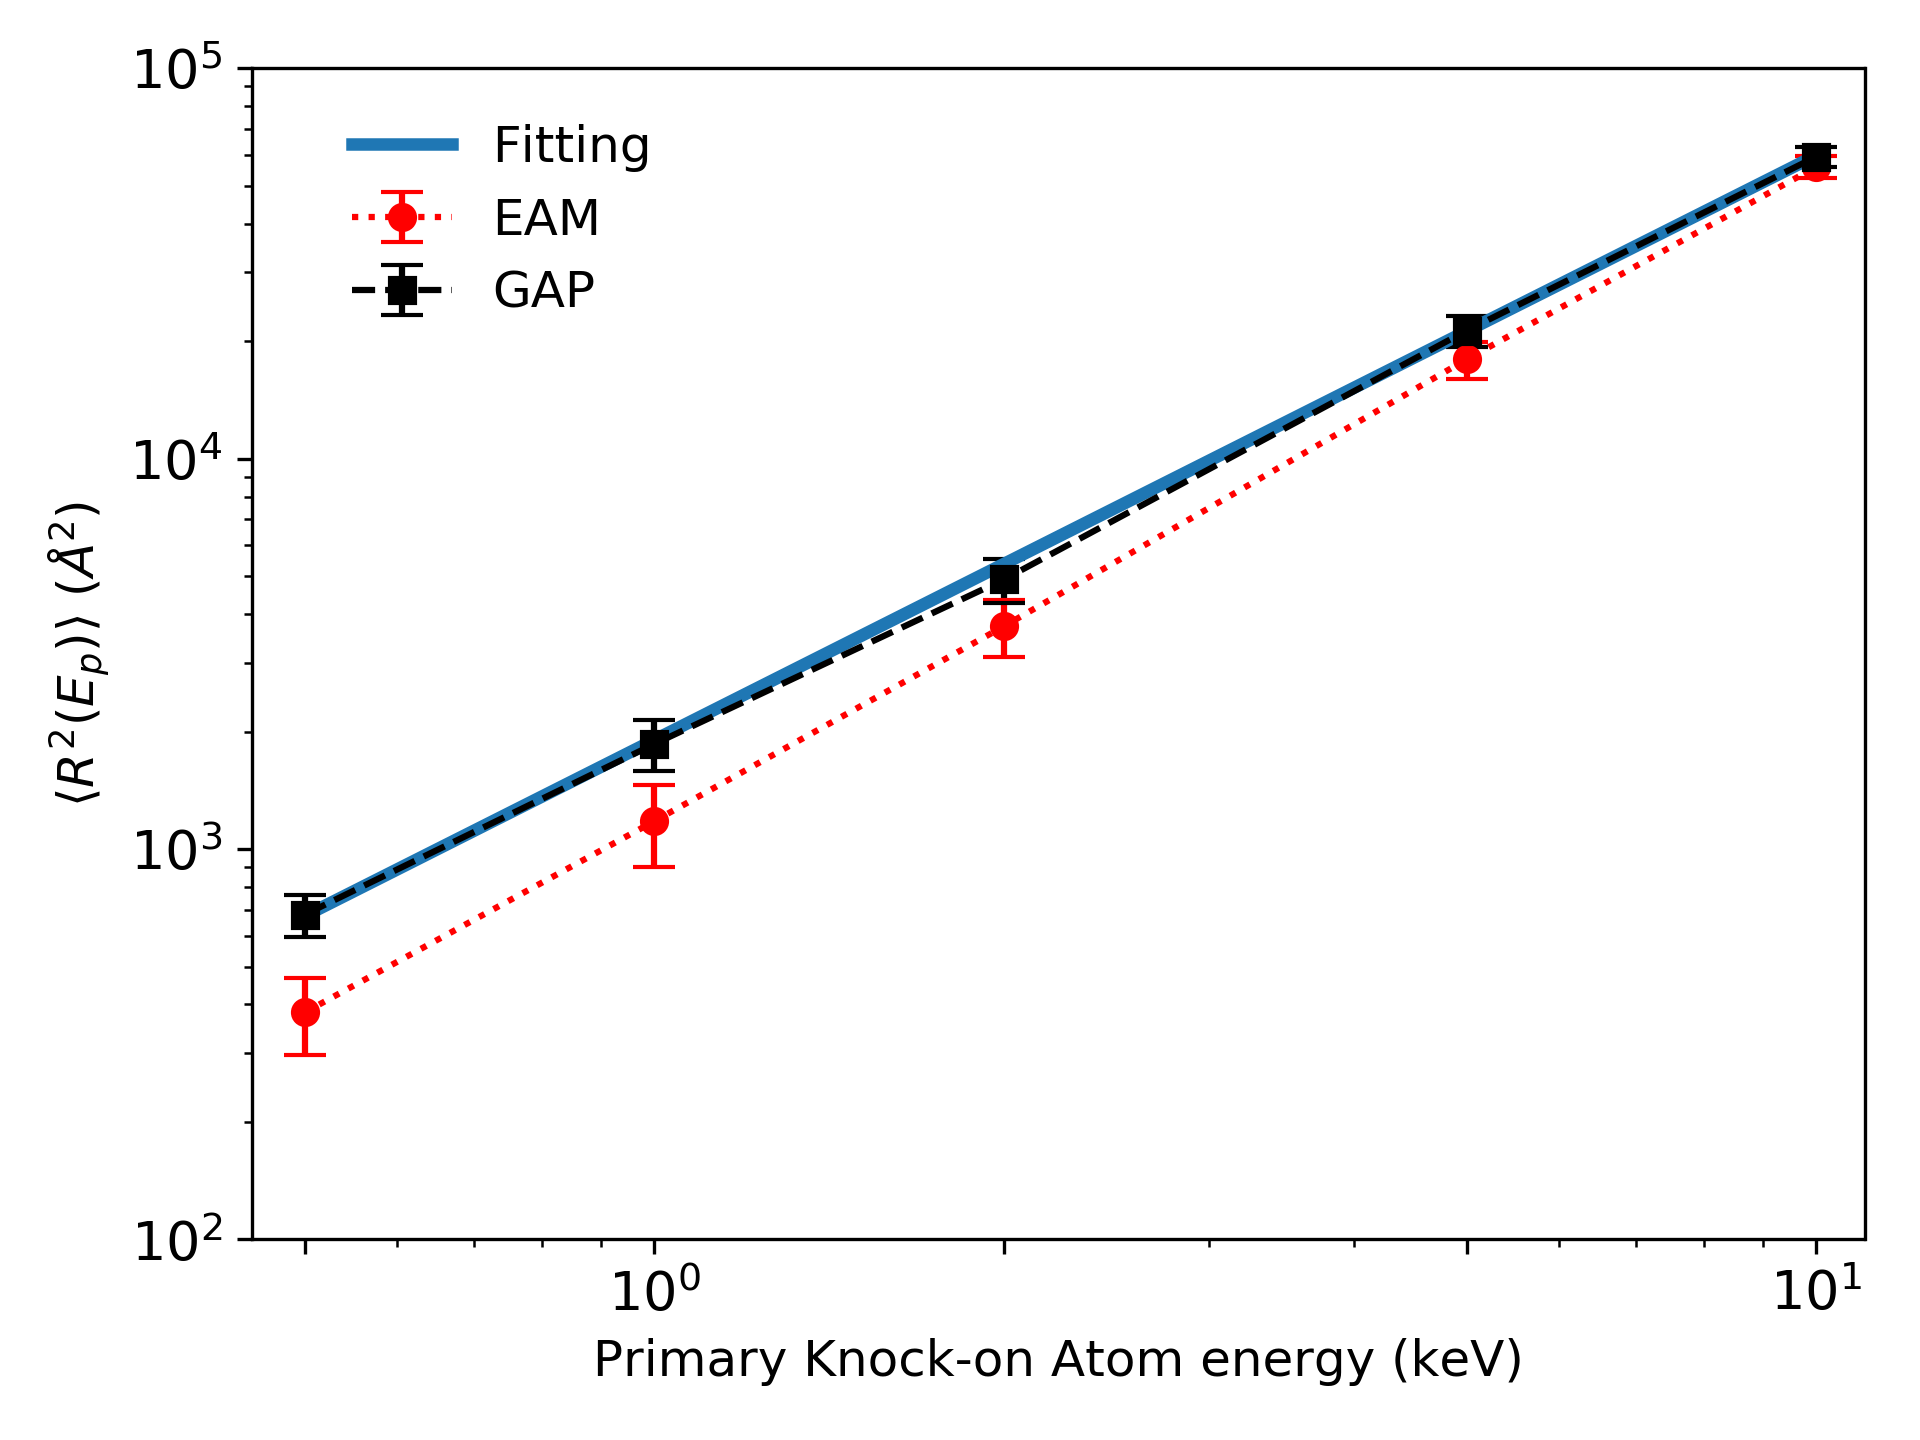
The damage in the Mo samples is also analyzed by computing the square of the total atom displacement, , at the end of the collision cascade. This difference between the positions of the atoms at the end and the beginning of a cascade provides information about the formation of defects and the modeling of material re-crystallization. From the output data of the MD simulations, we can compute the atom displacement, , as [34], where the index runs for all the Mo atom in the samples; and and are the positions of each atom in the Mo sample at the final and first steps of the MD simulation, respectively. We verified that the center of mass of the cell is not displaced at the end of the MD simulations. In Fig. 5 we report the average of the results, as a function of the PKA energy. A fitting curve is approximated to our data points for the GAP MD simulations to possibly extrapolate values to higher impact energies [35]. Since the PKA energy range considered in this work is 10 keV, the mixing is considered as a pure heat spike process. Letting to the GAP MD results be fitted to a simple power law as with as a fitting parameter with a correlation factor of 0.99. This analysis shows that more atoms are displaced as a function of the PKA, creating more vacancies and point defects in the damaged material as expected.
We compute the mixing parameter from the MD simulation data by using the following expression [36]
| (9) |
where with Å as the lattice constant of Mo, is the deposited nuclear energy. Obtained results are presented in Tab. 3. Allowing us to compare our MD calculations to experimental measurements of mixing efficiency defined as following the atomistic definition of the diffusion coefficient [35]. However, the quantitative comparison is not straightforward due to the irradiations are performed by using Kr ion with a mass of 83.79 amu and the computation of the experimental data is carried out by fitting Gaussian functions to the broadened marker layer shapes.
-
PKA (keV) Q (Å5/eV) 0.5 0.129 1.0 0.172 2.0 0.235 5 0.340 10 0.560
4 Concluding Remarks
In this paper, we performed classical and machine learning molecular dynamics simulations to emulate neutron bombardment on Molybdenum samples in an impact energy range of 0.5-10 keV, and a sample temperature of 300 K. For this, we use a new machine learning interatomic potential based on the Gaussian Approximation Potential (GAP) framework and results are compared to those obtained by using traditional Embedded Atom Method (EAM) potentials. Formation of Frenkel pairs and more complex defects like crowdions and dumbbells are identified and quantified by using the recently developed software workflow for fingerprinting and visualizing defects in damaged crystal structures (FaVAD). Here, the local environment of each atom of the sample is represented by a descriptor vector. The difference between a pristine Mo sample and a damaged one is computed by considering thermal motion when the MD simulation is performed.
Super sonic, sonic, and thermalization phases are identified by a FaVAD features that compute the average kinetic energy of the identified defected Mo atoms. The information of the liquid phase included in the fitting of the GAP potential leads to better modeling of the transition between super sonic and sonic phases, where complex defects start to form. The formation of crowdions is more favorable for the machine learning MD simulations. EAM and GAP results from collision cascades simulations can be fit to a scaling law, with as the PKA energy. Here for the GAP and for the EAM.
Machine learning interatomic potentials have been developed for more transitional metals like V, Nb, and Ta, where possible applications in damaged in material can be numerically modeled with high accuracy, which is part of our future work.
References
References
- [1] Rudakov D L, Boedo J A, Moyer R A, Litnovsky A, Philipps V, Wienhold P, Allen S L, Fenstermacher M E, Groth M, Lasnier C J, Boivin R L, Brooks N H, Leonard A W, West W P, Wong C P C, McLean A G, Stangeby P C, De Temmerman G, Wampler W R and Watkins J G 2006 Review of Scientific Instruments 77 10F126
- [2] Wirth B D, Hu X, Kohnert A and Xu D 2015 Journal of Materials Research 30 1440
- [3] Eren B, Marot L, Langer M, Steiner R, Wisse M, Mathys D and Meyer E 2011 Nuclear Fusion 51 103025
- [4] Litnovsky A, Wienhold P, Philipps V, Sergienko G et al. 2007 Journal of Nuclear Materials 363-365 1395 – 1402
- [5] Nordlund K, Zinkle S J, Sand A E, Granberg F, Averback R S, Stoller R, Suzudo T, Malerba L, Banhart F, Weber W J, Willaime F, Dudarev S and Simeone D 2018 Nature communications 9 1084
- [6] Nordlund K, Zinkle S J, Sand A E, Granberg F, Averback R S, Stoller R, Suzudo T, Malerba L, Banhart F, Weber W J, Willaime F, Dudarev S and Simeone D 2018 J. Nucl. Mater. 512 450–479
- [7] Bolt H, Barabash V, Federici G, Linke J, Loarte A, Roth J and Sato K 2002 Journal of Nuclear Materials 307-311 43 – 52
- [8] Daw M S and Baskes M I 1984 Phys. Rev. B 29(12) 6443–6453
- [9] Ackland G J and Thetford R 1987 Philosophical Magazine A 56 15–30
- [10] Salonen E, rvi T J, Nordlund K and Keinonen J 2003 Journal of Physics: Condensed Matter 15 5845–5855 URL https://doi.org/10.1088%2F0953-8984%2F15%2F34%2F314
- [11] Domínguez-Gutiérrez F, Byggmästar J, Nordlund K, Djurabekova F and von Toussaint U 2020 Nuclear Materials and Energy 22 100724
- [12] Byggmästar J, Hamedani A, Nordlund K and Djurabekova F 2019 Phys. Rev. B 100 144105
- [13] Bartók A P, Payne M C, Kondor R and Csányi G 2010 Phys. Rev. Lett. 104(13) 136403
- [14] Hamedani A, Byggmästar J, Djurabekova F, Alahyarizadeh G, Ghaderi R, Minuchehr A and Nordlund K 2020 Materials Research Letters 8 364–372
- [15] Byggmästar J, Nordlund K and Djurabekova F 2020 Gaussian approximation potentials for body-centered cubic transition metals (Preprint arXiv:2006.14365)
- [16] von Toussaint U, Dominguez-Gutierrez F J, Compostella M and Rampp M 2020 Favad: A software workflow for characterisation and visualizing of defects in crystalline structures (Preprint 2004.08184)
- [17] 2020 https://gitlab.mpcdf.mpg.de/NMPP/favad/-/tree/master/
- [18] Domínguez-Gutiérrez F and von Toussaint U 2019 Journal of Nuclear Materials 528 151833
- [19] Bartók A P, Kondor R and Csányi G 2013 Phys. Rev. B 87 184115
- [20] Park H, Fellinger M R, Lenosky T J, Tipton W W, Trinkle D R, Rudin S P, Woodward C, Wilkins J W and Hennig R G 2012 Phys. Rev. B 85(21) 214121
- [21] Pearson W B 1967 Handbook of Lattice Spacing and Structures of Metals (Pergamon, Oxford)
- [22] Domínguez-Gutiérrez F and Krstić P 2017 Journal of Nuclear Materials 492 56 – 61
- [23] Ziegler J F, Biersack J P and Littmark U 1985 The Stopping and Range of Ions in Matter (New York: Pergamon)
- [24] Ziegler J F SRIM-2013 software package, available online at http://www.srim.org.
- [25] Plimpton S 1995 Journal of Computational Physics 117 1 – 19
- [26] 2018 http://libatoms.github.io/QUIP/
- [27] Szlachta W J, Bartók A P and Csányi G 2014 Phys. Rev. B 90 104108
- [28] Mahalanobis P 1930 J. and Proc. Asiat. Soc. of Bengal 26 541
- [29] Béland L K, Osetsky Y N and Stoller R E 2016 Acta Materialia 116 136 – 142
- [30] Dickinson J M and Armstrong P E 1967 Journal of Applied Physics 38 602–606
- [31] Calder A, Bacon D, Barashev A and Osetsky Y 2010 Philosophical Magazine 90 863–884
- [32] Setyawan W, Nandipati G, Roche K J, Heinisch H L, Wirth B D and Kurtz R J 2015 Journal of Nuclear Materials 462 329 – 337
- [33] Ma P W and Dudarev S L 2019 Phys. Rev. Materials 3 043606
- [34] Nordlund K, Ghaly M and Averback R S 1998 Journal of Applied Physics 83 1238–1246
- [35] Björkas C and Nordlund K 2009 Nuclear Instruments and Methods in Physics Research Section B: Beam Interactions with Materials and Atoms 267 1830 – 1836
- [36] Nordlund K, Wei L, Zhong Y and Averback R S 1998 Phys. Rev. B 57(22) R13965–R13968