1042
\vgtccategoryApplication
\vgtcinsertpkg
\teaser
![[Uncaptioned image]](/html/2010.01959/assets/x1.png)
![[Uncaptioned image]](/html/2010.01959/assets/x2.png) Islands in Magnetic Reconnection. A sample output of a two-dimensional Particle-in-Cell simulation. Left panel visualizes the in-plane magnetic field and using line integral convolution (LIC), colored by the out-of-plane component with a standard hot-cold colormap. Right panel shows the results of contour-tree based segmentation on the y-component of magnetic vector potential, , derived from . Each segment is in a unique grey-toned color. In plasma physics, these segments are magnetic islands created by magnetic reconnection. The blue and yellow dots are, respectively, the maxima and minima of while the red dots are saddle points. Physicists refer to minima and maxima as ‘O’ points and saddles as ‘X’ points. The X points correspond to the locations where magnetic field topology changes, i.e. reconnection occurs. A comparison of these figures shows clearly that regions of concentric circles in the LIC visualization are analogous to the segments defined by the contour-tree algorithm. In contrast to LIC, the contour-tree analysis precisely locates the reconnection (X) points and shows the nested hierarchy of the segments.
Islands in Magnetic Reconnection. A sample output of a two-dimensional Particle-in-Cell simulation. Left panel visualizes the in-plane magnetic field and using line integral convolution (LIC), colored by the out-of-plane component with a standard hot-cold colormap. Right panel shows the results of contour-tree based segmentation on the y-component of magnetic vector potential, , derived from . Each segment is in a unique grey-toned color. In plasma physics, these segments are magnetic islands created by magnetic reconnection. The blue and yellow dots are, respectively, the maxima and minima of while the red dots are saddle points. Physicists refer to minima and maxima as ‘O’ points and saddles as ‘X’ points. The X points correspond to the locations where magnetic field topology changes, i.e. reconnection occurs. A comparison of these figures shows clearly that regions of concentric circles in the LIC visualization are analogous to the segments defined by the contour-tree algorithm. In contrast to LIC, the contour-tree analysis precisely locates the reconnection (X) points and shows the nested hierarchy of the segments.
Topological Analysis of Magnetic Reconnection in Kinetic Plasma Simulations
Abstract
Magnetic reconnection is a ubiquitous plasma process in which oppositely directed magnetic field lines break and rejoin, resulting in a change of the magnetic field topology. Reconnection generates magnetic islands: regions enclosed by magnetic field lines and separated by reconnection points. Proper identification of these features is important to understand particle acceleration and overall behavior of plasma. We present a contour-tree based visualization for robust and objective identification of islands and reconnection points in two-dimensional (2D) magnetic reconnection simulations. The application of this visualization to a simple simulation has revealed a physical phenomenon previously not reported, resulting in a more comprehensive understanding of magnetic reconnection.
Human-centered computingVisualizationVisualization techniquesTreemaps; \CCScatTwelveHuman-centered computingVisualizationVisualization design and evaluation methods
Introduction
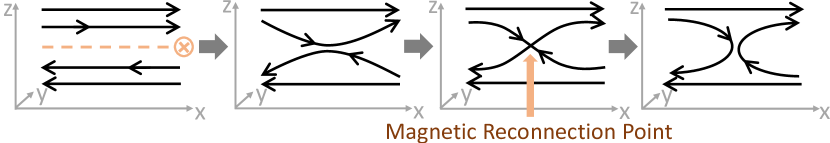
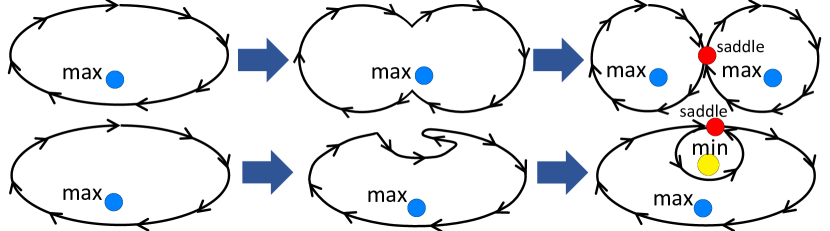
In plasma, magnetic reconnection events change the magnetic field topology [3, 27, 4]. During the process, oppositely directed magnetic field lines bend towards each other and touch at a reconnection point. These field lines then break, pair and rejoin, as shown in Figure 1. This generates closed regions called magnetic islands and releases energy from the magnetic field into the plasma. Understanding reconnection holds the key for understanding high-energy particles in different plasma environments, such as Earth’s magnetosphere [14], solar flares [9], and high-energy astrophysics [11].
Analysis of magnetic reconnection in three-dimensional (3D) space requires the use of vector field topology. However, when restricting the analysis to a plane and thereby ignoring all variations perpendicular to it, we have determined that it is possible to use scalar field topology to identify features of interest. Since the magnetic field is divergence-free ( = 0), it can be written as the curl of a magnetic vector potential where [15]. We assume that remains unchanged along the axis. Therefore, for a simulation in the plane, the topologically relevant quantity is:
Additionally, the gradient of in the plane is
It is obvious that in the plane, which means the gradient of is perpendicular to the curl of and, equivalently, the in-plane magnetic field . The gradient of is also perpendicular to the contours of at regular, i.e., not critical, points. Therefore, the field and the contours of are parallel in the plane, making them topologically equivalent. Given this, we can apply topological analysis to the scalar field in lieu of the vector field .
Particle-in-Cell (PiC) [22] is a commonly used simulation method for magnetic reconnection. PiC simulations combine a mesh structure with numerous particles seeded in each cell. The mesh represents the electric and magnetic fields in the plasma, while the computational macro particles represent the charged particles. Similar to Monte Carlo methods, the number of particles used affects the noise level in the final result. This noise can be significantly reduced by increasing the number of particles in each cell, but is never completely eliminated.
Despite the complexity of these simulations, until recently methods for analysis of magnetic reconnection simulations have been relatively simple. The traditional technique for reconnection visualization is a laborious process. It requires physicists to subjectively and iteratively parse through isovalues of the magnetic vector potential to find segments that are visually interesting. However, it is often true that the selected isovalues do not capture the segmentation entirely. Once segments are determined, corresponding critical points are approximated. There is no guarantee that this process identifies all islands or reconnection points.
More recently, Servidio et al. [31, 30] presented a more rigorous algorithm for the visualization of magnetic islands and reconnection points. This method, developed for the analysis of fluid based magnetohydrodynamic (MHD) simulations, calculates the gradient and Hessian matrix of the vector potential at each vertex. When the magnitude of the gradient is smaller than a user-defined threshold, the gradient is considered to be zero and the vertex is viewed as a critical point. Though this approach has produced sound results for MHD simulations, there are several problems that arise when applying it to PiC simulations. PiC simulations have a higher noise level compared to MHD simulations due to their stochastic nature. This noise produces inaccuracies when using the gradient-based algorithm. Haggerty et al. [21] discussed various techniques as a work-around to reduce the impact of noise to the results. Additionally, the user-defined threshold is an empirically-defined and subjective value with no physical correspondence to properties of the simulation. The implementation, developed at the University of Delaware, is proprietary and not easily obtainable. This has limited the usability of the algorithm, even within the physics community.
We use a contour-tree based segmentation algorithm for the objective identification of magnetic islands and reconnection points. Contour trees [8] are widely used for data segmentation [28, 24]. We use the open-source Topology Toolkit (TTK) [34, 16] for contour tree generation; it can easily be integrated into physicists’ workflows. Our approach differs from other approaches due to the one-to-one correspondence between the mathematical definition of magnetic reconnection and 2D scalar field topology. The advantages of this technique for PiC simulations are demonstrated by applying the technique to an ensemble of 1000 evenly spaced, time-dependent data sets, produced as outputs from a single current sheet simulation. A major advantage of the contour-tree based algorithm is the use of persistence [13] to reduce the influence of noise on the segmentation. PiC noise is concentrated at short wavelengths in the field. In the process of converting the to using the spectrum solver, this high-frequency component is smoothed. The remaining noise in has a much lower amplitude compared to the dynamic range of ; small regions with tall peaks (high persistence) cannot exist as a contribution of noise. Those remaining “small bumps” can be removed by using a proper persistence value. The persistence of a segment correlates with the enclosed magnetic flux of that segment [36]. Scientists can select a value for minimum persistence as determined by the approximate noise level based on the simulation or the desired level of detail. This approach supports a physics-based, data-driven parameter selection for noise reduction.
Within the visualization community, the closest related work is that of Tricoche and Sanderson et al. [29, 35]. Both the related work and our research address the identification of critical points and separatrices. However, Tricoche and Sanderson analyze the intersection of the magnetic field to a Poincaré plot. This examines the dual of the magnetic field and not, as with the research presented, the magnetic field itself. Additionally, Tricoche and Sanderson employ ridgeline formation, the Jacobian and other subjective approximation methods to identify features. This is a vastly different approach from the topology-based contour tree framework presented and does not use a parameter such as persistence to limit the impact of noise.
The research presented is the result of a collaboration with physicists who are experts in reconnection; the described analysis tools are a result of an iterative software development process. Our contributions to the visual analysis of magnetic reconnection are:
-
•
The application of a 2D topological algorithm, i.e. a contour-tree based segmentation, to accurately and objectively identify magnetic islands and reconnection points
-
•
The use of persistence as a physics-based parameter to reduce the effects of noise in visualizations
-
•
The identification of a new island generation process, resulting in an improved understanding of kinetic plasma simulations
1 Simulation
Setup:
We ran the simulation using VPIC [6, 7]. This PiC code solves the relativistic Vlasov-Maxwell equations and describes kinetic plasma physics. It is widely used by plasma physicists to study magnetic reconnection [5, 37, 10, 17, 20, 19, 18, 25, 26, 32, 23]. We setup the simulation as follows: We perform the 2D simulation in the plane, with the electric current in the current sheet flowing into the direction (first diagram of Fig. 1). This out-of-plane direction is assumed to be invariant, i.e. all derivatives vanish identically. The current sheet is initially force-free with magnetic field strength and initial thickness of five , where is the electron inertial length that denotes the electron kinetic scale. The direction is periodic for fields and particles. The simulation domain is () and is well-resolved using cells, each with 400 electrons and 400 ions. To trigger reconnection, we add a long-wavelength perturbation in the center of the simulation domain. We save the magnetic field at regular intervals in time for further analysis. In post-processing, we use a spectral solver to convert the magnetic field into the magnetic vector potential . More details on VPIC are included in the supplementary material.
Periodic Boundaries:
Though magnetic and electric fields can theoretically extend to infinity, it is impossible to simulate on computers with finite resources. Physicists identify a rectangular, finite domain to simulate and achieve the effect of infinity by repeating the domain in a single or in both directions. This is reflected in the simulation’s uni-periodic (left/right or top/bottom periodic) or bi-periodic (left/right and top/bottom periodic) setup. Therefore, the contour-tree results must account for this periodicity. This is accomplished by topologically deforming the uni-periodic data into an annulus and the bi-periodic data into a torus. This occurs during the triangulation phase, where the vertex-based, uniform quadrilateral grid is connected into a triangular mesh for analysis. The data is first triangulated by connecting diagonal vertices of each quadrilateral. Then, for each pair of boundaries to be stitched, there are multiple pairs of triangles added to join the first and last layers of vertices.
Transforming a rectangle to an annulus or a torus converts the domain to a manifold where the saddle points are no longer fully defined by a contour tree. We determine using Euler’s characteristic [33] that for both uni- and bi-periodic data, there are exactly two saddle points missing from the contour tree results, regardless of the complexity of the data itself. These two saddle points are subsequently identified using discrete Morse geometry [2], and in Figure Topological Analysis of Magnetic Reconnection in Kinetic Plasma Simulations right, shown as the red dots at the top-left and bottom-right corners of the figure. These saddle points correspond to a topological change in the genus rather than define component connectivity. However, the segmentation, minima and maxima determined by the contour tree are assured to be accurate and complete.
2 Results
2.1 Objective Segmentation of Magnetic Islands
We segment the triangulated scalar values of using a standard contour tree pipeline in TTK. We first determine the minimum persistence threshold suitable for the noise given the simulation setup. Topological Simplification then simplifies the topology based on the restrictions of persistence. This minimizes the impact of PiC noise on the analysis results. The ftmTree filter then computes the contour-tree based segmentation given the remaining topology. From these results, we extract the segments and critical points. We also use ScalarFieldCriticalPoints to extract any remaining saddle points that exist as a result of a change in genus. Each vertex in the data is given a segment ID or designated as a critical point (with associated type: minimum, saddle or maximum). This topological analysis is independently computed for every output time step.
The segmentation of output number 510 of the simulation at a persistence of is shown as a rectangle in the right panel of Figure Topological Analysis of Magnetic Reconnection in Kinetic Plasma Simulations and as an annulus in Figure 2. The persistence of is a few times the amplitude of random fluctuations in the simulation, but only of the total change in at and therefore removes only the smallest of segments. In Figure 2, both the annulus and contour tree identify segments uniquely by a color and a segment ID. As in the right panel of Figure Topological Analysis of Magnetic Reconnection in Kinetic Plasma Simulations, the vertices of the contour tree graph are colored yellow for minima, red for saddle points and blue for maxima. Note that in the contour tree, there are 6 maxima, 6 saddle points and 2 minima. Euler’s characteristic gives us ; the characteristic for an annulus is , meaning that we were missing 2 saddles. This confirms the limitations of the contour tree algorithm on periodic data.
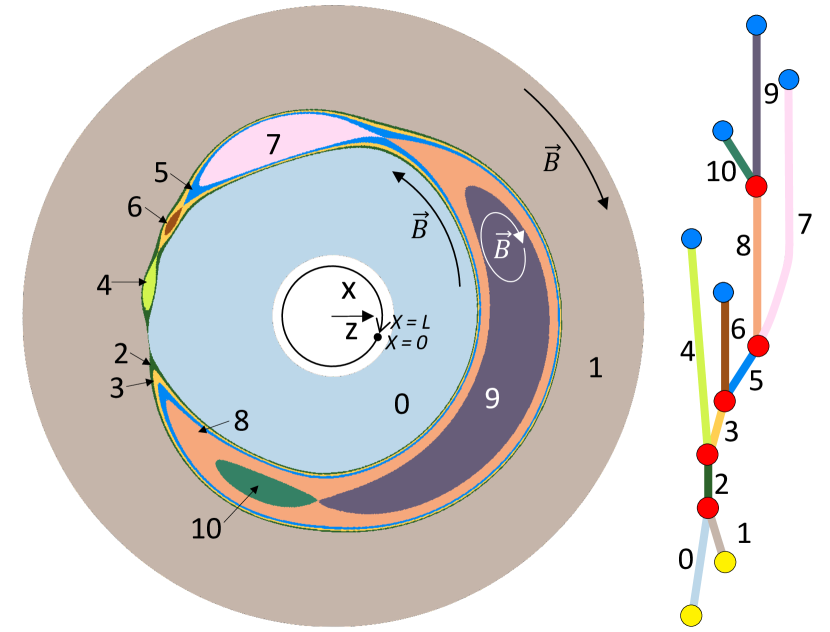
Figure 2 also shows the direction of the magnetic field in segments , and . The clockwise orientation illustrated in segment is representative of the orientation of all segments except for and . Segments and are topologically unique because while the other segments are homeomorphic to a disc, segments and are homeomorphic to an annulus. Therefore, segments and are not considered to be magnetic islands in plasma physics. It is clear from the segmentation and contour tree that an empirical study of this data at one or a few isovalues of would be insufficient to understand and characterize its complex hierarchy.
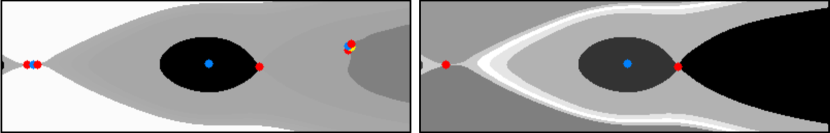
The importance of the persistence parameter is shown in Figure 3, with a magnified section of the results of output 510 at a persistence of as compared to the results at the scientifically more meaningful value of . The noise in the system, shown in the left panel of Figure 3 as clustered critical points at multiple locations, can lead to ambiguity when determining the location of reconnection points and generate superfluous segments in regions of interest. In total, the segmentation at persistence generates an additional segments, minima, saddle points and maxima.
2.2 Detecting Lakes on Mountains
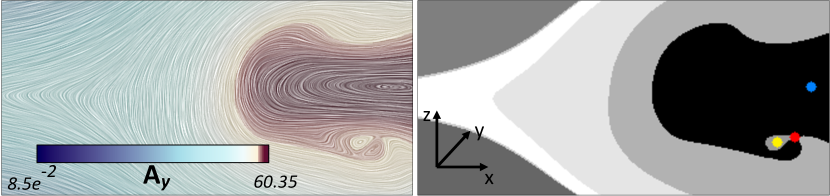
Typically, when new islands form, the plasma kinetic effects dissipate the magnetic field inside the current sheet, causing magnetic field lines to bend toward one another and reconnect. In this process, the magnetic field line in question connects in the middle, going from an “ellipse” to a “figure 8” and preserving the original orientation of the magnetic field line. This is shown in the top row of Figure 5. The results of this process are seen in Figure 2 where the direction of the field of segment aligns with segment on the outer border and aligns with segment on the inner border. This also applies to the other islands, meaning that they all have the same clockwise magnetic field orientation and contain local maxima. However, through the use of the contour tree segmentation algorithm, we have identified a different process for island generation that has not been reported previously. The generation of these unique segments signifies a new type of magnetic field behavior. We observe that plasma particles push the magnetic field lines into a concave depression, resulting in a new island formation where one island is inside another. This is contrary to the more common behavior in reconnection where the magnetic field drives particle motion. This new process of island formation is diagrammed in the bottom row of Figure 5. These new inner islands correspond to a counter-clockwise magnetic field orientation and contain local minima as critical points. A magnified region of output 693 of the simulation shown in the right panel of Figure 4 identifies this feature as the segment containing a yellow dot. On the left, we use a custom colormap to enhance the visibility of the region of interest in the LIC visualization. The concentric circles and colors of the LIC at this region on the left coincide with the segment identified on the right. This confirms that the island detected is valid and not an artifact of our method. If data was scaled in the third dimension by , this new segment would be akin to a lake on the side of a mountain.
This new process for island generation was first observed through the application of the contour-tree algorithm mainly due to the algorithm’s accuracy and robustness in identifying features. The segments with counter-clockwise magnetic field orientation tend to be very small compared to the overall domain, they occur infrequently in the midst of the simulation and appear only for a few time steps once formed. Therefore, it is highly likely that an empirical analysis of the data would have missed them. Such small segments might also have been misidentified as noise, if a parameter such as persistence wasn’t used to restrict the influence of noise to the segmentation.
This unexpected discovery has motivated us to reexamine aspects of magnetic reconnection simulations to better understand what process led to these results. We have hypothesized that these events may signal a reversal in the magnetic energy conversion, i.e., from the plasma kinetic energy back into magnetic energy. However a deeper examination of the simulation must be conducted before these theories can be confirmed.
The two processes for island generation described in this paper are very different topologically and pose the question of what else we may discover through the continued application of topological analysis for magnetic reconnection. It is clear that understanding magnetic reconnection in 2D is ultimately a study in the way magnetic field lines bend, intersect and interact with each other. This is, after all, the essence of the study of topology itself.
3 Evaluation
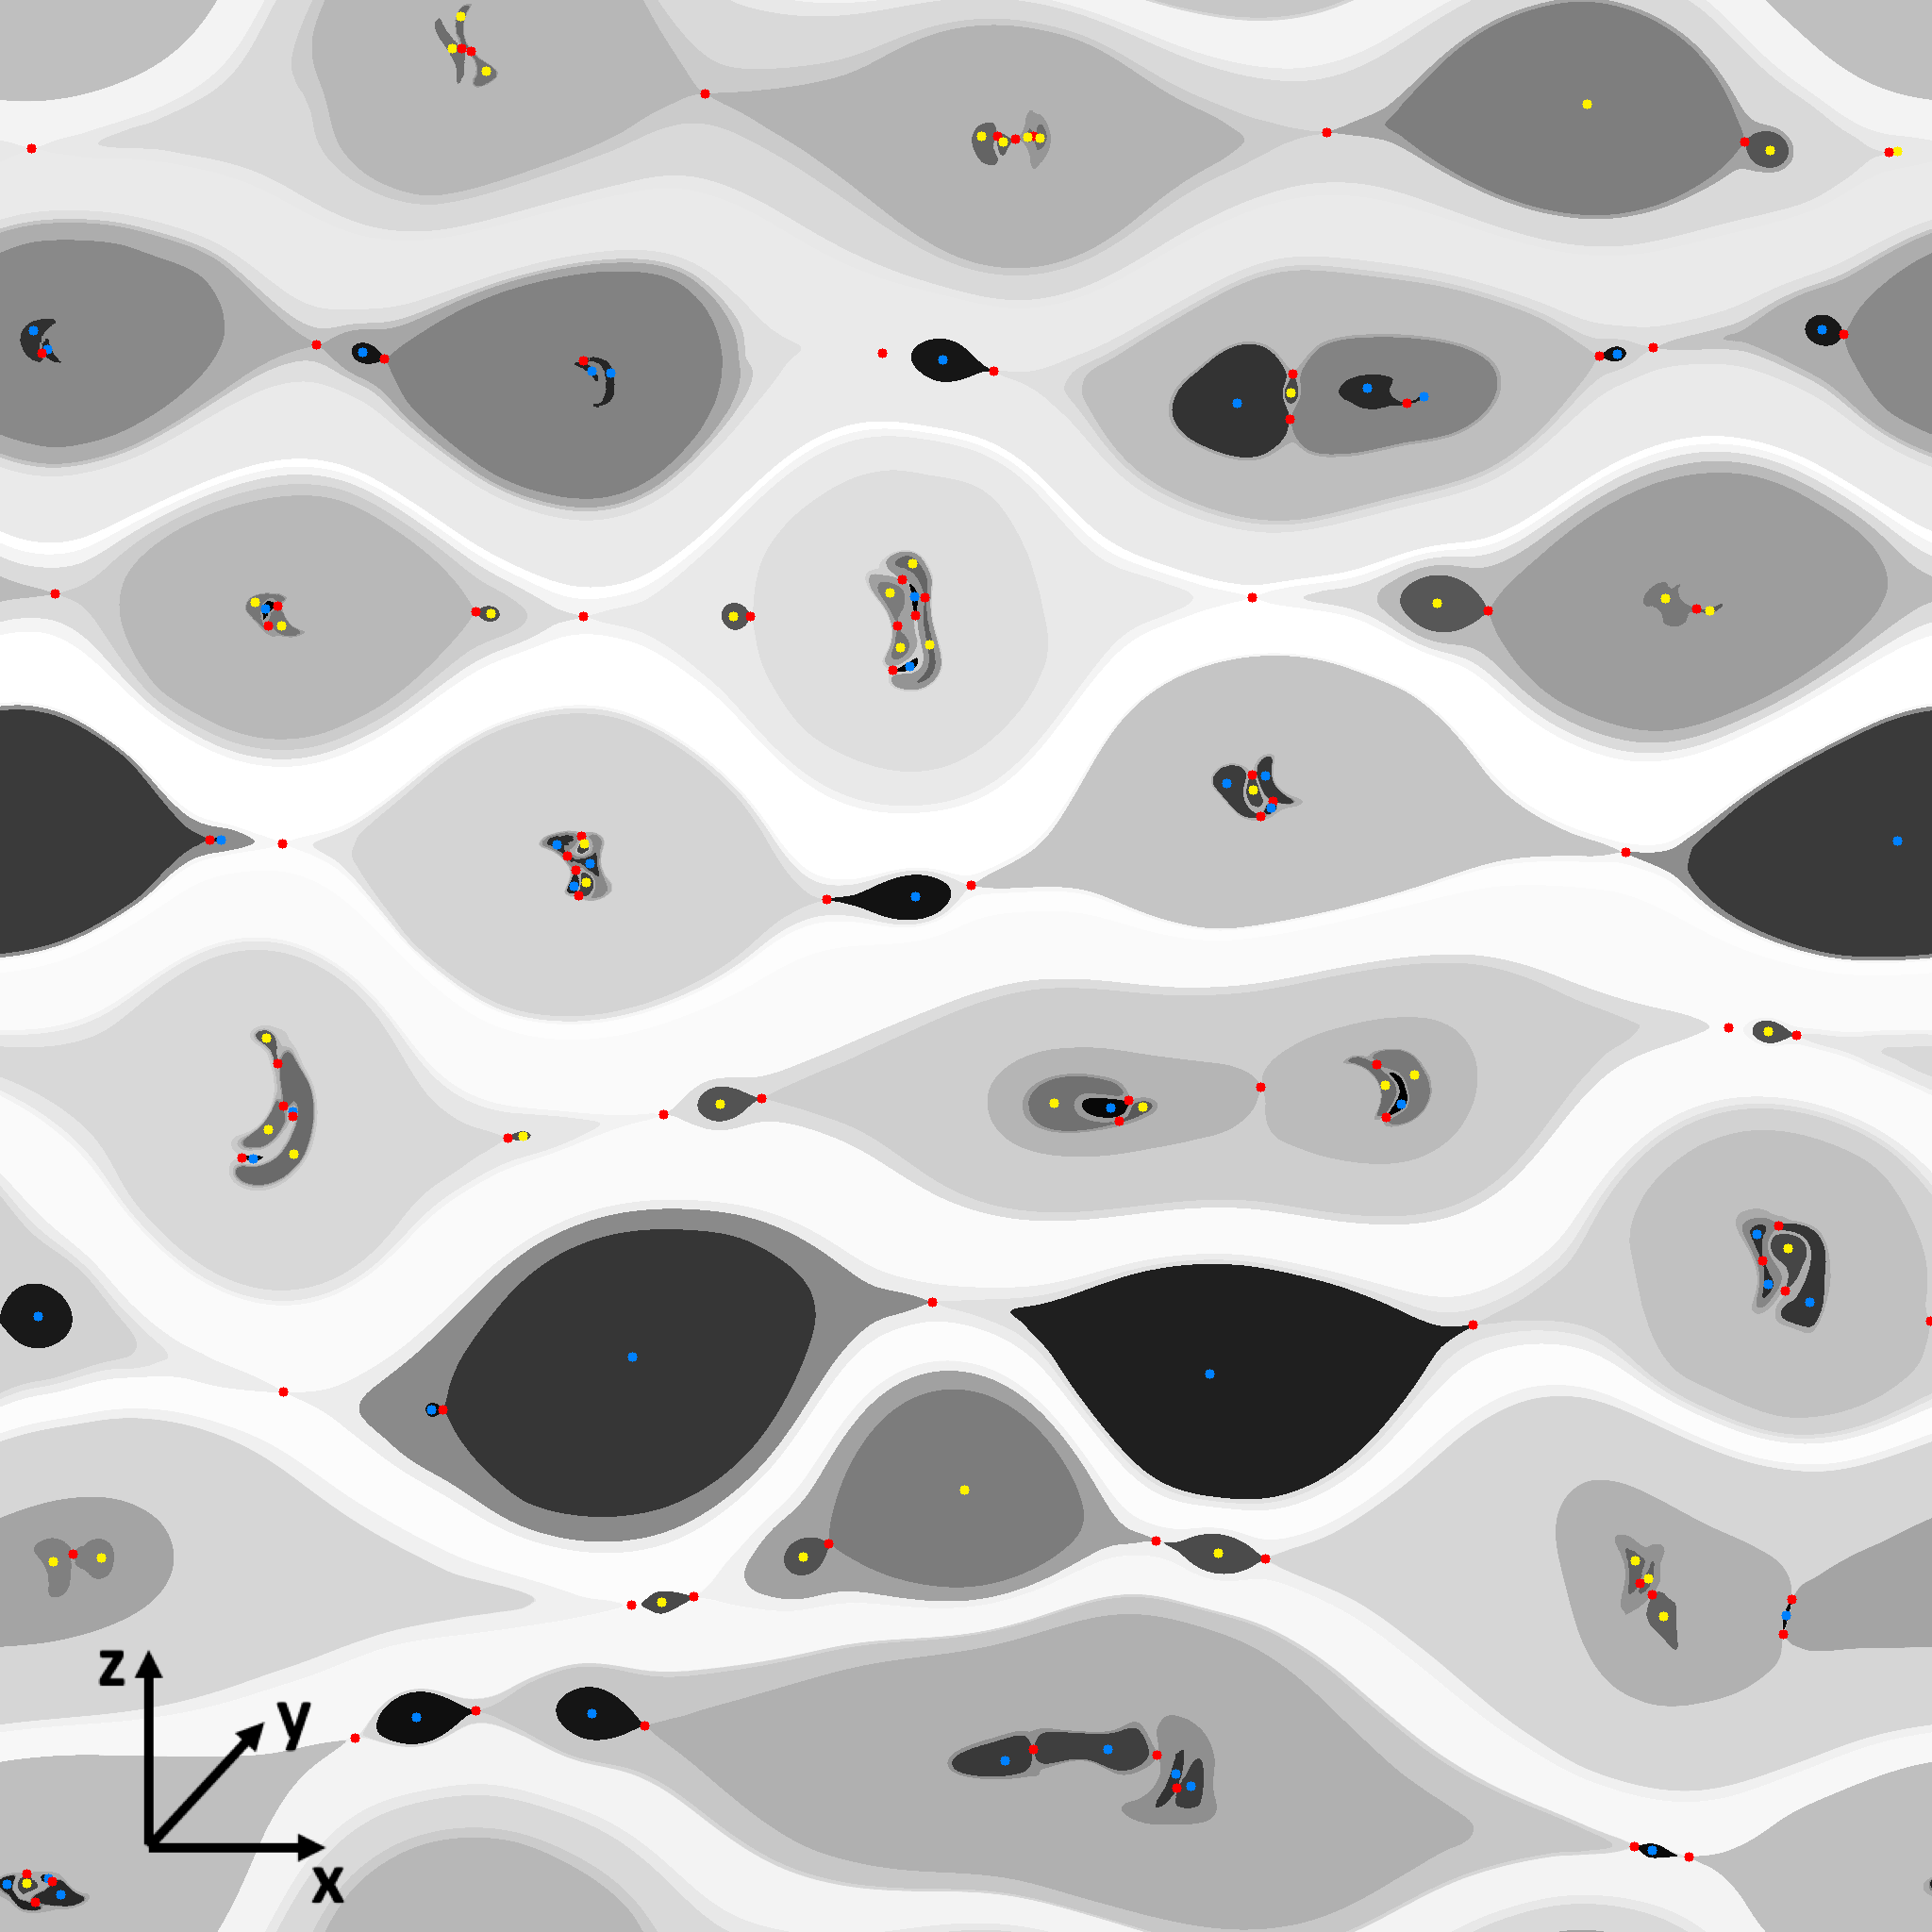
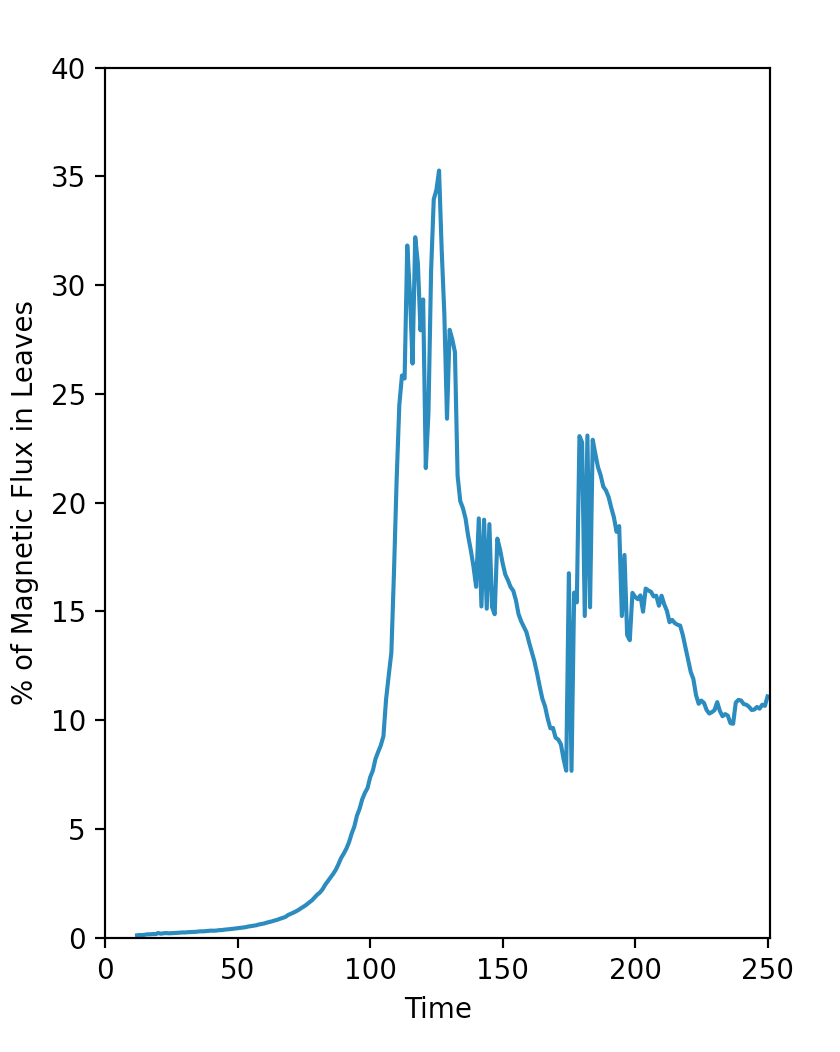
We have applied the analysis to more complicated simulations involving 8, 16 or 32 current sheets. These simulations contain many complex features of interest to physicists studying reconnection. A comprehensive evaluation of such data is impossible through traditional analysis techniques. In contrast, the presented contour-tree algorithm can efficiently and accurately identify relevant features. Figure 6 left shows an example of the application of this algorithm to a large PiC simulation with bi-periodic boundaries. The simulation domain resolution is in the plane, with cells [12]. It starts with eight current sheets and becomes more turbulent over time. The complex nested hierarchy of the data, captured by the segmentation, makes it apparent why the described tool is valuable for understanding magnetic reconnection. In comparison, the Servidio et al. segmentation algorithm identifies only the leaves of the contour trees, i.e., the segments corresponding to maxima and minima. Figure 6 right examines the combined magnetic flux in the leaf-segments of the contour tree as a percentage of the total. Of the 251 output steps, we disregard the first 12 output steps to allow time for reconnection events to start. The magnetic flux in the leaves over the following 239 outputs range from to of the total with a mean of . It’s clear that restricting the analysis of the data to just the leaves would lead to a limited understanding of reconnection events.
A comparison of the traditional isovalue-based approach, the approach by Servidio et al. [30, 31], and our contour-tree based technique shows the advantages and disadvantages of each method. The traditional isovalue-based method can be useful for a quick initial exploration of the data, using an interactive tool such as Paraview [1], commonly used by scientists. However, for a more quantitative analysis, the contour-tree based algorithm is a better option. The contour-tree based algorithm is “objective”; even the single threshold parameter is defined by simulation properties. In comparison, the traditional method is entirely subjective; the method described by Servidio et al. is subjective when categorizing critical points as physically valid or noise. The contour-tree based algorithm also produces the entire hierarchy of the data and the corresponding contour tree, making it possible to recognize correlations between segments (including nested islands), separatrices and critical points. This allows for more informed physics-based conclusions as compared to other methods. Finally, every element captured in the contour-tree based segmentation has an corresponding definition in kinetic plasma physics; the two are fundamentally consistent with one another.
Our physicist co-authors have stated that “Cutting-edge research in magnetic reconnection must understand the roles of nonlinear structures in energy conversion, heating, and particle acceleration. Recent advances in computational plasma simulations on peta-scale supercomputers have enabled us to model hundreds or even thousands of segments in one simulation. However, to quantify the effects of magnetic islands and X points, one needs an efficient and robust way to identify those structures. The contour-tree based framework is extremely helpful for accomplishing these goals. Additionally, because the entire tool is built on an open-source framework, collaboration between colleagues is more productive as one can focus on the physics rather than the particulars of the analysis method. Finally, the tool provides information about each segment, separatrix or critical point individually. This relevant output can be used to compute additional statistics such as size distributions, particle energy spectra and acceleration mechanism related quantities.”
4 Conclusion
We show the successful application of the contour-tree based technique for reconnection study given the one-to-one correspondence between 2D magnetic reconnection and scalar field topology. In addition, our use of persistence to reduce the impact of noise is highly advantageous when compared to other analysis techniques. Our work has offered physicists a much more robust way to examine 2D magnetic reconnection and provided a new perspective of the underlying mechanisms. In future work, we plan to add a suite of statistics tools to automatically extract physically-relevant information. Next steps also include temporal tracking of islands and reconnection points.
Acknowledgements.
We thank David Rogers, Jim Ahrens, Francesca Samsel and Hui Li. Funded by DOE/OFES, LANL LDRD and LANL Cinema Project.References
- [1] U. Ayachit. The paraview guide: a parallel visualization application. Kitware, Inc., 2015.
- [2] T. F. Banchoff. Critical points and curvature for embedded polyhedral surfaces. The American Mathematical Monthly, 77(5):475–485, 1970.
- [3] J. Birn, J. F. Drake, M. A. Shay, B. N. Rogers, R. E. Denton, M. Hesse, M. Kuznetsova, Z. W. Ma, A. Bhattacharjee, A. Otto, and P. L. Pritchett. Geospace Environmental Modeling (GEM) magnetic reconnection challenge. Journal of Geophysical Research, 106(A3):3715–3720, Mar 2001. doi: 10 . 1029/1999JA900449
- [4] D. Biskamp. Magnetic reconnection via current sheets. Physics of Fluids, 29(5):1520–1531, May 1986. doi: 10 . 1063/1 . 865670
- [5] K. Bowers and H. Li. Spectral energy transfer and dissipation of magnetic energy from fluid to kinetic scales. Phys. Rev. Lett., 98:035002, Jan 2007. doi: 10 . 1103/PhysRevLett . 98 . 035002
- [6] K. J. Bowers, B. J. Albright, B. Bergen, L. Yin, K. J. Barker, and D. J. Kerbyson. 0.374 pflop/s trillion-particle kinetic modeling of laser plasma interaction on roadrunner. In Proceedings of the 2008 ACM/IEEE Conference on Supercomputing, SC ’08. IEEE Press, 2008. doi: 10 . 1109/SC . 2008 . 5222734
- [7] K. J. Bowers, B. J. Albright, L. Yin, B. Bergen, and T. J. T. Kwan. Ultrahigh performance three-dimensional electromagnetic relativistic kinetic plasma simulation. Physics of Plasmas, 15(5):055703, 2008. doi: 10 . 1063/1 . 2840133
- [8] H. Carr, J. Snoeyink, and U. Axen. Computing contour trees in all dimensions. Computational Geometry, 24(2):75–94, 2003. doi: 10 . 1016/S0925-7721(02)00093-7
- [9] B. Chen, S. Yu, M. Battaglia, S. Farid, A. Savcheva, K. K. Reeves, S. Krucker, T. S. Bastian, F. Guo, and S. Tassev. Magnetic Reconnection Null Points as the Origin of Semirelativistic Electron Beams in a Solar Jet. The Astrophysical Journal, 866(1):62, Oct. 2018. doi: 10 . 3847/1538-4357/aadb89
- [10] W. Daughton, V. Roytershteyn, B. J. Albright, H. Karimabadi, L. Yin, and K. J. Bowers. Transition from collisional to kinetic regimes in large-scale reconnection layers. Phys. Rev. Lett., 103:065004, Aug 2009. doi: 10 . 1103/PhysRevLett . 103 . 065004
- [11] G. Drenkhahn and H. C. Spruit. Efficient acceleration and radiation in Poynting flux powered GRB outflows. Astronomy and Astrophysics, 391:1141–1153, Sept. 2002. doi: 10 . 1051/0004-6361:20020839
- [12] S. Du, G. P. Zank, X. Li, and F. Guo. Energy dissipation and entropy in collisionless plasma. Physical Review E, 101(3):033208, Mar. 2020. doi: 10 . 1103/PhysRevE . 101 . 033208
- [13] H. Edelsbrunner and J. Harer. Computational topology: an introduction. American Mathematical Soc., 2010.
- [14] H. S. Fu, Y. V. Khotyaintsev, M. André, and A. Vaivads. Fermi and betatron acceleration of suprathermal electrons behind dipolarization fronts. Geophysical Research Letters, 38(16):L16104, Aug. 2011. doi: 10 . 1029/2011GL048528
- [15] D. J. Griffiths. Introduction to electrodynamics. Prentice Hall New Jersey, 1962.
- [16] C. Gueunet, P. Fortin, J. Jomier, and J. Tierny. Task-based augmented contour trees with fibonacci heaps. IEEE Transactions on Parallel and Distributed Systems, 30(8):1889–1905, 2019. doi: 10 . 1109/LDAV . 2017 . 8231846
- [17] F. Guo, H. Li, W. Daughton, and Y.-H. Liu. Formation of Hard Power Laws in the Energetic Particle Spectra Resulting from Relativistic Magnetic Reconnection. Physical Review Letters, 113(15):155005, Oct 2014. doi: 10 . 1103/PhysRevLett . 113 . 155005
- [18] F. Guo, X. Li, W. Daughton, P. Kilian, H. Li, Y.-H. Liu, W. Yan, and D. Ma. Determining the Dominant Acceleration Mechanism during Relativistic Magnetic Reconnection in Large-scale Systems. The Astrophysical Journal Letters, 879(2):L23, Jul 2019. doi: 10 . 3847/2041-8213/ab2a15
- [19] F. Guo, X. Li, H. Li, W. Daughton, B. Zhang, N. Lloyd-Ronning, Y.-H. Liu, H. Zhang, and W. Deng. Efficient production of high-energy nonthermal particles during magnetic reconnection in a magnetically dominated ion–electron plasma. The Astrophysical Journal, 818(1):L9, feb 2016. doi: 10 . 3847/2041-8205/818/1/l9
- [20] F. Guo, Y.-H. Liu, W. Daughton, and H. Li. Particle acceleration and plasma dynamics during magnetic reconnection in the magnetically dominated regime. The Astrophysical Journal, 806(2):167, jun 2015. doi: 10 . 1088/0004-637x/806/2/167
- [21] C. C. Haggerty, T. N. Parashar, W. H. Matthaeus, M. A. Shay, Y. Yang, M. Wan, P. Wu, and S. Servidio. Exploring the statistics of magnetic reconnection x-points in kinetic particle-in-cell turbulence. Physics of Plasmas, 24(10):102308, 2017. doi: 10 . 1063/1 . 5001722
- [22] R. W. Hockney and J. W. Eastwood. Computer simulation using particles. crc Press, 1988.
- [23] P. Kilian, X. Li, F. Guo, and H. Li. Exploring the acceleration mechanisms for particle injection and power-law formation during trans-relativistic magnetic reconnection. arXiv e-prints, Jan 2020.
- [24] P. Klacansky, A. Gyulassy, P.-T. Bremer, and V. Pascucci. Toward localized topological data structures: Querying the forest for the tree. IEEE transactions on visualization and computer graphics, 26(1):173–183, 2019. doi: 10 . 1109/TVCG . 2019 . 2934257
- [25] A. Le, A. Stanier, W. Daughton, J. Ng, J. Egedal, W. D. Nystrom, and R. Bird. Three-dimensional stability of current sheets supported by electron pressure anisotropy. Physics of Plasmas, 26(10):102114, 2019. doi: 10 . 1063/1 . 5125014
- [26] X. Li, F. Guo, H. Li, A. Stanier, and P. Kilian. Formation of power-law electron energy spectra in three-dimensional low- magnetic reconnection. The Astrophysical Journal, 884(2):118, oct 2019. doi: 10 . 3847/1538-4357/ab4268
- [27] E. N. Parker. Sweet’s Mechanism for Merging Magnetic Fields in Conducting Fluids. Journal of Geophysical Research, 62(4):509–520, Dec 1957. doi: 10 . 1029/JZ062i004p00509
- [28] P. Rosen, A. Seth, B. Mills, A. Ginsburg, J. Kamenetzky, J. Kern, C. R. Johnson, and B. Wang. Using contour trees in the analysis and visualization of radio astronomy data cubes. arXiv preprint arXiv:1704.04561, 2017.
- [29] A. Sanderson, G. Chen, X. Tricoche, D. Pugmire, S. Kruger, and J. Breslau. Analysis of recurrent patterns in toroidal magnetic fields. IEEE Transactions on Visualization and Computer Graphics, 16(6):1431–1440, 2010.
- [30] S. Servidio, W. Matthaeus, M. Shay, P. Cassak, and P. Dmitruk. Magnetic reconnection in two-dimensional magnetohydrodynamic turbulence. Physical review letters, 102(11):115003, 2009. doi: 10 . 1103/PhysRevLett . 102 . 115003
- [31] S. Servidio, W. Matthaeus, M. Shay, P. Dmitruk, P. Cassak, and M. Wan. Statistics of magnetic reconnection in two-dimensional magnetohydrodynamic turbulence. Physics of Plasmas, 17(3):032315, 2010. doi: 10 . 1063/1 . 3368798
- [32] A. Stanier, W. Daughton, A. Le, X. Li, and R. Bird. Influence of 3d plasmoid dynamics on the transition from collisional to kinetic reconnection. Physics of Plasmas, 26(7):072121, 2019. doi: 10 . 1063/1 . 5100737
- [33] J. Tierny. Topological Data Analysis for Scientific Visualization. Springer, 2017.
- [34] J. Tierny, G. Favelier, J. A. Levine, C. Gueunet, and M. Michaux. The topology toolkit. IEEE Transactions on Visualization and Computer Graphics, 24(1):832–842, 2017. doi: 10 . 1109/TVCG . 2017 . 2743938
- [35] X. Tricoche, C. Garth, and A. Sanderson. Visualization of topological structures in area-preserving maps. IEEE transactions on visualization and computer graphics, 17(12):1765–1774, 2011.
- [36] A. Yeates and G. Hornig. A generalized flux function for three-dimensional magnetic reconnection. Physics of plasmas, 18(10):102118, 2011.
- [37] L. Yin, W. Daughton, H. Karimabadi, B. J. Albright, K. J. Bowers, and J. Margulies. Three-dimensional dynamics of collisionless magnetic reconnection in large-scale pair plasmas. Phys. Rev. Lett., 101:125001, Sep 2008. doi: 10 . 1103/PhysRevLett . 101 . 125001