Aluminum Enhanced Metal-Poor Stars buried in the Inner Galaxy
Stars with higher aluminum and nitrogen enrichment are often the key pieces for the chemical makeup of multiple populations in almost all globular clusters (GCs). There is also compelling observational evidence that some Galactic components could be partially built from dissipated GCs. Thus, the identification of such kinds of stars among metal-poor field stars may provide insights on the composite nature of the Milky Way (MW) bulge and inner stellar halo, as well as reveal other chemical peculiarities. Here, based on APOGEE spectra, we report the discovery of 29 mildly metal-poor ([Fe/H]) stars with stellar atmospheres strongly enriched in aluminum (Al-rich stars: [Al/Fe]), well above the typical Galactic levels, located within the Solar radius toward the bulge region, which lies in highly eccentric orbits (). We find many similarities for almost all of the chemical species measured in this work with the chemical patterns of GCs, so we conjecture that they have likely been dynamically ejected into the bulge and inner halo from GCs formed in situ and/or GC formed in different progenitors of known merger events experienced by the MW, such as the Gaia-Sausage-Enceladus and/or Sequoia.
Key Words.:
stars: abundances – stars: chemically peculiar – globular clusters:general – techniques: spectroscopic1 Introduction
The current standard picture of the inner region of our Galaxy postulates that it is made up by a complex variety of stellar populations, each with characteristic structure, chemistry, and kinematics (see, e.g., Recio-Blanco et al., 2017; Queiroz et al., 2020a; Rojas-Arriagada et al., 2020, and references therein) belonging to the disc, a massive bar structure ( M⊙) (Bland-Hawthorn & Gerhard, 2016), a pseudo-bulge, and a possible classical bulge (e.g., Combes et al., 1990; Minniti, 1996; Athanassoula, 2005; Zoccali et al., 2008; Barbuy et al., 2018), likely to be the product of merger and accretion of primordial GCs or dwarf galaxies (Belokurov et al., 2018; Koppelman et al., 2019; Massari et al., 2019; Souza et al., 2020; Naidu et al., 2020, e.g.,), not to mention the inner halo. While our knowledge about the nature of the bulge has improved substantially in recent years, some key questions remain. In particular, some of the stars seen in the bulge today in the lower-metallicity range ([Fe/H]) exhibit dissimilar chemical compositions and kinematics than the more metal-rich stars, and possibly retain information on the earliest phases of formation and evolution of the inner Galaxy (see, e.g., Fernández-Trincado et al., 2019a, b; Fernández-Trincado et al., 2020).
A major advancement in revealing the nature of the low-metallicity stars ([Fe/H]) in the bulge region was achieved by the discovery of a large population of giant stars with nitrogen over-abundances (N-rich; Schiavon et al., 2017; Fernández-Trincado et al., 2019b) and low- stars (see, e.g., Recio-Blanco et al., 2017), which mimic the typical chemical patterns only seen in the so called second-generation111Second-generation (2G) is used here to refers to stars in GCs that display altered light-element abundances (e.g., He, C, N, O, Na, Al, and Mg), which are different to those of typical MW field stars. GC stars. The origin of the N-rich stars (hereafter NRS) remains controversial and still under debate (see Bekki, 2019, for an alternative view). Recent studies propose the existence of stars that have lower aluminum enrichments ([Al/Fe]) within kpc of the Galactic Centre (Barbuy et al., 2018), with chemical patterns that resemble low-mass satellite galaxies of the MW (Das et al., 2020).
Taking advantage of high-resolution near-IR spectroscopy from the Apache Point Observatory Galactic Evolution Experiment (APOGEE-2; Majewski et al., 2017), we select some key elements (N, Al, Mg, Si, among others) for investigation of any possible chemical peculiarities to help constrain scenarios of their origin and relation to the mass assembly history of the Galaxy (see, e.g., Fernández-Trincado et al., 2016, 2017; Fernández-Trincado et al., 2019a, b, c, d).
In this Letter, we report the discovery of a unique collection of aluminum-enhanced (Al-rich) stars among metal-poor ones, exhibiting Al abundances well-above typical Galactic levels ([Al/Fe]) over a range of metallicities, resembling those long known to exist in Galactic GCs (see, e.g., Mészáros et al., 2020), but unlikely to be linked to the accretion of dwarf galaxies, for which larger Al abundance ratios have not been observed to date (Hasselquist et al., 2019, and references therein). Observations and sample selection is described in Section 2. Results are discussed in Section 3. Finally, our conclusions are summarized in Section 4.
2 Observations
This work makes use of data primarily from the APOGEE-2, which have collected high-resolution (22,500) H-band spectra (near-IR, 15145 to 16960 , vacuum wavelengths) for almost 470,000 sources in their sixteenth data release (APOGEE DR16: Ahumada et al., 2020), as part of the Sloan Digital Sky Survey IV (Blanton et al., 2017). For details on the sample selection, see Appendix A.
Since we are focused on selecting dissolved and/or evaporated GC stars in [Al/Fe] space, we selected stars among metal-poor ones with aluminum enrichments larger than that expected in dwarf galaxies (see, e.g., Hasselquist et al., 2019) and MW stars, i.e., [Al/Fe]. Our final sample of Al-rich stars comprises 29 stars. With the uncalibrated ASPCAP stellar parameters fixed (Teff, g, and [M/H]), we derive (when possible) the abundances of C, N, O, Mg, Al, Si, and Ce, as well as the metallicity for each Al-rich star. The derived abundances and kinematic parameters for this sample are presented in Tables 1 and 2.

3 Elemental Abundance Analysis
Large amounts of aluminum were found in the atmospheres of 29 metal-poor field giant stars (not previously identified). Our sample comprises of 7 stars with orbital apocenter () 3.5 kpc (see Section 3.6), placing them well within the bulge region (see, e.g. Barbuy et al., 2018) and two halo interlopers located in the inner region of the Galaxy, which we refer here to as the bulge sample. The remaining stars in our sample are located within 13 kpc from the Galactic center. The light-elements (C, N), the elements (O, Mg, Si), the Odd-Z element (Al), the iron-peak element (Fe), and the s-process element (Ce) of these stars are compared to GC stars from Mészáros et al. (2020), and the local MW disc, halo and bulge population from APOGEE DR16 (Ahumada et al., 2020). Abundances have been determined from a minimization to synthesized spectra using the BACCHUS code.
It is also important to note that there are no known GCs within an angular separation of 0.5 degrees for most of our stars, except for one (2M180350172552334), which is located from the GC Terzan 10. However, its [Fe/H] and RV deviate significantly from the nominal parameters of the cluster, so it cannot be considered a potential extra-tidal star candidate, as has been found recently in other bulge GCs (Fernández-Trincado et al. 2020b, submitted).
Overall, we find that the elemental abundances of our sample is separated relatively cleanly from other stellar populations in different chemical dimensions, such as [Mg,N/Fe]–[Al/Fe] planes. Figure 1 reveal that our observed stars differ substantially from those of the so–called N-rich (or NRS) bulge population (see, e.g., Schiavon et al., 2017) and from the rest of the entire MW/bulge sample, but exhibit a unique chemical signature similar to that of some GC 2G stars with higher [Al/Fe]. Also, their higher aluminum enrichment ([Al/Fe]) over a wide range of metallicities makes them unlikely to be associated to the typical Al enrichment seen in dwarf galaxies (Hasselquist et al., 2019), unless they are part of partially dissipated GCs in dwarf galaxies (see Fernández-Trincado et al. 2020c).
3.1 The iron-peak element: Fe
Regarding the iron-peak element (Fe), we find that our sample spans a wide range of iron abundances, [Fe/H] (see Figure 1), thus suggesting that these stars were formed from different progenitors or in a unusual system like Cen (unless they are part of a binary system). It is interesting to note that our Al-rich stars toward the bulge region peak around [Fe/H], just as NRS stars – located in bulge – do (Schiavon et al., 2017), suggesting an association to them. It is then possible that we have identified a subfamily of that population which is strongly more enriched in aluminum, whilst the stars in our sample located outside the bulge region do no peak at any particular metallicity and are moderately more metal-poor.
3.2 The elements: O, Mg, and Si
Figure 1(c) shows that the [O/Fe] abundance ratio of our sample is similar to that of the NRS, and MW/bulge stars at [Fe/H], but moderately enhanced toward the bulge region at metallicities as low as [Fe/H], and slightly enhanced for our sample outside the bulge region. In the same figures it is clear that [O/Fe] abundances of the Al-rich stars are, on average, consistent with the GCs population at similar metallicity, and have a large dispersion in [O/Fe] similar to that observed in GCs.
Regarding Magnesium (see Figure 1(d)), most of our targets exhibit low levels of it ([Mg/Fe]) and behave like accreted halo stars in the low-Mg sequence. At higher metallicity ([Fe/H]), a few stars show enhancement in [Mg/Fe] relative to the disc, providing evidence that these stars do not belong to canonical disk or halo of the MW, and neither to the bulge population, and have, on average, lower [Mg/Fe] than the NRS. It also indicates that the [Mg/Fe] levels and the star-to-star dispersion observed in our sample is consistent to that observed in GC stars and Cen stars.
The element Si is found to be higher in our sample compared to the NRS and MW/bulge stars, but similar to those known to exist in Cen stars, and a few other Galactic GCs at similar metallicity. The slightly higher [Si/Fe] () of our stars indicate that the initial composition of the gas that formed them was slightly different from the NRS and MW stars, but similar to that of GC stars, providing further evidence that the Al-rich stars could be likely accreted stars from an progenitor whose chemical history was similar to that of known Galactic GCs.
3.3 The light-elements: C and N
The outlying stars with high levels of Al enhancement are also enhanced in N, well above the Galactic levels ([N/Fe]) as can be noticed in Figure 1(b;i), except for three stars at metallicities above [Fe/H] that exhibit nitrogen abundance lower than [N/Fe], but clearly distinguishable from the canonical Galactic components in the [N/Fe]–[Al/Fe] plane. Furthermore, the Al-rich stars are slightly more enriched in nitrogen than the NRS, indicating that they do not necessarily share the same star-formation history, instead being similar to that of GCs environments. Interestingly, we can see a clear N-Al correlation in Figure 1 between our Al-rich stars toward the bulge region and the NRS, which is striking similar to that seen in Galactic GCs like Cen.
Regarding carbon, we find similar patterns as NRS and GC population at same metallicities, have slightly lower levels than the bulge, canonical disc and halo populations, extending down well below [C/Fe] dex.
3.4 The odd-Z elements: Al
Figure 1(h) shows a well-distinguished clump of Al-rich stars, differing from the NRS, MW, and bulge stars, indicating that these stars are likely members of a distinct population confined to the inner part of the Galaxy (based in their orbital parameters, see subsection 3.6), possibly part of the innermost distribution of the stellar halo. There are also a few cases in the [Mg/Fe]–[Al/Fe] plane with large Al enhancement paired with low Mg, [Mg/Fe], which is a signature of GC 2G stars (see, e.g., Fernández-Trincado et al., 2017; Lucey et al., 2019).
Overall, Figure 1(h) displays the chemical-abundance pattern of GC stars from Cen (Mészáros et al., 2020); this GC spans as wide a metallicity range as our observed Al-rich stars. The star-to-star scatter of the Al-rich stars for almost all the chemical species is similar to that typically found in Cen stars. The similarity between Al-rich stars and GC 2G stars can be further tested through examination of the [Mg, Al/Fe]–[Al/Fe] planes. Interestingly, we find that Al-rich stars exhibit similar characteristics to the NRS, i.e., they also show high [N/Fe], correlated with [Al/Fe] and anti-correlated with [C/Fe]. To first order, these branches strongly resemble those long known to exist in GCs, and are not present in the Galactic field. As far as we know, this is the first time the existence of clear Mg-Al anticorrelation and N-Al correlation among metal-poor stars with chemical anomalies toward the Galactic bulge is reported, and beyond the GC environments where typically these have been identified so far. This finding reinforces the unique nature of our sample, and confirms the complex and composite structure of the MW bulge.
3.5 The s-process element: Ce
The APOGEE DR16 [Ce/Fe] abundance ratio patterns (Cunha et al., 2017) are shown for MW stars in Figure 1(g) and stars in the bulge region in Figure 1(g). Figure 1(g) indicates that [Ce/Fe] is slightly enhanced than NRS, GC and MW stars, but fairly agree with GC stars (Mészáros et al., 2020) at similar metallicities, but there is currently no explanation for this unexpected tendency.
3.6 Orbital Analysis
The model and distribution of orbital parameters are presented in Appendix C. Overall, we find that all the stars in our sample have highly eccentric orbits (). Figure 2 shows the Galactic spatial distribution and the orbital elements for the Al-rich stars. As is clear from the figure, the majority of the stars are found to have radial ( kpc) orbits in different configurations (e.g., retrograde, prograde, and P–R222We call prograde-retrograde (P-R) orbits to the ones that flip their sense from prograde to retrograde, or vice-versa, along its orbit. orbits). The orbital elements also reveal that most of the Al-rich stars are currently located near their apocentric distances (), placing many of them within the Solar radius ( kpc) and inside of the bulge region ( kpc), with rather small excursions above the Galactic plane ( 3 kpc). Several (11 out of 29 stars) of them have larger (3 kpc 25 kpc) vertical excursions, making them halo interlopers within the Solar radius. We conclude that these stars live in the bulge region and the inner stellar halo of the Galaxy, respectively.
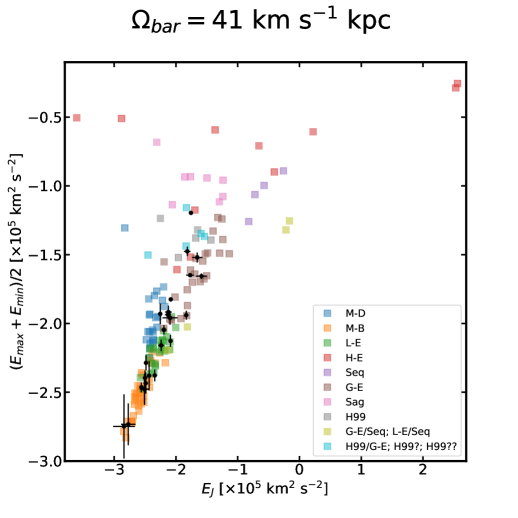
An interesting aspect of the Al-rich stars can be noticed in Figure 2(h). Strikingly, this figure reveals that a disc control sample taken from APOGEE DR16 populates the top part of the vs. distribution, whilst the Al-rich stars fall in the bottom part, where the Gaia-Sausage-Enceladus (GSE), Helmi Streams (Helmi St.) and the ArjunaSequoiaI’itoi (ASI) halo structures reside (see, e.g., Naidu et al., 2020), and which are dominated by metal-poor ([Fe/H]) stars. For comparison, we calculated the orbital solutions for Galactic GCs from Baumgardt et al. (2019), and adopted the progenitor classification of Massari et al. (2019). Figure 3 shows the characteristic orbital energy (()/2) versus the orbital Jacobi constant () distribution of Galactic GCs and our Al-rich stars. This diagram reveals that the Al-rich stars populate a wide range of energies, similar to that of Galactic GCs with different origins, suggesting that the aforementioned have possibly emerged from different GCs.
Are the Al-rich stars largerly the signatures of tidal disruption of accreted dwarf galaxies?. This possibility seems unlikely, given that the observed Al-rich stars exhibit higher [Al/Fe], not observed in present-day dwarf galaxy stars (see Hasselquist et al., 2019, and references therein). Even though most of the Al-rich stars share similar orbital eccentricity, spatial distribution, and location in the vs. plane as those seen in high- disc stars and in-situ halo stars, Metal-Weak Thick-Disc stars, Sagittarius-, Thamnos-, GSE-, Helmi St.-, and ASI-structures (Naidu et al., 2020), their association seem unlikely, given the higher Al and N abundance observed. Our sample is also not part of the unclassified debris stars reported in Naidu et al. (2020), as the Al-rich stars possess orbital eccentrities larger than those unclassified debris. However, since there are some GCs that appear to be possibly associated with some of the known mergers, in particular to GSE, the Helmi St., and Sequoia (see, e.g., Massari et al., 2019), then it is possible that some of our observed stars could be associated with those merger events through their partially dissipated GCs as highlighted in Figure 3.
All the above described chemical and dynamical properties suggest that the Al-rich stars could be the signatures of tidal disruption of accreted and likely formed in situ GCs. This population could have been dynamically ejected in different orbital configurations into the bulge region and the inner stellar halo from GC systems at similar metallicity, or possibly a massive system like Cen (Meza et al., 2005; Majewski et al., 2012).
4 Conclusions
We report the detection of aluminum-enhanced ([Al/Fe]) giant stars toward the bulge and inner stellar halo of the Galaxy. The majority of these 29 stars have unique abundance patterns seen in accreted GCs, and dynamical properties consistent with the bulge and halo population.
The identification of such unusual stars toward the bulge region confirms the proposed composite nature of the MW bulge (e.g., Recio-Blanco et al., 2017; Rojas-Arriagada et al., 2020; Queiroz et al., 2020a). Our finding also reveals, for the first time, that there are many chemically anomalous metal-poor stars in the vs. plane residing in the same position where massive merger events (e.g., Gaia-Sausage-Enceladus and Sequoia) have been identified. However, our study also reveals that some elements (Si) and odd-Z elements (Al) appear to rule out any direct link with those known merger events, but some indirect association through GCs may still apply.
We conjecture that many of our Al-rich stars were possible former members of several stellar clusters with similar chemical enrichment as accreted-and-likely-formed-in-situ GCs. The peculiar chemical signature of these objects, makes them excellent candidates to trace the fossil relics population of early MW, which became part of the general stellar population.
Acknowledgements.
The author is grateful for the enlightening feedback from the anonymous referee. J.G.F-T is supported by FONDECYT No. 3180210. T.C.B. acknowledges partial support for this work from grant PHY 14-30152: Physics Frontier Center / JINA Center for the Evolution of the Elements (JINA-CEE), awarded by the US National Science Foundation. D.M. is supported by the BASAL Center for Astrophysics and Associated Technologies (CATA) through grant AFB 170002, and by project FONDECYT Regular No. 1170121. B.T. gratefully acknowledges support from the National Natural Science Foundation of China under grant No. U1931102 and support from the hundred-talent project of Sun Yat-sen University. S.V. gratefully acknowledeges the support provided by Fondecyt regular n. 1170518. D.G. gratefully acknowledges support from the Chilean Centro de Excelencia en Astrofísica y Tecnologías Afines (CATA) BASAL grant AFB-170002. D.G. also acknowledges financial support from the Dirección de Investigación y Desarrollo de la Universidad de La Serena through the Programa de Incentivo a la Investigación de Académicos (PIA-DIDULS). A.P-V acknowledges FAPESP for the postdoctoral fellowship No. 2017/15893-1 and the DGAPA-PAPIIT grant IG100319. The SDSS-IV/APOGEE-2 survey made this study possible.References
- Ahumada et al. (2020) Ahumada, R., Prieto, C. A., Almeida, A., et al. 2020, ApJS, 249, 3
- Athanassoula (2005) Athanassoula, E. 2005, MNRAS, 358, 1477
- Barbuy et al. (2018) Barbuy, B., Chiappini, C., & Gerhard, O. 2018, ARA&A, 56, 223
- Baumgardt et al. (2019) Baumgardt, H., Hilker, M., Sollima, A., & Bellini, A. 2019, MNRAS, 482, 5138
- Bekki (2019) Bekki, K. 2019, MNRAS, 490, 4007
- Belokurov et al. (2018) Belokurov, V., Erkal, D., Evans, N. W., Koposov, S. E., & Deason, A. J. 2018, MNRAS, 478, 611
- Bland-Hawthorn & Gerhard (2016) Bland-Hawthorn, J. & Gerhard, O. 2016, ARA&A, 54, 529
- Blanton et al. (2017) Blanton, M. R., Bershady, M. A., Abolfathi, B., et al. 2017, AJ, 154, 28
- Bovy et al. (2019) Bovy, J., Leung, H. W., Hunt, J. A. S., et al. 2019, MNRAS, 490, 4740
- Bowen & Vaughan (1973) Bowen, I. S. & Vaughan, A. H., J. 1973, Appl. Opt., 12, 1430
- Carollo et al. (2010) Carollo, D., Beers, T. C., Chiba, M., et al. 2010, ApJ, 712, 692
- Combes et al. (1990) Combes, F., Debbasch, F., Friedli, D., & Pfenniger, D. 1990, A&A, 233, 82
- Cunha et al. (2017) Cunha, K., Smith, V. V., Hasselquist, S., et al. 2017, ApJ, 844, 145
- Das et al. (2020) Das, P., Hawkins, K., & Jofré, P. 2020, MNRAS, 493, 5195
- Fernández-Trincado et al. (2019a) Fernández-Trincado, J. G., Beers, T. C., Placco, V. M., et al. 2019a, ApJ, 886, L8
- Fernández-Trincado et al. (2019b) Fernández-Trincado, J. G., Beers, T. C., Tang, B., et al. 2019b, MNRAS, 488, 2864
- Fernández-Trincado et al. (2020) Fernández-Trincado, J. G., Chaves-Velasquez, L., Pérez-Villegas, A., et al. 2020, MNRAS, 495, 4113
- Fernández-Trincado et al. (2019c) Fernández-Trincado, J. G., Mennickent, R., Cabezas, M., et al. 2019c, A&A, 631, A97
- Fernández-Trincado et al. (2016) Fernández-Trincado, J. G., Robin, A. C., Moreno, E., et al. 2016, ApJ, 833, 132
- Fernández-Trincado et al. (2017) Fernández-Trincado, J. G., Zamora, O., García-Hernández, D. A., et al. 2017, ApJ, 846, L2
- Fernández-Trincado et al. (2019d) Fernández-Trincado, J. G., Zamora, O., Souto, D., et al. 2019d, A&A, 627, A178
- Gaia Collaboration et al. (2018) Gaia Collaboration, Brown, A. G. A., Vallenari, A., et al. 2018, A&A, 616, A1
- García Pérez et al. (2016) García Pérez, A. E., Allende Prieto, C., Holtzman, J. A., et al. 2016, AJ, 151, 144
- Gunn et al. (2006) Gunn, J. E., Siegmund, W. A., Mannery, E. J., et al. 2006, AJ, 131, 2332
- Gustafsson et al. (2008) Gustafsson, B., Edvardsson, B., Eriksson, K., et al. 2008, A&A, 486, 951
- Hasselquist et al. (2019) Hasselquist, S., Carlin, J. L., Holtzman, J. A., et al. 2019, ApJ, 872, 58
- Holtzman et al. (2018) Holtzman, J. A., Hasselquist, S., Shetrone, M., et al. 2018, AJ, 156, 125
- Jönsson et al. (2018) Jönsson, H., Allende Prieto, C., Holtzman, J. A., et al. 2018, AJ, 156, 126
- Koppelman et al. (2019) Koppelman, H. H., Helmi, A., Massari, D., Roelenga, S., & Bastian, U. 2019, A&A, 625, A5
- Lindegren et al. (2018) Lindegren, L., Hernández, J., Bombrun, A., et al. 2018, A&A, 616, A2
- Lucey et al. (2019) Lucey, M., Hawkins, K., Ness, M., et al. 2019, MNRAS, 488, 2283
- Majewski et al. (2012) Majewski, S. R., Nidever, D. L., Smith, V. V., et al. 2012, ApJ, 747, L37
- Majewski et al. (2017) Majewski, S. R., Schiavon, R. P., Frinchaboy, P. M., et al. 2017, AJ, 154, 94
- Martell et al. (2016) Martell, S. L., Shetrone, M. D., Lucatello, S., et al. 2016, ApJ, 825, 146
- Massari et al. (2019) Massari, D., Koppelman, H. H., & Helmi, A. 2019, A&A, 630, L4
- Masseron et al. (2019) Masseron, T., García-Hernández, D. A., Mészáros, S., et al. 2019, A&A, 622, A191
- Masseron et al. (2016) Masseron, T., Merle, T., & Hawkins, K. 2016, BACCHUS: Brussels Automatic Code for Characterizing High accUracy Spectra
- Mészáros et al. (2020) Mészáros, S., Masseron, T., García-Hernández, D. A., et al. 2020, MNRAS, 492, 1641
- Meza et al. (2005) Meza, A., Navarro, J. F., Abadi, M. G., & Steinmetz, M. 2005, MNRAS, 359, 93
- Minniti (1996) Minniti, D. 1996, ApJ, 459, 175
- Naidu et al. (2020) Naidu, R. P., Conroy, C., Bonaca, A., et al. 2020, arXiv e-prints, arXiv:2006.08625
- Nataf et al. (2019) Nataf, D. M., Wyse, R. F. G., Schiavon, R. P., et al. 2019, AJ, 158, 14
- Nidever et al. (2015) Nidever, D. L., Holtzman, J. A., Allende Prieto, C., et al. 2015, AJ, 150, 173
- Queiroz et al. (2020a) Queiroz, A. B. A., Anders, F., Chiappini, C., et al. 2020a, A&A, 638, A76
- Queiroz et al. (2020b) Queiroz, A. B. A., Chiappini, C., Perez-Villegas, A., et al. 2020b, arXiv e-prints, arXiv:2007.12915
- Recio-Blanco et al. (2017) Recio-Blanco, A., Rojas-Arriagada, A., de Laverny, P., et al. 2017, A&A, 602, L14
- Rojas-Arriagada et al. (2020) Rojas-Arriagada, A., Zasowski, G., Schultheis, M., et al. 2020, arXiv e-prints, arXiv:2007.13967
- Schiavon et al. (2017) Schiavon, R. P., Zamora, O., Carrera, R., et al. 2017, MNRAS, 465, 501
- Souza et al. (2020) Souza, S. O., Kerber, L. O., Barbuy, B., et al. 2020, ApJ, 890, 38
- Wilson et al. (2019) Wilson, J. C., Hearty, F. R., Skrutskie, M. F., et al. 2019, PASP, 131, 055001
- Zoccali et al. (2008) Zoccali, M., Hill, V., Lecureur, A., et al. 2008, A&A, 486, 177
Appendix A Sample selection
APOGEE DR16 includes data taken from both the Northern and Southern Hemisphere using the APOGEE spectrographs (Wilson et al., 2019) mounted on the 2.5m Sloan Foundation telescope (Gunn et al., 2006) at Apache Point Observatory in New Mexico (APOGEE-2N: North, APO), and on the 2.5m Irénée du Pont telescope (Bowen & Vaughan, 1973) at Las Campanas Observatory (APOGEE-2S: South, LCO) in Chile. For details regarding the APOGEE atmospheric parameters analysis we direct the reader to the APOGEE Stellar Parameter and Chemical Abundances pipeline (ASPCAP: García Pérez et al., 2016), while for details about the grid of synthetic spectra and errors see Holtzman et al. (2018). We refer the reader to Nidever et al. (2015) for further details about the data reduction pipeline for APOGEE. The model grids for APOGEE DR16 are based on a complete set of MARCS (Gustafsson et al., 2008) stellar atmospheres, which are now extended to effective temperatures () as low as 3200 K.
The parent sample upon which this work is based is defined as follows. Metal-poor stars were selected from the DR16 catalogue333https://www.sdss.org/dr16/irspec/spectro_data/ that match the following criteria: (i) [Fe/H]; imposing a lower limit on metallicity, i.e., [Fe/H] , allows for the inclusion of metal-poor stars with high-quality spectra with reliable parameters and chemical abundances, while requiring stars with metallicity below [Fe/H]0.7 minimizes the presence of disc stars; (ii) stars with S/N 60 were selected, to ensure that we are selecting; spectra that have well-known uncertainties in their stellar parameters and chemical abundances, and to remove stars with lower quality spectra; (iii) 3200 K 5500 K, this temperature range ensures that stellar parameters are reliably and consistently determined, and maximizes the overall quality of the abundances considered; (iv) the estimated surface gravity ( g) must be less than 3.6, to ensure inclusion of giant and subgiant stars, which have more accurate ASPCAP-parameters than the dwarf stars with g 3.6 (due to the lack of asteroseismic surface gravities for dwarfs, only stars with g 3.6 have calibrated surface gravities); (v) ASPCAPFLAG 0; this cut ensures that there were no major flagged issues, i.e., low signal-to-noise, poor synthetic spectral fit, stellar parameters near grid boundaries, among others; and (vi) stars belonging to Galactic GCs from Mészáros et al. (2020), anomalous stars from Martell et al. (2016); Schiavon et al. (2017); Fernández-Trincado et al. (2016, 2017); Fernández-Trincado et al. (2019a, b, c, d), and stars with carbon abundances [C/Fe] (to ensure the low carbon abundances typical of GC stars) were excluded from the sample.
The final selected sample amounts to a total of 13,338 stars with high-quality parameters. We search for aluminum-enriched stars by carrying out a semi-independent stellar-abundance analysis of Al I lines by using the BACCHUS444BACCHUS: Brussels Automatic Code for Characterizing High accUracy Spectra code (Masseron et al., 2016), following the method described by Fernández-Trincado et al. (2019b).
Appendix B Basic parameters
In Table 1 we provide the abundances of C, N, O, Mg, Al, Si, Fe, and Ce for the 29 stars analysed in this work. The abundances were determined by making a careful line selection, and a line-by-line analysis in Local Thermodynamic Equilibrium (LTE) with the BACCHUS code (Masseron et al., 2016). The Teff, g, and overall metallicity ([M/H]) have been fixed, and were selected from uncalibrated ASPCAP Teff, g, and [M/H] from DR16. In addition, lines were rejected if they were found to not be well-reproduced by the synthesis, or if they were flagged as problematic by the BACCHUS pipeline. None of the 29 Al-rich star candidates exhibit particularly strong variability in its radial velocity (V km s-1) over the period ( months) of the APOGEE observations, therefore with the existing data the observed abundace anomalies could be not explained by channels invoking binary mass transfer or stellar variability. The uncertainties in the elemental abundances have been computed by adding the typical sensitivities of the abundance and the internal error in quadrature, in the same manner, as described in Fernández-Trincado et al. (2019a, b, c, d). The typical uncertainties are shown with two crossed green error bars (one per axis plotted) in Figure 1.
| APOGEE_ID | Teff | g | [M/H] | S/N | #Visits | [C/Fe] | [N/Fe] | [O/Fe] | [Mg/Fe] | [Al/Fe] | [Si/Fe] | [Fe/H] | [Ce/Fe] | ||
|---|---|---|---|---|---|---|---|---|---|---|---|---|---|---|---|
| K | km s-1 | km s-1 | pixel-1 | ||||||||||||
| 2M160359020703353 | 5095 | 2.71 | 1.34 | 0.6 | 0.13 | 147 | 6 | 0.03 | … | 0.66 | 0.18 | 0.73 | 0.33 | 1.34 | … |
| 2M173436822654206 | 4511 | 1.98 | 0.98 | 1.8 | 0.11 | 80 | 2 | … | 1.25 | 0.27 | 0.14 | 0.71 | 0.39 | 1.02 | … |
| 2M172542982106351 | 4740 | 1.89 | 1.52 | 1.1 | 0.09 | 74 | 2 | … | … | 0.76 | 0.12 | 0.94 | 0.37 | 1.62 | … |
| 2M213722381244305 | 5062 | 2.86 | 0.93 | 0.9 | 0.40 | 127 | 4 | 0.19 | … | 0.66 | 0.01 | 0.82 | 0.25 | 0.90 | … |
| 2M174615233407127 | 4559 | 1.93 | 1.22 | 1.6 | … | 84 | 1 | 0.26 | … | 0.21 | 0.14 | 0.85 | 0.34 | 1.30 | … |
| 2M173133992640506 | 3792 | 0.62 | 0.93 | 2.7 | 0.40 | 232 | 2 | 0.19 | 1.21 | 0.30 | 0.12 | 0.52 | 0.41 | 0.98 | 0.35 |
| 2M190109912121082 | 4368 | 1.39 | 1.33 | 1.7 | 0.06 | 346 | 3 | 0.46 | 1.11 | 0.22 | 0.19 | 0.68 | 0.29 | 1.34 | 0.45 |
| 2M164433293624504 | 4816 | 2.06 | 1.36 | 1.3 | 0.04 | 164 | 3 | 0.13 | … | 0.37 | 0.01 | 1.10 | 0.35 | 1.44 | … |
| 2M155356222237419 | 4284 | 1.27 | 1.26 | 1.8 | 0.15 | 177 | 2 | 0.47 | 1.05 | 0.12 | 0.15 | 0.98 | 0.34 | 1.29 | 0.47 |
| 2M150530604211466 | 4689 | 1.72 | 1.52 | 1.4 | 0.09 | 122 | 4 | 0.33 | … | 0.39 | 0.06 | 0.84 | 0.25 | 1.56 | … |
| 2M162827190050428 | 4433 | 1.95 | 1.05 | 1.9 | 0.21 | 128 | 6 | 0.02 | 0.56 | 0.35 | 0.38 | 0.82 | 0.59 | 1.07 | 0.69 |
| 2M180419153703227 | 3808 | 0.33 | 1.07 | 1.8 | 0.02 | 239 | 2 | 0.18 | 0.37 | 0.35 | 0.52 | 0.83 | 0.57 | 0.99 | 0.31 |
| 2M155323963509322 | 4766 | 2.12 | 1.53 | 0.8 | … | 89 | 1 | 0.25 | … | 0.71 | 0.20 | 0.75 | 0.34 | 1.58 | … |
| 2M174257672803437 | 4569 | 1.96 | 0.85 | 2.9 | 0.39 | 92 | 2 | 0.17 | 1.46 | 0.20 | … | 0.93 | 0.34 | 0.94 | 0.69 |
| 2M184901143042332 | 4426 | 1.79 | 0.96 | 2.1 | … | 159 | 1 | 0.29 | 1.03 | 0.14 | 0.13 | 0.74 | 0.27 | 0.97 | 0.33 |
| 2M160554353003432 | 4469 | 1.34 | 1.65 | 1.8 | 0.08 | 185 | 2 | 0.38 | … | 0.37 | 0.09 | 0.73 | 0.30 | 1.68 | … |
| 2M172542421331201 | 4485 | 1.99 | 0.97 | 2.1 | 0.08 | 256 | 3 | 0.51 | 1.55 | 0.17 | 0.05 | 0.89 | 0.33 | 0.99 | 0.40 |
| 2M185246182520372 | 4518 | 2.07 | 1.02 | 1.5 | … | 70 | 1 | 0.34 | 1.14 | 0.24 | 0.18 | 0.72 | 0.44 | 1.02 | … |
| 2M140635452734116 | 4859 | 2.17 | 1.32 | 1.8 | 0.28 | 74 | 6 | … | … | 0.61 | 0.13 | 0.61 | 0.23 | 1.34 | … |
| 2M161022182158014 | 4342 | 1.55 | 1.24 | 2.1 | … | 326 | 1 | 0.72 | 1.39 | 0.22 | 0.08 | 0.74 | 0.35 | 1.26 | 0.37 |
| 2M025935711731458 | 4472 | 2.09 | 0.96 | 1.3 | 0.46 | 87 | 3 | 0.12 | 0.23 | 0.37 | 0.32 | 0.64 | 0.58 | 0.92 | 0.49 |
| 2M220151981141479 | 4269 | 1.57 | 1.25 | 1.8 | 0.15 | 279 | 3 | 0.44 | 1.01 | 0.19 | 0.07 | 0.75 | 0.39 | 1.23 | 0.24 |
| 2M161129352000538 | 4871 | 2.35 | 1.20 | 1.1 | … | 117 | 1 | 0.23 | 1.46 | 0.60 | 0.04 | 1.12 | 0.43 | 1.26 | … |
| 2M065726975543115 | 4776 | 2.22 | 1.21 | 1.2 | 0.02 | 446 | 3 | 0.73 | … | 0.20 | 0.05 | 0.93 | 0.33 | 1.22 | 0.25 |
| 2M174312622843363 | 4149 | 0.16 | 0.72 | 2.0 | … | 115 | 1 | 0.39 | 1.41 | 0.12 | … | 1.55 | 0.33 | 0.76 | 0.39 |
| 2M174757632913591 | 3837 | 0.06 | 1.04 | 2.0 | … | 100 | 1 | 0.52 | 1.69 | 0.30 | 0.28 | 1.44 | 0.51 | 0.98 | 0.36 |
| 2M174807992712083 | 3913 | 1.11 | 0.74 | 2.9 | … | 90 | 1 | 0.28 | 1.35 | 0.25 | 0.07 | 0.50 | 0.38 | 0.87 | 0.50 |
| 2M174845442915516 | 4241 | 1.53 | 0.82 | 2.9 | 0.02 | 81 | 2 | 0.01 | 0.97 | 0.08 | … | 0.91 | 0.28 | 0.90 | 0.73 |
| 2M180350172552334 | 4190 | 1.59 | 0.88 | 2.3 | … | 137 | 1 | 0.39 | 1.48 | 0.17 | 0.02 | 0.98 | 0.36 | 0.90 | 0.50 |
Appendix C Galactic orbits
The basic kinematic parameters for the 29 stars and their respective orbital elements are listed in Table 2. Since the true Galactic potential is not accurately known in the inner Galaxy, and the results of our simulations may depend significantly on the assumed parameters, we also run the simulations with a slow and fast rotating bar, i.e., 31 km s-1 and 51 km s-1, respectively, and see how it affects the derived orbital parameters of the stars. The value inside parentheses in Table 2 show the effects in the orbital elements by adopting different angular velocity for the Galactic bar. The individual variations are within typical errors of the ensemble of orbits with km s-1, which do not change the overall results from our sample.
| APOGEE_ID | RUWE | RV | —Z—max | eccentricity | |||||||
|---|---|---|---|---|---|---|---|---|---|---|---|
| kpc | km s-1 | mas yr-1 | mas yr-1 | kpc | kpc | kpc | km s-1 kpc | km s-1 kpc | |||
| 2M160359020703353 | 1.06 | 3.70.4 | 33.5 | 10.280.04 | 6.170.03 | 0.760.47 (0.58) | 5.920.33 (0.49) | 4.550.51 (0.53) | 0.770.12 (0.12) | 44.014.0(14.40) | 19.514.5(16.59) |
| 2M173436822654206 | 0.96 | 6.50.9 | 61.9 | 10.140.18 | 1.710.15 | 0.030.16 (0.26) | 2.240.48 (0.65) | 2.200.23 (0.23) | 0.960.08 (0.11) | 11.010.5(14.09) | 5.014.0(13.01) |
| 2M172542982106351 | 0.96 | 7.00.9 | 146.0 | 7.650.08 | 3.630.06 | 0.050.21 (0.19) | 2.850.67 (0.67) | 2.140.13 (0.22) | 0.960.10 (0.09) | 25.0 9.5(10.46) | 6.013.5( 9.03) |
| 2M213722381244305 | 0.90 | 1.90.1 | 85.7 | 7.590.03 | 27.140.04 | 1.520.08 (0.20) | 10.280.37 (0.45) | 3.480.33 (0.63) | 0.740.02 (0.03) | 72.0 3.5( 4.94) | 57.0 2.0( 7.84) |
| 2M174615233407127 | 0.87 | 5.20.7 | 97.9 | 6.020.07 | 7.090.05 | 0.030.05 (0.14) | 3.190.69 (0.77) | 1.170.38 (0.51) | 0.970.03 (0.05) | 21.0 7.0(13.95) | 10.0 9.0( 9.67) |
| 2M173133992640506 | 0.88 | 6.50.8 | 74.9 | 4.480.22 | 7.180.15 | 0.020.01 (0.07) | 1.670.73 (0.70) | 0.620.11 (0.17) | 0.970.01 (0.04) | 18.011.0(11.83) | 5.0 3.5( 3.83) |
| 2M190109912121082 | 0.99 | 5.50.7 | 9.7 | 3.970.08 | 12.410.06 | 0.030.04 (0.08) | 3.930.30 (0.35) | 2.470.40 (0.52) | 0.980.02 (0.03) | 6.0 8.5( 9.55) | 17.0 9.5( 9.05) |
| 2M164433293624504 | 1.12 | 6.00.7 | 250.3 | 3.280.02 | 2.500.03 | 0.490.17 (0.21) | 7.570.40 (0.71) | 6.940.21 (0.95) | 0.870.03 (0.04) | 14.0 6.0(10.90) | 42.0 9.5(12.24) |
| 2M155356222237419 | 1.11 | 6.10.7 | 96.9 | 3.130.04 | 2.460.04 | 1.030.36 (0.41) | 7.330.57 (0.40) | 5.590.57 (0.63) | 0.760.07 (0.08) | 60.015.5(12.93) | 29.011.0(11.79) |
| 2M150530604211466 | 0.98 | 10.11.2 | 228.2 | 2.940.02 | 1.500.03 | 0.440.39 (0.32) | 12.250.53 (0.88) | 12.320.59 (0.68) | 0.920.05 (0.04) | 10.019.0(15.83) | 23.017.5(15.33) |
| 2M162827190050428 | 1.06 | 7.91.0 | 12.5 | 2.690.07 | 4.510.03 | 0.310.21 (0.25) | 5.180.76 (0.64) | 4.100.48 (0.53) | 0.880.07 (0.09) | 35.012.0( 9.27) | 4.0 5.5( 6.95) |
| 2M180419153703227 | 1.01 | 10.80.4 | 11.0 | 2.610.08 | 5.730.06 | 0.230.13 (0.25) | 3.420.35 (0.47) | 1.790.27 (0.22) | 0.870.06 (0.10) | 35.0 5.0(10.85) | 5.0 4.5( 8.41) |
| 2M155323963509322 | 1.03 | 5.60.7 | 208.1 | 1.650.05 | 7.390.03 | 0.040.03 (0.42) | 6.700.58 (1.00) | 2.580.32 (0.44) | 0.980.00 (0.15) | 11.011.0(18.76) | 30.012.5(12.58) |
| 2M174257672803437 | 1.16 | 6.51.2 | 57.4 | 1.330.47 | 5.050.34 | 0.170.22 (0.37) | 1.681.04 (1.00) | 0.240.07 (0.10) | 0.790.11 (0.13) | 22.023.0(21.86) | 3.0 6.5(11.14) |
| 2M184901143042332 | 1.10 | 5.30.6 | 136.9 | 1.150.03 | 7.290.03 | 0.040.23 (0.22) | 3.590.61 (0.58) | 2.170.28 (0.26) | 0.970.08 (0.08) | 30.016.5(13.22) | 3.016.0(12.72) |
| 2M160554353003432 | 0.98 | 6.10.7 | 259.0 | 0.440.04 | 3.070.05 | 1.090.35 (0.36) | 13.810.90 (1.13) | 14.061.09 (1.29) | 0.850.05 (0.05) | 33.012.0(11.74) | 31.010.5(11.17) |
| 2M172542421331201 | 0.90 | 4.50.5 | 7.9 | 0.400.05 | 5.350.04 | 1.060.13 (0.45) | 4.040.35 (0.35) | 1.220.16 (0.20) | 0.570.03 (0.10) | 68.015.5(11.73) | 30.0 4.5(11.90) |
| 2M185246182520372 | 1.00 | 6.60.8 | 19.1 | 0.060.07 | 5.250.06 | 0.350.32 (0.28) | 2.660.36 (0.31) | 1.550.16 (0.18) | 0.760.18 (0.15) | 31.011.5(10.93) | 8.010.5(10.89) |
| 2M140635452734116 | 0.91 | 11.01.1 | 160.0 | 0.230.05 | 3.170.05 | 2.200.19 (0.21) | 16.791.42 (1.33) | 15.171.55 (1.50) | 0.770.03 (0.03) | 85.0 5.0( 6.11) | 79.0 5.0( 5.99) |
| 2M161022182158014 | 1.13 | 3.00.4 | 153.2 | 0.850.10 | 4.730.07 | 1.600.70 (0.51) | 9.190.85 (0.69) | 2.310.13 (0.40) | 0.670.08 (0.06) | 111.013.5(12.07) | 55.022.0(17.38) |
| 2M025935711731458 | 1.00 | 7.50.6 | 327.7 | 2.390.04 | 1.500.05 | 3.240.17 (0.16) | 30.910.74 (0.71) | 25.880.91 (0.99) | 0.810.01 (0.01) | 137.0 5.0( 5.10) | 135.0 5.5( 5.39) |
| 2M220151981141479 | 0.98 | 5.40.6 | 76.4 | 3.270.07 | 3.020.07 | 1.270.27 (0.41) | 8.350.25 (0.37) | 5.210.84 (0.82) | 0.730.04 (0.07) | 70.015.0(14.83) | 37.0 8.0(12.60) |
| 2M161129352000538 | 1.08 | 5.41.0 | 44.0 | 3.990.08 | 9.610.05 | 0.750.57 (0.63) | 7.480.61 (0.93) | 5.021.48 (1.73) | 0.810.13 (0.13) | 41.023.0(22.97) | 23.021.5(22.53) |
| 2M065726975543115 | 0.96 | 2.10.2 | 239.3 | 10.030.06 | 14.920.05 | 0.550.23 (0.26) | 14.760.96 (0.84) | 2.420.65 (0.86) | 0.920.03 (0.03) | 41.0 8.0(15.33) | 23.012.5(18.93) |
| 2M174312622843363 | … | … | 1.2 | … | … | … | … | … | … | … | … |
| 2M174757632913591 | … | … | 114.1 | … | … | … | … | … | … | … | … |
| 2M174807992712083 | … | … | 24.1 | … | … | … | … | … | … | … | … |
| 2M174845442915516 | … | … | 218.7 | … | … | … | … | … | … | … | … |
| 2M180350172552334 | … | … | 153.8 | … | … | … | … | … | … | … | … |
We used the GravPot16555https://gravpot.utinam.cnrs.fr model to study the orbital history of our sample. The orbital integration scheme follows the methodology introduced in Fernández-Trincado et al. (2020), except for the angular velocity of the bar, for which we adopted km s-1 kpc-1 (see, e.g., Bovy et al., 2019). The model has been rescaled to the Sun’s Galactocentric distance, 8 kpc, and the velocity of the Local Standard of Rest, km s-1.
For each star, we integrated an ensemble of orbits over a 2 Gyr timespan. The uncertainties in the input data were randomly propagated as 1 variations in a Gaussian Monte Carlo re-sampling (e.g., Fernández-Trincado et al., 2020). The resulting values were estimated as the median of a thousand realizations, and the error distributions by finding the 16th and 84th percentiles. In addition, we also obtained the change in the orbital elements when the bar angular velocity is varied by km s-1 kpc (values inside parentheses in Table 2). Figure 2 follows the orbital elements of our sample.
We use the APOGEE DR16 distances deduced from the StarHorse code (Queiroz et al., 2020b, a), radial velocities from the APOGEE survey, and absolute proper motions from the Gaia DR2 catalog (Gaia Collaboration et al., 2018). Only sources with ’good’ astrometry were considered in our orbit computations, i.e., stars with Renormalized Unit Weight Error, RUWE 1.4 (see, e.g., Lindegren et al., 2018). A total of 24 out of 29 stars in our sample meet this criterion.

Appendix D Comparisons to ASPCAP
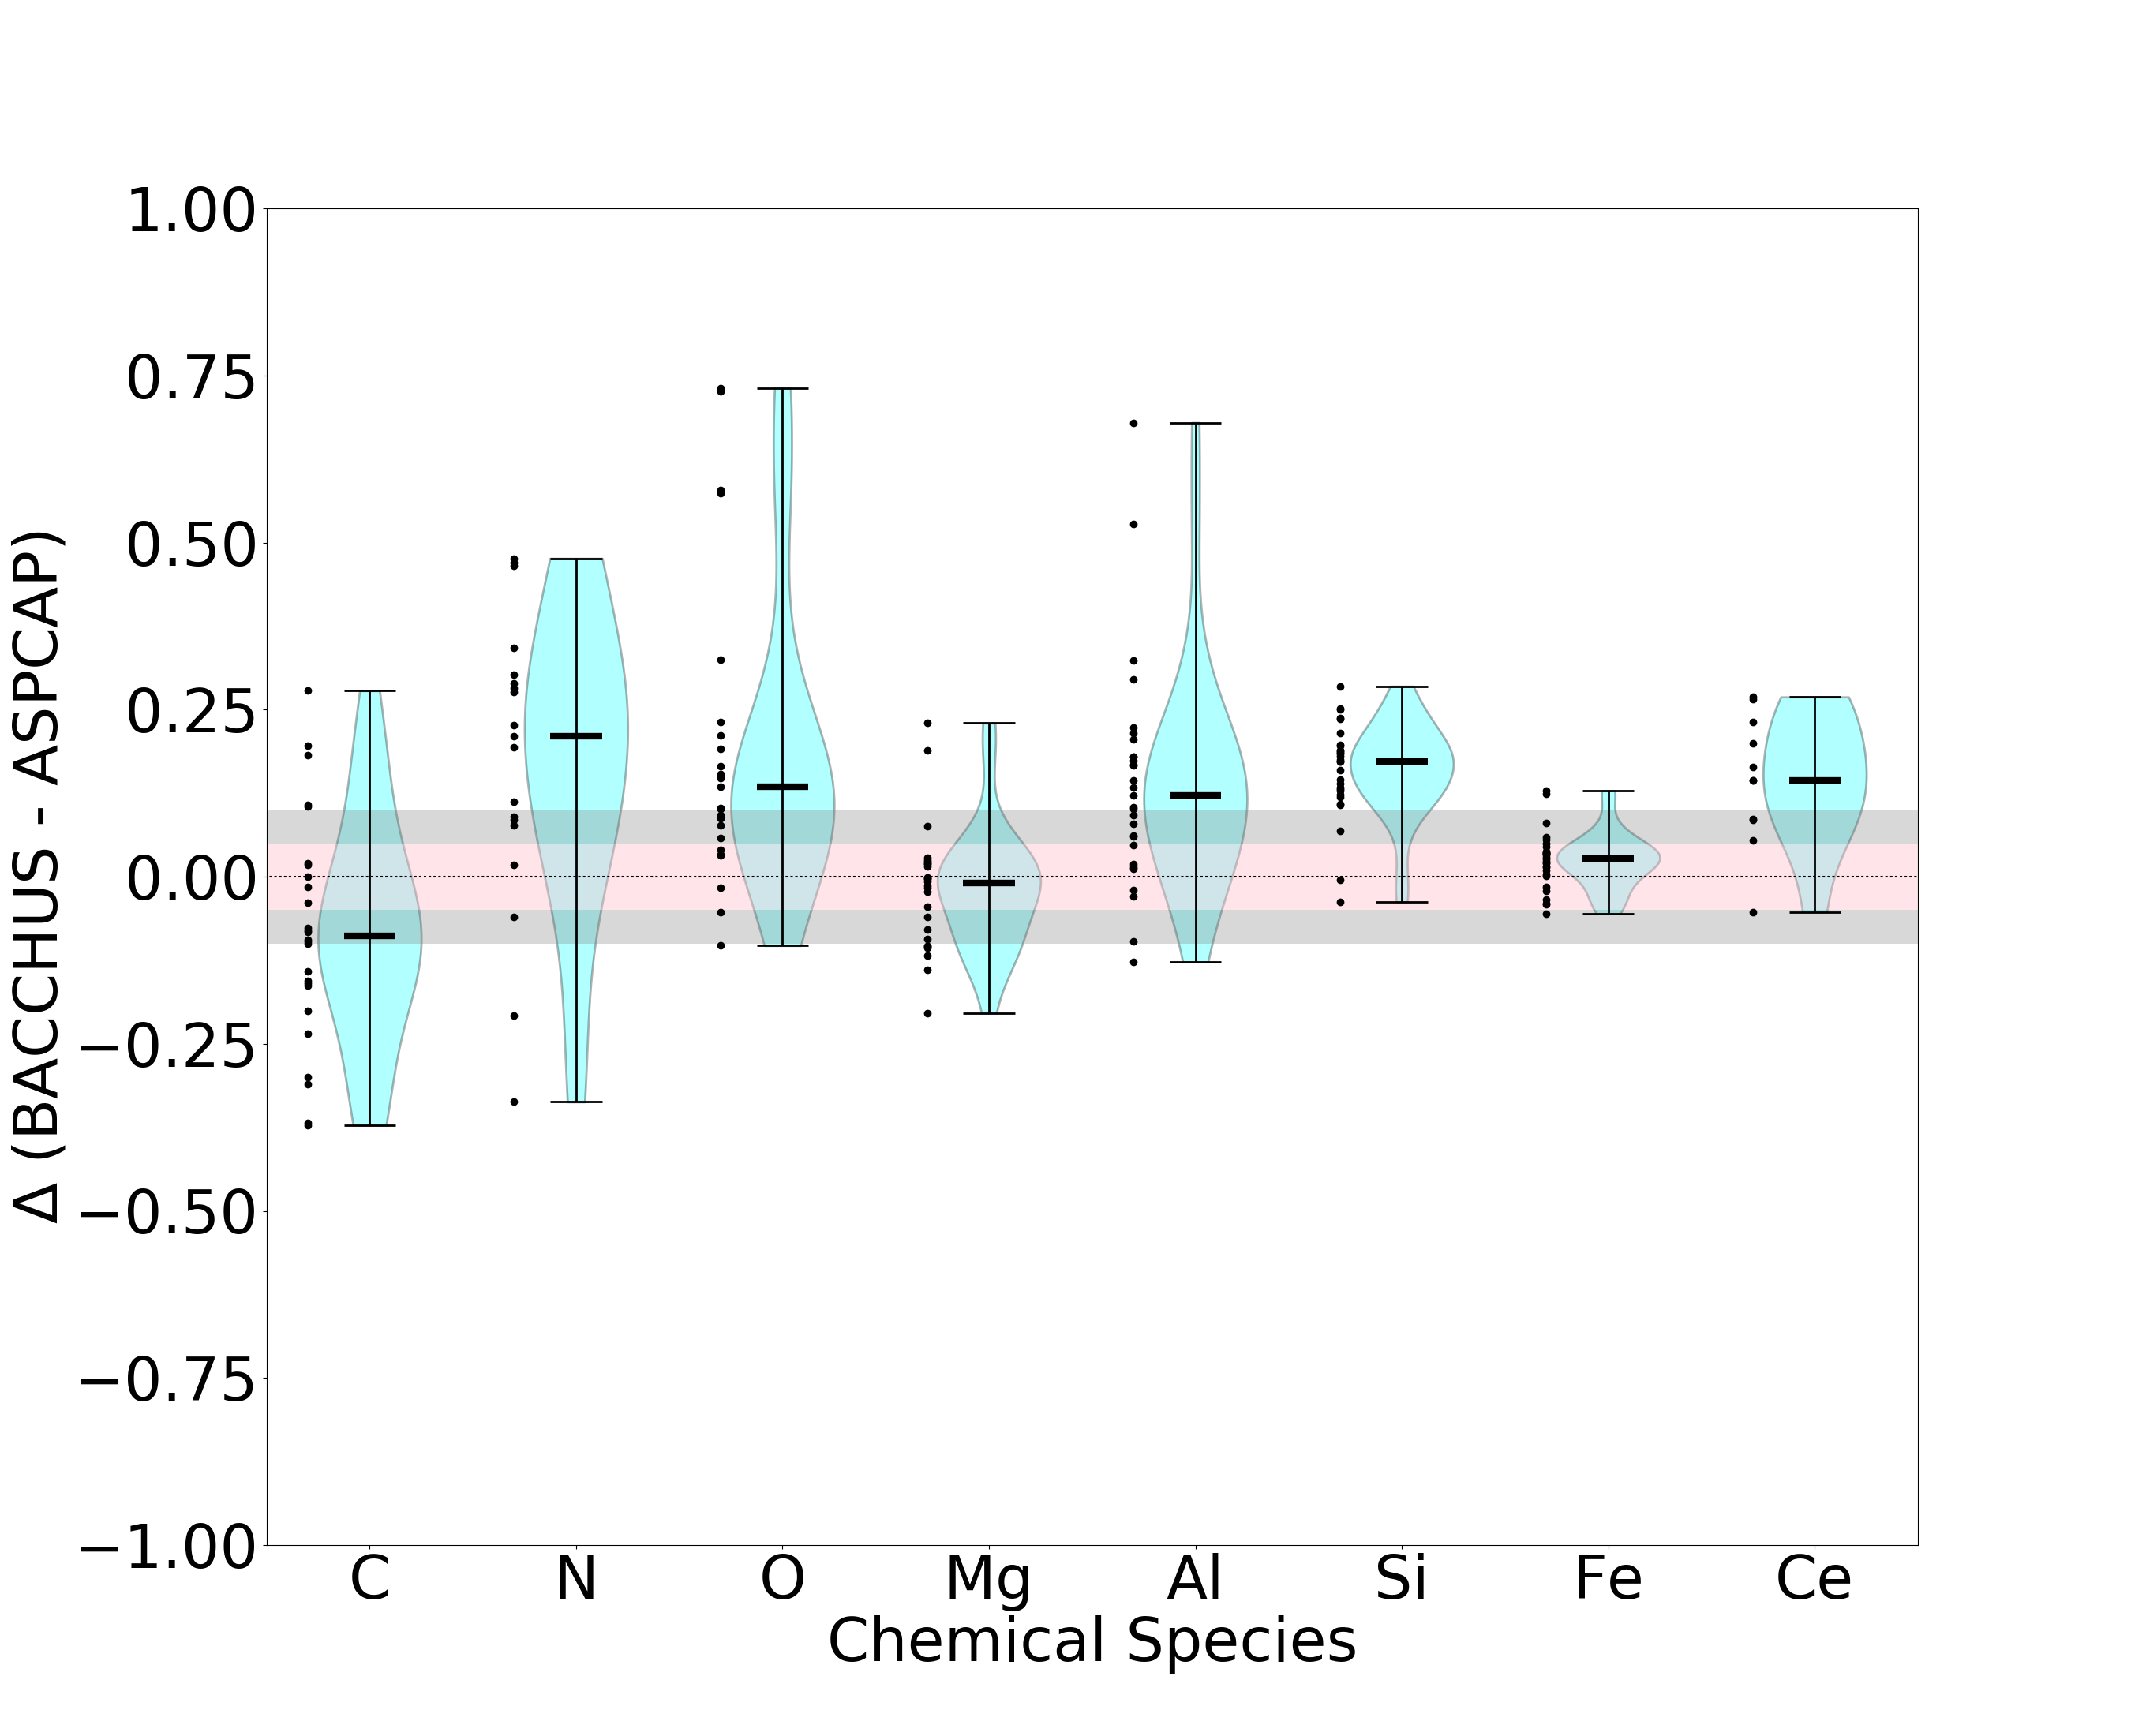
Figure 4 we compares our abundance determinations with those of APOGEE DR16 (Ahumada et al., 2020). The differences are shown as a density estimation in a violin representation, whereby the median, min, and max of the differences of each chemical species are marked. We find that the [Fe/H] metallicities we derive are in excellent agreement with ASPCAP pipeline, with a median distribution slightly higher than the reported by DR16, but within the typical error ( dex) determined by the ASPCAP pipeline. Furthermore, this indicates that we reproduce the precision of the ASPCAP pipeline for the iron lines. However, there are significant differences in the range of certain abundance ratios comparing BACCHUS to ASPCAP. For example, [N, O, Al, Si, Ce/Fe] ratios derived with BACCHUS are 0.1–0.75 dex higher than the ASPCAP values, while [O, Mg/Fe] are 0.05–0.4 dex lower than ASPCAP determinations, possibly due to some issues with the accuracy (zero-point) of ASPCAP abundances, limits of the model grid (Jönsson et al., 2018), and/or the difficulty of fitting lines where the intensity is comparable to the variance. For a more detailed discussion, we refer the reader to Masseron et al. (2019). While the ASPCAP pipeline uses a global fit to the continuum in the three detector chips independently, the BACCHUS pipeline places the pseudo-continuum in a region around the lines of interest. We believe that our manual method is more reliable, since it avoids possible shifts in the continuum location due to imperfections in the spectral subtraction along the full spectral range.
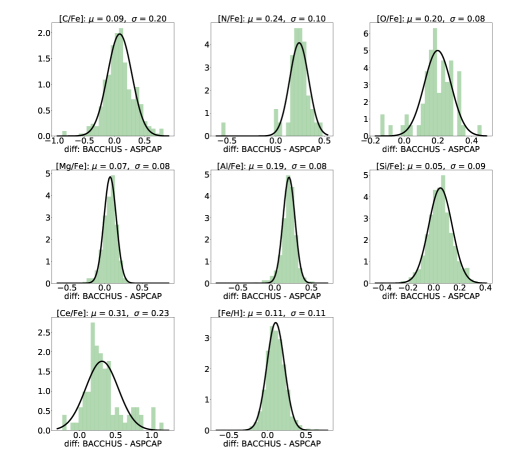
Figure 5 shows the typical offset of each chemical species between the BACCHUS and ASPCAP pipeline for a control sample of 1,000 metal-poor stars ([Fe/H]) belonging to the main components of the MW (halo, disk, and bulge). We find that ASPCAP significantly underestimates most of the chemical species by about 0.1 to 0.3 dex for most of the metal-poor stars (although see Nataf et al., 2019, for an alternative view). Such offsets were taken into consideration for the whole MW stars presented in Figure 1.
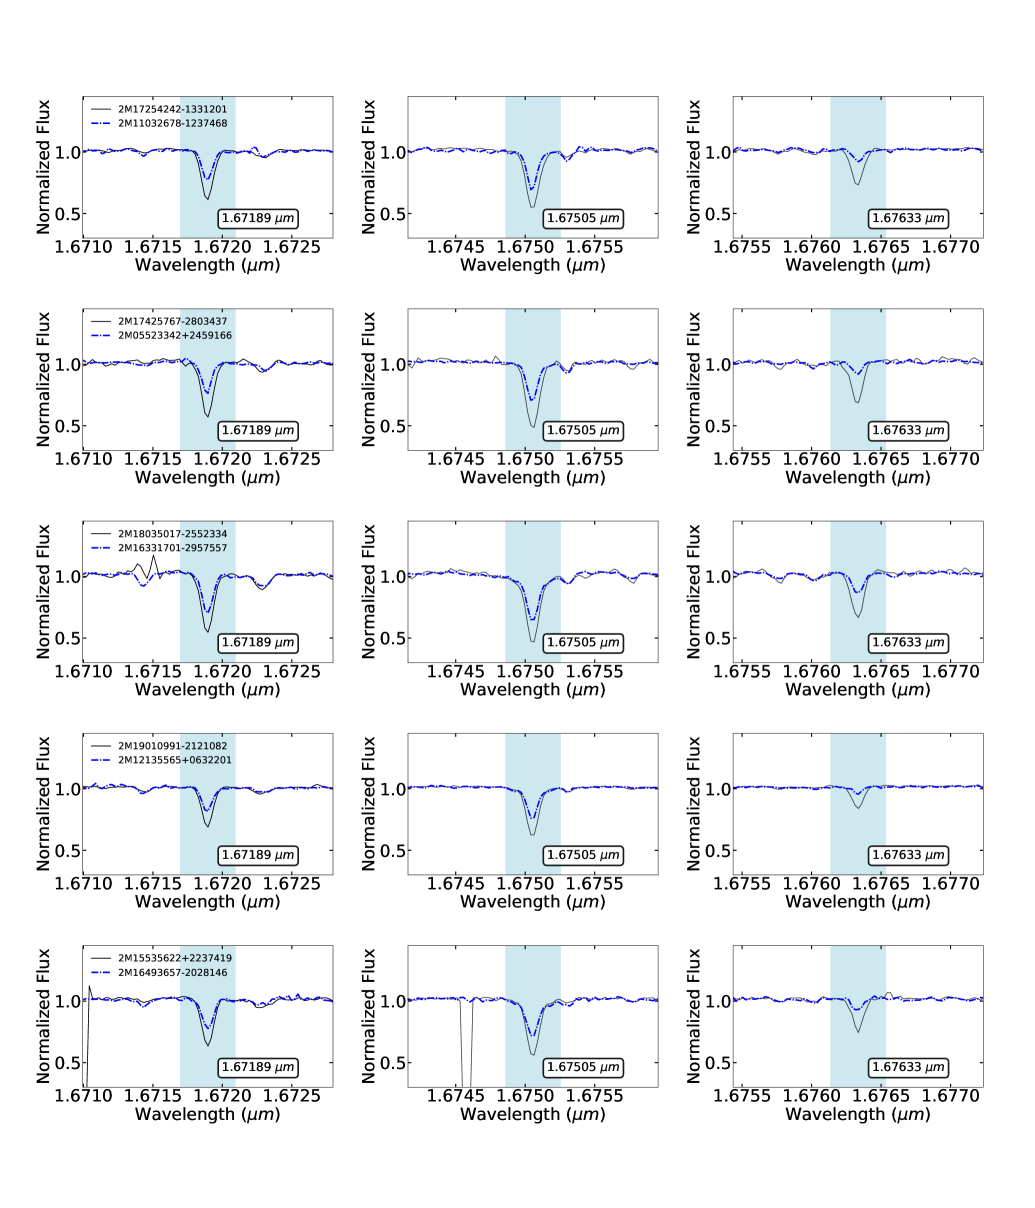
Appendix E Al I features
Figure 6 provides a brief examination of typical H-band spectra for five Al-rich stars and Al-normal stars that exhibit clear Al I spectral absorption features. This figure reassures us of the existence of a real chemical peculiarity in the rich stars. The spectra of these stars are compared in a wavelength range containing several Al I lines, i.e., at 1.67189, 1.67505 and 1.67633 m, which are indicated by the cyan shadow region. The Al-rich stars have remarkably stronger Al I lines, compared to Al-normal stars with the same atmospheric parameters. This can only be attributed to a difference in aluminum abundance.