Spectral energy distributions of dust and PAHs based on the evolution of grain size distribution in galaxies
Abstract
Based on a one-zone evolution model of grain size distribution in a galaxy, we calculate the evolution of infrared spectral energy distribution (SED), considering silicate, carbonaceous dust, and polycyclic aromatic hydrocarbons (PAHs). The dense gas fraction () of the interstellar medium (ISM), the star formation time-scale (), and the interstellar radiation field intensity normalized to the Milky Way value () are the main parameters. We find that the SED shape generally has weak mid-infrared (MIR) emission in the early phase of galaxy evolution because the dust abundance is dominated by large grains. At an intermediate stage ( Gyr for Gyr), the MIR emission grows rapidly because the abundance of small grains increases drastically by the accretion of gas-phase metals. We also compare our results with observational data of nearby and high-redshift () galaxies taken by Spitzer. We broadly reproduce the flux ratios in various bands as a function of metallicity. We find that small (i.e. the ISM dominated by the diffuse phase) is favoured to reproduce the 8 intensity dominated by PAHs both for the nearby and the samples. A long raises the 8 emission to a level consistent with the nearby low-metallicity galaxies. The broad match between the theoretical calculations and the observations supports our understanding of the grain size distribution, but the importance of the diffuse ISM for the PAH emission implies the necessity of spatially resolved treatment for the ISM.
keywords:
dust, extinction – galaxies: evolution – galaxies: high-redshift – galaxies: ISM – galaxies: star formation – infrared: galaxies1 Introduction
Dust grains in the interstellar medium (ISM) absorb the ultraviolet (UV) and optical light and reprocess it in the infrared (IR). Thus, IR emission from dust is an important tracer of the star formation activities in galaxies, if the interstellar radiation field (ISRF) is dominated by young stars (e.g. Buat & Xu, 1996; Inoue et al., 2000). The star formation activities traced in the IR are important because starbursting galaxies often emit most of the light in the IR (e.g. Sanders & Mirabel, 1996) and the contribution from such IR-luminous population to the total star formation rate in the Universe increases with redshift, at least up to , where is the redshift (e.g. Le Floc’h et al., 2005; Pérez-González et al., 2005). As a consequence, the fraction of star formation activities only traced by dust emission increases towards high redshift (e.g. Takeuchi et al., 2005; Goto et al., 2010; Burgarella et al., 2013).
To understand the nature of IR emission from galaxies, it is crucial to clarify the dust properties, such as the composition and the grain size distribution. The emissivity in the IR regime also depends on the dust temperature, which reflects the ISRF intensity from stellar UV–optical emission (e.g. Li & Draine, 2001). There are some detailed modeling efforts for the spectral energy distributions (SEDs) of dust emission that are well examined or calibrated by the observed SEDs of the Milky Way and nearby galaxies (Désert et al. 1990; Dwek et al. 1997; Draine & Li 2007, hereafter DL07; Compiègne et al. 2011; Jones et al. 2017; Galliano et al. 2018). Some studies have constructed an SED model in a consistent manner with the stellar spectral synthesis (e.g. Silva et al., 1998; Takagi et al., 2003; Noll et al., 2009) and some have further calculated the evolution of SED in galaxy evolution models (e.g. Granato et al., 2000). Some recent hydrodynamic simulations of galaxies are processed to calculate the evolution of dust emission SEDs by solving radiation transfer under the theoretically predicted spatial distribution of dust (e.g. Yajima et al., 2015; McAlpine et al., 2019). Analytic modelling of galactic structures is also useful to calculate the emergent SEDs (e.g. Bianchi et al., 2000; Popescu et al., 2011).
Some of the SED models above took into account prominent emission features in the mid-IR (MIR), which could give us a clue to the understanding of grain compositions and grain size distributions. MIR emission originates mainly from transiently (or stochastically) heated small grains, whose temperature responds to individual photon energy inputs because of their small heat capacities and rare encounters with photons (Draine & Anderson, 1985). On the other hand, far-IR (FIR) emission is usually dominated by large (mainly sub-micron-sized) grains which are in radiative equilibrium. The most prominent features in the MIR regime are considered to be caused by polycyclic aromatic hydrocarbons (PAHs) (Leger & Puget, 1984; Allamandola et al., 1985; Tielens, 2008; Li & Draine, 2012), although there are other possible material candidates such as hydrogenated amorphous carbons (HACs; Duley et al. 1993), quenched carbonaceous composite (Sakata et al., 1984), and mixed aromatic/aliphatic organic nanoparticles (Kwok & Zhang, 2011). In this paper, we refer to these MIR features as the PAH features, and assume that they originate from aromatic structures of carbonaceous materials (not necessarily in exact PAH forms). Silicate grains also show spectral features at 9.7 and 18 , corresponding to the Si–O stretching and O–Si–O bending mode, respectively (Evans, 1994). The above features give us clues to the grain compositions, which would be difficult to infer from a featureless SED at FIR wavelengths.111The MIR and FIR wavelength ranges have no rigid definition, but they are roughly 3–60 and 60–300 , respectively, in this paper.
Among various features, prominent PAH features could be used to trace various aspects of galaxy evolution. Some studies suggest that PAH emission is a useful indicator of the star formation rate (Förster Schreiber et al., 2004; Peeters et al., 2004). PAHs also potentially trace the enrichment of carbonaceous materials. The strong metallicity dependence of the PAH feature strength (e.g. Engelbracht et al., 2005; Draine et al., 2007; Galliano et al., 2008; Hunt et al., 2010; Ciesla et al., 2014) indicates a strong link between the enrichment of PAHs and the evolution of galaxies. Destruction in supernova (SN) shocks (O’Halloran et al., 2006) and photo-destruction by UV irradiation (Madden, 2000; Plante & Sauvage, 2002; Madden et al., 2006; Wu et al., 2006; Hunt et al., 2010; Khramtsova et al., 2013) could be important to produce the metallicity dependence, but the microprocesses and efficiencies of PAH destruction in low-metallicity environments are still being debated (Sandstrom et al., 2012).
Some theoretical models succeeded in explaining the strong metallicity dependence of PAH abundance on metallicity using macroscopic dust enrichment scenarios. Galliano et al. (2008) suggested that typical stellar ages of low-metallicity galaxies are too young for low-mass stars to evolve into asymptotic giant branch (AGB) stars, which could be the source of PAHs (see also Bekki, 2013). However, low-metallicity galaxies may contain old stellar populations; thus, the metallicity may not be simply related to the galaxy age (e.g. Kunth & Östlin, 2000). Seok et al. (2014) modelled the metallicity dependence of PAH abundance by assuming that the production of small grains by shattering in the ISM is the source of PAHs. Their model naturally explains the relation between PAH abundance and metallicity because the shattering efficiency depends strongly on the metallicity (or the dust abundance). Rau et al. (2019) and Hirashita & Murga (2020, hereafter HM20) directly calculated the evolution of grain size distribution and the transition from aliphatic to aromatic carbonaceous grains by post-processing hydrodynamic simulation data in Aoyama et al. (2019) (see also Hou et al., 2017) and by using a one-zone model, respectively. They regarded small aromatic grains as PAHs. As a consequence of their modelling, they successfully explained the relation between PAH abundance and metallicity in nearby galaxies. They also reproduced the observed non-linear metallicity dependence of PAH abundance because of the strong metallicity dependence of small-grain production by shattering and accretion in their model. HM20 further predicted extinction curves and showed that it is possible to reproduce the Milky Way extinction curve by assuming the aromatic grains to be the carriers of the 2175 Å bump. In HM20, the grain size distribution tends to converge to a shape similar to the Mathis et al. (1977, MRN) distribution, which is known to reproduce the the Milky Way extinction curve, and the fraction of carbonaceous dust increases in later epochs because of carbon production by AGB stars.
The above models including the most recent one of ours mainly focused on the abundances of dust and PAHs. Now it is interesting to extend the models to predict dust/PAH emission SEDs, which are directly observed. Indeed, SEDs could be used to test the dust evolution models that incorporate grain size distributions and dust compositions. Emissions at different wavelengths are dominated by different kinds of dust (e.g. Li & Draine, 2001; Compiègne et al., 2011). Large and small grains222The rigid boundary between large and small grains is difficult to define, but it is roughly around grain radius in this paper. contribute mainly to the FIR and MIR emission, respectively, as mentioned above. The dependence of SEDs on the grain radius and the grain composition is suitable for testing our dust evolution model (especially HM20). The usefulness of observed SEDs in constraining the evolution of grain size distribution is demonstrated by Relaño et al. (2020) using the simulation results in Hou et al. (2017, 2019). Thus, the main goal of this paper is to develop the dust emission SED model based on the grain size distributions given by HM20. This step will serve to test our theoretical understanding of dust evolution against the observed emission properties.
The SED model developed in this paper could also be useful to extract information on the evolution of galaxy and dust/PAHs. In particular, we may be able to apply the model to high-redshift PAH emission to obtain a clue to galaxy evolution. Some IR space telescopes such as Spitzer and AKARI have photometric bands sensitive to PAH emission at various redshifts up to (e.g. Shivaei et al., 2017; Kim et al., 2019). We could also predict the expected PAH emission luminosity at higher redshifts that is accessible by the current facilities using the model developed in this paper.
This paper is organized as follows. In Section 2, we describe the SED model for dust emission based on the dust evolution calculations in MH20. In Section 3, we show the results, which are compared with nearby galaxy data. In Section 4, we provide some extended discussions, especially regarding the PAH optical properties and the application to high-redshift galaxies. In Section 5, we give the conclusion of this paper. We focus on the IR wavelength range, so that we simply refer to the IR SED as the SED.
2 Model
We calculate the SEDs of dust and PAHs based on the galaxy evolution model developed in our previous paper (HM20). The model predicts the grain size distribution and the grain composition (silicate, aromatic carbon, and non-aromatic carbon) in a manner consistent with the chemical enrichment and dust processing in the galaxy. We utilize the grain size distribution of each composition to calculate the emission SED using Draine & Li (2001)’s method. We review these frameworks and explain the key physical parameters.
2.1 Chemical enrichment
The enrichment of the galaxy with metals is treated using a chemical evolution model. We treat the galaxy as a one-zone closed box. We adopt the star formation rate as a function of time as , where we give the decaying time-scale of star formation rate, (referred to as the star formation time-scale), as a free parameter. Based on this model, we calculate the metal and dust enrichment by stars (SNe and AGB stars). We also compute the metallicity and the silicon and carbon abundances. The metal and dust yields in the literature are adopted (see HM20 for the references). We also calculate the SN rate (denoted as ) by assuming that stars in a mass range of 8–40 M☉ end their lives as SNe. We adopt the Chabrier initial mass function (Chabrier, 2003) with a stellar mass range of 0.1–100 M☉.
2.2 Grain size distribution of various components
The HM20 model computes the evolution of grain size distribution as formulated by Hirashita & Aoyama (2019). The formulation was based on Asano et al. (2013b) and Nozawa et al. (2015). It also calculates the evolution of the fraction of various dust components (silicate, aromatic carbon, and non-aromatic carbon). We only review the outline and refer the interested reader to HM20 for further details.
The grain size distribution as a function of grain radius is denoted as ( distinguishes the dust compositions), and is defined such that is the number density of grains with radii between and . The grain mass, , is related to as , where is the grain material density (we assume that g cm-3, which is appropriate for graphite, in the calculation of grain size distribution.). To avoid the complexity arising from the collisions among different dust species, we calculate the evolution of grain size distribution without distinguishing the species. Here we represent the dust properties by those of graphite following HM20. HM20 also showed that adopting silicate properties instead does not alter the resulting evolutionary behaviour of grain size distributions except for some detailed changes in the efficiencies of shattering and coagulation. These details are not important for our conclusions. We note that, for the purpose of calculating the SED, we do consider the difference in the grain species by decomposing the resulting grain size distributions into multiple components as explained later.
We calculate the evolution of grain size distribution by considering the following processes: dust production by stars (SNe and AGB stars), dust destruction by SN shocks sweeping the ISM, dust growth by the accretion of gas-phase metals in the dense ISM, grain growth by coagulation (grain–grain sticking) in the dense ISM and grain disruption by shattering (fragmentation) in the diffuse ISM. The dust enrichment by stars is calculated in the chemical evolution model described in Section 2.1, and the produced dust by stellar sources is distributed in each grain radius bin by assuming the lognormal grain size distribution centred at 0.1 with a standard deviation of 0.47 (Asano et al., 2013b).
Since accretion and coagulation occur only in the dense ISM and shattering takes place only in the diffuse ISM, we need to specify the mass fraction of the dense ISM, (the diffuse ISM occupies the rest, ). We assume that the diffuse and dense ISM components have and , respectively, where is the hydrogen number density and is the gas temperature. It is likely that changes as the galaxy evolves. Indeed, there is an indication that the relative weight of the dust emission from the dense and diffuse media changes with star formation activities (or galaxy evolution) (da Cunha et al., 2010). Since what regulates the evolution of is not fully understood, we simply treat as a constant free parameter following HM20. This simple treatment is useful in making the effect of easy to interpret.
As mentioned above, the calculated grain size distribution does not distinguish the grain compositions but represent the total grain size distribution. Thus, we separate the grain size distribution into silicate and carbonaceous grains in a manner consistent with the abundance ratio of Si to C at each age. This is necessary to calculate the SED, which depends strongly on the grain species. The mass fraction of silicate to the total dust is denoted as , and we assume that the material density for silicate is g cm-3. We further divide the carbonaceous component into aromatic and non-aromatic species. In our model, small aromatic carbonaceous grains (typically –50 Å) represent PAHs (note that that 3 Å is the minimum radius of the grains assumed in the model). We define the aromatic fraction, , as the fraction of the aromatic carbonaceous grains to the total carbonaceous grains at each grain radius . We assume that aromatization and aliphatization, whose rates are given in HM20 (based on Murga et al., 2019), occur in the diffuse and dense ISM, respectively (we include aromatization by UV irradiation and SN shocks, and aliphatization by hydrogen attachment and metal accretion). As shown by HM20, in most of the relevant grain radius range as a result of equilibrium between aromatization and aliphatization, both of which occur on a time-scale much shorter than that of ISM phase exchange. Since the equilibrium value of is insensitive to the ISRF, we simply use the ISRF appropriate for the Milky Way (Mathis et al., 1983) to calculate . We neglect photo-destruction of PAHs and concentrate on the processes included above for the evolution of grain size distribution (i.e. PAHs are simply treated as small aromatic grains in our model). As discussed by HM20, the diffuse ISRF included in our one-zone model is not likely to reduce the PAH abundance by photodestruction faster than the continuous supply of PAHs by shattering. We are able to give some quantitative estimates based on Allain et al. (1996) and Murga et al. (2019). We performed the following experimental calculation. We basically adopted the ISRF spectrum from Mathis et al. (1983) and scaled it with the intensity ( corresponds tot he Milky Way ISRF in the solar neighbourhood). To realize a hard UV spectrum dominated by massive stars in dwarf galaxies, we replaced the UV spectrum at wavelengths 912–2500 Å of Mathis et al. (1983) with a hard spectrum , which roughly represents young ( yr) and low-metallicity ( Z☉) stellar population (Wilkins et al., 2013), with the continuity at 2500 Å.333For the other calculations in this paper, we simply used the spectral shape of Mathis et al. (1983). This modification of the spectral shape is only for the experimental purpose here. In this case, PAHs with Å could be destroyed within the cosmic age if . If we assume appropriate for some low-metallicity galaxies, the PAH destruction time-scale for Å is longer than the time-scale on which the supply of small grains by shattering occurs (– yr). Thus, only the smallest PAHs (–4 Å) could be depleted by photodestruction. This significantly decreases the 3.3 PAH intensity, which we do not focus on in this paper. PAHs with Å are hard to be destroyed because of the stable carbon skelton, so that the main role of UV irradiation is dehydrogenation. Since most of the contribution to the 8 bands comes from PAHs with Å (Draine & Li, 2007), we expect that our results are not significantly affected by photodestruction. There could be some paths of PAH destruction by a local strong UV radiation field (e.g. destruction of super-hydrogenated carbons), but such a local and particular process is difficult to include in our one-zone model. Therefore, we leave the effect of local strong radiation and the dependence on detailed chemical structures of carbonaceous dust for a future work.
Overall, a smaller value of leads to more small grains (because of more shattering and less coagulation) and a higher aromatic fraction (because of more aromatization). Thus, the PAH abundance is more enhanced in the case of smaller . The PAH abundance also depends on the star formation time-scale . Note that the silicate fraction is high at young ages, since silicon, compared with carbon, is preferentially produced by SNe. Thus, the aromatic features tend to be suppressed for shorter . At the same metallicity, the PAH abundance is higher in the case of longer because of an older age (i.e. it takes more time to reach a certain metallicity if is longer).
2.3 SED model
We calculate the SED using the framework developed by Draine & Li (2001) and Li & Draine (2001). The SED depends on the grain composition and the grain size distribution. The distribution function of grain temperature for each is calculated by considering the transition of the grain energy state due to the heating by the ISRF and the cooling by IR radiation. We adopt the ISRF spectrum from Mathis et al. (1983) but scale it with a parameter ( corresponds to the Milky Way ISRF in the solar neighbourhood). Using the resulting grain temperature distribution of the grain component (denoted as , which is a function of ), we calculate the SED [the intensity of dust emission per hydrogen at frequency (with corresponding wavelength ), denoted as ] by
where is the absorption cross-section normalized to the geometric cross-section () as a function of grain radius and frequency , and is the Planck function at frequency and temperature . We assume that the IR radiation is optically thin. For the SEDs, we show the above intensity per hydrogen in this paper.
We treat as a free parameter, although it may depend on the star formation activity. This is because is also affected by various radiation transfer effects, especially the shielding of dust. Such radiation transfer effects cannot be treated by our one-zone model. We also concentrate on the mean ISRF in the galaxy, neglecting the inhomogeneity in the radiation field intensity.
For the optical properties of dust, we adopt two models from DL07 and Jones et al. (2013, hereafter J13), which are often used to model the SEDs of the Milky Way and nearby galaxies. The dust optical properties from these papers are referred to as the DL07/J13 model. The DL07 model is based on the mixture of silicate, graphite, and PAHs. It is straightforward to use their astronomical silicate properties for the silicate component in our model. For the aromatic carbon component, we adopt their carbonaceous component, whose optical properties have a smooth transition from PAHs to graphite around Å. We adopt the ionization fraction of PAHs as a function of grain radius following DL07 (originally from Li & Draine 2001), who calculated the ionization fractions in various ISM phases and averaged them with an appropriate weight. For the non-aromatic component, we simply adopt graphite from Draine & Lee (1984) (i.e. DL07’s carbonaceous properties without PAH features). According to Hirashita et al. (2014), the difference in the mass absorption coefficient between amorphous carbon taken from Zubko et al. (1996) and graphite above is 40 per cent around the peak of the IR SED (). Keeping this uncertainty in mind, we simply stick to the available grain properties in DL07 (and their series of papers). For the J13 model, we adopt amorphous silicate for the silicate component, while we apply hydrogenated aromatic carbon (a-C:H) and aromatic carbon (a-C) for the non-aromatic and aromatic components, respectively. More specifically, we adopt the materials with low ( eV) and high ( eV) band gap energy for the aromatic and non-aromatic species, respectively. For the ionization fractions of the carbonaceous species, we adopt the same value as the above PAH component in the DL07 model (i.e. the values taken from DL07). As pointed out in HM20, our predicted grain size distributions reproduce the Milky Way extinction curve better with the DL07 model than with the J13 model. In this paper, we investigate both dust properties, keeping in mind that the DL07 dust materials combined with our grain size distribution reproduce the Milky Way extinction curve relatively well. As discussed below, the two dust models have some common results, which could strengthen our conclusions.
2.4 Observational data for comparison
We aim at examining if our model reproduces the observed trend in SEDs for galaxies at various evolutionary stages. We use metallicity as an indicator of the galaxy evolutionary stage as done in many models of chemical/dust evolution models (e.g. Lisenfeld & Ferrara, 1998; Dwek, 1998; Inoue, 2003; Zhukovska et al., 2008).
We adopt comprehensive nearby galaxy samples that include the Spitzer data. The Spitzer bands are suitable for tracing the emission from various dust components including PAHs. We take the samples from the following two papers. One is the union of the KINGFISH (Key Insights on Nearby Galaxies: A Far-Infrared Survey with Herschel) and SINGS (Spitzer Infrared Nearby Galaxies Survey) samples, for which Dale et al. (2017) compiled data from UV to radio wavelengths. We adopt the oxygen abundance from Moustakas et al. (2010) for this sample by adopting the Kobulnicky & Kewley (2004) metallicity calibration in their table 9. Among the 79 galaxies in their sample, we adopt 75 galaxies excluding NGC 3034 [M82; because of the saturation in the Spitzer MIPS (Multiband Imaging Photometer) bands], DDO 154, Holmberg IX, and M81 Dwarf B (because of no detection in the relevant Spitzer bands). The other is the sample of nearby star-forming galaxies with a large metallicity range, taken from Engelbracht et al. (2008). We exclude UM 420 because of no available MIPS data. Their compiled data also include the oxygen abundance. Because of the crowded data points in the diagrams to be shown below, we do not explicitly show error bars. The typical errors in the luminosity and the metallicity are 10 per cent and 0.1 dex, respectively. We always show the metallicity normalized to the solar value: For the observational data, we assume the metallicity to scale with the oxygen abundance and adopt for the solar oxygen abundance and for the solar metallicity (Lodders, 2003). Ciesla et al. (2014) also compiled the data for the HRS (Herschel Reference Survey) data. Their PAH abundances roughly overlap () with those of the SINGS sample at high metallicities. Because of their smaller coverage in metallicity (and the metallicity dependence is critical in this paper), we do not adopt their data, keeping in mind that they also show a similar correlation between PAH abundance and metallicity.
To constrain our model, we use the Spitzer IRAC (Infrared Array Camera) 8 , and MIPS 24, 70 and 160 bands. The two longest wavelengths are used to constrain the SED of large grains which are in radiative equilibrium with the ISRF. In other words, the 70 and 160 bands can be used to constrain . The 8 and 24 bands are dominated by small grains that are not in radiative equilibrium (or are stochastically heated). The 8 emission is dominated by PAH emission if the PAH abundance is high enough, and thus can be used as an indicator of PAH emission strength (Engelbracht et al., 2005). The 24 band is not affected by any particular PAH feature, but it reflects the overall small-grain population. Thus, the set of these Spitzer bands is suitable for the purpose of investigating the grain size distribution and the PAH abundance.
The total IR (TIR) luminosity of the observational sample is evaluated using the 8, 24, 70, and 160 luminosities444More precisely, the central wavelengths are 7.9, 24, 71, and 160 (DL07), but we simply describe the wavelength as written in the text. as (DL07)
| (2) |
where the luminosity density weighted for the filter band pass is multiplied by the central frequency, and is denoted as , ( is the central wavelength of the band in units of ). For the Dale et al. (2017) sample, we subtract the contribution from stellar emission estimated using the IRAC 3.6 data (DL07):
| (3) | |||
| (4) |
For the Engelbracht et al. (2008) sample, we use their stellar-subtracted fluxes. Because there is no risk of confusion, we hereafter omit the superscript ‘ns’. For the theoretical SEDs, we also evaluate the total intensity, , using equation (2) but replacing the luminosities with the intensities. The filter response of the appropriate band is considered for the theoretically derived intensities.
Our SED model outputs the intensity (per hydrogen), while the observational data show the total luminosity. We denote the intensities weighted for the band pass, omitting the bracket but clarifying the wavelength, as . We mainly compare the ratios; for example, in our model is compared with the observed luminosity ratio between 70 and 160 . It is sometimes convenient to multiply corresponding to the central wavelength [denoted as ] to make the physical dimension identical to .
For the basic presentations of SED evolution in Sections 3.2 and 4.1, we also plot the observed Milky Way SED. We take the data for the diffuse high Galactic latitude medium from Compiègne et al. (2011), which can be used as typical dust emission data in the solar neighbourhood (see also Désert et al., 1990). We adopt their data taken by the COBE/DIRBE, Herschel/PACS, Herschel/SPIRE, and Planck/HFI at wavelengths shorter than 1 mm. Since we already know that is appropriate for the Milky Way, it is not necessary to adjust , while for other galaxies, is unknown. Thus, we only adopt the Milky Way for a direct comparison with the SEDs.
For PAHs, spectroscopic data could also be useful; however, comparison with spectroscopic data is too sensitive to assumed optical properties and ionization states of PAHs. As we will show below, comparison with photometric data already puts meaningful constraints on the model; thus, the purpose of this paper is specifically to examine if the broad SED shapes traced by photometric data could be reproduced using our models. We leave detailed comparison with spectroscopic data (e.g. Hunt et al., 2010) for a future work.
3 Results
3.1 Grain size distribution
We first review the resulting grain size distributions in HM20. The interested reader is referred to HM20 for the detailed discussions on the evolution of grain size distributions.
The grain size distribution is dominated by large (–1 ) silicate grains in the early epoch of galaxy evolution when the dust formation is dominated by stellar sources. In the Milky Way-like star formation history with Gyr, this phase continues up to Gyr. After this age, the grain size distribution is modified by interstellar processing, which is sensitive to the assumed dense gas fraction, . The evolution in the ‘fiducial’ case with and Gyr is described as follows. Shattering gradually produces small grains at –1 Gyr. At Gyr, the metallicity becomes high enough for accretion to increase the abundance of small (–0.01 ) grains (note that accretion is efficient for small grains since they have high surface-to-volume ratios). After this phase of efficient accretion, coagulation starts to have a large influence on the grain size distribution by converting small grains to large grains. In this phase, the grain size distribution becomes similar to the MRN grain size distribution ().
The evolution of grain size distribution depends strongly on the dense gas fraction, . For small , coagulation does not occur efficiently while shattering is efficient, so the grain size distribution at Gyr is dominated by small () grains. In contrast, for large , grains as large as form efficiently by coagulation at Gyr.
For Gyr, the grain composition is dominated by silicate with at Gyr and decreases down to at later epochs. The aromatic fraction, , is broadly equal to as mentioned in Section 2.2. Moreover, if is smaller, grains are more dominated by small grains as mentioned above, which leads to a higher PAH abundance. As a consequence, the PAH abundance is affected by the age and in such a way that a system with an old age and a large fraction of the diffuse ISM tends to have a high PAH abundance.
The evolution of dust and PAHs is also affected by . A similar grain size distribution is obtained for the same value of as shown by HM20. At a certain fixed metallicity, the case with shorter has a higher silicate fraction and a lower small-grain abundance simply because of a younger age (thus, less AGB stars and less time for dust processing). This means that the PAH abundance at a certain metallicity is suppressed for short .
The above results already shown by HM20 give a basis on which we interpret the SED evolution described in the following subsections.
3.2 Evolution of SED
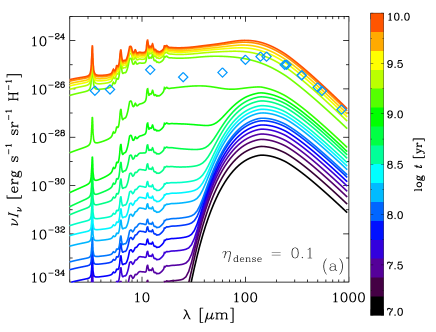
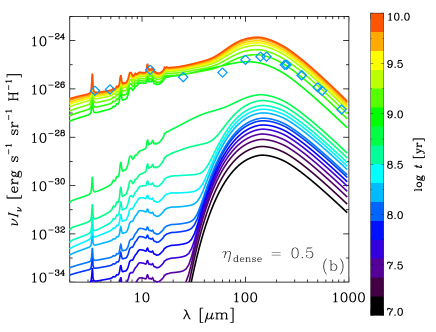
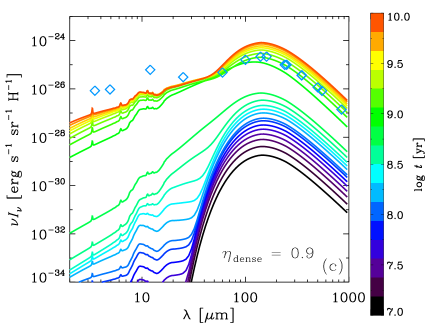
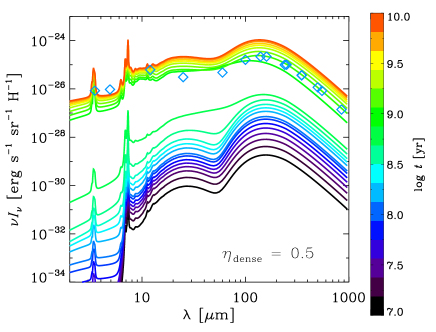
As explained above, the grain size distribution and the dust compositions are affected by and ; thus, the SEDs also depend on these parameters. In addition, the SEDs also rely on the ISRF intensity, . In this section, we focus on the case with Gyr, which is appropriate for Milky Way-like galaxies. We also adopt , the typical ISRF intensity in the solar neighbourhood of the Milky Way. We examine various values of (, 0.5, and 0.9). We first concentrate on the results for the DL07 grain composition model (we always adopt the DL07 model unless otherwise stated) and discuss the J13 model in Section 4.1.
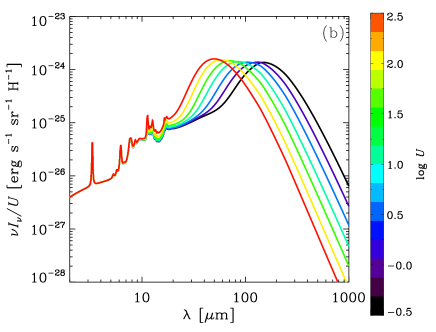
We show the evolution of SED in Fig. 1 between and yr. The intensity increases almost monotonically with age because of dust enrichment. We observe a big jump in the overall dust emission around Gyr, which corresponds to the epoch when dust growth by accretion drastically increases the dust abundance. Since the small-grain abundance particularly grows, the increase in the MIR emission (including PAH emission) is more prominent than that in the FIR at Gyr. We see this point again later in Section 3.4.
In Fig. 1, we also examine the dependence on . We observe that the FIR peak intensity is not sensitive to . This is because the FIR luminosity is determined by the total dust mass, which is not sensitive to . In contrast, the intensity of the MIR emission, which originates from small grains including PAHs, is sensitive to . This is because the small-grain abundance and the aromatic fraction are high in the ISM dominated by the diffuse medium (Section 3.1). We note that the SED slope at long wavelengths is constant under a given dust species. Thus, the change of SED shape is prominent at , which further justifies our usage of the Spitzer band coverage for the comparison with nearby galaxies.
We also see the silicate feature at 9.7 in the early epochs (especially for and 0.9) in Fig. 1. This is because the silicate fraction is higher in the early epoch. For , PAH emission is weak because the aromatic fraction is low. Weaker PAH features make the 9.7 emission relatively prominent. Therefore, dense and young conditions are favourable for a prominent silicate feature.
Finally, as mentioned in Section 2.4, we compare the resulting SEDs with the Milky Way data. In the case with (Fig. 1b), we observe that the long-wavelength data points are reproduced with ages of a few Gyr, while the data at short wavelengths where PAH emission is prominent is consistent with the results at Gyr. This means that the SEDs reproducing the Milky Way FIR emission tends to underpredict the PAH emission. This could be resolved if we assume a lower value of . Indeed, as shown in Fig. 1a, the intensities at short wavelengths are no longer underproduced at a few Gyr. However, the emission around –70 is overpredicted, since the small-grain abundance is significantly enhanced for small . For , the intensities at are underproduced because of the suppressed small-grain abundance. Any values of –1 have difficulty in reproducing the SEDs at –70 and at simultaneously. However, we emphasize that the Milky Way SED data are successfully covered by our predictions with –0.5 at a few–10 Gyr. The difficulty in reproducing the data with a single parameter set should be resolved in a future work; for example, a superposition of different grain size distributions in different ISM phases would be necessary to reproduce the Milky Way SED at all wavelengths at once. Alternatively, the grain size distribution is different from what we predict; indeed, DL07 proposed that the size distribution of PAHs has log-normal components. Such a log-normal grain size distribution is difficult to reproduce in our model. As shown later, the difficulty in simultaneously reproducing the multi-band data arises also for the nearby galaxy sample, so that we revisit this problem again in Section 4.
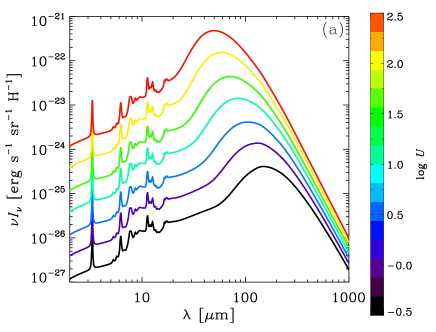
3.3 Dependence on the ISRF intensity
In this paper, we simply treat the ISRF intensity as a free parameter. Here we examine the effect of on the SED. Since the effect of is qualitatively similar for any grain size distributions and many previous studies have already investigated the effect of on the IR SEDs (e.g. Draine & Anderson 1985; Li & Draine 2001; DL07), we focus on the SEDs at Gyr with and Gyr as shown in Fig. 2. As expected, the emission at all wavelengths becomes stronger as increases. The SED peak in the FIR shifts to shorter wavelengths as the ISRF becomes stronger because the equilibrium dust temperature becomes higher. To cancel out the natural increase of the overall dust emission with , we also show the intensity divided by . As noted by previous studies (e.g. DL07), we find that the MIR SED, where the PAH emission is prominent, is simply scaled with (i.e. the intensity divided by is constant). This is explained by the nature of stochastic heating in which the hitting frequency of photons on small grains is proportional to . On the other hand, the FIR SED peak, which is determined by the equilibrium temperature, shifts to shorter wavelengths as increases. The maximum value of , which roughly reflects the total IR luminosity, still scales with ; this means that the total IR luminosity (= total reprocessed luminosity from dust) also scales with ( dust heating by stellar radiation). This is a natural consequence of radiative equilibrium. Therefore, the MIR SED and the total IR luminosity scale with , while the SED peak shifts to shorter wavelengths for higher . This peak shift is the main reason that the intensity ratios at various wavelengths changes with . This fact is important in interpreting the intensity ratios shown below.
3.4 Evolution with metallicity
Since we are interested in galaxy evolution, it is crucial to adopt an indicator of the evolutionary stages. Since the galaxy age is difficult to determine, we often use the metallicity as an indicator of galaxy evolution (e.g. Tinsley, 1980). Here we focus on some quantities characterizing the SED shape as a function of metallicity and compare them with the data described in Section 2.4. In our model, the metallicity is calculated by the chemical evolution model described in Section 2.1. We focus on the case with Gyr and vary and . We discuss the dependence on in Section 3.5. In our model, the star formation time-scale also gives the time-scale on which the metallicity reaches solar ( Z☉). We show the evolution up to Gyr.
3.4.1 FIR intensity ratio
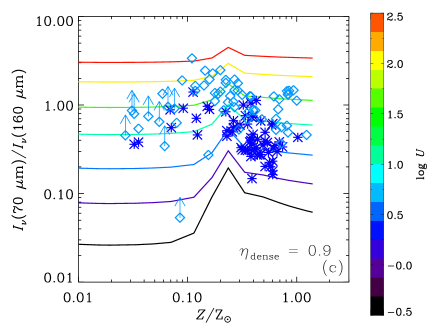
Although the ISRF intensity is treated as a free parameter in this paper, we can obtain a reasonable range for it by inspecting the bands which reflect the equilibrium dust temperature. Among the Spitzer bands, the 70 and 160 bands, which are the nearest to the SED peak, reflect the equilibrium dust temperature the most (Section 3.3). In Fig. 3, we plot (referred to as the 70–160 ratio) as a function of metallicity for , 0.5, and 0.9 and for –300. First, we focus on the case with (Fig. 3b). As expected, the 70–160 ratio becomes larger for higher . However, there is also a change in the intensity ratio along each line, where is constant. This is because the 70 intensity is still affected by stochastically heated small grains (Bernard et al., 2008). For example, in the case of M33, the contribution from such small grains to the 70 intensity is per cent (Relaño et al., 2018). The relatively suppressed 70–160 intensity ratio at low metallicity is due to the lack of small grains (recall that stellar sources, which dominate the dust production at low metallicity, produce large grains). The peak around Z☉ corresponds to the epoch when the small-grain abundance is drastically enhanced by accretion. At high metallicity, there is a slight decreasing trend for the 70–160 ratio because small grains are efficiently converted to large grains by coagulation.
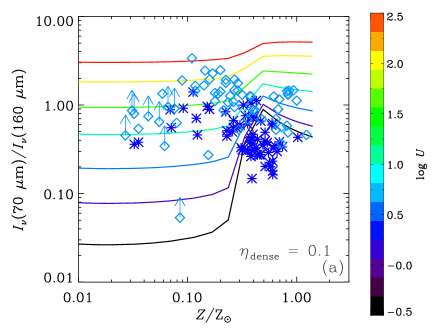
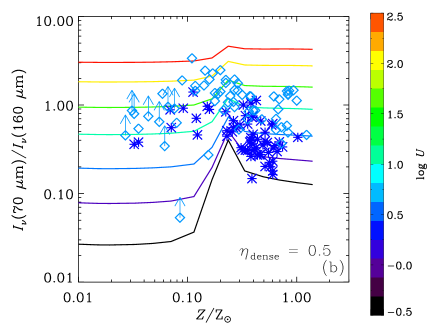
We explain the observational data of nearby galaxies with –30 for metal-rich objects, confirming previous studies (e.g. Draine et al., 2007). Metal-poor objects tends to have higher (–100). This confirms that dust in low-metallicity () star-forming galaxies tend to be irradiated by intense radiation (e.g. Engelbracht et al., 2008; Hirashita & Ichikawa, 2009; Hunt et al., 2010). It is interesting to point out that the 70–160 ratios of the observational sample seem to have a peak around –0.2 Z☉ as already noted by Engelbracht et al. (2008). In our model, this peak is at least partly explained by the increase of small grains by accretion.
The evolution of the 70–160 ratio also depends on . As we observe in Fig. 3, the difference between the cases with and 0.9 is small, because as shown in HM20, the evolution of grain size distribution is similar except for the overabundance of large grains at for . In contrast, the 70–160 ratio is significantly higher for than for the other cases at high metallicity since the grain size distribution is dominated by small grains.
3.4.2 MIR
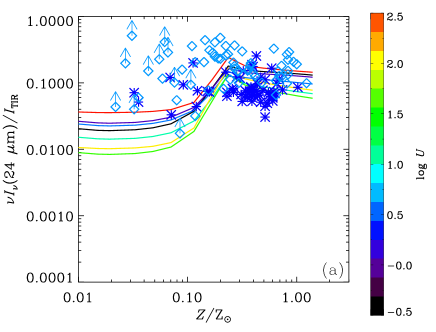
Now we examine the MIR wavelength range, where the emission is dominated by small grains. Among the Spitzer bands, the 8 and 24 bands can be used to examine the contribution from small grains. The 8 emission is sensitive to the PAH emission, while the 24 band is more affected by the entire small-grain population (Section 2.4). We use the TIR intensity for the normalization.
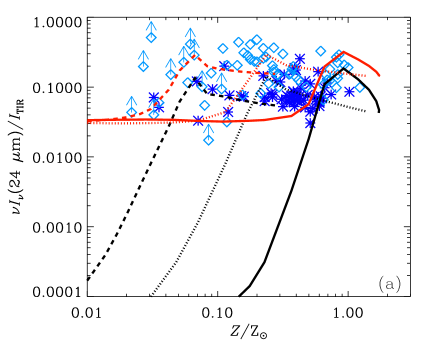
First, we show in Fig. 4 the evolution of , which is referred to as the 24 –TIR ratio. The 24 –TIR ratio increases with metallicity at Z☉, which reflects the small-grain production by shattering and accretion. At high metallicity, it decreases because coagulation converts small grains to large grains. We observe that the results are not sensitive to for at high metallicity, since both 24 and TIR intensities scale with almost linearly (Section 3.3). If is as strong as 300, large grains, which are in radiative equilibrium, affect the 24 emission. This radiative-equilibrium component breaks the scaling of with at a fixed wavelength as shown in Section 3.3. At low metallicity, because the abundance of small grains is small, large grains could easily dominate the 24 (i.e. the 24 intensity is affected by the radiative equilibrium component, which does not simply scale with ). Thus, for the same reason as above, the 24 –TIR ratio depends on the ISRF intensity at low metallicity.
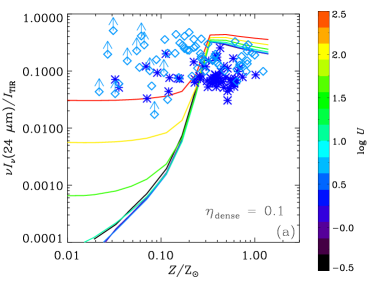
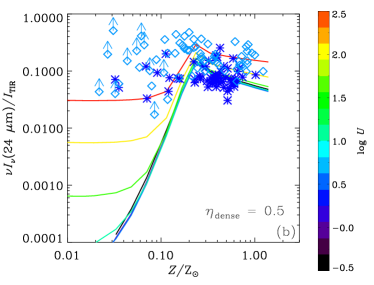
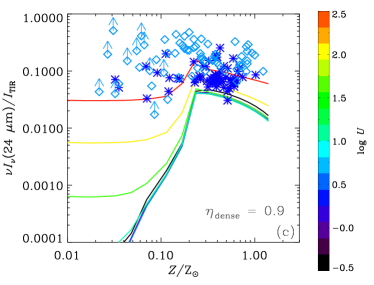
From Fig. 4, we also find that the results are somewhat sensitive to especially at high metallicity. As expected from the SEDs shown in Fig. 1, a larger tends to suppress the MIR emission more because of more efficient coagulation and less efficient shattering. At high metallicity ( Z☉), the 24 –TIR ratio is high for a smaller value of . It is worth pointing out that the medium case () explains the observational data at high metallicity the most among the three values of . The decreasing trend at high metallicity predicted by our model is not inconsistent with the data. This decreasing trend is caused by coagulation, which converts small grains (responsible for the 24 emission) to large grains. We also observe that the scatter in the observational data at high metallicity is also explained by the variation of . Since the scatter is large, a large range of (such as 0.1 for the upper part of the data points, and 0.9 for the lower part) is consistent with the data at high metallicity. The ISRF intensity causes the dispersion only if for some galaxies, but such a high ISRF is not supported by the 70–160 ratio for high-metallicity galaxies (Fig. 3). At low metallicity, since the dust abundance is dominated by stellar dust production, the result is not sensitive to . The metallicity level at which the 24 –TIR ratio peaks is not sensitive to ; this is because the metallicity, not , is the main quantity that determines the efficiency of dust growth by accretion (Inoue, 2011). Thus, the data points with high 24 –TIR ratios at low metallicity is difficult to explain by the change of . In Section 3.5, we investigate a possibility of resolving this discrepancy by longer .
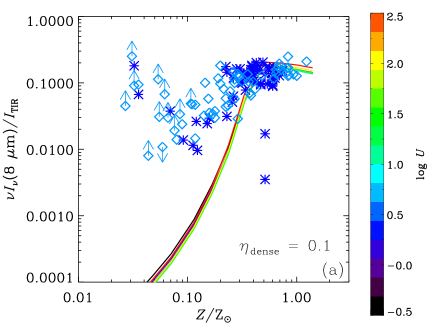
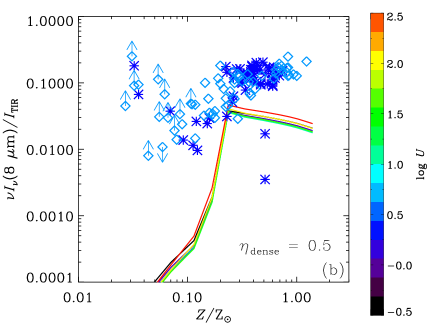
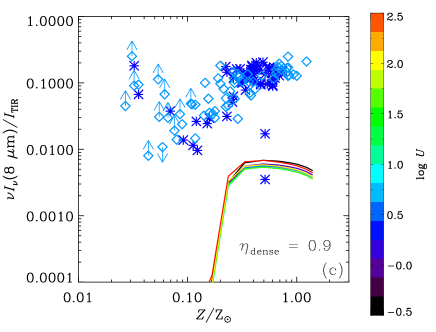
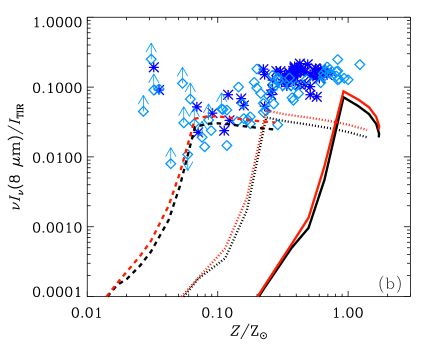
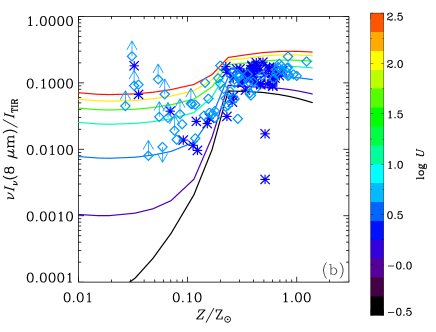
Next, we examine (referred to as the –TIR ratio) in Fig. 5. As mentioned above, the band is chosen as a band sensitive to the PAH emission. We observe that the 8 –TIR ratio behaves in a similar way as the 24 –TIR ratio, since both of these two MIR bands reflect the abundance of small grains relative to that of large grains. Thus, the above interpretations for the 24 –TIR ratio are mostly valid for the 8 –TIR ratio. There are some differences, though. Since the 8 band is far from the SED peak even for the case of , it is not affected by the radiative equilibrium component (i.e. large grains). Thus, the 8 –TIR ratio is not sensitive to in the entire metallicity range. The observation data at high metallicity are located near the theoretical prediction with , favouring the ISM dominated by the diffuse medium. Recall that the curves with are located in the middle of the data at high metallicity for the 24 –TIR ratio. Thus, the favoured value is different between the 8 and 24 bands. Probably, the 8 and 24 emissions are dominated by different ISM phases; thus, spatially resolved treatments for dust evolution would be necessary (see also Section 4.4). All the curves underpredict the observed 8 –TIR ratio at low metallicity ( Z☉). The fact that the 8 –TIR ratio is predicted to be insensitive to means that the scatter in the observational data is caused not by the ISRF intensity, but by other properties such as the dense gas fraction (see above) and the star formation time-scale (see Section 3.5). The underprediction of the 8 –TIR ratio at low metallicity is not resolved even if we change with metallicity, since all values of underproduce the 8 –TIR ratio. This is resolved at least partially by a longer star formation time-scale, but some data points with high 8 –TIR ratios would need additional mechanism of PAH formation that is not included in this paper. This issue is further discussed in Sections 4.3 and 4.4.
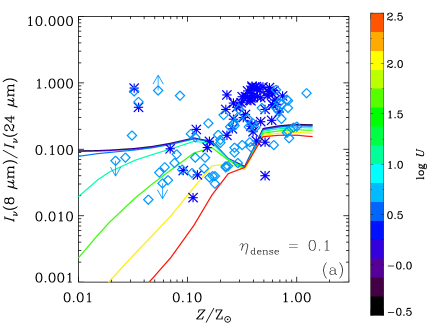
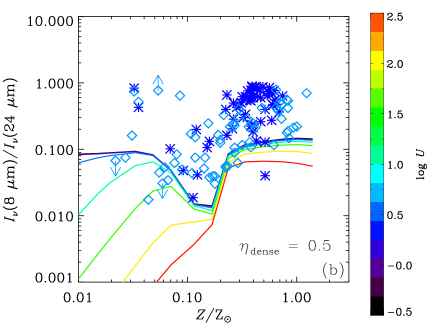
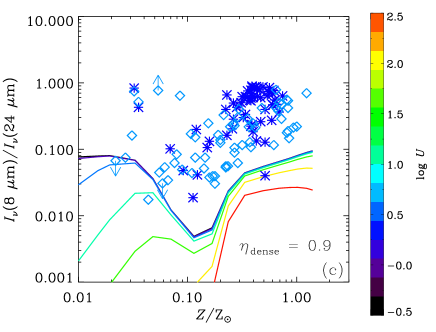
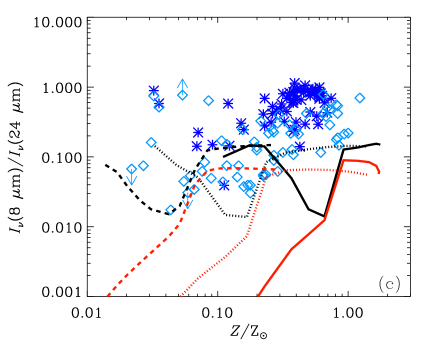
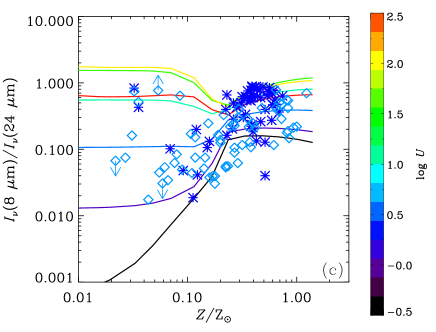
It is also interesting to investigate (referred to as the 8–24 ratio), since this ratio reflects the PAH fraction in the small-grain population. We show the 8–24 ratio in Fig. 6. At low metallicity, the ratio depends strongly on because the 24 intensity is raised by the contribution from large grains for high . For all values of , the 8–24 ratio increases at Z☉, and is not sensitive to the variation of in that metallicity range. The 8–24 ratio tends to be suppressed for higher because the aromatic fraction is lower. All cases tend to underpredict the observational data at high metallicity. This confirms the above ‘discrepancy’ between the favoured values of in the 8 –TIR and 24 –TIR ratios.
3.5 Different star formation time-scales
As shown by HM20, the star formation time-scale also affects the evolution of dust and PAH abundances with metallicity. The characteristic metallicity at which the abundances of PAHs and small grains increase rapidly shifts towards lower metallicities as becomes longer. Thus, the evolution of the MIR intensities is expected to be strongly affected by the change of . We focus on the intensity ratios that involve the MIR bands (the 24 –TIR, 8 –TIR, and 8–24 ratios) to investigate the effect of .
We show the results for , 5, and 50 Gyr in Fig. 7. For Gyr, we stop the calculation at Gyr because most of the gas is consumed. For the other cases, we calculate the evolution up to Gyr. We only present the cases with and 300. We observe that the evolutionary tracks shift to lower metallicities as becomes longer. This is because the metallicity level at which the dust abundance is rapidly raised by accretion scales as (Asano et al., 2013a): If the chemical enrichment occurs quickly, the system is more enriched with metals before the interstellar processing of dust becomes efficient. A long could help to explain some of the data points at low metallicity by realizing a high value of the 24 –TIR and 8 –TIR ratios at low metallicity. However, since the difference in only causes a horizontal shift in the diagrams, the high 8–24 ratios in the observational data cannot be explained by the change of . In summary, the different values of serve to produce horizontal scatters (in the direction of metallicity) on the intensity ratio–metallicity diagrams.
4 Discussion
4.1 Dust properties from J13
In the above, we used the DL07 model for the optical properties (or grain compositions). The J13 model, which we also adopted in HM20, is another well investigated set of dust properties (Section 2.3). The J13 model is characterized by a detailed modelling of carbon dust properties, especially covering a full variation for the band gap energy of a-C(:H). Our motivation of adopting J13 in this paper is to investigate the robustness of the prediction against the change of dust optical properties. Note that we still use the same grain size distributions as used above.
In Fig. 8, we show the evolution of SED for the J13 model. We fix , Gyr, and . This figure is to be compared with Fig. 1(b), where we adopted the DL07 grain compositions. We find that the detailed shape of the MIR spectral features is significantly different between the two models. However, we should note that there is a lot of room for the adjustment of detailed dust properties such as the surface coating, etc. (Jones et al., 2017). We emphasize again that the purpose of adopting the J13 model here is to examine the sensitivity of the results against the change of dust optical properties, not to judge which model is better. There is another large difference in the MIR. Because the non-aromatic grains have extremely low infrared emissivity (Jones, 2012; Ysard et al., 2018), their equilibrium temperatures are high. This creates a MIR bump at –30 even without small grains. Consequently, the J13 model predicts stronger MIR emission than the DL07 model, especially in the early epoch, when the small-grain abundance is low. The SEDs at do not differ significantly between the two models. Thus, the FIR SED is robust against the change of the dust properties.
We also plot the observational data for the Milky Way SED in Fig. 8. The data points in the FIR are reproduced with ages of a few Gyr, while the data at short wavelengths where PAH emission is prominent is consistent with the results at Gyr. This means that the PAH emission is underestimated if we choose an age () that explains the observed FIR SED. This underestimate also occurred in the DL07 model. Indeed, except for the detailed MIR feature shapes, the overall SED shapes from the MIR to the FIR at are similar between the J13 and DL07 models (compare Fig. 8 with Fig. 1b). Thus, as far as the broad SED shape at later ages is concerned, the prediction is robust against the change of the dust optical properties.
Since the difference between the two models appear in the MIR, we show the evolution of the 24 –TIR, 8 –TIR and 8–24 ratios in Fig. 9. Because the emission at –30 is enhanced, the 24 –TIR ratio is high at low metallicity compared with the DL07 model (Fig. 9a vs. Fig. 4b). The difference in the 24 –TIR ratio between the J13 and DL07 models is small at high metallicity because small grains become the major contributor to the 24 emission in both cases. The 8 –TIR ratios in the J13 model are overall higher than those in the DL07 model (Fig. 9b vs. Fig. 5b) because of the contribution from the tail of the above 20–30 excess. Since this tail is sensitive to the dust temperature determined by the ISRF intensity (), the 8 –TIR ratio changes for different values of in the J13 model; in the DL07 model, in contrast, the ratio is almost insensitive to . Because of the larger variation of the 8 –TIR ratio in the J13 model, the scatter of the observational data is better explained at both high and low metallicities. For the same reason, the observed 8–24 ratios are covered better in the J13 model than in the DL07 model (Fig. 6b).
As mentioned above, we do not intend to conclude which of the DL07 and J13 models is better. We conservatively state that the J13 model covers the observational range better than the DL07 model with the grain size distributions predicted by our model. We note that even in the DL07 model, the prediction with small could also reproduce the observational data (Fig. 5a).
4.2 Comparison with galaxies
The 8 band used to trace PAH emission at is redshifted to another Spitzer (24 ) band at . Here we compare our model with the observational data taken from Shivaei et al. (2017) (at –2.6) because they also show the relation with the metallicity estimated from rest-frame optical metal lines. They stacked the IR data of the sample in a few metallicity bins (40–90 galaxies with a median redshift of 2.1–2.3 in each metallicity bin), and derived the rest-frame 7.7 luminosity and the total FIR luminosity as well as other observational quantities for the sample. They used the Chary & Elbaz (2001) SED template to derive the monochromatic luminosity at 7.7 . Thus, we calculate the ratio between the 7.7 intensity multiplied by the frequency corresponding to and the TIR intensity. This ratio is denoted as , and referred to as the 7.7 –TIR ratio.
In Fig. 10, we show the comparison between the above observational sample at and our models. We adopt the DL07 model for the dust optical properties. The fiducial case with Gyr and underpredicts the observation data by a factor of . As shown in Section 3.4, the MIR emission is stronger for a lower dense gas fraction; thus, we also examine the case of (with Gyr). As we observe in Fig. 10, the evolution with broadly reproduces the observational data. The rising trend of the 7.7 –TIR ratio is interpreted as increasing abundances of PAHs and small grains. The fact that the observational data are better explained by implies that the major part of PAH emission comes from the diffuse ISM.
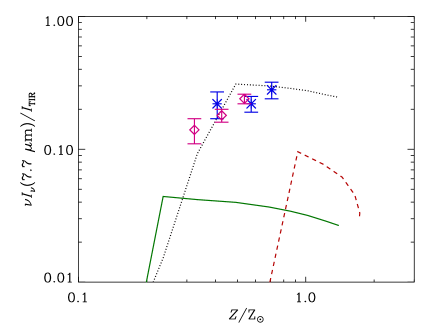
The sample may be biased to actively star-forming galaxies, which have shorter star formation time-scales. Thus, we also show the case of a short Gyr (with ) in Fig. 10. As also shown in Fig. 7, the increase of the MIR-to-TIR intensity ratio occurs at a higher metallicity if the star formation time-scale is shorter. However, we observe in Fig. 10 that the metallicity level at which the intensity ratio increases is too high to explain the observational data at . Thus, a longer is more favoured than a short starburst. Since the age of the Universe is Gyr at , comparable to the cosmic age is favoured. This implies that the galaxies sampled by Spitzer at are forming stars in a continuous way over the cosmic age rather than only in a recent short starburst. However, this needs to be confirmed with further modelling efforts including more realistic star formation histories and additional observational data (e.g. more detailed SEDs).
Schreiber et al. (2018) have also shown that the relation between 8 –TIR ratio and metallicity holds for a sample of star-forming galaxies at –4. They estimated the metallicity from stellar masses and star formation rates using the fundamental relation observationally proposed by Mannucci et al. (2010). They obtained a similar relation to that found by Galliano et al. (2008) at , indicating that the 8 –TIR ratio is regulated by metallicity as predicted in this paper. This also means that the redshift evolution of PAH emission could be predominantly driven by metallicity evolution.
4.3 Implication for spatially resolved PAH distribution
In our one-zone model, the PAH emission (or 8 emission) is as strong as observed for nearby galaxies if the ISM is dominated by the diffuse phase (i.e. in our model; Fig. 5a). However, we should note that the 24 emission is overpredicted with (Fig. 4a). In reality, the emission from various dust components may originate from different ISM phases. Indeed, Popescu et al. (2011) constructed an SED model for NGC 891 based on an analytic galactic structure model and showed that the 8 emission is dominated by the diffuse component while the 24 radiation is more associated with compact star-forming regions. Since we use a one-zone model, we are not able to treat the variety in the grain size distributions in different ISM phases. It is still interesting to calculate the spatially resolved evolution of dust including PAHs. There are some possible approaches of treating dust evolution in a spatially resolved way. One is extension to a multi-component ISM model, in which we treat the different grain size distributions in various ISM phases. In this way, we will be able to clarify how the different grain size distributions are superposed. Millán-Irigoyen et al. (2020) constructed a model that takes into account the time variation of multi-component ISM phases and dust abundance consistently; however, they did not yet consider the different dust abundances in different ISM phases. Another viable way is to develop galaxy simulations that implement the evolution of grain size distribution as already done by McKinnon et al. (2018) and Aoyama et al. (2020). We could utilize these simulations to further include PAH evolution. In particular, Aoyama et al. (2020) showed that the grain size distributions are different in different ISM phases. Future spatially resolved simulations including PAH evolution may serve to resolve the above tension between the favoured values of in the two MIR (8 and 24 ) bands.
There are some spatially resolved PAH emission maps in nearby galaxies. For example, Chastenet et al. (2019) showed that the PAH abundance in the diffuse ISM of the Large Magellanic Cloud (LMC) is as high as that in the Milky Way. This could be interpreted as an enhanced small-grain abundance by accretion in the intermediate metallicity range, by a large aromatic fraction in the diffuse ISM, or by shattering in the diffuse ISM. The abundance of small grains contributing to the excess emission at 70 is also large in the diffuse ISM of the LMC (Bernard et al., 2008), supporting efficient small-grain production in the diffuse medium. Paradis et al. (2009) showed that the spatial distributions of PAHs and small grains are different in such a way that small grains are more associated with star-forming regions. There are also some pieces of evidence of very different spatial distributions between small grains contributing to the 24 emission and PAHs emitting at shorter wavelengths for nearby galaxies (Onaka et al., 2018). Hydrodynamic simulations appropriately including dust evolution and hydrodynamic mixing will address these spatially resolved features within the LMC or within a galaxy in general.
On the other hand, Chastenet et al. (2019) indicated similar PAH abundances in the diffuse neutral medium and in the molecular clouds, which implies some mechanism to homogenize the PAH abundance within a galaxy. This may indicate that our model that assumes different PAH formation/destruction rates between the diffuse and dense ISM with fixed gas densities is too simplistic. Furthermore, Relaño et al. (2016) and Chastenet et al. (2019) showed that the PAH abundance is lower in ionized regions (see also Lebouteiller et al., 2011), which could indicate that the PAH abundance is affected by some physical processes related to gas ionization (e.g. UV radiation). H ii regions could also affect the evolution of small grains. Relaño et al. (2016) found in M33 that the abundance of small grains is enhanced in H ii regions. This indicates that some disruptive process of dust is associated with H ii regions. Shattering can be induced by shocks (Jones et al., 1996) or by efficient gyroresonance in ionized media (Yan et al., 2004; Hirashita et al., 2010), leading to enhanced small grain production. Therefore, we should keep in mind that processes not included in our model could be important in interpreting the detailed spatial distributions of small grains and PAHs.
Another observational approach of obtaining spatially resolved information for nearby galaxies is to use H ii regions, where the metallicity and the dust emission can be measured simultaneously (although we should keep in mind the above remarks for dust processing specific for ionized regions). Khramtsova et al. (2013) investigated the PAH abundances in individual H ii complexes of nearby star-forming galaxies. They found that the relation between the PAH-to-dust ratio and the metallicity for individual H ii complexes is similar to that in entire galaxies. Khramtsova et al. (2014) showed that the 8–24 ratio for individual H ii complexes in nearby star-forming galaxies is similar to that found for entire galaxies. These similarities between individual H ii complexes and entire galaxies imply that the evolution of the entire galaxy is still important when we interpret the spatially resolved information on the PAH emission. The relation between the local and global PAH abundances could be theoretically addressed in future development of spatially resolved modelling mentioned above.
4.4 Necessity of further refinement for the PAH models
DL07 (based on Weingartner & Draine 2001) and J13 also derived the grain size distributions that reproduce the Milky Way extinction curve and SED based on their adopted dust optical properties. They both required a lognormal-like excess in the size distribution of small aromatic grains. Thus, the reason why we tend to underproduce the PAH emission (or 8 emission) for the fiducial dense gas fraction () is that our grain size distributions do not have such a lognormal excess. If the excess of small aromatic grains is really required, we should consider some mechanism that could enhance the PAH abundance.
There could be some PAH formation paths that are not included in our model. Stellar PAH production in AGB stars (e.g. Latter, 1991) could contribute to the PAH enrichment in galaxies (e.g. Galliano et al., 2008). However, few carbon-rich evolved stars have shown direct observational evidence for PAH formation (e.g. Buss et al., 1991). Theoretically, the stellar PAH yield is highly uncertain because it is sensitive to the physical conditions adopted for stellar envelopes and winds (Frenklach & Feigelson, 1989; Cherchneff et al., 1992). Even if PAHs are supplied by stars, they may not be the major population of the interstellar PAHs. In many models including the current model, stellar dust formation cannot explain the dust abundance in nearby galaxies (e.g. Dwek, 1998; Hirashita, 1999) and in some high-redshift galaxies (e.g. Mancini et al., 2015) because of the destruction in SN shocks. Thus, they considered dust growth by accretion in the ISM to supplement the interstellar dust. Since PAHs are also efficiently destroyed in SN shocks (Micelotta et al., 2010), stellar sources are not likely to dominate the interstellar PAH abundance, especially in evolved high-metallicity galaxies, and interstellar PAH production is necessary to counterbalance the SN destruction. Thus, we argue that stellar PAH formation is not a viable candidate for a significant PAH formation mechanism. There could be another PAH production mechanism through interstellar processing. Hoang (2019) showed that radiative torque can induce rotational disruption of grains by centrifugal force. This mechanism could act as an additional formation path of small grains and PAHs. However, Hirashita & Hoang (2020) showed that rotational disruption still has a difficulty in efficiently producing grains as small as PAHs. Shattering could occur even in the dense ISM if the medium is ionized (Yan et al., 2004; Hirashita et al., 2010). As mentioned in Section 4.3, this could explain the observed enhancement of small grains in ionized regions; however, the PAH abundances tend to be suppressed in ionized regions observationally. Chastenet et al. (2019) also proposed formation of PAHs in the dense ISM, but the physical mechanism is to be clarified. Therefore, it is not yet clear if these extra formation paths of small grains (rotational disruption and shattering) help to enhance the PAH abundance significantly. Further investigations of possible PAH formation mechanisms are necessary.
Another possible improvement of the model is to treat the evolution of the ISRF spectrum and that of the grain size distribution consistently. To do this, we need to solve radiation transfer within the galaxy based on the dust extinction calculated from the grain size distribution. It is also necessary to synthesize the stellar spectrum. In a hard ISRF, which is observed in low-metallicity galaxies, small PAHs may be destroyed (Section 2.2). Although the origin of the hard radiation field in low metallicity galaxies is not fully understood, it is interesting to make an effort of modelling the ISRF and the PAH evolution consistently.
For further refinement, a detailed analysis using spectral data may also be useful (e.g. Smith et al., 2007; Hunt et al., 2010). However, since the spectral shape depends on the detailed PAH properties such as the ionization state (DL07), further knowledge on how the physical properties of PAHs are modified in different environments is necessary. Although this kind of knowledge is difficult to obtain, the comparison with spectroscopic data, which contain much more information than photometric data, is an important step to further understand the dust and PAH evolution in galaxies.
5 Conclusion
We examine how the evolution of grain size distribution affects the dust emission SEDs of galaxies. We separate the grains into silicate and carbonaceous dust, and further divide the latter into aromatic and non-aromatic species. In our model, there are two main parameters for the evolution of grain size distribution: the dense gas fraction () and the star formation time-scale (). We synthesize the dust emission SED based on temperature distribution functions under an ISRF intensity scaled with ( corresponds to the Milky Way ISRF in the solar neighbourhood).
We find that the SED shape is characterized by weak MIR emission in the early phase of galaxy evolution because the grain abundance is dominated by large grains. In the case of Gyr, which is roughly appropriate for the Milky Way-like galaxies, the IR intensity grows rapidly by accretion (dust growth) around Gyr. Since accretion mainly increases the small-grain abundance, the MIR intensity grows more rapidly than the FIR intensity. After this epoch, small grains are converted to large grains by coagulation; in this phase, the FIR intensity grows slightly more rapidly than the MIR intensity.
The physical state of the ISM, parametrized by the dense gas fraction in our model, also affects the SED evolution, especially in the later epochs, when the dust evolution is mainly driven by interstellar processing. For the ‘fiducial’ case with , the observed Milky Way SED is covered by the SEDs predicted for a few–10 Gyr in our model; however, there is a relative tendency that the intensity at the wavelengths where PAH features are prominent is underpredicted. This can be resolved if we assume a smaller fraction of the dense gas fraction (e.g. ). If is small, the abundance of small grains is enhanced and the aromatic fraction is high.
We also compare our results with the Spitzer data of nearby galaxies. The observed 70–160 ratios indicate that dust is broadly irradiated by ISRFs of –30. Some low-metallicity ( Z☉) galaxies are confirmed to have high . The 24 –TIR and 8 –TIR ratios are insensitive to the ISRF intensity, especially at high metallicity. Although the 24 –TIR ratio in the fiducial dense gas fraction () is consistent with the observational data at high metallicity, an enhanced fraction of the diffuse ISM () is required to reproduce the observed 8 –TIR ratios at Z☉. The different favoured values for between the 8 and 24 emissions imply that they originate predominantly from different ISM phases. A long star formation time-scale ( Gyr) is needed to explain the high 24 –TIR and 8 –TIR ratios at low metallicity in the nearby galaxy sample. This is consistent with the slow chemical enrichment of nearby low-metallicity galaxies. Some objects with very high 8 –TIR ratios are hard to explain, so that it is worth investigating an additional PAH production mechanism that is not included in our model.
Finally, we adopt galaxies (Shivaei et al., 2017) for further comparison. A low dense gas fraction () with a Milky Way-like star formation time-scale ( Gyr) explains the rest-frame 7.7 –TIR ratios. The positive correlation between the metallicity and the 7.7 –TIR ratio is interpreted by the increase of the PAH abundance by dust processing (shattering and accretion). A short star formation time-scale appropriate for starburst galaxies ( Gyr) fails to explain the observations since the increase of the PAH abudnance occurs at too high a metallicity. This may suggest that the galaxies detected by the PAH band (24 ) at are forming stars with a time-scale similar to nearby spiral galaxies (like the Milky Way).
It is worth emphasizing that the above results for PAHs (or emissions at ) favour the ISM dominated by the diffuse ISM (), while we needed a significant fraction of the dense ISM () to explain the extinction curves in HM20. The 24 –TIR ratio also supports . This tension may indicate that spatially inhomogeneous dust evolution could be important, and that the emissions from different dust components have different weights for the ISM phases. This issue could be at least partially addressed if we include our dust evolution model in hydrodynamic simulations. Possibilities of enhanced small-grain production and suppression of PAHs in ionized regions as indicated in nearby galaxies also need further investigation and modelling.
Acknowledgements
We are grateful to the anonymous referee for useful comments. HH thanks the Ministry of Science and Technology for support through grant MOST 107-2923-M-001-003-MY3 and MOST 108-2112-M-001-007-MY3, and the Academia Sinica for Investigator Award AS-IA-109-M02. MSM acknowledges the support from the RFBR grant 18-52-52006.
Data availability
The data underlying this article are available in Figshare at https://doi.org/10.6084/m9.figshare.12917375.v1.
References
- Allain et al. (1996) Allain T., Leach S., Sedlmayr E., 1996, A&A, 305, 602
- Allamandola et al. (1985) Allamandola L. J., Tielens A. G. G. M., Barker J. R., 1985, ApJ, 290, L25
- Aoyama et al. (2019) Aoyama S., et al., 2019, MNRAS, 484, 1852
- Aoyama et al. (2020) Aoyama S., Hirashita H., Nagamine K., 2020, MNRAS, 491, 3844
- Asano et al. (2013a) Asano R. S., Takeuchi T. T., Hirashita H., Inoue A. K., 2013a, Earth, Planets, and Space, 65, 213
- Asano et al. (2013b) Asano R. S., Takeuchi T. T., Hirashita H., Nozawa T., 2013b, MNRAS, 432, 637
- Bekki (2013) Bekki K., 2013, MNRAS, 432, 2298
- Bernard et al. (2008) Bernard J.-P., et al., 2008, AJ, 136, 919
- Bianchi et al. (2000) Bianchi S., Davies J. I., Alton P. B., 2000, A&A, 359, 65
- Buat & Xu (1996) Buat V., Xu C., 1996, A&A, 306, 61
- Burgarella et al. (2013) Burgarella D., et al., 2013, A&A, 554, A70
- Buss et al. (1991) Buss Richard H. J., Tielens A. G. G. M., Snow T. P., 1991, ApJ, 372, 281
- Chabrier (2003) Chabrier G., 2003, PASP, 115, 763
- Chary & Elbaz (2001) Chary R., Elbaz D., 2001, ApJ, 556, 562
- Chastenet et al. (2019) Chastenet J., et al., 2019, ApJ, 876, 62
- Cherchneff et al. (1992) Cherchneff I., Barker J. R., Tielens A. G. G. M., 1992, ApJ, 401, 269
- Ciesla et al. (2014) Ciesla L., et al., 2014, A&A, 565, A128
- Compiègne et al. (2011) Compiègne M., et al., 2011, A&A, 525, A103
- da Cunha et al. (2010) da Cunha E., Eminian C., Charlot S., Blaizot J., 2010, MNRAS, 403, 1894
- Dale et al. (2017) Dale D. A., et al., 2017, ApJ, 837, 90
- Désert et al. (1990) Désert F. X., Boulanger F., Puget J. L., 1990, A&A, 500, 313
- Draine & Anderson (1985) Draine B. T., Anderson N., 1985, ApJ, 292, 494
- Draine & Lee (1984) Draine B. T., Lee H. M., 1984, ApJ, 285, 89
- Draine & Li (2001) Draine B. T., Li A., 2001, ApJ, 551, 807
- Draine & Li (2007) Draine B. T., Li A., 2007, ApJ, 657, 810
- Draine et al. (2007) Draine B. T., et al., 2007, ApJ, 663, 866
- Duley et al. (1993) Duley W. W., Jones A. P., Taylor S. D., Williams D. A., 1993, MNRAS, 260, 415
- Dwek (1998) Dwek E., 1998, ApJ, 501, 643
- Dwek et al. (1997) Dwek E., et al., 1997, ApJ, 475, 565
- Engelbracht et al. (2005) Engelbracht C. W., Gordon K. D., Rieke G. H., Werner M. W., Dale D. A., Latter W. B., 2005, ApJ, 628, L29
- Engelbracht et al. (2008) Engelbracht C. W., Rieke G. H., Gordon K. D., Smith J. D. T., Werner M. W., Moustakas J., Willmer C. N. A., Vanzi L., 2008, ApJ, 678, 804
- Evans (1994) Evans A., 1994, The Dusty Universe. Wiley, Chichester
- Förster Schreiber et al. (2004) Förster Schreiber N. M., Roussel H., Sauvage M., Charmandaris V., 2004, A&A, 419, 501
- Frenklach & Feigelson (1989) Frenklach M., Feigelson E. D., 1989, ApJ, 341, 372
- Galliano et al. (2008) Galliano F., Dwek E., Chanial P., 2008, ApJ, 672, 214
- Galliano et al. (2018) Galliano F., Galametz M., Jones A. P., 2018, ARA&A, 56, 673
- Goto et al. (2010) Goto T., et al., 2010, A&A, 514, A6
- Granato et al. (2000) Granato G. L., Lacey C. G., Silva L., Bressan A., Baugh C. M., Cole S., Frenk C. S., 2000, ApJ, 542, 710
- Hirashita (1999) Hirashita H., 1999, ApJ, 510, L99
- Hirashita & Aoyama (2019) Hirashita H., Aoyama S., 2019, MNRAS, 482, 2555
- Hirashita & Hoang (2020) Hirashita H., Hoang T., 2020, MNRAS, 494, 1058
- Hirashita & Ichikawa (2009) Hirashita H., Ichikawa T. T., 2009, MNRAS, 396, 500
- Hirashita & Murga (2020) Hirashita H., Murga M. S., 2020, MNRAS, 492, 3779
- Hirashita et al. (2010) Hirashita H., Nozawa T., Yan H., Kozasa T., 2010, MNRAS, 404, 1437
- Hirashita et al. (2014) Hirashita H., Ferrara A., Dayal P., Ouchi M., 2014, MNRAS, 443, 1704
- Hoang (2019) Hoang T., 2019, ApJ, 876, 13
- Hou et al. (2017) Hou K.-C., Hirashita H., Nagamine K., Aoyama S., Shimizu I., 2017, MNRAS, 469, 870
- Hou et al. (2019) Hou K.-C., Aoyama S., Hirashita H., Nagamine K., Shimizu I., 2019, MNRAS, 485, 1727
- Hunt et al. (2010) Hunt L. K., Thuan T. X., Izotov Y. I., Sauvage M., 2010, ApJ, 712, 164
- Inoue (2003) Inoue A. K., 2003, PASJ, 55, 901
- Inoue (2011) Inoue A. K., 2011, Earth, Planets, and Space, 63, 1027
- Inoue et al. (2000) Inoue A. K., Hirashita H., Kamaya H., 2000, PASJ, 52, 539
- Jones (2012) Jones A. P., 2012, A&A, 542, A98
- Jones et al. (1996) Jones A. P., Tielens A. G. G. M., Hollenbach D. J., 1996, ApJ, 469, 740
- Jones et al. (2013) Jones A. P., Fanciullo L., Köhler M., Verstraete L., Guillet V., Bocchio M., Ysard N., 2013, A&A, 558, A62
- Jones et al. (2017) Jones A. P., Köhler M., Ysard N., Bocchio M., Verstraete L., 2017, A&A, 602, A46
- Khramtsova et al. (2013) Khramtsova M. S., Wiebe D. S., Boley P. A., Pavlyuchenkov Y. N., 2013, MNRAS, 431, 2006
- Khramtsova et al. (2014) Khramtsova M. S., Wiebe D. S., Lozinskaya T. A., Egorov O. V., 2014, MNRAS, 444, 757
- Kim et al. (2019) Kim S. J., et al., 2019, PASJ, 71, 11
- Kobulnicky & Kewley (2004) Kobulnicky H. A., Kewley L. J., 2004, ApJ, 617, 240
- Kunth & Östlin (2000) Kunth D., Östlin G., 2000, Astronomy and Astrophysics Review, 10, 1
- Kwok & Zhang (2011) Kwok S., Zhang Y., 2011, Nature, 479, 80
- Latter (1991) Latter W. B., 1991, ApJ, 377, 187
- Le Floc’h et al. (2005) Le Floc’h E., et al., 2005, ApJ, 632, 169
- Lebouteiller et al. (2011) Lebouteiller V., Bernard-Salas J., Whelan D. G., Brand l B., Galliano F., Charmandaris V., Madden S., Kunth D., 2011, ApJ, 728, 45
- Leger & Puget (1984) Leger A., Puget J. L., 1984, Astronomy and Astrophysics, 500, 279
- Li & Draine (2001) Li A., Draine B. T., 2001, ApJ, 554, 778
- Li & Draine (2012) Li A., Draine B. T., 2012, ApJ, 760, L35
- Lisenfeld & Ferrara (1998) Lisenfeld U., Ferrara A., 1998, ApJ, 496, 145
- Lodders (2003) Lodders K., 2003, ApJ, 591, 1220
- Madden (2000) Madden S. C., 2000, New Astronomy Reviews, 44, 249
- Madden et al. (2006) Madden S. C., Galliano F., Jones A. P., Sauvage M., 2006, A&A, 446, 877
- Mancini et al. (2015) Mancini M., Schneider R., Graziani L., Valiante R., Dayal P., Maio U., Ciardi B., Hunt L. K., 2015, MNRAS, 451, L70
- Mannucci et al. (2010) Mannucci F., Cresci G., Maiolino R., Marconi A., Gnerucci A., 2010, MNRAS, 408, 2115
- Mathis et al. (1977) Mathis J. S., Rumpl W., Nordsieck K. H., 1977, ApJ, 217, 425
- Mathis et al. (1983) Mathis J. S., Mezger P. G., Panagia N., 1983, A&A, 128, 212
- McAlpine et al. (2019) McAlpine S., et al., 2019, MNRAS, 488, 2440
- McKinnon et al. (2018) McKinnon R., Vogelsberger M., Torrey P., Marinacci F., Kannan R., 2018, MNRAS, 478, 2851
- Micelotta et al. (2010) Micelotta E. R., Jones A. P., Tielens A. G. G. M., 2010, A&A, 510, A36
- Millán-Irigoyen et al. (2020) Millán-Irigoyen I., Mollá M., Ascasibar Y., 2020, MNRAS, 494, 146
- Moustakas et al. (2010) Moustakas J., Kennicutt Jr. R. C., Tremonti C. A., Dale D. A., Smith J.-D. T., Calzetti D., 2010, ApJS, 190, 233
- Murga et al. (2019) Murga M. S., Wiebe D. S., Sivkova E. E., Akimkin V. V., 2019, MNRAS, 488, 965
- Noll et al. (2009) Noll S., Burgarella D., Giovannoli E., Buat V., Marcillac D., Muñoz-Mateos J. C., 2009, A&A, 507, 1793
- Nozawa et al. (2015) Nozawa T., Asano R. S., Hirashita H., Takeuchi T. T., 2015, MNRAS, 447, L16
- O’Halloran et al. (2006) O’Halloran B., Satyapal S., Dudik R. P., 2006, ApJ, 641, 795
- Onaka et al. (2018) Onaka T., Nakamura T., Sakon I., Wu R., Ohsawa R., Kaneda H., Lebouteiller V., Roellig T. L., 2018, ApJ, 853, 31
- Paradis et al. (2009) Paradis D., et al., 2009, AJ, 138, 196
- Peeters et al. (2004) Peeters E., Spoon H. W. W., Tielens A. G. G. M., 2004, ApJ, 613, 986
- Pérez-González et al. (2005) Pérez-González P. G., et al., 2005, ApJ, 630, 82
- Plante & Sauvage (2002) Plante S., Sauvage M., 2002, AJ, 124, 1995
- Popescu et al. (2011) Popescu C. C., Tuffs R. J., Dopita M. A., Fischera J., Kylafis N. D., Madore B. F., 2011, A&A, 527, A109
- Rau et al. (2019) Rau S.-J., Hirashita H., Murga M., 2019, MNRAS, 489, 5218
- Relaño et al. (2016) Relaño M., et al., 2016, A&A, 595, A43
- Relaño et al. (2018) Relaño M., et al., 2018, A&A, 613, A43
- Relaño et al. (2020) Relaño M., Lisenfeld U., Hou K. C., De Looze I., Vílchez J. M., Kennicutt R. C., 2020, A&A, 636, A18
- Sakata et al. (1984) Sakata A., Wada S., Tanabe T., Onaka T., 1984, ApJ, 287, L51
- Sanders & Mirabel (1996) Sanders D. B., Mirabel I. F., 1996, ARA&A, 34, 749
- Sandstrom et al. (2012) Sandstrom K. M., et al., 2012, ApJ, 744, 20
- Schreiber et al. (2018) Schreiber C., Elbaz D., Pannella M., Ciesla L., Wang T., Franco M., 2018, A&A, 609, A30
- Seok et al. (2014) Seok J. Y., Hirashita H., Asano R. S., 2014, MNRAS, 439, 2186
- Shivaei et al. (2017) Shivaei I., et al., 2017, ApJ, 837, 157
- Silva et al. (1998) Silva L., Granato G. L., Bressan A., Danese L., 1998, ApJ, 509, 103
- Smith et al. (2007) Smith J. D. T., et al., 2007, ApJ, 656, 770
- Takagi et al. (2003) Takagi T., Vansevicius V., Arimoto N., 2003, PASJ, 55, 385
- Takeuchi et al. (2005) Takeuchi T. T., Buat V., Burgarella D., 2005, A&A, 440, L17
- Tielens (2008) Tielens A. G. G. M., 2008, ARA&A, 46, 289
- Tinsley (1980) Tinsley B. M., 1980, Fundamentals Cosmic Phys., 5, 287
- Weingartner & Draine (2001) Weingartner J. C., Draine B. T., 2001, ApJ, 548, 296
- Wilkins et al. (2013) Wilkins S. M., Bunker A., Coulton W., Croft R., di Matteo T., Khandai N., Feng Y., 2013, MNRAS, 430, 2885
- Wu et al. (2006) Wu Y., Charmandaris V., Hao L., Brandl B. R., Bernard-Salas J., Spoon H. W. W., Houck J. R., 2006, ApJ, 639, 157
- Yajima et al. (2015) Yajima H., Shlosman I., Romano-Díaz E., Nagamine K., 2015, MNRAS, 451, 418
- Yan et al. (2004) Yan H., Lazarian A., Draine B. T., 2004, ApJ, 616, 895
- Ysard et al. (2018) Ysard N., Jones A. P., Demyk K., Boutéraon T., Koehler M., 2018, A&A, 617, A124
- Zhukovska et al. (2008) Zhukovska S., Gail H.-P., Trieloff M., 2008, A&A, 479, 453
- Zubko et al. (1996) Zubko V. G., Mennella V., Colangeli L., Bussoletti E., 1996, MNRAS, 282, 1321