Chiral charge-density wave in TiSe2 due to photo-induced structural distortions
Abstract
A variety of experiments have been carried out to establish the origin of the chiral charge-density wave transition in 1T-TiSe2, which in turn has led to contradictory conclusions on the origin of this transition. Some studies suggest the transition is a phonon-driven structural distortion while other studies suggest it is an excitonic insulator phase transition that is accompanied by a lattice distortion. First, we propose these interpretations can be reconciled if one analyzes the available experimental and theoretical data within a formal definition of what constitutes an excitonic insulator as initially proposed by Keldysh and Kopaev. Next, we present pump-probe measurements of circularly polarized optical transitions and first-principles calculations where we highlight the importance of accounting for structural distortions to explain the finite chirality of optical transitions in the CDW phase. We show that at the elevated electronic temperature that occurs upon photoexcitation, there is a non-centrosymmetric structure that is near-degenerate in energy with the centrosymmetric charge density wave structure, which explains the finite chirality of the optical transitions observed in the CDW phase of TiSe2.
I Introduction
TiSe2 is claimed to exhibit signatures of two nontrivial phenomena: an excitonic insulator (EI) phase, which is a Bose condensation of excitons, and a chiral charge-density wave (CDW) phase, a state where time reversal symmetry is spontaneously broken Kogar et al. (2017); Rohwer et al. (2011); Xu et al. (2020); van Wezel (2011); Hellgren et al. (2017); Weber et al. (2011); Kidd et al. (2002); Rossnagel et al. (2002); Cercellier et al. (2007); Ishioka et al. (2010). This has made it the subject of extensive experimental and theoretical studies, which in turn has led to diverging opinions on the microscopic nature of this transition. Some authors have suggested that the CDW phase of TiSe2 is mostly due to an excitonic insulator transition and the structural distortion follows this purely electronic transition Monney et al. (2011); Kogar et al. (2017), while other studies have argued that the CDW in TiSe2 is driven by electron-phonon coupling Hughes (1977); Whangbo and Canadell (1992); Rossnagel et al. (2002). A third point of view has suggested that the combination of exciton and phonon interactions are required to explain the CDW phase transition van Wezel et al. (2010); Zenker et al. (2013).
Indeed, some of the experimental and theoretical observations that led to these conclusions don’t seem mutually compatible. The plasmon softening Kogar et al. (2017) and the insulating state observed in photoemission measurements Cercellier et al. (2007) that were associated with the condensation of excitons in the CDW phase can be reproduced with density functional theory (DFT) calculations without invoking the role of excitons Lian et al. (2019); Hellgren et al. (2017). The chirality of the CDW phase Ishioka et al. (2010) is also difficult to reconcile with the fact that the CDW structure is centrosymmetric Xu et al. (2020).
These contradictory viewpoints are understandable, given that there is no distinct symmetry breaking associated with an EI transition that distinguishes it from a structural phase transition. The distinction is solely in the eyes of the beholder. An often discussed litmus test for an EI transition is a gedanken experiment where the nuclei are clamped to their equilibrium positions, and the electron subsystem experiences a transition with the atomic coordinates fixed in place. This is an unphysical criterion that neglects the interaction between ions and electrons, which is present in any material. Furthermore, this simplified consideration has a major conceptual problem: it classifies any transition associated with a divergence of the one-electron dielectric response, such as the well-known Peierls transition, as an EI, even though such transitions are not usually described as condensation of excitons.
In this paper we will show that it is possible to reconcile these contradictory viewpoints. Our primary focus will be to provide an explanation for the finite chirality observed in the CDW phase of TiSe2 and whether this is associated with the condensation of excitons or not. We will do so by presenting a combination of first-principles calculations and optical pump-probe measurements. The article is organized as follows. In Section II we briefly summarize the experimental observations that have led to the conflicting viewpoints mentioned above and propose a working definition for an exciton condensate and chiral charge density wave that reconciles these phenomena. In Section III we present our own experimental and theoretical results that demonstrate the chiral CDW, which has been observed in optical pump-probe measurements, can be explained by accounting for structural distortions that are screened by the large electronic temperature that occurs in such pump-probe studies. In particular, our working definition of an excitonic insulator (EI) that we present in Section II.2 and our results in Sec. III shows that (1) the chiral CDW in TiSe2 is not due to a transition to an excitonic insulator phase and (2) the chiral optical transitions observed in pump-probe studies are consistent with a transition of the centrosymmetric (222) structure to a non-centrosymmetric (221) structure, where these two structures are near-degenerate in energy based on our first-principles calculations.
II General Considerations
II.1 Summary of prior experimental studies
Pump-probe optical measurements are often used to address the question of whether the CDW transition is driven by an instability in the electronic or ionic response, since in this experiment one can heat the electron subsystem rapidly, and probe a combination of hot electrons and cold ions. Recently this method was applied to another putative EI, Ta2NiSe5 Baldini et al. (2020), where it was conclusively shown that the gap opening is driven primarily by structural distortions. Numerous attempts to use similar spectrosopic techniques on TiSe2 Lioi et al. (2016); Möhr-Vorobeva et al. (2011); Ishioka et al. (2010); Rohwer et al. (2011); Burian et al. (2020) have also been reported. Time-resolved x-ray diffraction (XRD) measurements or measurements of coherent phonon oscillations Burian et al. (2020); Möhr-Vorobeva et al. (2011); Rohwer et al. (2011) performed during these pump-probe studies have shown the structural distortion associated with the CDW can be quenched as a function of increasing laser fluence at lattice temperatures that are well below TCDW. Hence, it was conjectured that since this transition is driven by increasing laser fluence, this purportedly passes the test for TiSe2 being an EI. Furthermore, plasmon softening Kogar et al. (2017) has been measured at TCDW and was used as further evidence to support the EI nature of the transition. However, we will show that these assumptions are tenuous.
A phenemenological description of the transient response upon photo-excitation observed in these experiments can be understood as follows. The laser pump excites electrons to a higher energy where the energy is equal to the photon energy of the pump laser. Within a short timescale (femtoseconds) the photoexcited electrons thermalize via electron-electron interactions, which in turn raises the electronic temperature, , of the sub-system while the lattice temperature remains approximately fixed. Increasing the laser fluence raises . Thermalization with the lattice occurs over a relatively longer time scale Allen (1987).
The observation of chiral optical transitions at lattice temperatures around or below the CDW transition temperature, , of 180 K is another piece of intrigue around TiSe albeit not directly related with the putative EI physics. In this connection, it was particularly exciting to see several reports of chiral optical transitions Xu et al. (2020); Lioi et al. (2016); Ishioka et al. (2010), i.e., optical transitions with finite circular polarization.
Xu et al. Xu et al. (2020) observed evidence of a chiral CDW at and below 174 K through measurements of the circular photogalvanic effect (CPGE) current. This finite CPGE signal occurs at a a slightly lower temperature than , which they attributed to a “gyrotropic phase” with a yet-to-be-determined non-centrosymmetric structure that is distinct from the centrosymmetric (222) commensurate CDW phase. The CPGE is a second order nonlinear optical effect that is described by a third-rank tensor that takes on a finite value when inversion symmetry is broken Sipe and Shkrebtii (2000). To first order with respect to an electric field, we will show this is equivalent to the off-diagonal components of the dielectric tensor becoming finite for a hexagonal material such as TiSe2. However, one key assumption within the study of Xu et al. Xu et al. (2020) is that the underlying atomic structure in the CDW phase already has pre-existing chiral domains prior to photoexcitation that make the overall structure chiral. In contrast, we will show that for the case of pump-probe studies performed using high fluence, the CDW structure that is initially centrosymmetric can take on a non-centrosymmetric structure up to a critical value of .
II.2 What’s in a name?
To interpret these experimental observations, it is instructive to first consider a working definition for these two phenomena; i.e, what is an excitonic insulator and what is a chiral charge density wave?
When the term excitonic insulator Keldysh and Kopaev (1965) was first introduced, it was emphasized that the excitonic insulator is an analogue of BCS superconductivity where the instability occurs in the electron-hole (e-h), rather than the electron-electron (e-e) channel. Within this definition, one would need to invoke higher-order interactions, such as ladder diagrams of the Coulomb interaction to theoretically describe an excitonic insulator phase. These ladder diagrams are not included in standard density functional theory or in its Hartree-Fock like modifications. Hence, the advantage of this definition is that it provides means to directly test whether a material should be classified as an excitonic insulator based on the ability for standard DFT to describe the physical observables associated with such a phase. Note that while any failure of DFT does not imply evidence of an excitonic insulator state, the phenomena associated with an excitonic insulator cannot be described by standard DFT.
For the case of TiSe2 this includes a simultaneous description of the (222) reconstruction of the lattice in the CDW phase, the opening of a gap, the observation of plasmon softening at the CDW transition Kogar et al. (2017) and non-thermal melting of the CDW in pump-probe measurements at a lattice temperature well below the CDW transition temperature Rohwer et al. (2011); Möhr-Vorobeva et al. (2011); Lioi et al. (2016). Hellgren et al. Hellgren et al. (2017) used our definition of an excitonic insulator (without explicitly stating this definition) and demonstrated that hybrid functional DFT calculations, which do not incorporate electron-hole ladder diagrams, are able to reproduce the observed (222) commensurate CDW structure and to describe the insulating state of TiSe2.
It is worth noting that another seminal paper Jérome et al. (1967), which appeared two years after the work of Keldysh and Kopaev, implies that any sort of electronic instability that does not require any lattice degrees of freedom can be classified as an EI. This point of view was adapted in some recent publications Mazza et al. (2020); Möhr-Vorobeva et al. (2011) to describe an EI phase. We do not find it to be constructive, since this definition would include any and all instabilities associated with a divergence in the plain RPA dielectric function, such as a Peierls transition Peierls (1955). Such instabilities predate the notion of an EI by many decades and are not intuitively associated with an EI. Within this interpretation it is assumed that the transition occurs entirely within the electronic subsystem, while the ions follow the electronic CDW. While this line of reasoning may seem compelling, one needs to consider the fact that the ion-ion interaction is screened by electrons, and the response of the electrons may (but does not have to) depend on the electronic temperature, and thus can weaken or eliminate an ionic instability. If this mechanism is operative, the CDW disappears simply because hot electrons in a narrow-gap semiconductor, or in a semimetal, screen better than cold electrons, and therefore suppresses the magnitude of the ion-ion interaction responsible for the instability. Needless to say, this effect is not related to the notion of an excitonic insulator.
Regarding the chirality of the CDW phase, a crystal structure is chiral if it can be distinguished from its mirror image; that is, the latter cannot be superimposed onto the original structure by any sequence of rotations or translations Kelvin (1894). The crystal structure of TiSe2 is well established Di Salvo et al. (1976), and indeed the CDW in a single monolayer of TiSe2 is chiral, that is, it does not possess a center of inversion and it can formally support magnetooptical effects that need broken time-reversal symmetry. However, the unit cell of the bulk TiSe2 in both the high temperature phase and the bulk CDW phase is comprised of two monolayers of TiSe2 stacked alternatively, so that sign of the chirality (“handedness”) alternates and the crystal as a whole is achiral. It is then interesting to note that chiral optical transitions have been associated with this centrosymmetric CDW structure. However, these considerations do not preclude the presence of symmetry-breaking structural distortions of the Ti and/or Se atoms that would lead to a non-centrosymmetric structure.
So, for the purpose of this paper we will define a chiral CDW as a structure that breaks inversion symmetry, and upon including spin-orbit coupling (SOC), leads to a combination of broken inversion and time-reversal symmetry and in turn, non-zero optical chirality. Formally, the observation of finite optical chirality does not have to be necessarily related to breaking of spatial symmetry breaking. For instance, one can imagine, theoretically, a situation when a finite magnetization is generated by optical pumping (even though it is rather unlikely in this material). Obviously — and consistent with the experiment, — in TiSe2 it is highly unlikely, particularly given that the effect appears only upon heating up the electronic subsystem.
III Results
III.1 Pump-probe measurements
We measure the transient change in the reflectivity, , that is induced by our pump pulse. Our experiments are conducted at 3 K with a pump fluence of 0.17 mJ/cm2. The circular dichroism (CD) in transmission geometry is defined as where is the absorbance of the right (left) circularly polarized light. However, within the reflection geometry the beam should have no CD signal at normal incidence due to symmetry considerations. However, if the incident beam is at a finite angle from the normal to the sample surface, then circular dichroism in reflection geometry becomes finite. Silverman (1986)
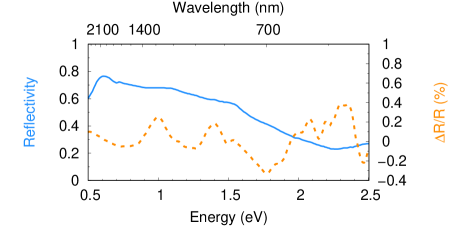
Measurement of the CD using broadband transient optical reflectivity proceeds by recording the transient change in reflectivity, , induced by the linearly polarized pump pulse, using a circularly polarized white light probe beam (with right () and left () handed circular polarization) defined as: = lg The measured transient circular dichroism (TRCD) signal in broadband time-resolved optical reflectivity experiment is then , which corresponds to the degree of circular polarization. We identify two different relaxation time scales for the TRCD: a picosecond time scale which is commensurate with electron-phonon relaxation times and a longer nanosecond timescale that is typically associated with phonon-phonon relaxation times. Figure 1 illustrates the wavelength dependence of the optical density due to left and right circularly polarized light measured on the picosecond time scale and the circular dichroism as a function of wavelength.
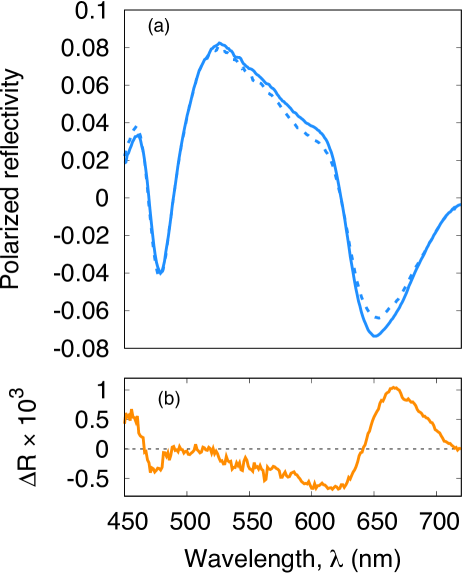
At 3 K (well below 180 K), we find the degree of circular polarization is finite in the spectral range between =550 nm and =725 nm. We also find the degree of circular polarization to be finite in this wavelength range for TRCD measured on the nanosecond timescale SM . Further details on these two relaxation time scales and the approach used to extract these decay times from the raw transient reflectivity data are contained in Ref. Lioi et al., 2016. Our results, in agreement with Ref. Möhr-Vorobeva et al. (2011), shows that above the critical fluence we use in this study, the chirality of the optical transitions is zero and the chiral CDW is quenched.
As we discuss in Sec. II, the pump pulse used in our study will lead to a change in the electronic temperature temperature of the system while the lattice temperature remains fixed. Let us estimate what value of this corresponds to. For a given photon fluence, , material volume, , penetration depth of the excitation, , electronic specific heat for formula unit, and the magnitude of the reflectivity, , the critical electronic temperature is defined as . The electronic specific heat, , is defined as: , where is the average electronic density of states per formula unit. The average electronic specific heat, , when the TiSe2 carriers are heated from an electronic temperature of 0 K to K can defined as Hence, . In our experiment we use an excitation wavelength, , of 800 nm. The absorption index at this wavelength is 3.2 Buslaps et al. (1993); Bayliss and Liang (1985). Combining this information, we determine the penetration depth, as and obtain a value of 19 nm. The fluence, , used for the results report in Fig. 1 is 0.17 mJ/cm2. Using the density of states at the Fermi level of 1 state/eV per formula unit, from our first-principles calculation, we find . The volume of the TiSe2 unit cell is 0.072 nm3 and the reflectivity, at =800 nm is 0.5 Velebit et al. (2016).
Combining all of this information leads to a 690 K. Note that other studies have reported different values of fluence and a slightly different of 790 nm at which the CDW is suppressed. The values for the critical fluence, , ranges between 0.17 mJ/cm2 to 0.5 mJ/cm2 Rohwer et al. (2011); Möhr-Vorobeva et al. (2011); Lioi et al. (2016). This leads to a range of values for . the lowest value being 690 K and the highest value is 1180 K.
The experimental data above shows that TiSe2 exhibits a finite chirality in the optical reflectivity with the peak in the chirality centered at 625 nm. The lattice temperature for these measurements is 3 K while the electronic temperature at the fluence used in Fig. 1 corresponds to of 690 K. As we discuss in Sec. II at a lattice temperature of 3 K, TiSe2 is expected to take on the centrosymmetric structure which should not lead to finite chirality. In the following we aim to rationalize this puzzling observation by performing first-principles calculations based on density functional theory (DFT).
III.2 DFT calculations
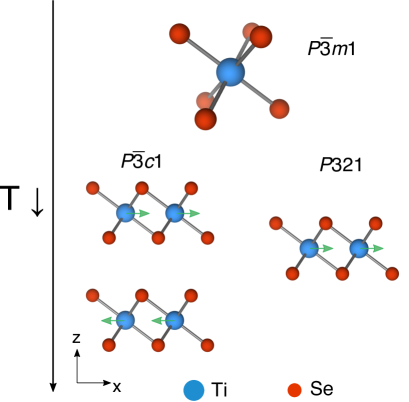
Above the CDW transition temperature, bulk 1T-TiSe2 is stable in a hexagonal centrosymmetric structure (space group 164, ) where the Ti atoms are octahedrally coordinated by Se. We use the experimental lattice constants of bulk TiSe2 in the normal phase (=3.527Å and =5.994Å) Di Salvo et al. (1976) to determine the electronic structure. We find the high- phase to be a semi-metal, with a hole-like pocket at and an electron-like pocket at M and L, in agreement with previous calculations of the bulk structure of TiSe2 Hellgren et al. (2017). The hole pocket at is derived primarily from Se states, while the electron pockets are derived from Ti -states.
The CDW transition temperature, , of bulk TiSe2 is 180 K Di Salvo et al. (1976); Joe et al. (2014), below which TiSe2 undergoes a () reconstruction to the commensurate CDW phase. This is accompanied by a displacement of the Ti along the basal plane and a minor rotation of the Se atoms around each Ti atom, Di Salvo et al. (1976) and the corresponding space group of the structure changes from to . Recent studies Wegner et al. (2019, 2020) have also suggested that displacements of the Ti and Se atoms that are distinct from the structure. Within our DFT calculations, we find each of these displacement patterns of the Ti and Se atoms within the (222) reconstruction to be near degenerate in energy with respect to each other. More importantly, all these structures are centrosymmetric, similar to the unreconstructed structure or the CDW structure.
As we discuss in Sec. II, a structural distortion that leads to a non-centrosymmetric structure may be a plausible source of the finite optical chirality that has been observed in the CDW phase. If we examine the calculated phonon dispersion for TiSe2 Hellgren et al. (2017), we note that there are two soft modes, one at the M and a second at the L high-symmetry points, which correspond to structural instabilities. Indeed, the soft mode at the L-point corresponds to the (222) CDW reconstruction. The soft mode at the M-point would correspond to a (221) structural distortion. Such a structure, which has a lower space group, , does not possess a center of inversion. Figure 2 illustrates these two possible structural distortions that can occur starting from the high-temperature structure.
In order to elucidate whether these structural distortions are impacted by the elevated electronic temperatures that occur in pump-probe studies, we performed DFT calculations, varying the magnitude of the electronic temperature, from 0.005 eV to 0.1 eV (corresponding to an effective of 58 K to 1160 K) and optimize the atomic coordinates of TiSe2 using both (221) and () reconstructions. Within this approach we assume the photoexcited electrons in our pump-probe study have thermalized (within femtoseconds as discussed in Sec. II) to an electronic temperature that is determined in part by the fluence while the lattice temperature remains fixed.
In practice, this is done by varying the magnitude of the Fermi-Dirac energy broadening, , used in the self-consistent cycle of our DFT calculations (cf. Sec. V and Ref. SM, ). For each value of , we perform a structural optimization and determine the distance, , by which the Ti atoms are displaced away from their their positions within the structure. In agreement with published results Hellgren et al. (2017), we find the () to be the ground state, and the magnitude of the displacement, to be somewhat underestimated (it was shown in Ref. Hellgren et al. (2017) that this may be corrected by adding a small fraction of Hartree-Fock exchange using a hybrid functional). The normalized displacements with respect to the displacement determined for the lowest energy broadening ( = 0.005 eV, =58K), , are shown in Fig. 3 for the structure.
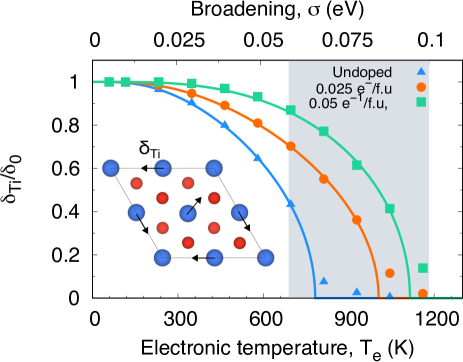
We find that for low values of , the Ti atoms are displaced strongly away from their corresponding high-symmmetry position and the structure retains the low-symmetry structure. However, at a critical value of the electronic temperature, , the Ti atoms converge to their high-symmetry positions and the structure is stable in the undistorted structure. We plot , which we define as the order parameter for this structural transition as a function and find that it exhibits a BCS-like temperature dependence. If we fit our first-principles calculations in Fig. 3 to the following BCS expression
| (1) |
we find a critical temperature, , to be 782 K, at which the non-centrosymmetric structure transforms to the high-temperature centrosymmetric structure (with a Hartree-Fock correction added as in Ref. Hellgren et al. (2017), this temperature would likely be slightly higher).
We also consider the effect that intrinsic doping may have on this structural phase boundary. Several studies have shown as-grown TiSe2 exhibits -type conductivity that is likely due to unintentional impurities or native defects Watson et al. (2019); Moya et al. (2019); Campbell et al. (2019), which act as a source of excess electrons. To this end, we simulate the effect of -type doping by changing the number of valence electrons and adding a compensating jellium background charge, and optimize the atomic coordinates and the volume starting from the structure for different values of . We investigate the effect of the following doping concentrations; 0.025 /TiSe2 f.u, 0.05 /TiSe2 f.u. The change in as a function of with respect to doping is also illustrated in Fig. 3. We fit the results of for the two different doping levels to Eq. 1 and find increases to 1005 K for 0.025 /TiSe2 f.u and is 1115 K for a doping concentration of 0.05 /TiSe2 f.u.
We also conducted a similar analyses as in Fig. 3, taking into account different approximations within DFT SM and find qualitatively similar behavior. The order parameter always exhibits a similar BCS-like temperature dependence and the obtained by fitting versus to Eq. 1 for the different approximations we tested is within 6 of the for undoped TiSe2 reported in Fig. 3.
Applying the same procedure to the centrosymmetric CDW structure, we find it also converges to the structure at large values of . This is reflected in our calculations of the difference in the total energy of the and structures with respect to structure as a function of , as illustrated in Fig. 4. Note that while the structure is slightly lower in energy than the structure for all values of , in agreement with the static equilibrium structure. This difference in energies is very small and may be reversed at some value of once the effects of vibrational entropy are properly accounted for. We speculate, based on our experimental findings, that this happens at some electronic temperature, , such that
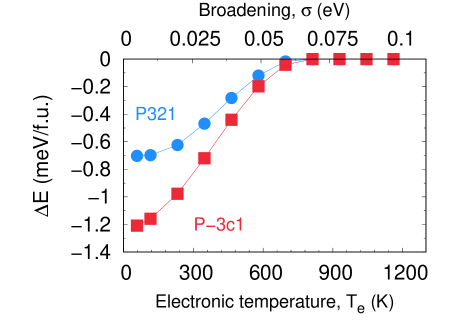
Hence, from these calculations the following picture emerges. While the centrosymmetric structure is the ground state CDW phase, the non-centrosymmetric structure is near-degenerate in energy. Hence, upon photo-excitation, the rapid increase in stablizes the structure when becomes larger than and the magnitude of the displacement of the Ti atoms with respect to the structure depends on . The structure lacks a center of inversion and this, as we will show in Section III.3, leads to finite circular dichroism, i.e, a chiral CDW. When increases due to increasing fluence, the Ti atoms are weakly displaced with respect to their positions within the structure. At , the ion-electron interactions are sufficiently weak so that the transition to the non-centrosymmetric , or the centrosymmetric structure no longer occurs. Instead, the achiral centrosymmetric structure is stable and the finite circular polarization is quenched, i.e non-thermal melting of the (chiral) CDW occurs.
Our estimate for the critical electronic temperature, , from our first-principles calculations, where the chiral structure is quenched ranges between 730 K for undoped TiSe2 up to 1115 K for TiSe2 doped with 0.05 /TiSe2 f.u., which is well within the range of values for the critical that we estimate by analyzing pump-probe experiments at the end of Sec. III.1. This proves that the suppression of the optical chirality as a function of increasing laser fluence observed in pump-probe studies is not related to the presence of an excitonic insulator. Instead it is due to structural distortions that are screened by an elevated electronic temperature.
III.3 Optical properties
To demonstrate that the centrosymmetric and the noncentrosymmetric structures do indeed lead to zero and non-zero chirality in their optical transitions, respectively, we calculate the real and imaginary parts of the dielectric function. We then determine the reflectivity, , and the degree of chirality, SM . The calculated reflectivity is illustrated in Fig. 5.
First, we find the magnitude of the total reflectivity does not vary significantly for either the or the CDW structures or the high-temperature structure. For photon energies between 0.5 eV and 2.5 eV the magnitude of the reflectivity ranges between 0.4 and 0.6. The reflectivity for the structure is illustrated in Fig. 5. We note that magnitude of the reflectivity across this range of energies is also consistent with what has been measured experimentally Velebit et al. (2016).
To determine the degree of circular dichroism of the reflectivity we then compare the difference between the off-diagonal components of the imaginary part of the dielectric function SM . Since the high temperature structure and the CDW structure both possess a center of inversion and they also preserve time-reversal symmetry, left and right circularly polarized optical transitions are equal in magnitude and, as a result, one would expect the degree of circular dichroism to be zero. Indeed, we find this to be the case from our first-principles calculations for the two centrosymmetric structures, i.e they are achiral.
However, for the non-centrosymmetric structure, we find the off-diagonal components of the dielectric function are finite and this leads to finite circular polarization as we show in Fig. 5. The degree of circular polarization is finite within an energy range of 1.5 eV to 2 eV, which is approximately the energy range where finite circularly polarized transitions occurs in our pump-probe measurements of TiSe2 (Fig. 1(b)). This is also consistent with the range of wavelengths where finite circular polarization has been observed in previous pump-probe studies of TiSe2 Rohwer et al. (2011); Möhr-Vorobeva et al. (2011). We also conjecture that continuous wave excitation under sufficiently high power, long duration and at lattice temperatures below , as used in the study by Xu et al. Xu et al. (2020), may also conspire to lead to the finite CPGE current. Based on our results and discussion presented above, this does not require the pre-existence of chiral domains. Instead, photoexcitation above a critical power may lead to a finite fraction of the atomic structure to be trapped in the non-centrosymmetric structure, which would lead to finite chirality.
Hence, from these calculations we can conclude the following. The observation of chiral optical transitions during pump-probe measurements on TiSe2 cannot be explained by the conventional structure that is associated with the (222) commensurate CDW phase of TiSe2. Instead, a symmetry breaking mechanism that leads to a finite difference between right and left circularly polarized optical transitions has to be operative. Our calculations suggest the non-centrosymmetric structure that is near-degenerate in energy with the is stabilized upon photo-excitation. The structure leads to finite circularly polarized transitions that are consistent with the signatures of the chiral CDW that have been identified in pump-probe studies of TiSe2.
IV Conclusions
Comparing our first-principles calculations with experiment, we draw two main conclusions. First, the experimentally observed non-thermal melting of the CDW in TiSe2, that is, melting of the CDW upon heating the electron subsystem, can be quantitatively explained by the effect of the electronic temperature on the electron screening of the ion-ion interactions. This is a one-electron effect not related in any manner with the physics of excitonic insulators. Therefore, non-thermal melting of the CDW alone does not provide evidence for the existence of an excitonic insulator state in TiSe
Second, we observe, in agreement with previous measurements, that the chiral optical response of TiSe2 exists for a finite range of laser fluences, in other words, within a finite range of electronic temperatures. To this effect, we calculated the energy difference between the ground state centrosymmetric CDW structure ( and the non-centrosymmetric CDW structure, and found it to be extremely small ( K). Furthermore, this energy difference rapidly decreases as the electronic temperature increases. We conjecture that there is a small additional energy term, possibly related to vibrational entropy, that is outside the scope of our static lattice DFT calculations, which is either independent of the electronic temperature, or even grows with it. Such a contribution would impact the energy difference between the and structures and lead to the noncentrosymmetric structure to be the ground state at some intermediate electronic temperature, .
V Methods
V.1 Experiments
Single crystals of TiSe2 were prepared using the chemical vapor transport technique with iodine as a transport agent in a manner similar to that used by Oglesby et al. Oglesby et al. (1994). We used Titanium powder (99.99%), Selenium powder (99.999%), and Iodine powder (99.99%) purchased from Alfa Aesar. The powders were premixed and inserted into quartz tubes which were evacuated to 10-4mTorr. We allowed crystal growth to proceed for 3 weeks before quenching the reaction and retrieving the single crystals.
Broadband transient optical reflectivity was measured using the split output of an 800 nm 35 fs Ti:sapphire laser system equipped with an optical parametric amplifier. The pump pulses, having a wavelength of 800 nm (1.55 eV), were incident on the sample at 1 kHz using a synchronized chopper that blocks every other pulse of the parent laser operating at a 2 kHz repetition rate. A delayed white light supercontinuum probe was generated by focusing the 800 nm laser into a CaF2 plate. The pulse beam had a 600 m diameter spot size and the probe beam spot size had a 100 m diameter. An adjustable time delay is established between the pump and probe pulse by means of a mechanical track that adjusts the path of the probe pulse. The pump beam was incident on the sample at an angle of incidence close to 20∘ and the probe beam was oriented with an angle of incidence at 30∘. The pump pulse is linearly polarized while the probe pulse is circularly polarized (CP). In order to control the handedness of the CP probe beam a Pockels cell was inserted into the probe beam path. The Pockels cell using a KD*P crystal was driven using the low jitter Q-switch driver QBU-BT-6024-LJ from Vigitek, Inc. (http://vigitek.biz). All of the pump-probe data was obtained at 3 K (well below TCDW = 200 K) with a pump fluence of 0.17 mJ/cm2.
V.2 First-principles calculations
Our calculations are based on density functional theory within the projector-augmented wave method Blöchl (1994) as implemented in the Vienna Ab-initio Simulation Package (VASP) Kresse and Hafner (1993); Kresse and Furthmüller (1996). All of the results in the main text use the generalized gradient approximation (GGA) defined by the Perdew-Burke-Ernzerhof functional Perdew et al. (1996). We use the Ti PAWs where the , , and the Se PAWs where the , electrons are treated as valence and a plane-wave energy cutoff of 400 eV. All of the structural relaxations of the bulk unit cell used a (242412) -point grid. Calculations of the (222) and the (221) CDW structures used -point grids that were scaled with respect to the k-point grid used for the unit cell. An energy convergence criteria of 10-8eV and a force convergence criteria of 2 meV/ was used for all of the calculations. To examine the structural phase transition as a function of electronic temperature we used the Fermi-Dirac smearing scheme. The Grimme-D3 correction scheme was used to account for van-der-Waals interactions Grimme et al. (2010). The space groups of the different structures were determined using spglib Togo and Tanaka (2018). To determine the circular polarization of the optical transitions, we calculate the imaginary and real part of the dielectric function with spin-orbit interaction included.
VI Data availability
The data that support the findings of this study are available from the corresponding author upon reasonable request.
Acknowledgements.
We thank Nuh Gedik, Qiong Ma, and Su-Yang Xu for insightful discussions. D.W. was supported by the Laboratory-University Collaboration Initiative of the DoD Basic Research Office. G.K acknowledges support from the NSF under Grant No. ECCS-1711015. Use of the Center for Nanoscale Materials, an Office of Science user facility, was supported by the U.S. Department of Energy, Office of Science, Office of Basic Energy Sciences, under Contract No. DE-AC02-06CH11357. I.I.M. was supported by ONR through grant N00014-20-1-2345.References
- Kogar et al. (2017) A. Kogar, M. S. Rak, S. Vig, A. A. Husain, F. Flicker, Y. I. Joe, L. Venema, G. J. MacDougall, T. C. Chiang, E. Fradkin, et al., Science 358, 1314 (2017).
- Rohwer et al. (2011) T. Rohwer, S. Hellmann, M. Wiesenmayer, C. Sohrt, A. Stange, B. Slomski, A. Carr, Y. Liu, L. M. Avila, M. Kalläne, et al., Nature 471, 490 (2011).
- Xu et al. (2020) S.-Y. Xu, Q. Ma, Y. Gao, A. Kogar, A. Zong, A. M. M. Valdivia, T. H. Dinh, S.-M. Huang, B. Singh, C.-H. Hsu, et al., Nature 578, 545 (2020).
- van Wezel (2011) J. van Wezel, EPL 96, 67011 (2011).
- Hellgren et al. (2017) M. Hellgren, J. Baima, R. Bianco, M. Calandra, F. Mauri, and L. Wirtz, Phys. Rev. Lett. 119, 176401 (2017).
- Weber et al. (2011) F. Weber, S. Rosenkranz, J.-P. Castellan, R. Osborn, G. Karapetrov, R. Hott, R. Heid, K.-P. Bohnen, and A. Alatas, Phys. Rev. Lett. 107, 266401 (2011).
- Kidd et al. (2002) T. Kidd, T. Miller, M. Chou, and T.-C. Chiang, Phys. Rev. Lett. 88, 226402 (2002).
- Rossnagel et al. (2002) K. Rossnagel, L. Kipp, and M. Skibowski, Phys. Rev. B 65, 235101 (2002).
- Cercellier et al. (2007) H. Cercellier, C. Monney, F. Clerc, C. Battaglia, L. Despont, M. Garnier, H. Beck, P. Aebi, L. Patthey, H. Berger, et al., Phys. Rev. Lett. 99, 146403 (2007).
- Ishioka et al. (2010) J. Ishioka, Y. Liu, K. Shimatake, T. Kurosawa, K. Ichimura, Y. Toda, M. Oda, and S. Tanda, Phys. Rev. Lett. 105, 176401 (2010).
- Monney et al. (2011) C. Monney, C. Battaglia, H. Cercellier, P. Aebi, and H. Beck, Phys. Rev. Lett. 106, 106404 (2011).
- Hughes (1977) H. Hughes, J. Phys. C: Solid State Physics 10, L319 (1977).
- Whangbo and Canadell (1992) M. H. Whangbo and E. Canadell, J. Am. Chem. Soc. 114, 9587 (1992).
- van Wezel et al. (2010) J. van Wezel, P. Nahai-Williamson, and S. S. Saxena, Phys. Rev. B 81, 165109 (2010).
- Zenker et al. (2013) B. Zenker, H. Fehske, H. Beck, C. Monney, and A. Bishop, Physical Review B 88, 075138 (2013).
- Lian et al. (2019) C. Lian, Z. A. Ali, and B. M. Wong, Phys. Rev. B 100, 205423 (2019).
- Baldini et al. (2020) E. Baldini, A. Zong, D. Choi, C. Lee, M. H. Michael, L. Windgaetter, I. I. Mazin, S. Latini, D. Azoury, B. Lv, et al., arXiv preprint arXiv:2007.02909 (2020).
- Lioi et al. (2016) D. Lioi, R. Schaller, G. Wiederrecht, and G. Karapetrov, arXiv preprint arXiv:1612.01838 (2016).
- Möhr-Vorobeva et al. (2011) E. Möhr-Vorobeva, S. L. Johnson, P. Beaud, U. Staub, R. De Souza, C. Milne, G. Ingold, J. Demsar, H. Schäfer, and A. Titov, Phys. Rev. Lett. 107, 036403 (2011).
- Burian et al. (2020) M. Burian, M. Porer, J. R. Mardegan, V. Esposito, S. Parchenko, B. Burganov, N. Gurung, M. Ramakrishnan, V. Scagnoli, H. Ueda, et al., arXiv preprint arXiv:2006.13702 (2020).
- Allen (1987) P. B. Allen, Phys. Rev. Lett. 59, 1460 (1987).
- Sipe and Shkrebtii (2000) J. Sipe and A. Shkrebtii, Physical Review B 61, 5337 (2000).
- Keldysh and Kopaev (1965) L. Keldysh and Y. V. Kopaev, Soviet Physics Solid State, USSR 6, 2219 (1965).
- Jérome et al. (1967) D. Jérome, T. Rice, and W. Kohn, Phys. Rev. 158, 462 (1967).
- Mazza et al. (2020) G. Mazza, M. Rösner, L. Windgätter, S. Latini, H. Hübener, A. J. Millis, A. Rubio, and A. Georges, Physical Review Letters 124, 197601 (2020).
- Peierls (1955) R. Peierls, London, England p. 108 (1955).
- Kelvin (1894) W. T. B. Kelvin, The molecular tactics of a crystal (Clarendon Press, 1894).
- Di Salvo et al. (1976) F. J. Di Salvo, D. Moncton, and J. Waszczak, Phys. Rev. B 14, 4321 (1976).
- Silverman (1986) M. P. Silverman, J. Opt. Soc. Am. A 3, 830 (1986).
- (30) See Supplemental Material at … for details on the computational methodology, approach to determine the degree of circular polarization from first principles and convergence tests of the structural phase transition using different approximations within DFT.
- Buslaps et al. (1993) T. Buslaps, R. Johnson, and G. Jungk, Thin Solid Films 234, 549 (1993).
- Bayliss and Liang (1985) S. Bayliss and W. Liang, Journal of Physics C: Solid State Physics 18, 3327 (1985).
- Velebit et al. (2016) K. Velebit, P. Popčević, I. Batistić, M. Eichler, H. Berger, L. Forró, M. Dressel, N. Barišić, and E. Tutiš, Phys. Rev. B 94, 075105 (2016).
- Joe et al. (2014) Y. I. Joe, X. Chen, P. Ghaemi, K. Finkelstein, G. de La Peña, Y. Gan, J. Lee, S. Yuan, J. Geck, G. MacDougall, et al., Nature Physics 10, 421 (2014).
- Wegner et al. (2019) A. Wegner, D. Louca, and J. Yang, Phys. Rev. B 99, 205110 (2019).
- Wegner et al. (2020) A. Wegner, J. Zhao, J. Li, J. Yang, A. Anikin, G. Karapetrov, K. Esfarjani, D. Louca, and U. Chatterjee, Phys. Rev. B 101, 195145 (2020).
- Watson et al. (2019) M. D. Watson, A. M. Beales, and P. D. King, Phys. Rev. B 99, 195142 (2019).
- Moya et al. (2019) J. M. Moya, C.-L. Huang, J. Choe, G. Costin, M. S. Foster, and E. Morosan, Phys. Rev. Mat. 3, 084005 (2019).
- Campbell et al. (2019) D. J. Campbell, C. Eckberg, P. Y. Zavalij, H.-H. Kung, E. Razzoli, M. Michiardi, C. Jozwiak, A. Bostwick, E. Rotenberg, A. Damascelli, et al., Phys. Rev. Mat. 3, 053402 (2019).
- Oglesby et al. (1994) C. Oglesby, E. Bucher, C. Kloc, and H. Hohl, Journal of crystal growth 137, 289 (1994).
- Blöchl (1994) P. E. Blöchl, Phys. Rev. B 50, 17953 (1994).
- Kresse and Hafner (1993) G. Kresse and J. Hafner, Phys. Rev. B 47, 558 (1993).
- Kresse and Furthmüller (1996) G. Kresse and J. Furthmüller, Physical review B 54, 11169 (1996).
- Perdew et al. (1996) J. P. Perdew, K. Burke, and M. Ernzerhof, Phys. Rev. Lett. 77, 3865 (1996).
- Grimme et al. (2010) S. Grimme, J. Antony, S. Ehrlich, and H. Krieg, J. Chem. Phys. 132, 154104 (2010).
- Togo and Tanaka (2018) A. Togo and I. Tanaka, arXiv preprint arXiv:1808.01590 (2018).