Molecular Fluid Flow in MoS2 Nanoporous Membranes and Hydrodynamics Interactions
Abstract
The shift in water security demands improvements in alternative solutions such as saltwater desalination. One of the most efficient technologies in this scope is the reverse osmosis systems, a technology based on a membrane separation process. MoS2 nanoporous membranes are gained attention as a promise for the next-generation high selective and permeable membranes technology. Besides that, one aspect of nanoconfined fluid flow not yet investigated but studied from the fluid mechanics calculations is the impact of induced pressure fields in the water flux in neighboring microfilters, described as hydrodynamic interactions. For this purpose, we studied the water flow through adjacent MoS2 nanopores by running Non-Equilibrium Molecular Dynamics simulations and obtained that in this scale the hydrodynamics interactions are not significant as expected.
I introduction
Water scarcity is one of the major challenges of our time. Changing climate patterns responsible for disturbing the hydrological cycle combined with growing water demand are shifting the water security towards high-risk levels [1]. In the face of the problem, seawater desalination technology has gained attention. Over the past decades, improvements in the sector have allowed a considerable reduction of power needed to desalinate seawater, due to advances in membrane technology and energy recovery equipment [2, 3].
High-performance membranes, that can exhibit superior selectivity and high water flowrate are in the sight of the development of the next-generation desalination technology [4, 3]. Meanwhile, computational models have been used to better understand the desalination process in the nanoscale. Molecular dynamics simulations are a powerful theoretical approach to study the physics behind nanofluidic systems once it allows for probing the microscopic behavior of a collection of atoms while performing timescale feasible simulations [5, 6]. Through it, we can propose new membrane materials nanostructured designed to improve the desalination process.
One suited simulation branch to better understand the desalination process is mimic the reverse osmosis desalination system at the nanoscale. A pressure-driven transport can be created and the resulting water flow through nanopores and ions rejection can be studied [7, 8, 9, 10, 11, 12, 13, 14, 15, 16, 17, 18, 19]. This technique enters in the scope of Non-Equilibrium Molecular Dynamics (NEMD). Also, its procedure has been used to get insights in design new membrane materials for desalination. Among the 2D membranes recently been investigated, the molybdenum disulfide (MoS2) nanoporous membrane are a promising one [16, 15, 20, 21, 22, 23, 24, 25].
Usually, the water properties in confined systems differ from the bulk values. Also, the water transport mechanism confined in nanopores can be very different from the continuum hydrodynamics description [27]. The continuum hypothesis is one of the fundamentals assumptions of fluid mechanics, which is successful in describing the macroscopic behavior of fluid flow and states that fluid properties, such as pressure, density, and velocity, are well defined at infinitesimally small points and vary continuously from one point to another [28]. However, in narrow nanopores (¡ 2 nm of diameter), the water flow is layered and a non-quadratic velocity profile emerges from it [29]. For such small molecular size pores, it is more useful to discuss the fluid transport using permeability and flow rate rather than viscosity and slip length, for example [28].
Nevertheless, the fluid mechanics calculations in microfilters assume the existence of hydrodynamic interactions between adjacent pores. The interaction arises from the pressure field induced by the next pore which in turn makes the single pore water flow solution not sufficiently precise to expand its conclusions to the microfilters flow system [30]. The influence of the pore number and its distance plays an important role in the overall water flux in the classical hydrodynamic picture. In addition, the simulations conducted so far in the scope of molecular dynamics desalination systems assume that the water flux results scale linearly with the nanopore number [31], but assuming hydrodynamic interactions would lead to a deviation of this assumption if the nanopores are close enough. These open questions are elucidated in this work.
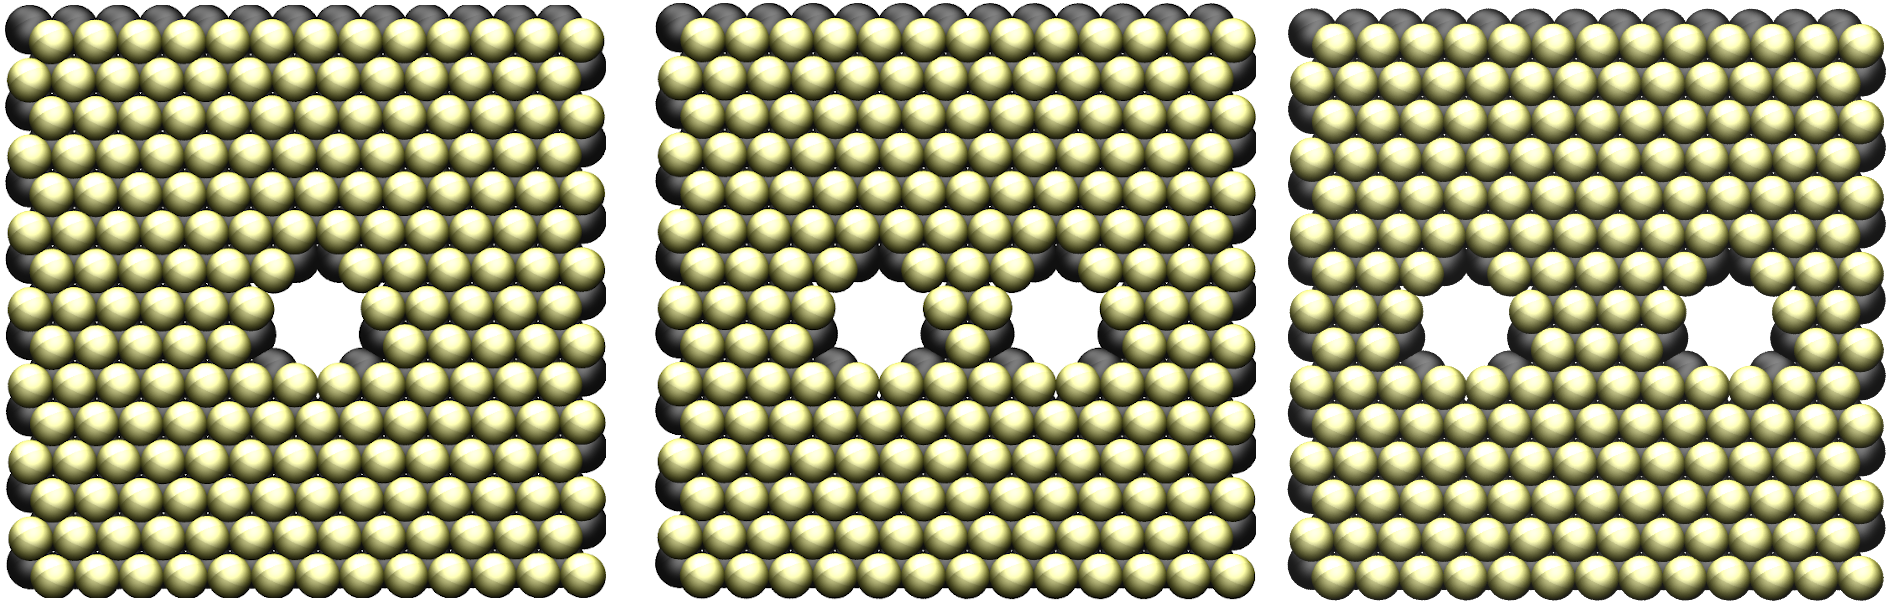
NEMD simulations were been conducted to shed light on the behavior of liquids in the nanoscale [32]. For the purpose of investigating if hydrodynamics interactions play a role in the nanoscale, the nanopore number and its proximity implications in water flux and salt rejection were evaluated in this work in the boundary of NEMD. To do so, we used three different MoS2 membrane designs with different nanopore number (Figure 2-left and others) and different nanopore distance (Figure 2-center and right). These membranes were designed in order to maintain the nanopore chemistry and geometry the same in each case. So, the only difference in water flow would be due to hydrodynamic interactions.
II Computational Details
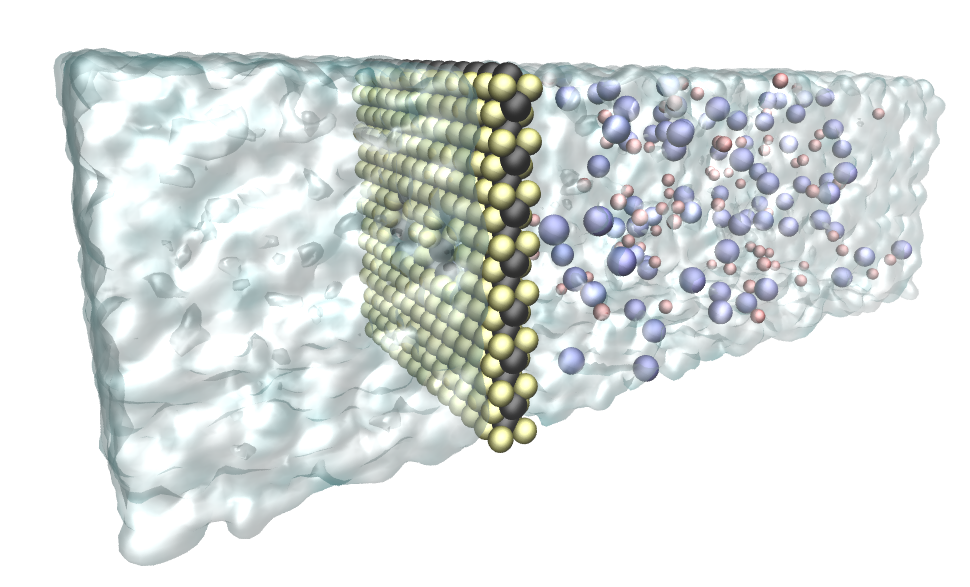
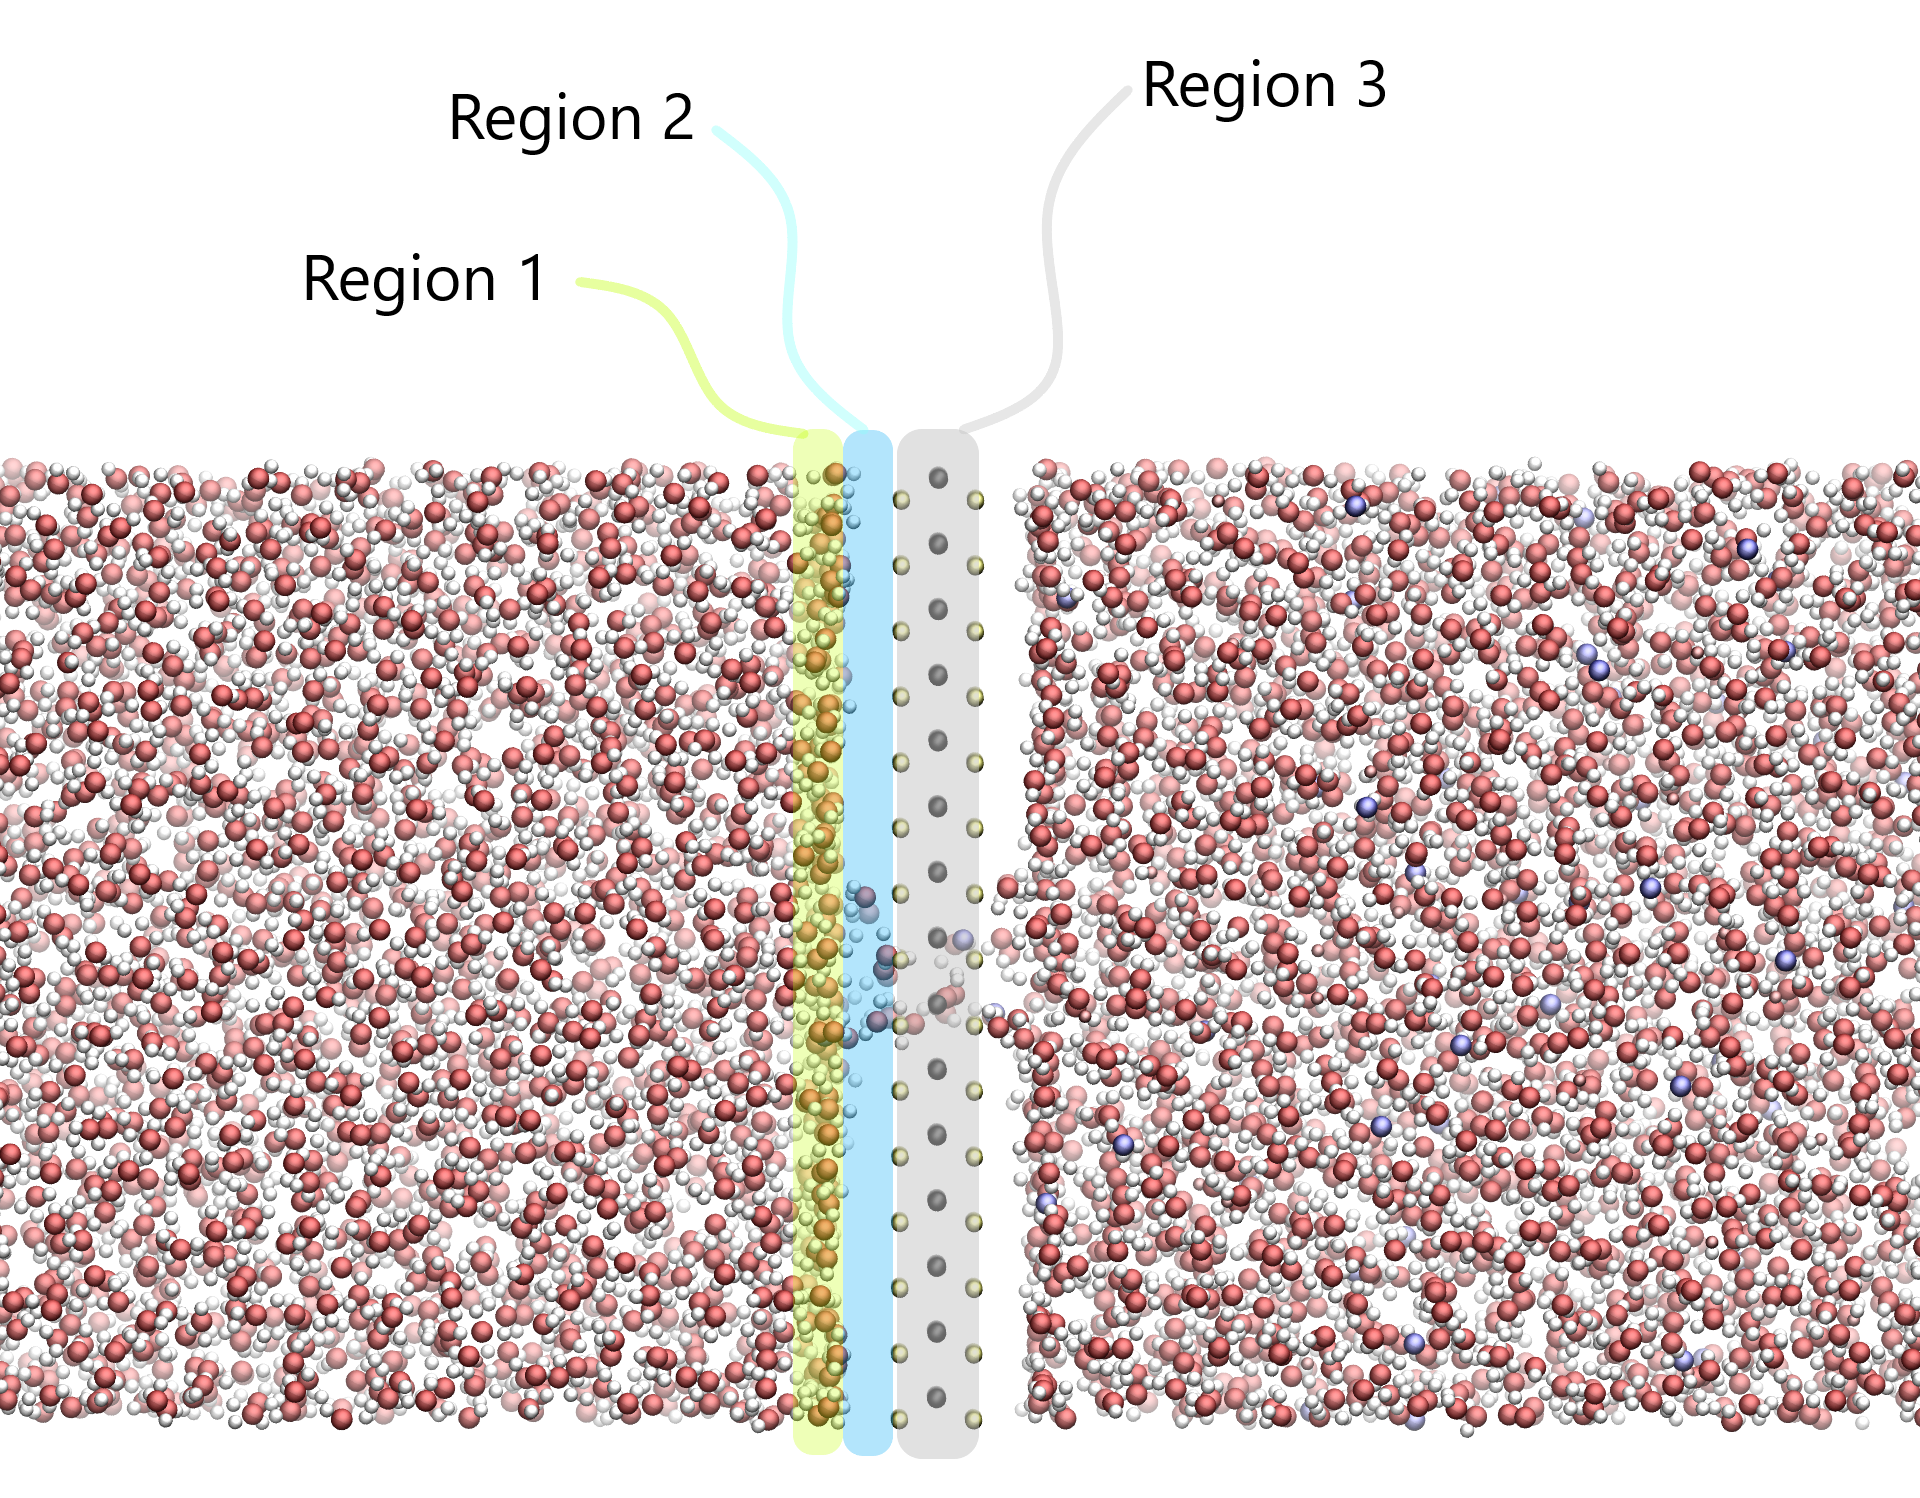
The reverse osmosis desalination system can be designed in the scope of MD simulation as composed of two reservoirs (one of saltwater, that is the feed side, and another of pure water, that is the permeate side) separated by a membrane, as illustrated in Figure 1. The two reservoirs can be confined by graphene barriers, for example, which in turn can serve as pistons to control the fluid pressure during the running desalination process.
| [Å] | [kcal/mol] | Charge (e) | |
|---|---|---|---|
| Na [33] | 2.52 | 0.0346 | 0.885 |
| Cl [33] | 3.85 | 0.3824 | -0.885 |
| O-Tip4p/ [34] | 3.165 | 0.1848 | -1.054 |
| H-Tip4p/ [34] | 0.0 | 0.0 | 0.5270 |
| Mo [35] | 4.20 | 0.0135 | 0.6 |
| S [35] | 3.13 | 0.4612 | -0.3 |
| C [36] | 3.40 | 0.0860 | 0.0 |
As initial conditions in our simulations, the pure water side contains 1550 water molecules and the saltwater side contains 170 ions and 4930 water molecules, resulting in a solution of 1 mol/L of concentration. The MoS2 membrane has a dimension of 4 x 4 nm and is held fixed in space. By doing that, we can work with high gradient pressures for statistical purposes. This is important in the sense of generating a sufficient number of events in a short time interval of 10 ns. The nanopores sizes were chosen to have 0.97 nm in diameter (defined as the distance center to center of atoms) in order to satisfy the minimum size in which the models employed does not show the ion blockage effect, as previous studies shown [17].
The simulations were performed using the LAMMPS [37]. The particles interact with each other via Lennard-Jones (LJ) and Coulomb potential. The parameters used in this work are summarized in Table 1. The Tip4p/ and NaCl/ model was used once they were parameterized to provide the correct value of bulk water dielectric constant [34] and mixture dielectric constant [33].
The simulations can be understood as follows, the first part has some equilibrations steps and the second is the non-equilibrium running process. In the first part, the two reservoirs were not in contact with each other, that is the nanopore is closed until the system is equilibrated properly. The simulations start with the total system energy been minimized during 0.5 ns in NVE ensemble. After that, a NPT ensemble was conducted during 1 ns at 300 K and 1 bar in each reservoir. Then, the simulation was further equilibrated for 2 ns at 300 K in NVT ensemble to achieve the water equilibrium density of 1 g/cm3. Finally, the nanopore was opened by removing the desired atoms and the different pressures were applied in each reservoir for 10 ns. To achieve a steady-state flow, the pressure difference between the feed reservoir and the permeate one needs to overcome the osmotic pressure of the system, which in turn acts in the opposite direction. The feed pressures range from 100, 500, 1000, 2500, 5000 to 10000 bars.
III Results
Usually, the water flux throughout the membrane is described by the quantity called membrane specific permeability [31], which incorporates information about the nanopore density and the membrane resistance to water flow (the pressure needed to induce certain flow).

The membrane specific permeability Am follows the expression: Am = /(P - ), in which is the water flux, is the applied pressure and is the osmotic pressure, and has dimensions of or . The membrane permeability as a function of pressure for each membrane design is presented in Figure 3. As expected, the membrane permeability is a linear function of the gradient pressure. The overall results for this specific membrane design are summarized in Table 2.
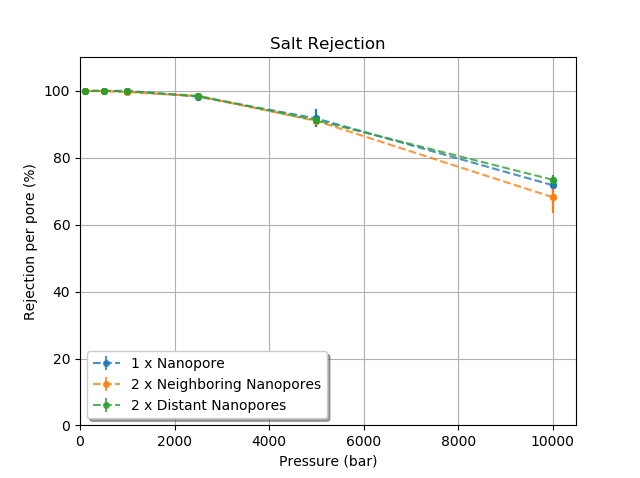
The salt rejection is the core of the desalination process. In reverse osmosis systems, usually, the salt rejection must be higher than 99% [2]. The MoS2 nanoporous membrane studied shows an excellent salt rejection capability, achieving 100% of rejection per pore working in pressures below 1000 bar (Figure 4). For a matter of comparison, the lowest pressure applied in this work was 100 bar, which in turn is higher than the real pressures used in reverse osmosis systems but it is justifiable in the scope of computational simulation for statistics purposes to generate a sufficient number of events in a time interval of 10 ns. As we can see in Figure 4, the salt rejection per pore is not affected by the nanopore proximity or number.
| Nanopore Density [1012 cm-2] | Am [LMH/bar] | Distance [nm] |
|---|---|---|
| 1 x Nanopore - 6.25 | 101.7 (25.2) | |
| 2 x Neighboring Nanopores - 12.5 | 242.9 (55.8) | 1.275 |
| 2 x Distant Nanopores - 12.5 | 223.6 (38.1) | 1.913 |
As we know, in a general way the water flux () is a function of the water density inside the pore channel (), the water velocity through it (), and the pore area (), that is . The area of the pores is a geometric parameter that, in turn, is maintained constant in our simulations. The density and the axial velocity are the remaining control parameters and they are related to the pore chemistry [15, 16, 5]. The pore chemistry depends on the particle interactions and their distribution around the pore. We know from previous studies that the charge distribution affects the overall water flux [38, 39, 40]. In our simulations, we choose such an arrangement of atoms, as illustrated in Figure 2, to maintain constant the proportion between hydrophobic and hydrophilic sites. As a consequence of this choice, the charge distribution is the same in each case and the pores are charged neutral. In summary, the nanopore chemistry and geometry are the same in all simulations. By doing that, we expect that any change in the water flux as a function of nanopore number or distance would be due to hydrodynamics interactions between the pores, which in turn would be reflected in the water flux or water density around the pores [30].
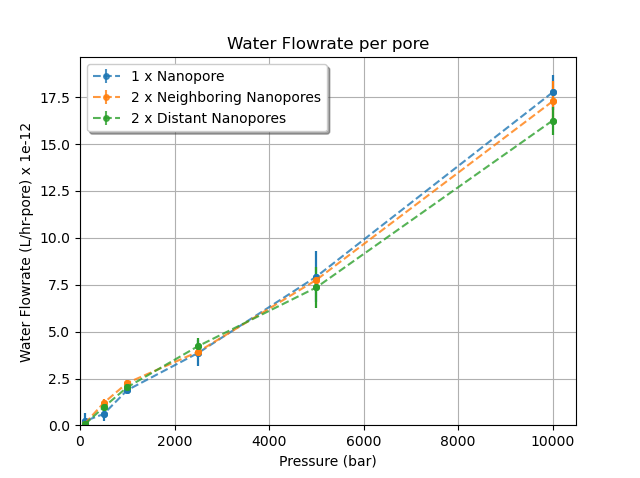
However, as we can see from Figure 5, the water flowrate per pore does not appear to have any dependence on nanopore number or distance. To clarify this question, we investigate the water density inside and around the pore to see if the influence would be hidden or compensated by other factors.
First, we classify some regions of analysis, as illustrated in Figure 7. The Region 1 is defined by two water layers near the membrane in the permeate side, which corresponds approximately to a slice of 5 Å in z-direction. The Region 2 is defined as a slice of 2 Å between the nanopore region and the first two water layers representing the Region 1. The Region 3 is defined by the nanopore region.
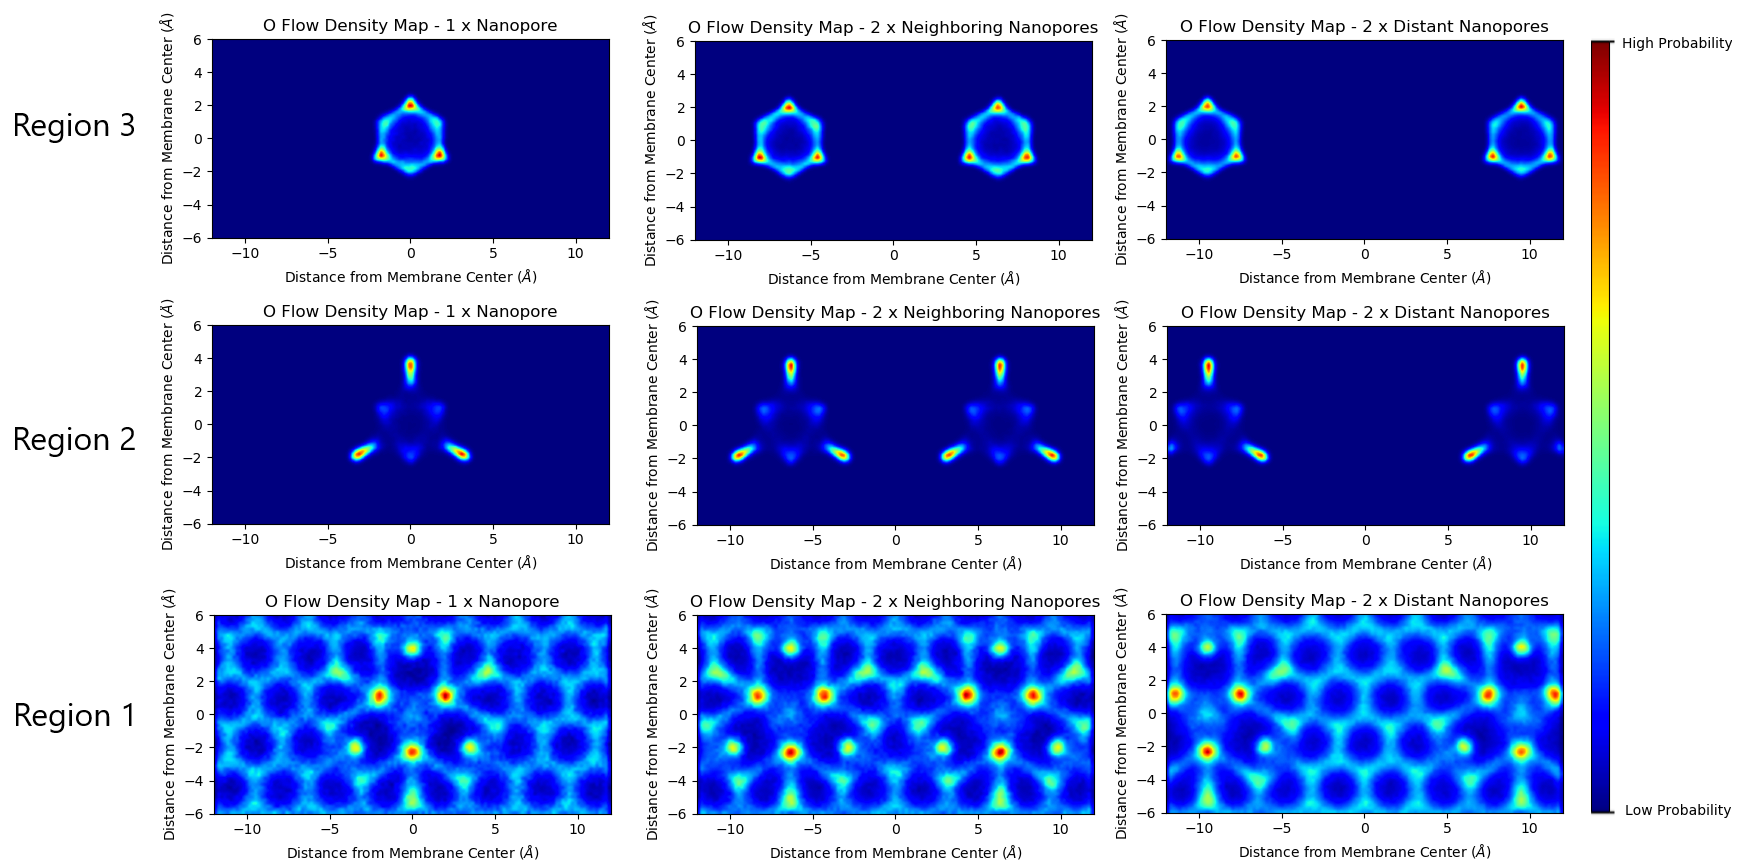
The oxygen density map from Figure 6-Region 3 in the single nanopore case (left column) shows how the water moves through it. As it can be seen, the water molecules transport occurs in some specific regions around the center of the nanopore and not in the real center. Layered water structure, described by density oscillations in the radial direction, arises and it is a signature of the implications of nanoconfinement. Also interesting is the fact that the red-shifted areas are the highest ones in terms of occupancy and it corresponds to the sites near the Mo atoms. From Figure 6-Region 2 it can be seen that water molecules enter in the nanopore attracted mostly by the Mo sites, as previous studies confirmed [15]. In addition, the first two water layers in Figure 6-Region 1 show that in this slice the oxygen of water molecules prefer to stay between S sites, which is in fact the region in which the Mo-water electrostatic interaction is less screened by the S atoms.
The oxygen density map from Figure 6-Region 1 in the single nanopore case (left column) shows that the first two water layers are modified locally by the presence of the nanopore. However, its extension is not larger than the nanopore size of 0.97 nm of diameter, which suggests that the nanopore presence does not have a large effect in the water structure near the membrane, just local implications near the nanopore region.
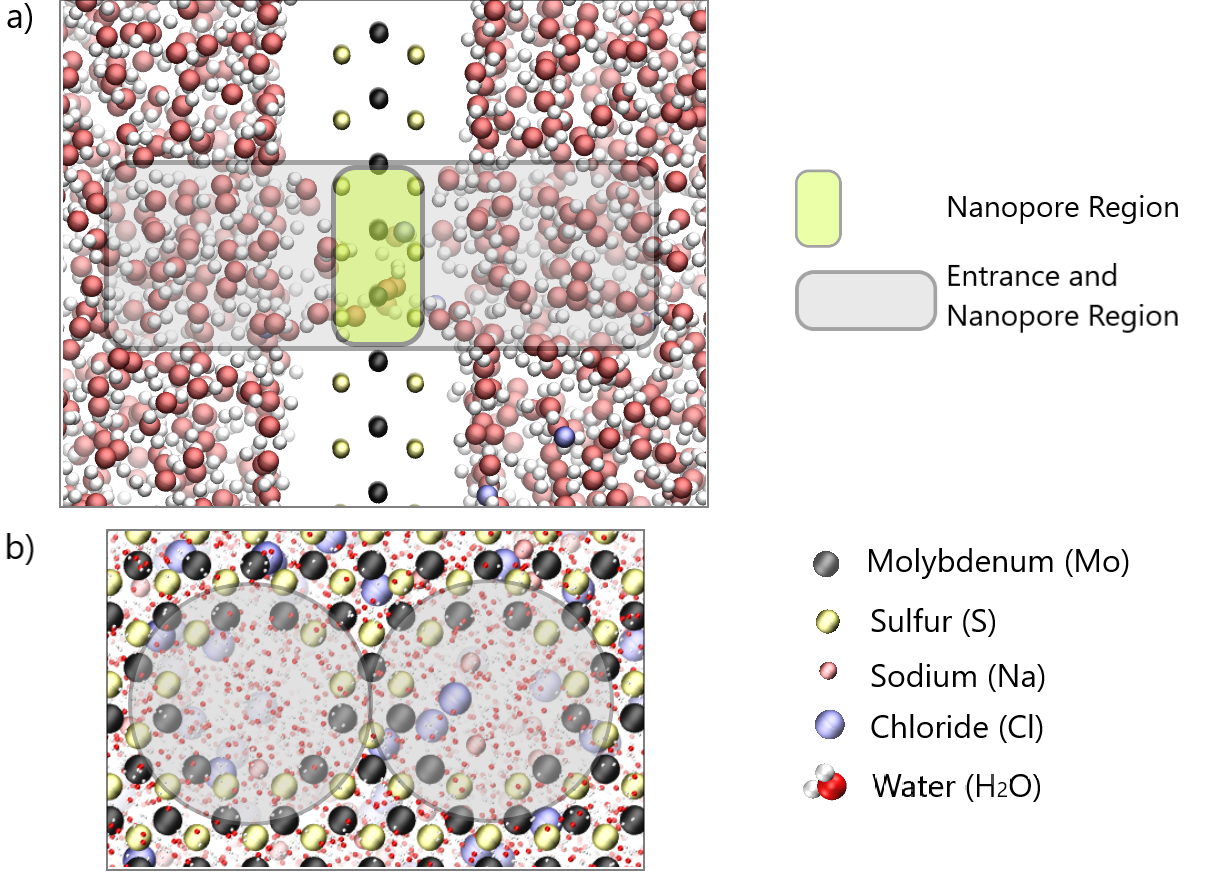
Comparing with the two neighboring nanopores case, we can’t see any deviation in the density map due to the presence of the second nanopore. This conclusion extends to the third case, the distant nanopores case. To quantify if any implications in the water density exist due to the proximity of nanopores, we obtained the water density as a function of the radial distance from each nanopore center, as defined in Figure 8. The radial water density was calculated binning the region inside the nanopore in circular shapes, counting the water molecules there, and dividing by its cylindrical volume.
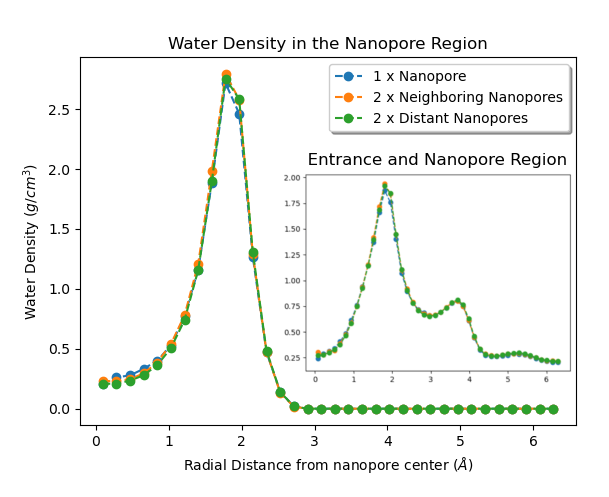
As we can see from Figure 9 there is no difference in the water density inside the nanopore due to the presence of a second one. In addition, the water density is related to the Potential of Mean Force (PMF) through the integration of the following expression: [16, 41]. If any induced pressure field extends from one nanopore to the other one, it is not sufficient to produce any change in the water density inside the nanopore and as a consequence in the water PMF. Not only inside the nanopore but also when we investigate the entrance region, as illustrated in Figure 9 in the detail, we do not observe any significant effect.
The hydrodynamic effects were not visible in this scale may be due to the polar nature (atomic charges) of the MoS2 membrane, which induces its structure in the firsts water layers [25].
IV Conclusions
Differently from the fluid mechanics calculations in microfilters [30], the fluid flow through neighboring nanopores in MoS2 membranes does not show in our NEMD simulations any significant hydrodynamic interactions between adjacent pores. The water flow strongly depends on the intermolecular force of the membrane, which is governed by the layered structure of the liquid in the nanopore region, and as a consequence, the collective effect of hydrodynamic interaction between pores is suppressed. Nevertheless, we shed light on the assumption that the water flux would scale linearly with the nanopore density regardless of its distance. Of course, here the MoS2 atoms were held fixed in space, and more careful simulations are needed to understand the relation between nanopores distance and material strain. As previous studies confirmed, the MoS2 nanoporous membranes are promising candidates for the next-generation membrane material, allowing water to be filtered at high permeate rates while maintaining high salt rejection rates.
Notes and references
- [1] UNESCO World Water Assessment Programme. Water and climate change. The United Nations world water development report 2020, 2020.
- [2] Nikolay Voutchkov. Energy use for membrane seawater desalination – current status and trends. Desalination, 431:2 – 14, 2018.
- [3] Pedro J. J. Alvarez, Candace K. Chan, Menachem Elimelech, Naomi J. Halas, and Dino Villagrán. Emerging opportunities for nanotechnology to enhance water security. Nature Nanotechnology, 13(8):634–641, Aug 2018.
- [4] Jay R. Werber, Chinedum O. Osuji, and Menachem Elimelech. Materials for next-generation desalination and water purification membranes. Nature Reviews Materials, 1(5):16018, Apr 2016.
- [5] David Cohen-Tanugi and Jeffrey C. Grossman. Nanoporous graphene as a reverse osmosis membrane: Recent insights from theory and simulation. Desalination, 366:59 – 70, 2015. Energy and Desalination.
- [6] E. R. Smith. A molecular dynamics simulation of the turbulent couette minimal flow unit. Physics of Fluids, 27(11):115105, 2015.
- [7] Chongqin Zhu, Hui Li, and Sheng Meng. Transport behavior of water molecules through two-dimensional nanopores. The Journal of Chemical Physics, 141(18):18C528, 2014.
- [8] W. Li, Y. Yang, J. K. Weber, G. Zhang, and R. Zhou. Tunable, Strain-Controlled Nanoporous MoS2 Filter for Water Desalination. ACS Nano, 10:1829–1835, 2016.
- [9] M. H. Köhler, J. R. Bordin, and M. C. Barbosa. 2D Nanoporous Membrane for Cation Removal from Water: Effects of Ionic Valence, Membrane Hydrophobicity, and Pore Size. The Journal of Chemical Physics, 148:222804, 2018.
- [10] Jianlong Kou, Jun Yao, Lili Wu, Xiaoyan Zhou, Hangjun Lu, Fengmin Wu, and Jintu Fan. Nanoporous Two-Dimensional MoS2 Membranes for Fast Saline Solution Purification. Physical Chemistry Chemical Physics, 18:22210–22216, 2016.
- [11] David Cohen-Tanugi and Jeffrey C. Grossman. Water desalination across nanoporous graphene. Nano Letters, 12(7):3602–3608, 2012. PMID: 22668008.
- [12] Mojdeh Akhavan, Jeremy Schofield, and Seifollah Jalili. Water transport and desalination through double-layer graphyne membranes. Physical Chemistry Chemical Physics, 20:13607–13615, 2018.
- [13] Deepthi Konatham, Jing Yu, Tuan A. Ho, and Alberto Striolo. Simulation insights for graphene-based water desalination membranes. Langmuir, 29(38):11884–11897, 2013. PMID: 23848277.
- [14] David Cohen-Tanugi, Li-Chiang Lin, and Jeffrey C. Grossman. Multilayer nanoporous graphene membranes for water desalination. Nano Letters, 16(2):1027–1033, 2016. PMID: 26806020.
- [15] Mohammad Heiranian, Amir Barati Farimani, and Narayana R. Aluru. Water desalination with a single-layer mos2 nanopore. Nature Communications, 6(1):8616, 2015.
- [16] Zhonglin Cao, Vincent Liu, and Amir Barati Farimani. Why is single-layer mos2 a more energy efficient membrane for water desalination? ACS Energy Letters, 5(7):2217–2222, 2020.
- [17] João P. K. Abal, José Rafael Bordin, and Marcia C. Barbosa. Salt parameterization can drastically affect the results from classical atomistic simulations of water desalination by mos2 nanopores. Phys. Chem. Chem. Phys., 22:11053–11061, 2020.
- [18] David Cohen-Tanugi and Jeffrey C. Grossman. Water permeability of nanoporous graphene at realistic pressures for reverse osmosis desalination. The Journal of Chemical Physics, 141(7):074704, 2014.
- [19] Doojoon Jang, Juan-Carlos Idrobo, Tahar Laoui, and Rohit Karnik. Water and solute transport governed by tunable pore size distributions in nanoporous graphene membranes. ACS Nano, 11(10):10042–10052, 2017. PMID: 28994572.
- [20] Zhongying Wang and Baoxia Mi. Environmental applications of 2d molybdenum disulfide (mos2) nanosheets. Environmental Science & Technology, 51(15):8229–8244, 2017. PMID: 28661657.
- [21] H. Li, T.-J. Ko, M. Lee, H.-S. Chung, S. S. Han, K. H. Oh, A. Sadmani, H. Kang, and Y. Jung. Experimental Realization of Few Layer Two-Dimensional MoS2 Membranes of Near Atomic Thickness for High Efficiency Water Desalination. Nano Letters, 19:5194–5204, 2019.
- [22] Z. Wang, Q. Tu, S. Zheng, J. J. Urban, S. Li, and B. Mi. Understanding the Aqueous Stability and Filtration Capability of MoS2 Membranes. Nano Letters, 17:7289–7298, 2017.
- [23] Wisit Hirunpinyopas, Eric Prestat, Stephen D. Worrall, Sarah J. Haigh, Robert A. W. Dryfe, and Mark A. Bissett. Desalination and nanofiltration through functionalized laminar mos2 membranes. ACS Nano, 11(11):11082–11090, 2017. PMID: 29019650.
- [24] Chunjiao Liu, Yakang Jin, and Zhigang Li. Water transport through graphene and mos2 nanopores. Journal of Applied Physics, 126(2):024901, 2019.
- [25] Kijeong Kwac, In Kim, Tod A. Pascal, William A. Goddard, Hyung Gyu Park, and Yousung Jung. Multilayer two-dimensional water structure confined in mos2. The Journal of Physical Chemistry C, 121(29):16021–16028, 2017.
- [26] William Humphrey, Andrew Dalke, and Klaus Schulten. VMD – Visual Molecular Dynamics. Journal of Molecular Graphics, 14:33–38, 1996.
- [27] M. E. Suk and N. R. Aluru. Molecular and continuum hydrodynamics in graphene nanopores. RSC Adv., 3:9365–9372, 2013.
- [28] Sridhar Kumar Kannam, Peter J. Daivis, and B.D. Todd. Modeling slip and flow enhancement of water in carbon nanotubes. MRS Bulletin, 42(4):283–288, 2017.
- [29] Pooja Sahu and Sk. Musharaf Ali. Breakdown of continuum model for water transport and desalination through ultrathin graphene nanopores: insights from molecular dynamics simulations. Phys. Chem. Chem. Phys., 21:21389–21406, 2019.
- [30] Kaare H. Jensen, André X. C. N. Valente, and Howard A. Stone. Flow rate through microfilters: Influence of the pore size distribution, hydrodynamic interactions, wall slip, and inertia. Physics of Fluids, 26(5):052004, 2014.
- [31] David Cohen-Tanugi, Ronan K. McGovern, Shreya H. Dave, John H. Lienhard, and Jeffrey C. Grossman. Quantifying the potential of ultra-permeable membranes for water desalination. Energy Environ. Sci., 7:1134–1141, 2014.
- [32] Mohammad Rashedul Hasan and BoHung Kim. Molecular transportation phenomena of simple liquids through a nanoporous graphene membrane. Phys. Rev. E, 102:033110, Sep 2020.
- [33] Raúl Fuentes-Azcatl and Marcia C. Barbosa. Sodium chloride, nacl/e: New force field. The Journal of Physical Chemistry B, 120(9):2460–2470, 2016. PMID: 26890321.
- [34] Raúl Fuentes-Azcatl and Marcia C. Barbosa. Thermodynamic and dynamic anomalous behavior in the tip4p/e water model. Physica A: Statistical Mechanics and its Applications, 444:86 – 94, 2016.
- [35] Eugene S. Kadantsev and Pawel Hawrylak. Electronic structure of a single mos2 monolayer. Solid State Communications, 152(10):909 – 913, 2012.
- [36] G. Hummer, J. C. Rasaiah, and J. P. Noworyta. Water conduction through the hydrophobic channel of a carbon nanotube. Nature, 414(6860):188–190, 2001.
- [37] Steve Plimpton. Fast parallel algorithms for short-range molecular dynamics. Journal of Computational Physics, 117(1):1 – 19, 1995.
- [38] Meng Yang, Xiaohai Yang, Qing Wang, Kemin Wang, Xin Fan, Wei Liu, Xizhen Liu, Jianbo Liu, and Jin Huang. Anomalous effects of water flow through charged nanochannel membranes. RSC Adv., 4:26729–26737, 2014.
- [39] Liang Hao, Jiaye Su, and Hongxia Guo. Water permeation through a charged channel. The Journal of Physical Chemistry B, 117(25):7685–7694, 2013. PMID: 23742655.
- [40] Zhuo Huang, Yan Zhang, Tomoki Hayashida, Ziwei Ji, Yuhui He, Makusu Tsutsui, Xiang Shui Miao, and Masateru Taniguchi. The impact of membrane surface charges on the ion transport in mos2 nanopore power generators. Applied Physics Letters, 111(26):263104, 2017.
- [41] Haiqi Gao, Qi Shi, Dewei Rao, Yadong Zhang, Jiaye Su, Yuzhen Liu, Yunhui Wang, Kaiming Deng, and Ruifeng Lu. Rational design and strain engineering of nanoporous boron nitride nanosheet membranes for water desalination. The Journal of Physical Chemistry C, 121(40):22105–22113, 2017.