Light and Slow-Neutron Diffraction by Nanodiamond-Dispersed
Nanocomposite Holographic Gratings
Abstract
We demonstrate the use of nanodiamond in constructing holographic nanoparticle-polymer composite transmission gratings with large saturated refractive index modulation amplitudes at both optical and slow-neutron wavelengths, resulting in efficient control of light and slow-neutron beams. Nanodiamond possesses a high refractive index at optical wavelengths and large coherent and small incoherent scattering cross sections with low absorption at slow-neutron wavelengths. We describe the synthesis of nanodiamond, the preparation of photopolymerizable nanodiamond-polymer composite films, the construction of transmission gratings in nanodiamond-polymer composite films and light optical diffraction experiments. Results of slow-neutron diffraction from such gratings are also presented.
I INTRODUCTION
Nanodiamond (ND), an intriguing allotrope of carbon, is a carbon nanoparticle with truncated octahedral architecture [1, 2, 3]. ND has been of considerable interest because they are considered to possess superior mechanical, thermal, electrical and optical properties of diamonds such as high hardness, high Young’s modulus, low coefficient of friction, high thermal conductivity, low thermal expansion, low heat capacity, high insulation, large bandgap, and high refractive index. These advantages could potentially lead to various applications including novel composite materials, additive, abrasive, lubricant, plating, heat dissipation materials, biomedical/medicine materials for drug delivery systems and biosensing/imaging, electronics, magnetic recording, coating, luminescent materials, nonlinear optical materials, and single photon emitters/spin detectors for quantum optics and photonics [4, 5, 6, 7]. Here we report on the realization of ND-dispersed nanocomposite holographic gratings for efficient control of light and slow-neutron beams, formed in the so-called photopolymerizable nanoparticle-polymer composite (NPC) [8], where nanoparticles (ND particles in this case) are uniformly dispersed in monomer capable of radical-mediated chain-growth or step-growth photopolymerization.
Since our first report on volume holographic recording in an NPC dispersed with TiO2 nanoparticles [9], NPC gratings using various types of inorganic and organic nanoparticles such as SiO2 [10, 11], ZrO2 [12, 13, 14, 15], ZnS [16], luminescent nanoparticles/nanorods [17, 18], nanotubes [19], zeolites [20], semiconductor quantum dots [21, 22] and hyperbranched polymer [23, 24] were reported. The dispersion of nanoparticles in recorded holographic gratings results in large saturated refractive index modulation amplitudes () and simultaneously makes their mechanical and thermal stability higher in comparison to those recorded in a conventional all-organic photopolymer [25, 26]. It was also shown that optical nonlinearities were induced in NPCs dispersed with nanoparticles possessing large optical nonlinearities including nonlinear Bragg diffraction [27], optical multi-stability [28], light-induced transparency [29] and nonlinear multi-wave mixing [30] due to cascaded high-order optical nonlinearities associated with the local-field enhancement [31]. NPCs using various nanoparticles can be used for photonic applications such as holographic data storage [32, 33], volume holographic optical elements for wearable headsets [34, 35], security holograms [18] and distributed feedback plastic lasers [36].
Moreover, in quest for the realization of efficient slow-neutron beam-control and ultrahigh precision measurements using neutron interferometers [37], we have also demonstrated various manipulations of slow-neutron beams at a few nm wavelengths with NPC transmission gratings dispersed with SiO2 or ZrO2 nanoparticles. These include two and multi-beam splitting and beam deflection with up to 90 % efficiency [38, 39, 40], i.e., deflective mirror-like functionality. In order to realize such high diffraction efficiency, it was necessary to effectively increase the interaction length of an NPC transmission grating of one hundred microns thickness by tilting it at a large angle (up to 70∘) about an axis parallel to the grating vector. Such a large increase in the effective grating thickness is, however, detrimental to some device applications since it introduces a substantive increase in incoherent scattering and absorption loss of a slow-neutron beam propagating in supporting glass substrates and a host polymer material [41]. It is also better to avoid a large grating tilt in order not to cause a substantial decrease in the diffraction efficiency due to the increased angular selectivity of the tilted grating for a slow-neutron beam with the finite beam divergence of the order of 1 mrad. In order to circumvent such disadvantages, one needs to increase for slow neutrons, , instead of increasing the effective grating thickness. This calls for a new type of nanoparticles possessing stronger interactions with slow neutrons than SiO2 and ZrO2 nanoparticles.
In this paper we describe new NPC gratings dispersed with ND for light and slow-neutron diffraction. High hardness and low thermal expansion as well as high refractive index of ND in ultraviolet and visible spectral regions provide the realization of highly efficient NPC phase gratings with large and high environmental stability. ND is also considered useful in neutron optics for possessing very large coherent and very small incoherent scattering cross sections with low absorption for neutrons [42]. For example, quasi-specular reflection of cold neutrons from ND powders was demonstrated [43, 44]. ND also provides a possibility for efficient slow-neutron beam manipulation by NPC phase gratings of only a few tens of microns thick as we demonstrated recently [45]. Here we describe the synthesis of ND, the preparation of the NPC, recording of ND-dispersed transmission NPC gratings and the light optical diffraction experiments. We conclude with results on slow-neutron diffraction from ND-dispersed NPC gratings.
II HOLOGRAPHIC GRATING FORMATION IN NPC MEDIA
The basic idea of using nanoparticles as secondary species stems from the fact that an increase in the refractive index change per one diffusing monomer molecule requires a high refractive index of the monomer in organic multi-component photopolymer systems [46]. The incorporation of inactive nanoparticles in host photopolymer gives a much higher refractive index modulation amplitude () in holographic recording as compared with conventional binder-based photopolymers when a difference in refractive index between nanoparticles and the formed polymer is sufficiently large. The inclusion of nanoparticles also contributes to the suppression of polymerization shrinkage and the improvement of thermal stability [25, 11]. The basic mechanism of holographic grating formation can be described as follows: Suppose that nanoparticles (ND particles in our case) are uniformly dispersed in a host monomer capable of radical photopolymerization as shown in Fig. 1(a). Spatially non-uniform light illumination produces free radicals by dissociation of initiators and the subsequent reaction of free radicals with monomer molecules leads to the polymerization reaction between monomer radicals and individual monomer molecules in the bright
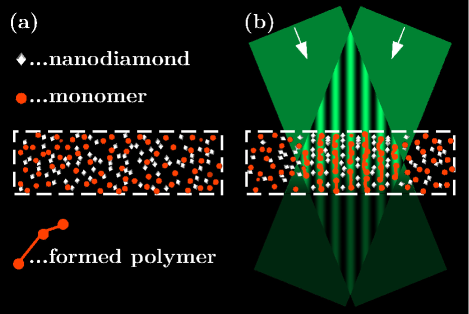
regions. This polymerization process lowers the chemical potential of the monomer in the bright regions, leading to the migration (diffusion) of monomer molecules from the dark to the bright regions. On the other hand, photo-insensitive nanoparticles experience counterdiffusion from the bright to the dark regions since they are not consumed by light exposure and their chemical potential increases in the bright regions due to the consumption of the monomer. Such a polymerization-driven mutual diffusion process essentially continues until the photopolymerization completes. In this way the mutual diffusion of monomer molecules and nanoparticles results in the periodic assembly of nanoparticles during holographic exposure [see Fig. 1(b)] and a refractive index grating (a phase hologram) is created owing to a compositional and density difference between the bright and the dark regions. Indeed, it was confirmed experimentally that the distribution of dispersed inorganic nanoparticles followed the light-intensity interference pattern in the formed polymer: A phase shift of between the periodic density distributions of formed polymer and inorganic nanoparticles was induced as a result of the mutual diffusion [47, 48, 49].
Generally, NPC volume gratings with large at short grating spacings are required for light and slow-neutron optics applications for high diffraction efficiency [8]. In particular, thin volume holographic gratings with very large (10-2) are required for wearable headsets for augmented and mixed reality applications in visible spectral regions in order to obtain high diffraction efficiency and wide fields of view [50, 51]. In slow-neutron optics a diffractive mirror with 100 % requires large at slow-neutron wavelengths, moderate film thickness, and short grating spacing [39]. Regardless of wavelengths considered, of a holographic phase grating with the 1st-order (Bragg-matched) periodic spatial modulation formed in NPC media is approximately given by (see Appendix A for the detailed derivation)
| (1) |
where () is the refractive index of a nanoparticle (the formed host polymer) at either a light or a slow-neutron wavelength, and is the amplitude of a sinusoidally modulated spatial density of dispersed nanoparticles at their spatially dependent volume fraction (see Appendix A). Here is either smaller than or equals to spatially averaged volume fraction . The parameter is twice the magnitude of the 1st-order Fourier component of the refractive index modulation of a phase grating, i.e., it is unity for a pure sinusoidal waveform and is for a rectangular waveform, with the duty ratio of the concentration distribution in volume between nanoparticle-rich and -poor regions.
Equation (1) implies the following chief ingredients for the enhancement of : (i) A near-sinusoidal form of to minimize the high order diffraction signals, (ii) Large by efficient mutual diffusion of nanoparticles and monomer under holographic exposure, and (iii) Large . The item (i) is usually difficult to achieve since the photopolymerization-driven mutual diffusion process is nonlinear, so that the spatial waveform of would contain high order components [52]. The item (ii) can be realized by large and the facilitation of mutual diffusion under appropriate viscosity of the NPC system. The item (iii) is possible in the visible light spectral region since is generally of the order of 1.5 but can be much larger than . ND is a good choice of nanoparticle species for the enhancement of at visible light wavelengths since it possesses a large value of ( for bulk diamond). In neutron optics the neutron refractive index () at a neutron wavelength () in matter is approximately given by the following formula [53]:
| (2) |
where and are the mean bound coherent scattering length and the atomic number density of matter, respectively. The primary requirement for the enhancement of at can be translated into a large absolute difference in the scattering length density (SLD) between a nanoparticle and the formed polymer. In other words, nanoparticles having a large value for SLD are desired. Indeed, bulk diamond has a very large value of SLD to be about Å-2 [54], as compared with Å-2 for bulk Si, Å-2 for bulk SiO2 and Å-2 for bulk graphite [55], all of them used as materials for neutron-beam diffraction at slow-neutron wavelengths and neutron optics in general. Even if the value for ND may be reduced to some extent as compared to that of bulk diamond due to several contaminations of graphite and other organic/inorganic materials on the surface of an ND core [2], the use of ND is highly favorable for constructing NPC gratings at slow-neutron wavelengths since such an NPC grating would possess up to three times as large as that dispersed with SiO2 nanoparticles. Thus, high at slow-neutron wavelengths at relaxed angular selectivity and small tilt angles is achievable. The latter features are very desirable to make slow-neutron beam experiments at limited intensities and with a finite beam divergence of several mrad. The use of ND for NPC gratings also provides other advantages such as very low incoherent scattering loss and low absorption for neutrons. Other approaches for fabricating (optically) thin diffraction gratings that are also used in neutron optics have been put forward in, for instance, Refs. [56, 57].
Note that there is no reason why Eq. (1) should not also hold for neutrons. In light and slow-neutron diffraction experiments depends on the product of being proportional to [see Eq. (1)] and the grating thickness (). Because it is possible to estimate and from light diffraction measurements only, one can assess the performance of a recorded NPC grating at slow-neutron wavelengths from measured values for and a known value for , or alternatively one can estimate from optically estimated values for and the measurement of in slow-neutron diffraction experiments. Such discussions will be given in Sec. III.4.
III EXPERIMENTAL RESULTS AND DISCUSSIONS
III.1 Synthesis and Analysis of Nanodiamonds
III.1.1 Synthesis of surface-modified nanodiamonds
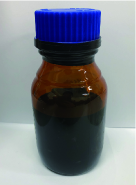
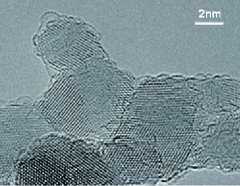
We synthesized a cluster of ND by the detonation of trinitrotoluene/hexogen charges between 40/60 and 60/40 in wt.%. The purification process used to recover the detonated ND particles from the detonation soot involves the acid treatment in water solvent for the removal of metal oxides originated from a container, followed by the decantation treatment to remove residual graphite having sp2 orbitals. Organic modification on the surface of each ND core was made with silane coupling agent in an organic solvent after the ultrasonication of ND aggregates with ceramic (ZrO2) microbeads used as crushing agents. ND suspension sol was finally prepared in a solution of methyl isobutyl ketone (MIBK). Figure 2(a) illustrates an ND sol in a vial. The opacity indicates non-negligible broadband absorption in the visible as a result of remaining sp2 graphite layers on the surface of an ND core. Figure 2(b) shows a transmission electron microscopy (TEM) image of surface-modified ND deposited on carbon-coated grids after evaporating a tetrahydrofuran suspension of the ND sol. It can be observed that each ND has the size of the core possessing the sp3 structure to be approximately 4 nm on average and that they aggregate due to their lateral diffusion during the evaporation process. Note that remaining sp2 layers were not detected in the TEM image.
|
III.1.2 Analysis of surface-modified nanodiamonds
In order to quantitatively examine remaining graphite components in surface-modified ND, we performed Raman spectroscopy by using a commercial Raman microscope (LabRAM HR Evolution LabSpec 6, HORIBA Scientific). Figure 3 shows the UV-Raman spectrum of synthesized ND after the purification process at an excitation laser wavelength of 325 nm and at excitation laser power of 0.8 mW. Clear Raman peaks can be attributed to a down-shifted peak at 1328 cm-1 from ND with respect to that from bulk diamond (1332 cm and to an O-H bending peak at 1640 cm-1 from one of the H2O vibrational modes, respectively [2, 58]. Other possible peaks from
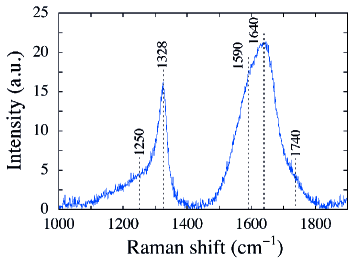
contributions from smaller ND particles or smaller coherent scattering domains separated by defects in larger ND particles at 1250 cm-1, the G-band peak of graphitic sp2 carbon at 1590 cm-1 and a C=O stretching peak at 1740 cm-1 that is coming from surface functional groups [58] were not noticeable. However, it is known that the formation of non-diamond carbons occurs after the growth of the diamond sp3 structure as a result of a decrease in pressure below the diamond-graphite equilibrium during detonation [58]. Therefore, such a non-carbon layer must remain on the ND surface even after the purification process, as is also confirmed from the opacity of the ND sol shown in Fig. 2(a). The content of graphitic sp2 carbon is considered to be more or less a few wt.% in our surface-modified ND as the relative Raman peak at 1590 cm-1 partially hidden in the broad peak centered at 1640 cm-1 is very similar to the result in Ref. [58].
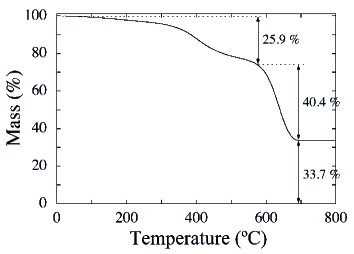
We also carried out the thermogravimetric analysis (TGA) by using a commercial TGA/DTA system (EXSTAR TG/DTA6200, Seiko Instruments) to quantify the ratio of the components in the surface-modified ND. It was done at a heating rate of 20∘ C/min from 25∘ C to 815∘ C under air flow. The mass ratio was calculated using the weight loss % at the onset temperatures of the decomposition of grafted organics, diamond and non-diamond carbon contents and inorganic species. The result is shown in Fig. 4. It was found that grafted organics at 25.9 wt.% attached by the silane coupling agent was decomposed first (see the second shoulder near 600∘ C) followed by the decomposition of the diamond and non-diamond carbon contents (ND and graphite) at 40.4 wt.% (see the abrupt change near 680∘ C), leaving behind the remaining metals and oxides such as ZrO2 at 33.7 wt.% introduced during the crushing and surface modification processes.
We further measured the hydrodynamic size dispersion of the surface-modified ND. Figure 5 shows the size dispersion of surface-modified ND in tetrahydrofuran solution obtained by means of a dynamic light scattering instrument (Zetasizer, Malvern Panalytical). It is found that the size distribution exhibits a typical broad peak stemming from aggregates as reported for colloidal solutions of SiO2 nanoparticle and ND [59, 60]. The hydrodynamic median-average size (d50) is approximately 9.6 nm that must include the outer layers of the surface-modified ND. This result indicates that the main volume of the surface-modified ND is occupied by soot (mainly the contents of graphite and ZrO2) and organic components. From the results shown in Figs. 2(b)–5 we may deduce the geometric structure of a multilayered concentric sphere of our surface-modified ND by use of the core radius of the sp3 ND (2 nm) and the radius of the surface-modified ND (4.8 nm) provided that a given wt.% value of the graphite component in the surface-modified ND is used. Let us assume that the weight fraction of the ND core and graphite components are 35.4 and 5 wt.%, respectively, resulting in the weight fraction of the diamond and non-diamond contents of 40.4 wt.%, which would be an appropriate assumption for well purified ND [61]. It is then straightforward to approximately estimate the relative volume fractions of the ND core and the shell portion (soot and organic layers). Using known numerical values for densities of bulk diamond (3.51 g/cm3), graphite (2. g/cm3), ZrO2 (5.68 g/cm3) and acrylate (1.18 g/cm3), we find 7.2, 6.8, 18.3 and 67.7 vol.% for ND, graphite, ZrO2 and grafted organics, respectively. We can then estimate the layer thickness of each component measured from the surface of the ND core to be 0.5, 0.8 and 1.5 nm for graphite, ZrO2 and grafted organics, respectively.

III.2 Preparation of Samples
We dispersed the ND sol to a blend of two acrylate monomers, tri/tetrapentaerythritol acrylate (PETIA, Daicel-ALLNEX LTD.) of refractive indices of =1.487 and 1.515 in liquid and solid phases, respectively,
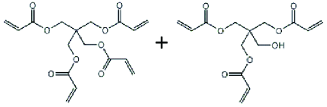
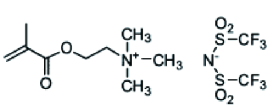
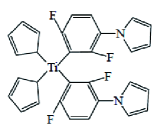
and a single functional ionic liquid monomer (MOE-200T, Piotrek) of refractive indices of =1.43 and 1.45 in liquid and solid phases, respectively at various ratios in wt.%. The concentration of ND after evaporation of MIBK was as high as 22 vol.%. As shown later, we found that the unity wt.% ratio of PETIA to MOE-200T gave the highest value for . Titanocene (Irgacure784, Ciba) with the refractive index of =1.76 was used as a radical photoinitiator to provide the photosensitivity in the green. The concentration of the photoinitiator was 4.3 wt.% with respect to the monomer blend. These chemical structures are shown in Fig. 6. MIBK was removed from the mixed syrup containing the ND sol. The syrup was kept in a vial at 60∘ C for 6 hours and then cast on a spacer-loaded glass substrate. Finally, it was covered with another glass plate to be used as NPC film samples.
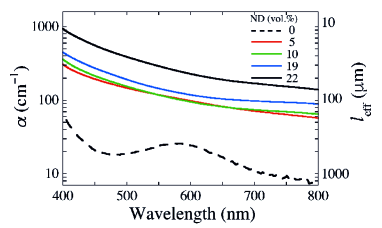
Figure 7 shows spectral absorption coefficients and the effective thickness [)] of uniformly cured NPC film samples without and with ND at different doping concentrations. It can be seen that the optical absorption due to the inclusion of ND extends over the whole visible spectral range as seen in Fig. 2(a). However, it can also be seen that values for at a wavelength of 532 nm are of the order of 100 m at ND concentrations lower than 20 vol.%, substantially thick enough for our use as holographic gratings.
III.3 Holographic Recording and Light Diffraction Experiments
III.3.1 Experimental setup for holographic recording and a method for data analysis
In a holographic recording experiment we used a two-beam interference setup to record unslanted and plane-wave transmission gratings in ND-dispersed NPC films at grating spacing () of 0.5 m and 1 m by two mutually coherent beams of equal intensities from a diode-pumped frequency-doubled Nd:YVO4 laser operating at a wavelength of 532 nm. A low-intensity He-Ne laser beam operating at a wavelength of 633 nm was employed as a readout beam to monitor the buildup dynamics of a recorded plane-wave transmission NPC grating since the photoinitiator employed was insensitive in the red. All the beams were s-polarized. We characterized NPC gratings by measuring the buildup dynamics of the diffraction efficiency () at a probe wavelength of 633 nm. Here, was defined as , where is the 1st order diffracted probe intensity and is the transmitted probe intensity. Then, was estimated by measuring the saturated () as a function of Bragg-angle detuning () from a phase-matched Bragg angle probed at 633 nm after the completion of the recording process and then by fitting the data to Kogelnik’s coupled-wave formula that describes light diffraction in the Bragg (two-wave coupling) regime [62, 63, 64] as given by
| (3) |
where is a readout wavelength in vacuum, is grating spacing and is a phase-matched Bragg angle inside a sample.
III.3.2 Light diffraction properties
The buildup dynamics of at 532 nm were evaluated by using the Kogelnik’s formula with the already measured buildup dynamics of and at 633 nm by multiplying the time series of evaluated at 633 nm with a factor being the ratio of measured at 532 nm to that measured at 633 nm. The rationale of using the Kogelnik’s formula for evaluating and will be discussed later in this subsection.
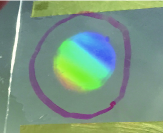
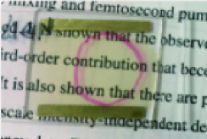
Figure 8(a) illustrates a photograph of an ND composite grating (approximately 10 mm in diameter) recorded in an NPC film sample dispersed with 19 vol.% ND. Figure 8(b) shows the same grating viewed from the top. Good uniformity and high transparency of the grating are seen.
|

|
The shallow brownish color is a result of absorption by the residual graphite component attached to the peripheral of ND particles. Figure 8(c) shows a TEM image of the cross section of the recorded grating. The dark (bright) banded areas correspond to high concentration portions of ND (the formed polymer), confirming holographic assembly [47] of ND in the formed polymer.
Figure 9(a) shows the dependence on ND concentration of evaluated at a wavelength of 532 nm for an NPC grating of 1 m spacing at different ratios of [MOE-200T] with respect to the sum of [PETIA] and [MOE-200T] all measured in wt.%. The recording intensity at 75 mW/cm2 was chosen so as to maximize . It can be seen that peaks at the ND concentration of 15 vol.% and at [MOE]/([PETIA]+[MOE])=0.50, i.e., [MOE]=[PETIA] in wt.%.
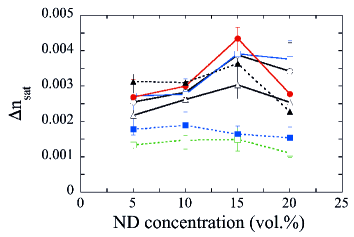

The observed decrease in at ND concentrations higher than 15 vol.% is caused by increased light scattering that results in a decrease in intensity-interference fringe contrast. The optimum condition of [MOE]=[PETIA] maximizing is found by the following consideration: an increase in [MOE-200T] lowers the viscosity of the blend monomer, facilitating the mutual diffusion of unreacted monomer and ND so that in Eq. (1) increases, as seen in Fig. 9(b). Too much addition of MOE-200T, however, inhibits the development of cross-linking network structures during holographic exposure, resulting in a decrease in and thus in . It can be seen in Fig. 9(b) that peaks at the ND concentration of 15 vol.% (=0.15) and at [MOE-200T]/([PETIA]+[MOE-200T])=0.50. But the peak value of 0.01 is much smaller than the ND concentration of 15 vol.% (i.e., 0.15). We speculate that because the spatial density distribution of ND after holographic exposure is more or less rectangular with [see Fig. 8(c)], such a small value ( 0.07) for is caused by insufficient mutual diffusion of ND and monomer molecules during holographic exposure. A further increase in by facilitating the mutual diffusion is necessary to increase . An increase in due to a decrease in at higher concentration of MOE-200T also contributes to an increase in but only marginally. In order to estimate from extracted values for [see Eq. (1)], we measured values for of uniformly cured polymer films without ND dispersion at various ratios of [MOE-200T] to [PETIA] by means of an Abbe refractometer (DR-M2, ATAGO). The refractive index of a surface-modified ND, , was evaluated from a refractive index measurement of an ND-dispersed polymer film after uniform curing by the so-called m-line spectrometer by a prism coupler [65], from which was determined by 1.9420 via a volume fractional estimation using Eq. (6) with help of the known . A simple volume fractional estimation of by using our estimated volume fractions of the constituents shown in the previous subsection was also carried out. It was found that was 1.7713 with refractive indices of 2.4173 [66], 2.7733 [67], 2.1745 [68] and 1.492 [69] for diamond, graphite, ZrO2 and acrylate, respectively. The calculated value is lower than the measured one. We speculate that the main discrepancy results from the use of the simple volume fractional calculation: The geometric structure (i.e., a multilayered concentric sphere) must be taken into account in the calculation [70], which would be left for our future investigation.
Figure 10(a) shows the buildup dynamics of at 532 nm, that is extracted from that at 633 nm, for an unslanted and plane-wave transmission NPC
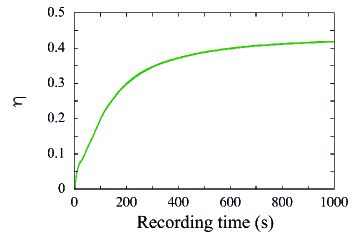
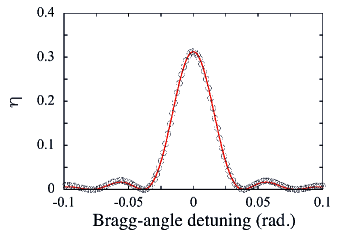
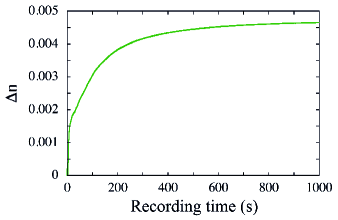
grating of 1 m spacing at the optimum ND concentration (15 vol.%) and the optimum recording intensity (75 mW/cm. Furthermore, we used the optimum ratio [MOE]/([PETIA]+[MOE]) of 0.5. We refer to this sample as the NPC grating #1. We note that the measured curve of shown in Fig. 10(a) is presented at 532 nm in order to evaluate the performance of light diffraction at the same wavelength as a recording one (532 nm) in order for our present results to be applicable to a more generic case of non-plane wave recording where readout has to be done at the same Bragg-matched wavelength. Figure 10(b) shows the Bragg-angle detuning curve probed at 633 nm after the saturation of . The solid curve in red denotes the least-squares curve fit of the data to the Kogelnik’s formula from which we find to be 25.29 m. It can be seen that the curve fit follows well with the measured data, indicating that the recorded NPC grating is uniform along the film’s thickness direction [63]. Figure 10(c) shows the corresponding buildup dynamics of at 532 nm. It can be seen that the NPC grating #1 has of approximately 4.710-3. This value is similar to that reached by SiO2 nanoparticle-dispersed NPC gratings at the same grating spacing used in previous slow-neutron diffraction measurements [38, 40]. We also find values for and to be approximately 0.011 and 0.268 m, respectively, with .
An unslanted and plane-wave transmission volume grating with a spacing of 0.5 m was also recorded in an ND-dispersed NPC film at the optimum ND concentration (15 vol.%) and at the optimum recording intensity (75 mW/cm. Furthermore, we used the optimum ratio [MOE]/([PETIA]+[MOE]) of 0.5. We refer to that sample as the grating #2. Figure 11(a) shows the buildup dynamics of at 532 nm, that is extracted from that at 633 nm.
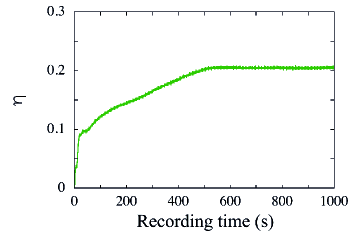
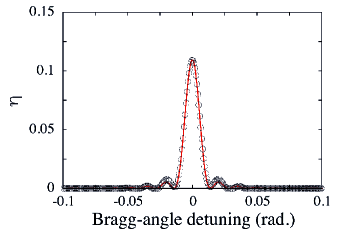
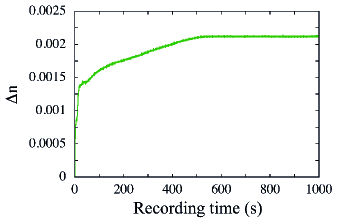
Figure 11(b) shows the Bragg-angle detuning curve probed at 633 nm after the saturation of from which we find to be 35.31 m. Figure 11(c) shows the corresponding buildup dynamics of at 532 nm. It can be seen that the grating #2 has reached of approximately 2.210-3, which is smaller than that of the grating #1. Such a decrease in at shorter grating spacing is a typical trend of multicomponent photopolymer including NPC materials [8] as a result of facilitated photoinitiator’s counter diffusion to, the cluster formation of photoinactive species in and the spatial extension of the polymer network into the dark regions. We also found and to be approximately 0.005 and 0.175 m, respectively. They are smaller than those of NPC grating #1. However, such drawback in and may be compensated for, to some extent, in slow-neutron diffraction for the following reasons: It is well-known that the Klein-Cook parameter () and the grating strength parameter () classify wave diffraction in several diffraction regimes [71, 72, 73, 74]. They are given by and , respectively, where is a readout wavelength in vacuum, is the average refractive index of a phase grating of interest, and is the Bragg angle given by . When the conditions of and are met, diffraction occurs in the Bragg diffraction (two-coupled waves) regime, i.e., two waves propagate in a thick grating, resulting in detectable signal power only in the narrow angular range around the Bragg angle. In contrast, when the conditions of and are met, diffraction is in the Raman-Nath diffraction (multiple coupled waves) regime, which features many overlapping diffraction orders almost independent of the angle of incidence in a thin grating. Otherwise, diffraction is in the intermediate diffraction regime, for which considerable overlapp of diffraction orders occurs in spite of clearly observable dependence of the diffraction efficiency on Bragg-detuning (or angle of incidence), described by the rigorous coupled-wave analysis (RCWA) [75]. In our case, the gratings #1 and #2 have of (39, 77) and (157, 658), respectively, at nm and . This means that light diffraction by both NPC gratings is in the Bragg diffraction regime, confirming the validity of our analysis in evaluating and . We also find that the grating #2 has factors of approximately 4 and 10 in and , respectively, as compared with those of the grating #1. The result of our slow-neutron diffraction experiment will be described in the next subsection.
III.4 Slow-Neutron Diffraction
III.4.1 Experimental setup and a method for data analysis
Neutron diffraction experiments were carried out at the beamline PF2/VCN of the Institut Laue-Langevin (ILL) in Grenoble, France.
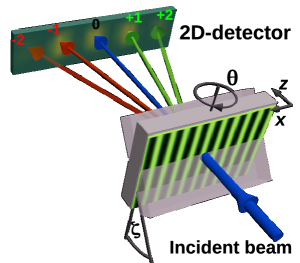
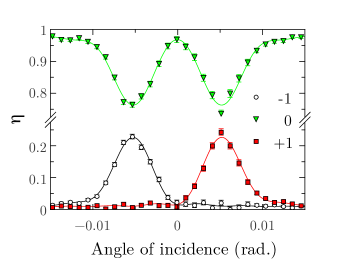
The measurement principle is illustrated in Fig. 12. The gratings were – similarly to the light diffraction measurements – mounted in transmission geometry. With the gratings tilted to the angle around an axis parallel to the grating vector in order to effectively adjust , the incident angle was varied to measure Bragg-angle detuning curves in the vicinity of (as given by the Bragg equation ) at a slow-neutron wavelength . Very cold neutrons with a broad wavelength distribution in the range of about 2.5 to 10 nm are available at PF2/VCN [76]. A Ti/Ni neutron mirror was necessary to redirect the incident neutron beam to make use of the full collimation length and to obtain a narrower wavelength distribution like the one shown in Ref. [41]. The divergence of the beam was about 2 mrad. A 2D detector with mm2 pixel size was used to detect the diffraction spots. The typical measurement time per incident angular position was about one hour. Since is large compared to , is of the order of 3 mrad. Given the spatial resolution of the detector system (pixel size mm2), about one and a half meters distance had to be maintained between the grating and the 2D detector to be able to observe well-separated diffraction spots. We define the diffraction efficiency of the th diffraction order as (), where and are the measured intensities of the th and the sum of all measured diffraction orders, respectively. At each incident angle the sum over all pixels in each separated diffraction spot at the 2D detector (see Fig. 12) – each associated with one diffraction order – was calculated and the resulting intensities (corrected for background) plugged into the definition for . While the second order diffraction from grating #1 was clearly detectable, it was marginal for grating #2 and neglected in the analysis as well as in the data plots (see below).
For neutrons, the Klein-Cook and grating strength parameters can be written as and , where we have used that . According to the criteria for assigning diffraction regimes at the end of Sec. III.3, neutron diffraction by gratings # 1 and # 2 should be expected to occur in the RCWA diffraction regime and in the Bragg diffraction regime, respectively, as (, ) are (1.35, 3.53) and (6.50, 23.29) for gratings #1 and #2, respectively. Consequently, the data for gratings # 1 and # 2 should be analyzed by the RCWA and the Kogelnik’s coupled-wave theory, respectively.
III.4.2 Results of slow-neutron diffraction
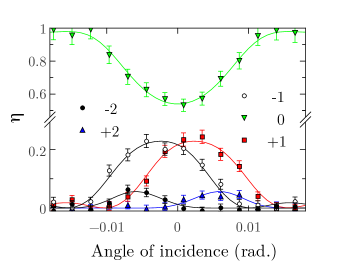
In Fig. 13, Bragg-detuning curves for gratings # 1 and # 2 are plotted. For the data set of Fig. 13 (a), least-squares fits with the RCWA were made (solid curves), whereas for the data set of Fig. 13 (b), the Kogelnik’s coupled-wave theory was used for the fitting procedure (solid curves). Since both gratings are relatively thick (in terms of and ) so that they are expected to exhibit a considerable wavelength selectivity in , we performed wavelength averaging by numerical integration of the product of the respective fit model function and a triangular or exponentially-modified-Gaussian shaped wavelength distribution [41]. From both fits for gratings #1 and #2 we extracted , [for in Eq. (9)], and, [see Eq. (12)].
A summary of parameter estimations for gratings # 1 and # 2 is given in Table 1. The values for are obtained from the light diffraction experiments described in the previous subsection.
| Grating: | # 1 (m) | # 2 (m) |
|---|---|---|
| Light diffr.: | ||
| [m] | ||
| Slow neutron diffr.: | ||
| [m] | ||
| [nm] | ||
| N/A (see text) | ||
As one can see, as obtained from neutron diffraction agrees well with light diffraction results. Considering the magnitudes of and for grating # 1 points to the refractive index profile of grating # 1 not being completely sinusoidal, as is non-negligible compared to . The minus sign of indicates that there is a phase shift of between the first and the second Fourier components of the refractive index profile of this grating. This is consistent with our TEM observation of the non-sinusoidal ND density distribution after holographic exposure shown in Fig. 8. In contrast, the neutron diffraction measurements for grating # 2 only showed negligible second order contributions. Thus, the quantity is not available for this sample. The extracted value for slow neutrons is related to the SLD of ND, , from Eqs. (1) and (2) such that
| (4) | |||||
where the last step is acceptable for ND since values for SLD of polymer, , are typically around Å-2, which is expected to be considerably smaller than . Rearranging Eq. (4) to obtain
| (5) |
we are now in a position to assess the SLD of ND in structured nanocomposite materials from light and neutron diffraction data. The estimations for SLDs for gratings # 1 and # 2 resulting form Eq. (5) are given in Table 1. As expected, the two values for SLDs are not very different from each other and are surely of the correct order of magnitude. The estimation for grating # 1 is smaller than that for grating # 2.
For comparison, we also performed an estimation for in an alternative way, i.e., by calculating the volume fractional averaged value of the surface-modified ND as done for its effective refractive index described in Sec. III.2. We find by using known bulk values for SLDs of diamond, graphite, ZrO2 and grafted organics (acrylate) with their volume fractions in our surface-modified ND. As one can see, we obtain the same order of magnitude and the numerical value of the estimation is quite close to the values in Table 1, suggesting consistency of the two approaches. Obviously, as similar to the case of the effective refractive index calculation, the volume fractional averaging procedure is not theoretically well supported for the structure of a multilayered concentric sphere. Despite this, the calculated value for is in good agreement with values obtained from our slow-neutron diffraction measurement, reflecting the effect of non-diamond components such as graphite and other inorganic/organic materials on the effective SLD of our surface-modified ND.
Since the slow-neutron diffraction efficiency of an NPC grating depends on that is proportional to [see Eq. (4)], another interesting possibility arising from the analysis in the present paper is the a priori assessment of slow-neutron diffraction properties of an NPC grating in advance from light diffraction data (assessing ) only. Such quantitative information provides a solid estimation for predicting grating performance in slow-neutron diffraction experiments. In practice, the latter can be a valuable tool to save scarce neutron beamtime that would otherwise be used inefficiently for samples of previously unknown low neutron-optical performance.
IV CONCLUSION
We have successfully demonstrated volume holographic recording in NPCs dispersed with ND at a recording wavelength of 532 nm. ND was synthesized by a detonation method, followed by the removal of residual graphite and the surface treatment. We have found that the surface-modified ND can be uniformly dispersed in an acrylate monomer blend as high as 22 vol.%. They act as nanoparticles and participate in the photopolymerization-driven mutual diffusion and phase separation dynamics of ND and monomer during holographic exposure. As a result, such holographic assembly of ND in the formed polymer induces the spatial density modulation of ND, leading to the formation of ND-dispersed holographic phase gratings, which was evidenced by the observation of the cross section of a recorded grating. Unslanted and plane-wave transmission volume gratings with as high as 4.710-3 (2.210-3) at a wavelength of 532 nm and at grating spacing of 1 m (0.5 m) were recorded in NPC films dispersed with ND of 15 vol.%. Because refractive index differences between the surface-modified ND and the formed polymer are large at both visible and slow-neutron wavelengths, our proof-of-principle demonstration of recording high contrast gratings paves the way for efficient manipulation of light and slow-neutron beams.
Our slow-neutron diffraction experiments have shown that ND dispersed NPC gratings are excellent candidates for use in neutron optics. Their diffraction properties for slow neutrons have reached values almost comparable to those of the best SiO2 dispersed NPC gratings reported so far [38, 39]. In particular, we have demonstrated that ND dispersed NPC gratings easily provide diffraction efficiencies higher than 20 % at relaxed angular selectivity, preferable for loosely collimated slow-neutron beams with rather wide wavelength distributions. ND dispersed NPC gratings presented here clearly possess a potential to outperform SiO2 dispersed NPC gratings. We have also shown that a good prediction of the expected slow-neutron diffraction performance of NPC gratings is possible from light diffraction data only: By taking into account a refractive index profile, (from light diffraction) and a literature value for SLD of dispersed nanoparticles, a solid prediction for and, thus, the slow-neutron diffraction efficiency can be made. Conversely, and probably more importantly, given some knowledge about a grating’s refractive index profile from light and neutron diffraction, it is possible to yield information about the SLD of a dispersed nanomaterial such as ND, in our case. Indeed, we have developed a method to establish an estimation of SLD of the surface-modified ND, which may help to extract some information concerning the surface state.
Acknowledgements.
We wish to acknowledge the support of the Ministry of Education, Culture, Sports, Science and Technology of Japan under grant 15H03576. We are grateful to M. Hino and T. Oda (Kyoto University) for providing the redirecting mirror for our slow-neutron experiments. We also thank T. Brenner for technical assistance at the Institut Laue-Langevin.Appendix A REFRACTIVE INDEX MODULATION AMPLITUDE FORMED IN NPC MEDIA
Consider an unslanted and plane-wave phase grating recorded in an NPC medium containing the formed host polymer of the refractive index and dispersed spherical nanoparticles of the refractive index with their position-dependent and periodically modulated volume fractions of and at a position , respectively. We may approximate a periodically modulated refractive index with the grating vector along the direction under the Maxwell Garnett approximation [79] with and as
| (6) | |||||
where the second equality comes from the relation that at any . Since is periodic in , can be written as
| (7) |
where is the modulation amplitude of and is a dc biased periodic function with an oscillation amplitude of and the spatial period . Note that , with being the spatially averaged value of and .
Furthermore, we note that is a non-negative function and is much smaller than , since . It is expressed, in terms of a Fourier series, by
| (8) |
where and due to being a real function. In particular, is given by .
Likewise, can be expressed in terms of a Fourier series by
| (9) |
where for a pure phase grating. Using Eqs. (6)-(9), we find
| (10) | |||||
where is used. Also, we find from Eqs. (6)-(8) that
| (11) |
Therefore, the refractive index modulation amplitude of the 1st-order (Bragg-matched) component for is given by
| (12) | |||||
When we set , we can express as
| (13) |
which is Eq. (1). It is straightforward to find from Eq. (8) that is unity for a pure sinusoidal waveform of and is for a rectangular waveform of , where
References
- Krueger [2008] A. Krueger, Diamond nanoparticles: jewels for chemistry and physics, Adv. Mater. 30, 2445 (2008).
- Mochalin et al. [2012] V. N. Mochalin, O. Shenderova, D. Ho, and Y. Gogotsi, The properties and applications of nanodiamonds, Nat. Nanotechnol. 7, 11 (2012).
- Dolmatov [2007] V. Y. Dolmatov, Detonation-synthesis nanodiamonds: synthesis, structure, properties and applications, Russ. Chem. Rev. 76, 339 (2007).
- Zhang et al. [2018] Y. Zhang, K. Y. Rhee, D. Hui, and S.-J. Park, A critical review of nanodiamond based nanocomposites: synthesis, properties and applications, Compos. Part B 143, 19 (2018).
- Turcheniuk and Mochalin [2012] K. Turcheniuk and V. N. Mochalin, Biomedical applications of nanodiamonds, Nanotechnol. 28, 252001 (2012).
- Aharonovich et al. [2011] I. Aharonovich, A. D. Greentree, and S. Prawer, Diamond photonics, Nature Photonics 5, 397 (2011).
- Radulaski et al. [2019] M. Radulaski, J. L. Zhang, Y.-K. Tzeng, K. G. Lagoudakis, H. Ishikawa, C. Dory, K. A. Fischer, Y. A. Kelaita, S. Sun, P. C. Maurer, K. Alassaad, G. Ferro, Z.-X. Shen, N. A. Melosh, S. Chu, and J. Voučokovič, Nanodiamond integration with photonic devices, Laser Photonics Rev. 13, 1800316 (2019).
- Tomita et al. [2016a] Y. Tomita, E. Hata, K. Momose, S. Takayama, X. Liu, K. Chikama, J. Klepp, C. Pruner, and M. Fally, Photopolymerizable nanocomposite photonic materials and their holographic applications in light and neutron optics, J. Mod. Opt. 63, S1 (2016a).
- Suzuki et al. [2002] N. Suzuki, Y. Tomita, and T. Kojima, Holographic recording in TiO2 nanoparticle-dispersed methacrylate photopolymer films, Appl. Phys. Lett. 81, 4121 (2002).
- Suzuki and Tomita [2004] N. Suzuki and Y. Tomita, Silica-nanoparticle-dispersed methacrylate photopolymers with net diffraction efficiency near 100%, Appl. Opt. 43, 2125 (2004).
- Hata et al. [2011] E. Hata, K. Mitsube, K. Momose, and Y. Tomita, Holographic nanoparticle-polymer composites based on step-growth thiol-ene photopolymerization, Opt. Mater. Express 1, 207 (2011).
- Suzuki et al. [2006] N. Suzuki, Y. Tomita, K. Ohmori, M. Hidaka, and K. Chikama, Highly transparent ZrO2 nanoparticle dispersed acrylate photopolymers for volume holographic recording, Opt. Express 14, 12712 (2006).
- Sakhno et al. [2007] O. V. Sakhno, L. M. Goldenberg, J. Stumpe, and T. N. Smirnova, Surface modified ZrO2 and TiO2 nanoparticles embedded in organic photopolymers for highly effective and UV-stable volume holograms, Nanotechnol. 18, 105704 (2007).
- Garnweitner et al. [2007] G. Garnweitner, L. M. Goldenberg, O. V. Sakhno, M. Antonietti, M. Niederberger, and J. Stumpe, Large‐scale synthesis of organophilic zirconia nanoparticles and their application in organic–inorganic nanocomposites for efficient volume holography, Small 3, 1626 (2007).
- Fujii et al. [2014] R. Fujii, J. Guo, J. Klepp, C. Pruner, M. Fally, and Y. Tomita, Nanoparticle polymer composite volume gratings incorporating chain transfer agents for holography and slow-neutron optics, Opt. Lett. 39, 3453 (2014).
- Ni et al. [2015] M. Ni, H. Peng, Y. Liao, Z. Yang, Z. Xue, and X. Xie, 3d image storage in photopolymer/ZnS nanocomposites tailored by “photoinitibitor”, Macromolecules 48, 2958 (2015).
- Sakhno et al. [2008] O. V. Sakhno, T. N. Smirnova, L. M. Goldenberg, and J. Stumpe, Holographic patterning of luminescent photopolymer nanocomposites, Mater. Sci. Eng. C 28, 28 (2008).
- Zhang et al. [2019] X. Zhang, W. Yao, X. Zhou, W. Wu, Q. Liu, H. Peng, J. Zhu, I. Smalyukh, and X. Xie, Holographic polymer nanocomposites with simultaneously boosted diffraction efficiency and upconversion photoluminescence, Compos. Sci. Technol. 181, 107705 (2019).
- Guo et al. [2020] J. Guo, L. Cao, J. Jian, H. Ma, D. Wang, and X. Zhang, Single-wall carbon nanotube promoted allylic homopolymerization for holographic patterning, Carbon 157, 64 (2020).
- Leite et al. [2009] E. Leite, I. Naydenova, N. Pandey, T. Babeva, G. Majono, S. Minotova, and V. Toal, Investigation of the light induced redistribution of zeolite Beta nanoparticles in an acrylamide-based photopolymer, J. Opt. A: Pure Appl. Opt. 11, 024016 (2009).
- Liu et al. [2009] X. Liu, Y. Tomita, J. Oshima, K. Chikama, K. Matsubara, T. Nakashima, and T. Kawai, Holographic assembly of semiconductor CdSe quantum dots in polymer for volume Bragg grating structures with diffraction efficiency near 100%, Appl. Phys. Lett. 95, 261109 (2009).
- Sakhno et al. [2009] O. V. Sakhno, L. M. Goldenberg, J. Stumpe, and T. N. Smirnova, Effective volume holographic structures based on organic–inorganic photopolymer nanocomposites, J. Opt. A: Pure Appl. Opt. 11, 024013 (2009).
- Tomita et al. [2006a] Y. Tomita, K. Furushima, K. Ochi, K. Ishizu, A. Tanaka, M. Ozawa, M. Hidaka, and K. Chikama, Organic nanoparticle (hyperbranched polymer)-dispersed photopolymers for volume holographic storage, Appl. Phys. Lett. 88, 071103 (2006a).
- Tomita et al. [2019a] Y. Tomita, T. Aoi, J. Oshima, and K. Odoi, Hyperbranched-polymer nanocomposite gratings with ultrahigh refractive index modulation amplitudes for volume holographic optical elements, Proc. SPIE 11030, 1103007 (2019a).
- Tomita et al. [2008] Y. Tomita, T. Nakamura, and A. Tago, Improved thermal stability of volume holograms recorded in nanoparticle-polymer composite films, Opt. Lett. 33, 1750 (2008).
- Hata and Tomita [2010] E. Hata and Y. Tomita, Order-of-magnitude polymerization-shrinkage suppression of volume gratings recorded in nanoparticle-polymer composites, Opt. Lett. 35, 396 (2010).
- Smirnova et al. [2005] T. N. Smirnova, O. V. Sakhno, V. M. Fitio, Y. Gritsai, and J. Stumpe, Nonlinear diffraction in gratings based on polymer–dispersed TiO2 nanoparticles, Appl. Phys. B 80, 947 (2005).
- Tomita [2005] Y. Tomita, Holographic manipulation of nanoparticle distribution morphology in photopolymers and its applications to volume holographic recording and nonlinear photonic crystals, OSA Trends Opt. Photonics 99, 274 (2005).
- Liu et al. [2010] X. Liu, K. Matsumura, Y. Tomita, K. Yasui, K. Kojima, and K. Chikama, Nonlinear optical responses of nanoparticle-polymer composites incorporating organic (hyperbranched polymer)-metallic nanoparticle complex, J. Appl. Phys. 108, 073102 (2010).
- Liu et al. [2012] X. Liu, Y. Adachi, Y. Tomita, J. Oshima, T. Nakashima, and T. Kawai, High-order nonlinear optical response of a polymer nanocomposite film incorporating semiconducotor cdse quantum dots, Opt. Express 20, 13457 (2012).
- Dolgaleva et al. [2009] K. Dolgaleva, H. Shin, and R. W. Boyd, Observation of a microscopic cascaded contribution to the fifth-order nonlinear susceptibility, Phys. Rev. Lett. 103, 113902 (2009).
- Momose et al. [2012] K. Momose, S. Takamaya, E. Hata, and Y. Tomita, Shift-multiplexed holographic digital data page storage in a nanoparticle-(thiol-ene) polymer composite film, Opt. Lett. 37, 2250 (2012).
- Takayama et al. [2014] S. Takayama, K. Nagaya, K. Momose, and Y. Tomita, Effects of symbol modulation coding on readout fidelity of shift-multiplexed holographic digital data page storage in a photopolymerizable nanoparticle-(thiol-ene)polymer composite film, Appl. Opt. 53, B53 (2014).
- Tomita et al. [2016b] Y. Tomita, H. Urano, T. Fukamizu, Y. Kametani, N. Nishimura, and K. Odoi, Nanoparticle-polymer composite volume holographic gratings dispersed with ultrahigh-refractive-index hyperbranched polymer as organic nanoparticles, Opt. Lett. 41, 1281 (2016b).
- Fernandez et al. [2019] R. Fernandez, S. Bleda, S. Gallego, C. Neipp, A. Marquez, Y. Tomita, I. Pascual, and A. Beléndez, Holographic waveguides in photopolymers, Opt. Express 27, 827 (2019).
- Smirnova et al. [2014] T. N. Smirnova, O. V. Sakhno, V. M. Fitio, Y. Gritsai, and J. Stumpe, Simple and high performance DFB laser based on dye-doped nanocomposite volume gratings, Laser Phys. Lett. 11, 215804 (2014).
- Rauch and Werner [2015] H. Rauch and S. A. Werner, Neutron Interferometry, 2nd ed. (Oxford University Press, 2015).
- Fally et al. [2010] M. Fally, J. Klepp, Y. Tomita, T. Nakamura, C. Pruner, M. A. Ellabban, R. A. Rupp, M. Bichler, I. Drevenšek-Olenik, J. Kohlbrecher, H. Eckerlebe, H. Lemmel, and H. Rauch, Neutron optical beam splitter from holographically structured nanoparticle-polymer composites, Phys. Rev. Lett. 105, 123904 (2010).
- Klepp et al. [2012a] J. Klepp, C. Pruner, Y. Tomita, K. Mitsube, P. Geltenbort, and M. Fally, Mirrors for slow neutrons from holographic nanoparticle-polymer free-standing film-gratings, Appl. Phys. Lett. 100, 214104 (2012a).
- Klepp et al. [2012b] J. Klepp, C. Pruner, Y. Tomita, J. Kohlbrecher, and M. Fally, Three-port beam splitter for cold neutrons using holographic nanoparticle-polymer composite diffraction gratings, Appl. Phys. Lett. 101, 154104 (2012b).
- Blaickner et al. [2019] M. Blaickner, B. Demirel, I. Drevenšek-Olenik, M. Fally, P. Flauger, P. Geltenbort, Y. Hasegawa, R. Kurinjimala, M. Ličen, C. Pruner, S. Sponar, Y. Tomita, and J. Klepp, Monte-Carlo simulation of neutron transmission through nanocomposite materials for neutron-optics applications, Nucl. Instrum. Meth. Phys. Res. A 916, 154 (2019).
- Klepp et al. [2012c] J. Klepp, C. Pruner, Y. Tomita, P. Geltenbort, I. Drevenšek-Olenik, S. Gyergyek, J. Kohlbrecher, and M. Fally, Holographic gratings for slow-neutron optics, Materials 2012, 2788 (2012c).
- Nesvizhevsky et al. [2010] V. V. Nesvizhevsky, R. Cubitt, E. Lychagin, A. Muzychka, G. Nekhaev, G. Pignol, K. Protasov, and A. Strelkov, Application of diamond nanoparticles in low-energy neutron physics, Materials 3, 1768 (2010).
- Nesvizhevsky et al. [2018] V. V. Nesvizhevsky, M. Dubois, P. Gutfreund, E. V. Lychagin, A. Y. Nezvanov, and K. N. Zhernenkov, Effect of nanodiamond fluorination on the efficiency of quasispecular reflection of cold neutrons, Phys. Rev. A 97, 023629 (2018).
- Tomita et al. [2019b] Y. Tomita, A. Kageyama, Y. Iso, , K. Umemoto, J. Klepp, C. Pruner, and M. Fally, Holographic nanodiamond composite gratings for light and slow-neutron beam control, Technical Digest of CLEO/Europe-EQEC 2019, Munich, Germany , CE8.5 (2019b).
- Tomlinson et al. [1976] W. J. Tomlinson, E. A. Chandross, H. P. Weber, and G. G. Aumiller, Multicomponent photopolymer systems for volume phase holograms and grating devices, Appl. Opt. 15, 534 (1976).
- Tomita et al. [2005a] Y. Tomita, N. Suzuki, and K. Chikama, Holographic manipulation of nanoparticle distribution morphology in nanoparticle-dispersed photopolymers, Opt. Lett. 30, 839 (2005a).
- Tomita et al. [2006b] Y. Tomita, K. Chikama, Y. Nohara, N. Suzuki, K. Furushima, and Y. Endoh, Two-dimensional imaging of atomic distribution morphology created by holographically induced mass transfer of monomer molecules and nanoparticles in a silica-nanoparticle-dispersed photopolymer film, Opt. Lett. 31, 1402 (2006b).
- Suzuki and Tomita [2006] N. Suzuki and Y. Tomita, Real-time phase-shift measurement during formation of a volume holographic grating in nanoparticle-dispersed photopolymers, Appl. Phys. Lett. 88, 011105 (2006).
- Piao and Kim [2014] M.-L. Piao and N. Kim, Achieving high level of color uniformity and optical efficiency for a wedge-shaped waveguide head-mounted display using a photopolymer, Appl. Opt. 53, 2180 (2014).
- Yeom et al. [2015] H.-J. Yeom, H.-J. Kim, S.-B. Kim, H. Zhang, B. Li, Y.-M. Ji, S.-H. Kim, and H.-H. Park, 3D holographic head mounted display using holographic optical elements with astigmatism aberration compensation, Opt. Express 23, 32025 (2015).
- Tomita et al. [2005b] Y. Tomita, N. Suzuki, K. Furushima, and Y. Endoh, Volume holographic recording based on mass transport of nanoparticles doped in methacrylate photopolymers, Proc. SPIE 5939, 593909 (2005b).
- Sears [1989] V. F. Sears, Neutron Optics (Oxford University Press, 1989).
- Avdeev et al. [2013] M. V. Avdeev, V. L. Aksenov, O. V. Tomchuk, L. Bulavin, V. M. Garamus, and E. Osawa, The spatial diamond–graphite transition in detonation nanodiamond as revealed by small-angle neutron scattering, J. Phys.: Condens. Matter 25, 445001 (2013).
- Dianoux and Lander [2003] A.-J. Dianoux and G. Lander, eds., Neutron Data Booklet (Old City Publishing, Copyright 2003 Institut Laue-Langevin, Philadelphia, USA, 2003) https://www.ill.eu/quick-links/publications/.
- Grünzweig et al. [2008] C. Grünzweig, F. Pfeiffer, O. Bunk, T. Donath, G. Kühne, G. Frei, M. Dierolf, and C. David, Design, fabrication, and characterization of diffraction gratings for neutron phase contrast imaging, Rev. Sci. Instrum. 79, 053703 (2008).
- Miao et al. [2014] H. Miao, A. A. Gomella, N. Chedid, L. Chen, and H. Wen, Fabrication of 200 nm period hard x-ray phase gratings, Nano Letters 14, 3453 (2014).
- Mochalin et al. [2008] V. Mochalin, S. Osswald, and Y. Gogotsi, Contribution of functional groups to the Raman spectrum of nanodiamond powders, Chem. Mater. 21, 273 (2008).
- Ahn et al. [2004] S. H. Ahn, S. H. Kim, B. C. Kim, K. B. Shim, and B. G. Cho, Mechanical properties of silica nanoparticle reinforced poly(ethylene 2, 6-naphthalate), Macromol. Res. 12, 293 (2004).
- Terada et al. [2019] D. Terada, T. F. Segawa, A. I. Shames, S. Onoda, T. Ohshima, E. Osawa, R. Igarashi, and M. Shirakawa, Monodisperse five-nanometer-sized detonation nanodiamonds enriched in nitrogen-vacancy centers, ACS Nano 13, 6461 (2019).
- Duan et al. [2019] X. Duan, W. Tian, J. Zhang, H. Sun, Z. Ao, Z. Shao, and S. Wang, sp2/sp3 framework from diamond nanocrystals: A key bridge of carbonaceous structure to cabocatalysis, ACS Catalysis 9, 7494 (2019).
- Kogelnik [1969] H. Kogelnik, Coupled wave theory for thick hologram gratings, Bell Syst. Tech. J. 48, 2909 (1969).
- Uchida [1973] N. Uchida, Calculation of diffraction efficiency in hologram gratings attenuated along the direction perpendicular to the grating vector, J. Opt. Soc. Am. 63, 280 (1973).
- Yeh [1993] P. Yeh, Introduction to Photorefractive Nonlinear Optics (Wiley, 1993).
- Sharda et al. [2003] T. Sharda, T. Soga, and T. Jimbo, Optical properties of nanocrystalline diamond films by prism coupling technique, J. Appl. Phys. 93, 101 (2003).
- Phillip and Taft [1964] H. R. Phillip and E. A. Taft, Kramers-Kronig analysis of reflectance data for diamond, Phys. Rev. 136, A1445 (1964).
- Djurišić and Li [1999] A. B. Djurišić and E. H. Li, Optical properties of graphite, J. Appl. Phys. 85, 7404 (1999).
- Bodurov et al. [2016] I. Bodurov, I. Vlaeva, A. Viraneva, T. Yovcheva, and S. Sainov, Modified design of a laser refractometer, Nanoscience & Nanotechnology 16, 31 (2016).
- Kasarova et al. [2007] S. N. Kasarova, N. G. Sultanova, C. D. Ivanov, and I. D. Nikolov, Analysis of the dispersion of optical plastic materials, Opt. Mater. 29, 1481 (2007).
- Poularikas [1985] A. D. Poularikas, Effective index of refraction of isotropic media containing layered spheres, J. Appl Phys. 58, 1044 (1985).
- Klein and Cook [1967] W. R. Klein and B. D. Cook, Unified approach to ultrasonic light diffraction, IEEE Trans. Sonics Ultrason. SU-14, 123 (1967).
- Moharam and Young [1978] M. G. Moharam and L. Young, Criteria for Bragg and Raman-Nath regimes, Appl. Opt. 17, 1757 (1978).
- Moharam et al. [1980a] M. G. Moharam, T. K. Gaylord, and R. Magnusson, Criteria for Bragg regime diffraction by phase gratings, Opt. Commun. 32, 14 (1980a).
- Moharam et al. [1980b] M. G. Moharam, T. K. Gaylord, and R. Magnusson, Criteria for Raman-Nath regime diffraction by phase gratings, Opt. Commun. 32, 19 (1980b).
- Moharam and Gaylord [1981] M. G. Moharam and T. K. Gaylord, Rigorous coupled-wave analysis of planar-grating diffraction, J. Opt. Soc. Am. 71, 811 (1981).
- Oda et al. [2017] T. Oda, M. Hino, M. Kitaguchi, H. Filter, P. Geltenbort, and Y. Kawabata, Towards a high-resolution TOF-MIEZE spectrometer with very cold neutrons, Nucl. Instrum. Meth. Phys. Res. A 860, 35 (2017).
- Fally et al. [2018] M. Fally, P. Geltenbort, T. Jenke, J. Klepp, V. Nesvizhevsky, and C. Pruner, Ionic-liquids composites (ILCs) for holographic-grating neutron-optical elements, Institut Laue-Langevin (ILL): Grenoble, http://dx.doi.org/10.5291/ILL-DATA.3-14-376 (2018).
- Fally et al. [2020] M. Fally, T. Jenke, J. Klepp, and C. Pruner, Diamond nanoparticles in nanoparticle-polymer composite neutron diffraction gratings, Institut Laue-Langevin (ILL): Grenoble, http://dx.doi.org/10.5291/ILL-DATA.3-14-392 (2020).
- Markel [2016] V. A. Markel, Introduction to the Maxwell Garnett approximation: tutorial, J. Opt. Soc. Am. A 33, 1244 (2016).