Importance of long-range channel Sr displacements for the narrow emission in Sr[Li2Al2O2N2]:Eu2+phosphor
Abstract
The recently discovered Sr[Li2Al2O2N2]:Eu2+ red phosphor, candidate for the next generation of eco-efficient white light-emitting diodes, exhibits excellent emission spectral position and exceptionally small linewidth. It belongs to the UCr4C4-structure family of phosphors, containing many potential candidates commercial phosphors, whose small linewidth, tentatively ascribed to the high-symmetry cuboid environment of the doping site, has drawn the attention of researchers in the last five years. We use density functional theory, SCF method and configuration coordinate models (CCM) to provide a complete characterization of this material. Using a multi-dimensional CCM, an accurate description of the coupling of the vibronic structure with the electronic 5d4f transition is obtained, including the partial Huang-Rhys factors and frequency of the dominant modes. We show that, in addition to the first-coordination shell cuboid deformation mode, low-frequency phonon modes involving chains of strontium atoms along the tetragonal axis shape the emission linewidth in Sr[Li2Al2O2N2]:Eu2+. This finding sheds new light on the emission properties of UCr4C4-structure phosphors, possessing similar Ca/Sr/Ba channel. Our approach provides a robust theoretical framework to systematically study the emission spectra of such Eu-doped phosphors, and predict candidates with expected similar or even sharper linewidth.
I Introduction
To mitigate CO2 emission, the use of efficient white-light sources for general lighting is becoming increasingly important worldwide. In 2019, in its solid state lighting plan that relies heavily on light-emitting diodes (LEDs) technology, the US department of energy estimated that the energy savings could account for about a 5% reduction in the total primary energy budget of the USA [1]. One way to realize such white light is to coat a primary blue or near ultraviolet LED with one or multiple phosphor material(s) that converts a fraction of the initial high-frequency photons to lower frequency, the resulting light appearing white. There generally exist two ways to obtain white light via LEDs with phosphors : (i) a blue LED is used to excite a single yellow phosphor or mixed green and red phosphors; and (ii) a near ultraviolet LED chip is used to excite the red, green, and blue phosphors [2, 3].
Among the various phosphor compounds, finding a highly efficient red emitting phosphor is crucial for a further increase in the luminous efficacy while keeping a high color-rendering index. In order to sufficiently cover the red spectral region while minimizing the efficacy loss caused by the eye poor long-wave sensitivity, red phosphors with narrow emission bandwidth showing a peak in the optimal red region are needed [4, 5]. In 2019, Hoerder et al. [6] reported the experimental discovery of a new narrow-band red-emission phosphor Sr[Li2Al2O2N2]:Eu2+ (SALON) that fulfills such requirements with an emission peak located at 614 nm, a full width at half maximum (FWHM) of only 48 nm at room temperature and a low thermal quenching of 4% at operating temperature (420K). The fact that the emission peak is located at a shorter wavelength than its cousin Sr[LiAl3N4]:Eu2+ (SLA) [7] enables a gain of 16% in luminous efficacy compared to SLA, while keeping an excellent color rendering and thus enabling a potential leap in the energy efficiency of white-emitting phosphor-converted LEDs. SALON belongs to the UCr4C4-structure family of phosphors, from which most interesting narrow-emission candidates have emerged recently [8, 9].
In our work, we first provide a theoretical characterization of the geometric, electronic and vibrational properties of SALON from first principles, using density-functional theory (DFT). We study the narrow Eu5dEu4f emission spectrum from a theoretical perspective. For this purpose, we use the SCF method [10, 11, 12, 13], that allows one to compute relevant transition energies and atomic configuration displacement induced by the 5d-4f electronic transition. In combination with SCF calculations, we use a multi-dimensional configuration-coordinate model with the help of a generating function approach to determine the luminescence intensity spectrum. Indeed, this approach allows us to extract the spectral decomposition of the phonon modes participating to the 5d-4f transition by projecting the atomic displacements induced by the 5d-4f transition onto the phonon eigenvectors of the host structure. For this purpose, we use density-functional perturbation theory (DFPT) [14, 15] to compute the phonons modes of SALON. This approach has been used by Alkauskas et al. [16] to study the vibronic structure of diamond nitrogen-vacancy (NV) center and, recently, by Linderälv et al. [17] to study the lineshape of Ce-doped YAG. To our knowledge, the latter work is the only prior existing fully first-principles vibronic analysis of the 5d-4f emission of lanthanide-based phosphors. We note however that some previous vibronic studies, mixing experimental and theoretical analysis, were already carried out [18, 19, 20, 21].
We compare our result with a one-dimensional configuration-coordinate model (1D CCM).
It was suggested by Hoerder et al. [6] that the narrow emission band of SALON originates from the Eu2+ optical center with high local-symmetry environment composed of a nearly cubic polyhedron of four oxygen and four nitrogen atoms, resulting in an isotropic structural relaxation upon emission. This would reduce the number of different energetic states involved in the emission process, leading to a narrow emission band [6]. Here, we show that this picture is incomplete.
Our computations indicate that the structural change of the environment of the europium atom when going from excited to ground state is composed of two patterns: i) a nearly isotropic expansion of the first coordination shell of the Eu atom composed of O and N, as suggested by Hoerder et al. [6]; ii) a long-range collective displacement of the Sr channel containing Eu atom away from Eu. This second pattern couples with low-frequency acoustic and phonon modes in a small energy window, and contributes to the small linewidth. It is also responsible for the slow convergence of the results with the supercell size. We propose a geometric series model on the Sr displacements to estimate the residual error made.
Overall, we explain the narrow emission spectrum by the combination of i) a small atomic displacement upon emission due to the rigid host structure and ii) an important participation of low-frequency phonon modes in the electronic transition. We finally find that the shape of our theoretical spectrum agrees well with the experimental one.
The paper is structured as follows. Section II is devoted to theoretical background: we explain how transitions energies and atomic displacements induced by the 5d-4f transition can be used within a configuration-coordinate model framework. The generating function approach that allows one to predict luminescence spectra is also introduced. In section III, we present the results of our work. We start with the DFT results on structural and electronic properties of SALON and present its luminescent properties. We describe which phonon modes dominate the electronic transition. We then present the theoretical luminescence spectrum decomposed in all the vibrational modes and we compare it to the spectrum obtained from only one effective vibrational mode. Section IV provides additional discussion and concludes this work. The computational methodology is described in section V.
II Theoretical background
The absorption-emission process can be understood based on Figure 1. We first consider the system in its relaxed 4f ground state () with configuration coordinate . When a photon is absorbed, the system is quickly promoted to an unrelaxed excited 5d state () without atomic motion. Due to this change of electronic state, atomic relaxation towards a new equilibrium configuration takes place with phonon emission. The energy lost in the process is the Franck-Condon shift . Photon emission occurs then through 5d-4f deexcitation and the system reaches an unrelaxed ground state . The cycle is completed by a last relaxation with phonon emission and energy loss until the initial state .
The total energy loss is the Stokes shift given by the sum of the two Franck-Condon shifts . The zero-phonon line refers to a purely electronic transition with energy . Ignoring the small difference of zero-point energies between the two states, is the difference between the two energy surface minima.
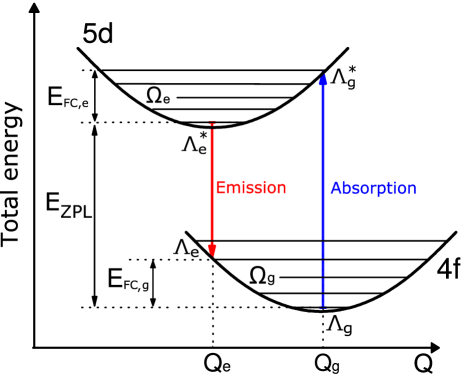
We first describe how to consider the luminescent properties with a 1D-CCM as depicted in Figure 1. In this model, all the complexity of the nuclei vibrations is reduced to one effective vibrational mode characterized by a generalized configuration coordinate that interpolates linearly between ground- and excited-state atomic coordinates. Deviations from linear interpolation can be considered when studying non-radiative decay channels, but have been shown to have a small impact on the luminescence spectrum shape [22].
In the 1D-CCM, the 4f and 5d Born-Oppenheimer potential energies are displayed as a function of the normal coordinate . The corresponding ionic configuration is
| (1) |
where is the normal coordinate change from ground-state to excited-state geometries. It writes
| (2) |
where labels Cartesian axes, atoms, atomic masses, and are respectively atomic positions in 5d excited and 4f ground states. Within such coordinate system, the harmonic ground-state and excited-state energies are respectively
| (3) | ||||
| (4) |
The associated effective vibrational frequencies in the ground (g) or excited (e) states are
| (5) |
We can use Eqs. (3) and (4) to compute the Huang-Rhys factors that indicate the average numbers of phonons emitted during the relaxation process:
| (6) |
Using a semi-classical treatment, one can estimate the FWHM of the spectrum by considering the expectation value of and by computing the density of transition as a function of the emitted energy. At 0 K, the FWHM, W(0), is written as [23]
| (7) |
This formula is valid for large values of S, such that the otherwise Pekarian line shape of the emission spectrum is well approximated by a Gaussian envelope. As will be seen later, this condition is not well fulfilled for SALON phosphor (S 3), but we will use it nonetheless as a reference for later comparison.
Focusing now on the multi-dimensional configuration coordinate model (multi-D CCM), the nuclear motions are a superposition of 3N normal modes of vibration represented by normal coordinates and frequency with N the number of atoms in the supercell. The harmonic approximation is retained: each phonon mode is independent of each other and the vibrations in the solids are composed of 3N harmonic oscillators. The vibrational state is expressed as a product of 3N harmonic oscillator eigenfunctions with the vibrational state of the -th harmonic oscillator and the set of 3N vibrational state .
Making then the Franck-Condon approximation, which states that the transition dipole moment between excited and ground state depends weakly on nuclear coordinates, we write the normalized luminescence intensity at 0 K for a given photon energy as , with a normalization constant that is chosen such that the area under the curve is unity, and the emission spectral function is
| (8) |
with , the energy of the state [16]. Note that, in the 1D-CCM and assuming the same harmonic curvature in the ground and excited states, , such that , Equation (8) reduces to
| (9) |
In the multi-D CCM approach, the harmonic approximation allows one to write the 3N-dimensional Franck-Condon overlap as a product of 3N overlap integrals . Indeed at 0 K, all initial vibrational states are in their lowest state . We finally suppose that the Born-Oppenheimer curvatures are the same in the and state which holds for SALON. This allows one to further simplify Equation (8) since with the partial Huang-Rhys factor of mode [23]. We then write the transition matrix element as
| (10) |
Quantities that enters Eqs. (8) and (10) are phonon frequencies and partial Huang-Rhys factors . Following the work of Alkauskas et al. [16], we define the weight by which each mode contributes to the atomic position changes when a electronic transition occurs as , where
| (11) | ||||
| (12) |
and is the vector that represents the displacement of atom in phonon mode . This vector is normalized such that . In other words, the contribution of a mode to the electronic transition is given by the projection of the phonon eigenvector associated with this mode on the atomic distortion induced by this electronic transition, weighted by the atom mass. It is possible to define an effective frequency as
| (13) |
where is the frequency of the mode . The partial Huang-Rhys factor associated with the mode indicates the number of phonons of mode involved in the 4f-5d transition. Assuming harmonicity, we have
| (14) |
By introducing a Huang-Rhys spectral decomposition [24],
| (15) |
a generating function approach yields the spectral function
| (16) |
where the generating function is
| (17) | ||||
| (18) |
The is the total Huang-Rhys factor and the parameter represents the homogeneous Lorentzian broadening of each transition. One can also model inhomogeneous broadening due to ensemble averaging with a convolution of ) with a Gaussian. Within this multi-dimensional approach, calculating the emission spectrum requires to compute in DFT: (i) the zero-phonon line energy , (ii) the atomic configuration change induced by 4f-5d transition , (iii) the phonon eigenvectors and eigenfrequencies . The first two are accessible through the SCF method while DFPT can deliver the third one. Within the 1D-CCM, computing all phonon modes with DFPT is not needed, only one relevant effective phonon frequency is deduced from the harmonic approximation, the knowledge of the Franck-Condon shift and the normal coordinate change .
III Results and discussion
III.1 Structural properties
Based on single-crystal X-ray diffraction data, Hoerder et al. [6] showed that SALON crystallizes in a tetragonal phase (space group ) with the unit-cell parameter and with 2 formula units per cell and 18 atoms per primitive cell.
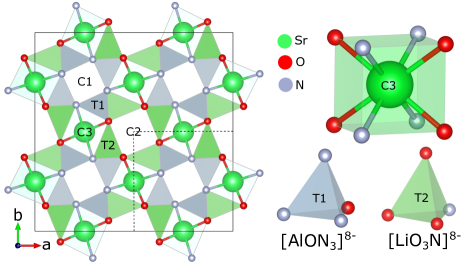
The structure is a variant of the UCr4C4 structure type, well known in the field of phosphor materials to provide a highly condensed and rigid framework structure [25, 26, 9], with strontium on the corresponding uranium site, aluminium and lithium on the corresponding chromium site, and nitrogen and oxygen on the corresponding carbide site. Two tetrahedra types form a network hosting the strontium cations in one of the resulting channels shown in Figure 2. Strontium atoms are coordinated with four nitrogen and four oxygen atoms which gives a highly-symmetrical cube-like coordination.
The structural parameters of undoped SALON computed within DFT are listed in Table 1. We observe globally a slight overestimation of the structural parameters by about 0.5-0.7 % which is common of GGA-PBE functionals. Since our computation neglects all vibrational and anharmonic effects, while the experimental structure is measured at room-temperature, this error might be underestimated because of zero-point and thermal expansion effects. When a Sr atom is replaced by an Eu atom in the doped configuration, with decrease of symmetry to point group (), we observe that the Eu-O and Eu-N bond lengths are quite close to the Sr-O and Sr-N bond lengths, which is reasonable since the experimental atomic radii of Eu and Sr in their VIII coordination state are very close; 1.39 and 1.40 , respectively [27]. In contrast, we also observe that the Eu-Sr length is more than 2 bigger than the Sr-Sr length in the undoped structure.
| Experiment [6] | This work | |||
|---|---|---|---|---|
| Undoped | Undoped | Doped 4f | Doped 5d | |
| a [] | 7.959 | 8.013 (+0.67%) | 8.012 (-0.01%) | 8.012 (+0%) |
| b [] | 7.959 | 8.013 (+0.67%) | 8.012 (-0.01%) | 8.012 (+0%) |
| c [] | 38.208 | 38.438 (+0.60%) | 38.442 (+0.01%) | 38.442 (+0%) |
| X-Sr length [] | 3.184 | 3.131 (-1.66%) | 3.206 (+2.39%) | 3.171 (-1.10%) |
| X-O length [] | 2.659 | 2.667 (+0.30%) | 2.678 (+0.41%) | 2.633 (-1.71%) |
| X-N length [] | 2.760 | 2.782 (+0.79%) | 2.784 (+0.07%) | 2.738 (-1.68%) |
| O-X-O angle [∘] | 73.572 | 73.819 (+0.34%) | 73.719 (-0.13%) | 72.514 (-1.66%) |
| N-X-N angle [∘] | 70.446 | 70.301 (-0.21%) | 70.356 (+0.08%) | 70.628 (+0.39%) |
| Polyhedral volume [3] | 30.411 | 30.870 (+1.49%) | 31.107 (+0.76%) | 29.715 (-4.68%) |
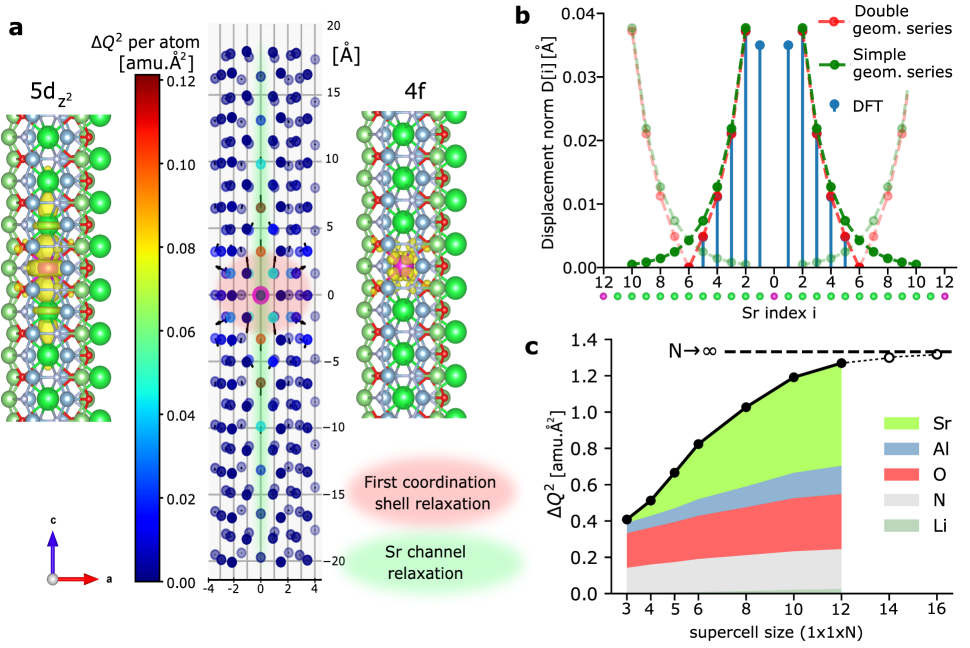
To understand the relaxation process accompanying the change in electronic density induced by the 5d-4f transition, a comparison is performed between the -state geometry (, ) and the -state geometry (, ), see Figure 3. On the left and right of Figure 3a, we present the highest occupied Kohn-Sham orbitals (norm of the wavefunctions) associated to the 4f7(8S7/2) ground and 4f6(7FJ)5d1 excited states. We can directly notice how the 5d orbital is much more spatially extended than the 4f orbital. On the middle of Figure 3a, we present the displacement field associated to the 5d-4f transition. The black vectors indicate the atomic displacements when going from excited to ground state while the color associated to each atom provides its contribution to the total normal coordinate change . A more quantitative comparison between the ground and the excited state environment is provided in Table 1.
From these results, we identify two important relaxation patterns when going from 5d to 4f state. First, we observe a nearly isotropic expansion of the first coordination shell of Eu composed of four N and four O arranged in a nearly cubic environment (red-shaded area of Figure 3a). See the comparison between Eu-N length, Eu-O length, and polyhedral volume of excited and ground states. We justify the isotropic character of this expansion with the small O-Eu-O and N-Eu-N angle changes: no significant distortion effect is observed. In reference [28], the following explanation is given to explain this expansion effect: the bond length between an f-element ion in a configuration and ligands is realized by the interaction between the shell and the ligand’s valence electrons. According to this reference, when the ion is in a configuration, additional covalent interactions appear from the ligand to the inner 4 hole that shortens the bond length. We could also argue that the excited in the configuration gets closer to configuration, leading to stronger Eu-O and Eu-N bonds, due to both Coulomb and covalent strengthening. This uncommon situation of a bond length shortening upon excitation has been already observed experimentally and studied theoretically in various other lanthanide compounds [29, 30, 18, 31, 32, 33].
Second, we observe a long-range relaxation of the strontium atoms belonging to the strontium channel containing the europium atom (see green shaded area of Figure 3a). When going from 5d to 4f state, those strontium atoms are pushed away from europium along c-axis. Comparing first the displacement magnitude of the two patterns, we observe that the displacements of the first distant Sr is slightly smaller than the O/N displacement associated to the first pattern (see supplementary Figure S10 for a visualisation of the displacement norm as a function of the distance from europium). However, what matters in the luminescent properties is the normal coordinate change (i.e. the displacement weighted by the atom masses), which explains why this second pattern is actually the dominant one, the Sr being heavier. It appears that about half of the total normal coordinate change comes from Sr displacements, see Figure 3c.
It is surprising to observe that the displacement of the first-distant Sr is slightly smaller than the second-distant Sr. We attribute this effect to the large spatial extend of the 5d orbital. Beyond the second distant Sr, the Sr displacements follow an exponential decay, as explained later.
We performed a convergence study of as a function of the supercell size (see Figure 3c and supplementary Figure S1). Increasing the number of atoms in the x-y plane ( N supercells) does not affect the result while increasing the Eu-Eu distance along c-axis does. Indeed, for too small N supercells, there is a spurious cancellation of Sr displacements caused by periodically repeated Eu. The c-component of the supercell size (or equivalently the Eu-Eu distance) required to obtain a strictly converged is very large, and instead, we model this cancellation effect by expressing the Sr displacements in [] unit as a sum of two counter-acting decreasing geometric series,
| (19) |
where i labels the Sr atoms, denotes the number of Sr atoms between two adjacent Eu, which is 11 in the case of the 1112 supercell used, and where C and A are the fitting coefficients. With A = 0.58 [/] and C = 0.037 [], the DFT displacements are well reproduced with this simple model, see red curve of Figure 3b. On this figure, plain and transparent green curves refers respectively to the first and second terms of Equation 19. Note that we excluded the first Sr because of the above-mentioned reasons. If we now consider a perfectly isolated Eu, the Sr displacements would be expressed as a simple decreasing geometric series with the same fitting coefficients A and C (plain green curve). We compute the error made as the difference between the red and green displacements. In term of normal coordinate change, this gives a difference of 0.028 [amu.], a 4.8 error with respect to the Sr contribution of the total . Indeed, these additional Sr displacements leads to small additional displacements of their atomic neighbours that we simply model with this same percentage error. In total, we estimate the strictly converged value (i.e. without finite supercell size effect) to be [amu.], 4.7 % higher than the computed DFT value. The impact on the luminescent properties of a specific channel structure along one crystallographic direction is a rarely observed effect. We still note some works on the luminescence of specific compounds with this 1D feature [34, 35]. To our knowledge however, it is the first time that such long-range channel relaxation is theoretically highlighted and analysed in phosphor materials. As it will be seen in sub-section III.3, this greatly impacts the computed luminescent properties and it might be a common denominator that explains the particular luminescent properties of this type of phosphor materials.
III.2 Electronic properties
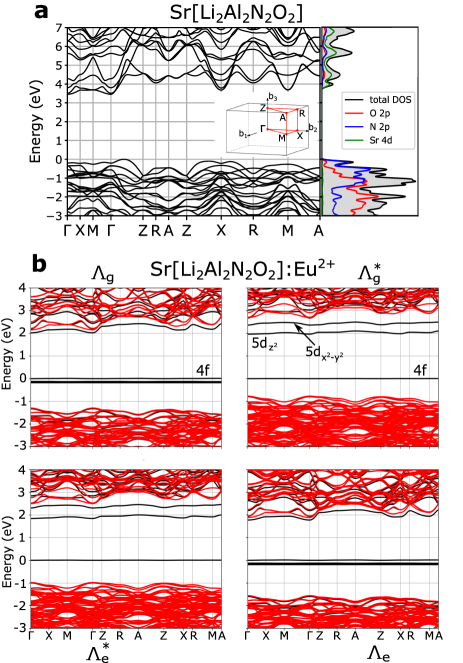
The electronic band structure and the partial density-of-states near the Fermi level of undoped SALON are presented in Figure 4a, obtained with the relaxed cell parameters. For the electronic structure over the entire energy range, see supplementary Figure S11.
The computed indirect band gap of undoped SALON is 3.44 eV, underestimating the experimental gap of 4.4 eV [6], a quite standard underestimation, often observed with local or (semi-)local exchange-correlation functionals, like the presently used GGA-PBE. Figure 4b shows the band structures of the four characteristic states of the one-dimensional coordinate model (see Figure 1) for a 115 supercell size. We find that in contrast to the emission spectrum, the electronic band structure converges faster with the supercell size. In the ground state, the seven states are correctly placed inside the band gap. In the excited state ( or ), only one state is left in the band gap. This change is a typical feature of the DFT+U approach. Then, we observe one first state, presenting mainly a character, actually a superposition of , and angular momentum components, belonging to the ag irreducible representation of the above-mentioned 2/m point group. It shows a small dispersion along the c-axis coming from a residual interaction between periodically repeated europium atoms. See supplementary Figure S2 for the dispersion evolution with the supercell size. The next higher band lying in the band gap is identified as mainly . When in the excited state, the -like hole state can also be analyzed in terms of its angular momentum components, showing a superposition of , and components, so belonging to the bu irreducible representation of the above-mentioned 2/m point group.
III.3 Luminescent properties
| (eV) | (eV) | (eV) | (eV) | ||
|---|---|---|---|---|---|
| SALON:Eu | 2.032 | 0.096 | 0.086 | 0.182 | |
| SLA:Eu 1 | 2.038 | 0.076 | 0.057 | 0.133 | |
| SLA:Eu 2 | 2.049 | 0.060 | 0.111 | 0.171 | |
| () | (meV) / (cm-1) | (meV) / (cm-1) | / | / | |
| SALON:Eu | 1.127 | 25.15 / 202.87 | 23.86 / 192.48 | 3.82 | 3.62 |
| SLA:Eu 1 | 0.756 | 33.40 / 269.39 | 29.0 / 233.90 | 2.63 | 1.71 |
| SLA:Eu 2 | 1.222 | 18.30 / 147.60 | 25.0 / 201.63 | 3.27 | 4.46 |
We compute the luminescence properties of doped SALON and report the DFT parameters required for the 1D model in Table 2. A comparison with the similar compound Sr[LiAl3N4]:Eu2+ (SLA) is provided using data from reference [13], where a similar computational methodology was used. The experimental is difficult to estimate precisely as no vibronic structure is present in the 15K-spectrum [6]. We place it in the range 2.03 - 2.08 eV. Our computed zero-phonon line energy eV falls within this range. The convergence of as a function of the supercell size can be found in supplementary Figure S3 and shows that 0.1 % convergence is achieved with respect to the 118 supercell.
Then, comparing with the 15 phosphors studied in reference [13], we notice that SALON exhibits a small Stokes shift and and a small . This indicates that the geometry of the system is not much affected by the 5d-4f transition. We observe also that the effective vibrational energies in the ground (25.15 meV) and excited state (23.86 meV) are close to each other, meaning that the curvature of the Born-Oppenheimer potential in the ground and excited state are quite similar, in contrast to SLA (see table 2).
We also note that the Huang-Rhys factor and phonon frequency are consistent with the Stokes shift. As explained in reference [36], eV should lie between eV and eV, which is the case. Finally, the semi-classical FWHM = 119 meV obtained from Equation (7) is quite close to the experimental FWHM = 135 meV at low temperature.
We now present the results from the multi-dimensional approach described in Section II. The discrete partial Huang-Rhys factors are shown in Figure 5a along with the spectral decomposition (Gaussian smearing of 4 meV). The phonon density of states is displayed in the background of this figure. See supplementary informations for related computed properties (phonon band structure, phonon frequencies at , Born effective charges and dielectric tensor).
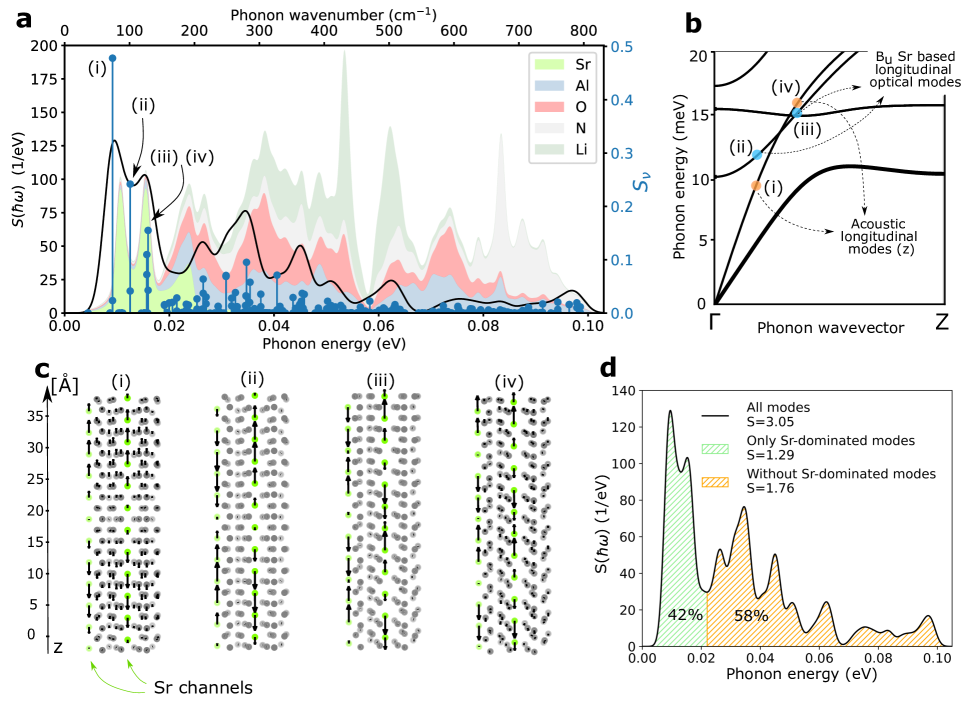
This reveals the nature of the electron-phonon coupling associated to the 5d-4f transition : At low energy ( 0.022 eV), phonon modes associated to Sr atoms dominates. This threshold is fixed such that, at 0.022 eV, Sr atoms contribute to half of the phonon density of states. It is also where a dip is observed in the spectral function. We highlight in this low-energy region the four modes presenting the highest partial Huang-Rhys factors . We present them in the phonon dispersion curve along - in Figure 5b and we show their eigendisplacements in Figure 5c where the displacements have been scaled by a factor 10 for clarity. The mode that couples the most (i) is an acoustic mode directed along z, of high wavelength. On this same phonon branch, the acoustic mode (iv) with half-wavelength also couples strongly. Mode (ii) presents a representation where strontium atoms of different channels are out of phase. Mode (iii) corresponds to the same mode but with half-wavelength. Indeed, those long-wavelength collective displacements of the Sr atoms along the c-axis couple strongly with the above-described 5d-4f relaxation of the Sr channel containing Eu.
Above 0.022 eV, the spectral decomposition is made of a multitude of modes containing Al, O and N displacements. We still notice the large peak around 0.035 eV composed of modes that couple strongly with the relaxation of the first coordination shell of Eu (expansion of the nearly cubic environment of Eu). This coupling to a large number of modes instead of one single effective “breathing” mode coincides with the results of Linderälv et al. [17] where a similar feature was found with YAG:Ce3+ phosphor. In Figure 5d, we quantify the importance of Sr-dominated phonon modes by computing their contribution to the total Huang-Rhys factor and found out that the Sr-dominated modes contributes 42% to the narrow emission in Sr[Li2Al2O2N2]:Eu2+.
For completeness, the convergence of this spectral decomposition as a function of the supercell size is presented in supplementary Figure S4 and S5. It indicates that the result is well converged for high phonon energies while the exact shape of the low energy part of , composed of modes involving Sr atoms, is not yet totally converged. By increasing the supercell size further, one would simply displace the points highlighted in Figure 5b towards on their corresponding branches. This concern reflects first the difficulty to obtain a strict convergence of the structural relaxation of the Sr channel, as described in section III.1. Second, due to the coupling to high-wavelength acoustic phonon modes, obtaining a strict convergence of the low-energy shape requires also to obtain a denser sampling of those phonons. Particular embedded methods to artificially increase the supercell size can be used to tackle this problem [16, 37]. We reserve such improvements for future work. However, we note that the integrated spectral function (i.e. ) presents a quicker convergence. In addition, this lack of strict convergence at low-energy has only a small impact on the smeared emission intensity due to the counterbalancing effect of a decreasing total Huang-Rhys factor and an increasing effective frequency (see Figure S5)
The computed effective frequency defined in Equation (13), 25.5 meV, agrees well with the effective frequency of the 1D-model, 25.15 meV, from Equation (5). This make sense since, by defining , one can show that Equation (5) is equivalent to Equation (13). The computed difference between those two values gives an estimation of the error made by using phonon modes of the undoped structure. Indeed, the first value is computed with the phonon of the undoped structure while the second is computed, within the 1D-model, with the doped structure. We believe that this effect is related to the difference in bond lengths (Sr-O/N/Sr versus Eu-O/N/Sr). This small difference reveals that the phonon modes that contributes to the electronic transitions are already present in the undoped material without the addition of the Eu doping agent. This result is in contrast to the result of Alkauskas et al. [16] in which the luminescent lineshape of diamond nitrogen-vacancy center could not be correctly described with the phonon modes of the undoped material.
The total Huang-Rhys factor is 3.05, smaller than the one-dimensional = 3.82. This difference can be explained by developing Eqs. (6) and (14). One shows, with the same definition, that is always larger than . deviates largely from when the spread of the spectral function is large, which is the case here. We will see that using the Huang-Rhys factor as computed in the more precise multi-dimensional approach leads to a luminescence intensity that better matches the experiment.
Following the generating function approach described in Section II, the emission spectral function was calculated based on the spectral decomposition (Equation (16)). The resulting curve is then convoluted with a Gaussian of fixed FWHM . The normalized luminescence intensity is finally obtained by considering the cubic frequency dependence : .
On Figure S6, we present the luminescence intensity as computed in this work at 0 K following 1D model, multi-D model without the Sr-dominated modes (only considering orange area of Figure 5d) and the full multi-D model with all modes. No shift of the zero-phonon line was considered and a small smearing was applied.
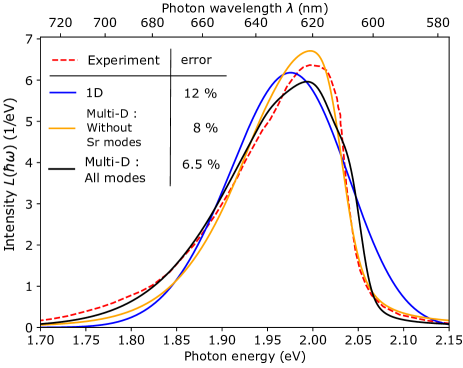
In order to compare these results with the experimental spectrum (15K) and to deal with the indeterminacy of the experimental , we proceed in the following way. For each case, we adjust the shift of the curve (modification of ) and the gaussian and lorentzian broadening parameters ( and ) to minimize the error defined as the integral of the absolute difference between the simulated and experimental curves (in energy scale), divided by two. Since all spectra are normalized such that , this ensures an error bounded to [0 - 1]. The resulting curves are presented in Figure 6.
We find that, in the 1D case, using = 92 meV, = 12 meV and a shift of 26 meV toward higher energies gives the best fit (error of 12 %). In the multi-D case without considering the Sr-dominated modes, using = 30 meV, = 75 meV, and a shift of 14 meV towards lower energies gives the best fit (error of 8 %). When using all the phonon modes in the multi-D model, using = 22 meV, = 34 meV and a shift of 14 meV toward higher energies gives the best fit (error of 6.5 %).
Indeed, the broadening parameters and used refer physically to homogeneous and inhomogeneous broadening. However, in the case of SALON phosphor, no fine vibronic structure is apparent experimentally, making the exact physical determination of these broadening parameters difficult. Here, and parameters are used as fitting parameters to match experimental emission spectrum shape. No physical conclusion should be drawn from the values of and that gives the best fit. We note first that the 1D model does not reproduce well the shape of the experimental spectrum. Indeed, it has be shown that the single mode approximation is well justified for large coupling S1 [38], which is not the case here. We have also seen that S1D overestimates the more precise Smulti-D. Moreover, the spectral decomposition is highly asymmetric around the effective frequency : an important weight on a short energy range at low energy and relatively broad distribution after 25-30 meV. This fine feature cannot be captured well by assuming only one effective mode as done in the 1D model.
We observe also that considering all the phonon modes, including the Sr-dominated modes, allows to obtain the best match with the experiment. In particular, the long tail of the spectrum is only well reproduced with the full computation. This underlies the importance of the long-range Sr displacements in shaping the emission spectrum of Sr[Li2Al2O2N2]:Eu2+. Surprisingly, the spectrum obtained without those Sr modes provides already a good estimate of the experiment. This is however fortuitous : indeed, by only considering the high-energy part of , the total Huang-Rhys factor is decreased but the effective frequency is increased. On the emission spectrum, these two effects are counter balancing each other (see Equation (7)) which explains the small difference between orange and black curve of Figure 6.
To conclude this section, we make the link between the small FWHM of the emission spectrum of SALON with its particular structure. A small FWHM is achieved by reducing at the same time the normal coordinate change and the effective frequency (see Equation (7)). In the case of SALON, the small comes from the high rigidity of the host structure. The small effective frequency, on the other hand, comes from the large coupling of the Sr channel relaxation with low-frequency phonon modes involving these channels. We believe that those features are not specific to SALON but are also valid for other UCr4C4 type phosphors that present a rigid host structure and this peculiar Ca/Sr/Ba channel.
IV Conclusions
In the present work, we characterize the newly discovered narrow-band emission Sr[Li2Al2O2N2]:Eu2+ red phosphor from first principles. Experimental structural parameters are reproduced within 1 % error for undoped SALON. We analyze the structural change of the system upon emission. Two relaxation patterns are distinguished : a nearly isotropic expansion of the cuboid environment of Eu2+ composed of 4 oxygen and 4 nitrogen, with small distortion and a long-range relaxation of the strontium atoms belonging to the strontium channels along c-axis. At the level of the electronic structure, the SCF method is able to correctly place the 4f and 5d states in the band gap. The lowest 5d state is identified as presenting a 5d character and shows a large spatial delocalization along the Sr channel. Concerning the luminescent properties, we show that SALON presents a small effective displacement between excited and ground state. By projecting the atomic displacements induced by 4f-5d transition onto the phonon eigenvectors, we identify the phonon modes that couples the most with the transition. This spectral decomposition is dominated by a coupling to low-frequency acoustic and modes involving long-wavelength displacement of these Sr channels, which lowers the effective vibrational frequency. The high-frequency part of this decomposition originates from the coupling to a large number of modes involving O, N and Al. This contradicts the initial guess of Hoerder et al. [6] that argued that the isotropic structural relaxation, coming from the high symmetry environment of Eu2+, reduces the number of different vibrational states involved in the emission process. Overall, we computed a total Huang-Rhys parameter of . This small coupling, in combination with a moderate effective frequency, yields a small band width.
Finally, we compute the luminescence intensity spectrum based on this phonon decomposition and compare it with the spectrum obtained with the simpler one-dimensional approach. With respect to experiment, we conclude that the multi-D approach is twice as accurate as the 1D approach. In particular, the tail of the spectrum is very well described within the multi-D approach.
These results are important in two aspects. First, they directly provide a theoretical understanding of the observed experimental spectrum. In particular, we highlighted the importance of the Sr channel oriented along c-axis. The spectrum of other UCr4C4-type phosphors that present similar Ca/Sr/Ba channel might be similarly affected. Second, the success of the methodology used provides confidence in its potential applicability in the theoretical study of other important phosphors and their luminescent intensity spectra. It could be for instance interesting to apply this multi-dimensional approach to a low-temperature phosphor emission spectrum that still presents an apparent vibronic fine structure, allowing a further validation of the computational methodology.
V Computational method
V.1 DFT parameters
Calculations are performed using density-functional theory (DFT) using ABINIT [39]. Core electrons are treated with the PAW method [40]. The generalized gradient approximation (GGA-PBE) is used to treat exchange-correlation effects [41] and a Hubbard U term (U=7 eV) is added on states of europium, in line with the value used in a study of fifteen Eu-doped materials based on the same PAW atomic dataset [13], thus allowing the consistent comparison with these results.
Calculations on europium-doped SALON are conducted with a supercell technique. Most results shown in this manuscript are computed with a 1112 supercell composed of 216 atoms. Since there are 24 Sr atoms in this supercell, this corresponds to a theoretical doping concentration of 4.16% while the experimental one is 0.7%. Still, since our methodology does not account for concentration-dependent effects such as self-absorption or energy transfer, our only concern is the spurious interaction between Europium periodic replica, that should be numerically controlled. To this aim, we performed a careful convergence study of our main results with respect to the supercell size, that can be found in the supplementary material. Because of the anisotropy of the material (tetragonal structure), we checked both an increase of the size in the x-y plane and an increase along z axis. It appears that the critical parameter to converge is the long range structural relaxation of the strontium atoms along z-axis, explaining the particular elongated shape of our supercell.
For all supercell calculations, the structures are relaxed below a maximal residual force of Hartree/Bohr. The cut-off kinetic energy is 30 Ha and a 222 wavevector grid is used. Phonons are calculated for the undoped structures at the point.
Although spin-orbit coupling can present a noticeable effect on the excited state electronic configuration, it is not considered here due to its small effect on the emission spectra. This work focuses on the lowest excited state of the multiplet (, J = 0-6) splitting and does not try to account for the other states.
V.2 Simulating the Eu 5d excited state
The treatment of the Eu excited state and the resulting Eu electron - hole interaction might rely on the Bethe-Salpeter equation [42] but this would be too computationally demanding for such supercell system. For this reason, we rely on the SCF method whereby the eigenfunction associated to the highest Eu state is forced to be unoccupied while the next energy state (identified as a state) is constrained to be occupied. Transition energies are then computed as difference of two total energies. The electron-hole interaction is here mimicked through the promotion of the Eu 4 electron to the Eu 5 state. By doing that, the seven levels split into one unoccupied band that stays within the gap, and six occupied bands that shift downwards, hybridizing inside the valence band [13].
We suppose that the 4f-5d transition only affects the local geometry of the crystal and not the macroscopic state of the crystal, meaning that the lattice parameters of the crystal will not change. Thus, atomic relaxation in the excited state is done at fixed lattice parameters obtained in the ground state.
Additional details on the SCF method are given in supplementary informations.
Acknowledgements
We thank a referee for a remark about the convergence study, that lead us to reconsider the domination of the cuboid distortion in the spectral function. Computational resources have been provided by the CISM/UCLouvain and the CECI funded by the FRS-FNRS Belgium under Grant No. 2.5020.11, as well as the Tier-1 supercomputer of the Fédération Wallonie-Bruxelles, infrastructure funded by the Walloon Region under the grant agreement No. 1117545. J.B. acknowledges support from the Communauté française de Belgique through the SURFASCOPE project (ARC 19/24-057). Y.J. has been supported by the FRS-FNRS Belgium through a Chargé de recherches fellowship. S.P. acknowledge support from the European Unions Horizon 2020 Research and Innovation Programme, under the Marie Skłodowska-Curie Grant Agreement SELPH2D No. 839217.
References
- [1] M. Pattison, M. Hansen, N. Bardsley, C. Elliott, K. Lee, L. Pattison, J. Tsao, 2019 Lighting R&D opportunities, Technical report, SSLS, Inc., 2020.
- [2] Z. Xia, Q. Liu, Prog. Mater. Sci. 2016, 84 59.
- [3] Y.-C. Lin, M. Karlsson, M. Bettinelli, In Photoluminescent Materials and Electroluminescent Devices, 309–355. Springer, 2017.
- [4] P. Pust, P. J. Schmidt, W. Schnick, Nat. Mater. 2015, 14, 5 454.
- [5] C. C. Lin, A. Meijerink, R.-S. Liu, J. Phys. Chem. Lett. 2016, 7, 3 495.
- [6] G. J. Hoerder, M. Seibald, D. Baumann, T. Schröder, S. Peschke, P. C. Schmid, T. Tyborski, P. Pust, I. Stoll, M. Bergler, C. Patzig, S. Reißaus, M. Krause, L. Berthold, T. Höche, D. Johrendt, H. Huppertz, Nat. Commun. 2019, 10, 1 1.
- [7] P. Pust, V. Weiler, C. Hecht, A. Tücks, A. S. Wochnik, A.-K. Henß, D. Wiechert, C. Scheu, P. J. Schmidt, W. Schnick, Nat. Mater. 2014, 13, 9 891.
- [8] M.-H. Fang, J. L. Leaño, R.-S. Liu, ACS Energy Lett. 2018, 3 2573.
- [9] M.-H. Fang, C. O. M. Mariano, P.-Y. Chen, S.-F. Hu, R.-S. Liu, Chem. Mater. 2020, 32, 5 1748.
- [10] A. Canning, R. Boutchko, M. Weber, N. Grønbech-Jensen, S. Derenzo, J. Appl. Phys. 2011, 109, 8 083708.
- [11] A. Chaudhry, R. Boutchko, S. Chourou, G. Zhang, N. Grønbech-Jensen, A. Canning, Phys. Rev. B 2014, 89, 15 155105.
- [12] Y. Jia, A. Miglio, S. Poncé, X. Gonze, M. Mikami, Phys. Rev. B 2016, 93, 15 155111.
- [13] Y. Jia, A. Miglio, S. Poncé, M. Mikami, X. Gonze, Phys. Rev. B 2017, 96, 12 125132.
- [14] X. Gonze, C. Lee, Phys. Rev. B 1997, 55, 16 10355.
- [15] S. Baroni, S. De Gironcoli, A. Dal Corso, P. Giannozzi, Rev. Mod. Phys. 2001, 73, 2 515.
- [16] A. Alkauskas, B. B. Buckley, D. D. Awschalom, C. G. Van de Walle, New J. Phys. 2014, 16, 7 073026.
- [17] C. Linderalv, D. Aberg, P. Erhart, Chem. Mater. 2020, 33, 1 73.
- [18] P. A. Tanner, C. S. Mak, N. M. Edelstein, K. M. Murdoch, G. Liu, J. Huang, L. Seijo, Z. Barandiarán, Journal of the American Chemical Society 2003, 125, 43 13225.
- [19] V. Bachmann, C. Ronda, A. Meijerink, Chemistry of Materials 2009, 21, 10 2077.
- [20] N. Kunkel, A. Meijerink, H. Kohlmann, Physical Chemistry Chemical Physics 2014, 16, 10 4807.
- [21] G. Lefevre, A. Herfurth, H. Kohlmann, A. Sayede, T. Wylezich, S. Welinski, P. Duarte Vaz, S. F. Parker, J. F. Blach, P. Goldner, et al., The Journal of Physical Chemistry C 2018, 122, 19 10501.
- [22] Y. Jia, S. Poncé, A. Miglio, M. Mikami, X. Gonze, Phys. Rev. B 2019, 100 155109.
- [23] B. Henderson, G. F. Imbusch, Optical spectroscopy of inorganic solids, volume 44, Oxford University Press, 2006.
- [24] T. Miyakawa, D. Dexter, Phys. Rev. B 1970, 1, 7 2961.
- [25] M. Zhao, H. Liao, L. Ning, Q. Zhang, Q. Liu, Z. Xia, Adv. Mater. 2018, 30, 38 1802489.
- [26] H. Liao, M. Zhao, M. S. Molokeev, Q. Liu, Z. Xia, Angew. Chem. 2018, 130, 36 11902.
- [27] R. D. Shannon, Acta Crystallogr., Sect. A: Cryst. Phys., Diffr., Theor. Gen. Crystallogr. 1976, 32, 5 751.
- [28] J. J. Joos, P. F. Smet, L. Seijo, Z. Barandiaran, Inorg. Chem. Front. 2020, 7 871.
- [29] A. Meijerink, G. Blasse, Journal of luminescence 1989, 43, 5 283.
- [30] Z. Barandiarán, L. Seijo, The Journal of chemical physics 2003, 119, 7 3785.
- [31] S. Mahlik, M. Grinberg, L. Shi, H. J. Seo, Journal of Physics: Condensed Matter 2009, 21, 23 235603.
- [32] S. Mahlik, K. Wiśniewski, M. Grinberg, R. Meltzer, Journal of Physics: Condensed Matter 2009, 21, 24 245601.
- [33] M. de Jong, D. Biner, K. W. Kramer, Z. Barandiarán, L. Seijo, A. Meijerink, The journal of physical chemistry letters 2016, 7, 14 2730.
- [34] H. Ramanantoanina, F. Cimpoesu, C. Gottel, M. Sahnoun, B. Herden, M. Suta, C. Wickleder, W. Urland, C. Daul, Inorganic chemistry 2015, 54, 17 8319.
- [35] M. Schöneborn, R. Glaum, Zeitschrift für anorganische und allgemeine Chemie 2007, 633, 15 2568.
- [36] M. de Jong, L. Seijo, A. Meijerink, F. T. Rabouw, Phys. Chem. Chem. Phys. 2015, 17, 26 16959.
- [37] L. Razinkovas, M. W. Doherty, N. B. Manson, C. G. Van de Walle, A. Alkauskas, arXiv preprint arXiv:2012.04320 2020.
- [38] A. Alkauskas, M. D. McCluskey, C. G. Van de Walle, J. Appl. Phys. 2016, 119, 18 181101.
- [39] X. Gonze, J. M. Beuken, R. Caracas, F. Detraux, M. Fuchs, G. M. Rignanese, L. Sindic, M. Verstraete, G. Zerah, F. Jollet, M. Torrent, A. Roy, M. Mikami, P. Ghosez, J. Y. Raty, D. C. Allan, Comput. Mater. Sci. 2002, 25 478 .
- [40] M. Torrent, F. Jollet, F. Bottin, G. Zérah, X. Gonze, Comput. Mater. Sci. 2008, 42, 2 337.
- [41] J. P. Perdew, K. Burke, M. Ernzerhof, Phys. Rev. Lett. 1996, 77, 18 3865.
- [42] G. Onida, L. Reining, A. Rubio, Rev. Mod. Phys. 2002, 74, 2 601.