A novel black-hole mass scaling relation based on Coronal lines and supported by accretion predictions
Abstract
Getting insights on the shape and nature of the ionizing continuum in astronomical objects is often done via indirect methods as high energy photons are absorbed by our Galaxy. This work explores the ionization continuum of active galactic nuclei (AGN) using the ubiquitous coronal lines. Using bona-fide BH mass estimates from reverberation mapping and the line ratio [Si vi] 1.963/Br as tracer of the AGN ionizing continuum, a novel BH-mass scaling relation of the form log( log ([Si vi]/Br, over the BH mass interval, M⊙ with dispersion 0.47 dex is found. Following on the thin accretion disc approximation and after surveying a basic parameter space for coronal lines (CL) production, we believe that a key parameter driving this anti-correlation is the effective temperature of the accretion disc, this being effectively sampled by the coronal line gas. Accordingly, the observed anti-correlation becomes formally in line with the thin accretion disc prediction .
1 Introduction
The ionizing continuum of active galactic nuclei (AGN) is for most cases a non-direct observable as high energy photons, namely in the 10 eV – 400 eV range, are absorbed by neutral HI of our Galaxy. These photons are however responsible for 99% of all emission lines observed in the ultraviolet (UV), optical and near-infrared spectrum.
It is often assumed that the bulk of this energy is produced in the atmosphere of a geometrically thin, optically thick accretion disc (AD) around a supermassive black hole (Lynden-Bell, 1969; Shakura & Sunyaev, 1973; Shields, 1978). Observations of quasars and photoionization equilibrium models suggest the ionizing continuum to peak in the UV, its shape being close to a black-body spectrum whose peak temperature is taken as the disc’s effective temperature as it is around this temperature that most of the energy is radiated (e.g. Frank et al., 2002). Still, the diversity of AGN line spectra can equally be reproduced by an otherwise UV power-law spectrum, or combination of power laws, to account for the ionizing continuum (Davidson & Netzer, 1979; Ferland & Osterbrock, 1986; Ferland et al., 2020).
Photoionization models are the common tool to infer on the shape and nature of the ionizing continuum. Yet, observations restrict in most cases their use to the brightest emission lines from the UV to the near-IR, which probe only the energy range between 12 to 54 eV. Because of their high ionization potential (IP) above 100 eV, coronal lines (CL) are optimal features to map the shape of the ionizing continuum above the eV threshold (Binette et al., 1996; Ferguson et al., 1997; Prieto & Viegas, 2000; Contini et al., 2002, and references therein). CL spread over the X-rays, optical and IR spectrum. Although often fainter than the classical medium-ionzation lines used for photoionization diagnosis, high angular resolution in nearby AGN has delivered extremely high signal-to-noise measurements of CLs in the optical, and particularly in the near-IR where are often the most conspicuous features (e.g. Reunanen et al., 2003; Prieto et al., 2005; Müller-Sánchez et al., 2011; Rodríguez-Ardila et al., 2017).
Here, we make use of a set of accurate measurements of optical and near-IR CL to examine the shape of the ionizing continuum in the 100 - 400 eV range, and in turn, to test the accretion theory prediction on the dependence of the black hole (BH) mass with the effective temperature of the accretion disc , as . Following accretion theory, for similar accretion rates, high BH masses are expected to have discs with a larger inner radius, and thus become cooler, i.e. be characterised by a lower effective temperature , than their lower mass counterparts. Accordingly, discs of BH mass of M⊙ are expected to peak in the extreme UV, which would correspond to what is often referred to as the Big Blue Bump (BBB, Czerny & Elvis, 1987) - e.g in 3C 273 this is 10 eV (Prieto et al., 2010) - whereas those of lower BH mass, M⊙ are expected to peak towards higher energies 100 eV (e.g. Frank et al., 2002; Cann et al., 2018). The change in the disc temperature across this BH mass interval is at most a factor seven (see below).
The work presents a novel approach to estimate BH masses as a function of specific coronal lines normalised to H broad line emission, so far for Type I AGN only. Possible explanation for the observed BH mass - CL relations are examined in the context of the predicted dependence between accretion disc temperature and BH mass.
2 Data selection
Objects in this work are selected by having BH masses determined by reverberation mapping and single epoch optical and/or near-IR spectra with accurate CL measurements. The first criterion restricts the sample to Type I sources only. The second avoids variability issues. Although we give preference to sources with both optical and near-IR spectra available, this final criterion could not always be fulfilled.
The CL used are [Fe vii] 6087 Å in the optical and [S viii] 0.991 m, [Si x] 1.432 m and [Si vi] 1.964 m in the near-IR. They are among the strongest CL in AGN (Reunanen et al., 2003; Rodríguez-Ardila et al., 2011; Lamperti et al., 2017) and span a wide IP range, 100 - 351 eV. In addition, H 1 lines of H, Pa and Br are employed. The whole set samples the ionizing continuum over the 13.6 - 351 eV range. Near-IR CL were preferred because of their reduced extinction. Optical CL [Fe vii] was also selected because of its strength, still moderate extinction, and IP close to that of [Si vi].
The final working sample of objects has 31 AGN (Table 1). For a subsample, the pertinent optical and near-IR line are presented in this work for the first time. For all other sources, line ratios or spectra already described in other publications were employed (see below). BH masses are from Bentz & Katz (2015) compilation.
2.1 Optical Spectroscopy
Optical spectra were taken from a variety of sources, as indicated in the last column of Table 1. In more than half of the sample, spectra from the Sloan Digital Sky Survey (SDSS) data release 7 (Abazajian et al., 2009) were employed. SDSS delivers fully wavelength and flux calibrated spectra. Therefore, data reduction for these objects will not be discussed here. Similarly, archival flux-calibrated spectra for Ark 564 taken by the Faint Object Spectrograph (FOS) on-board the Hubble Space Telescope (HST) were employed. Details of observations and reduction of this target will not be addressed here. NGC 4051 employs archival spectroscopy available from the Nasa Extragalactic Database (NED). Details of that observation can be found in Moustakas & Kennicutt (2006). Mrk 335 was observed using the 2.15 m telescope at the Complejo Astronómico El Leoncito (CASLEO). Details of the observations and data reduction can be found in Rodríguez-Ardila et al. (2002). Spectra for Fairall 9, NGC 4151, and Mrk 509 were extracted from the AGN Watch Project111http://www.astronomy.ohio-state.edu/ agnwatch/. These data is fully reduced and details of that procedure can be found elwhere.
The second major source of optical data is the 4.1 m Southern Observatory for Astrophysical Research (SOAR) Telescope at Cerro Pachon, Chile. The observations were carried out using the Goodman Spectrograph (Clemens et al., 2004), equipped with a 600 l/mm grating and a 0.8 arcsec slit width, giving a resolution R1500. In addition to the science frames, standard stars (Baldwin & Stone, 1984) were observed for flux calibration. HgAr arc lamps were taken after the science frames for wavelength calibration. Daytime calibrations include bias and flat field images.
The data were reduced using standard iraf tasks. It includes subtraction of the bias level and division of the science and flux standard star frames by a normalized master flat-field image. Thereafter, the spectra were wavelength calibrated by applying the dispersion solution obtained from the arc lamp frames. Finally, the spectra of standard stars were extracted and combined to derived the sensitivity function, later applied to the 1D science spectra. The final products are wavelength and flux calibrated optical spectra.
2.2 NIR Spectroscopy
Most of the NIR emission line flux ratios employed in this work were extracted from Riffel et al. (2006). For targets not reported in that publication, observations were obtained using either The Gemini Near-Infrared Spectrograph (GNIRS) attached to the Gemini North Telescope or the the ARCOiRIS spectrograph, mounted on either Blanco or SOAR Telescopes. Note that ARCOiRIS was installed on Blanco since 2017 and up to 2019, when it was then moved to SOAR with no modifications regarding their setup. Below we describe the observations and data reduction procedures, noting that no distinction between Blanco and SOAR is made. Both data collection and treatment is made employing the same observing strategy and reduction pipelines.
2.2.1 ARCOiRIS Blanco/SOAR data
NIR spectra of Fairall 9, 3C 120, Mrk 707, NGC 3783, Mrk 1310, NGC 841, NGC 6814 and NGC 7469 were obtained using the ARCoIRIS spectrograph attached to either the 4 m Blanco Telescope or the Southern Observatory for Astrophysical Research 4.1 m telescope atop Cerro Pachón, Chile. The science detector employed is a 2048 2048 Hawaii-2RG HgCdTe array with a sampling of 0.41 arcsec/pixel. The slit assembly is 1.1 arcsec wide and 28 arcsec long. The delivered spectral resolution R is 3500 across the six science orders. Observations were done nodding in two positions along the slit. Right before or after the science target, a telluric star, close in airmass to the former, was observed to remove telluric features and to perform the flux calibration. CuHgAr frames were also observed at the same position as the galaxies for wavelength calibration.
The spectral reduction, extraction and wavelength calibration procedures were performed using spextool v4.1, an IDL-based software developed and provided by the SpeX team (Cushing et al., 2004) with some modifications specifically designed for the data format and characteristics of ARCoIRIS, written by Dr. Katelyn Allers (private communication). Telluric features removal and flux calibration were done using xtellcor (Vacca et al., 2003). The different orders were merged into a single 1D spectrum from 1 to 2.4 m using the xmergeorders routine. We then corrected these data for Galactic extinction using the Cardelli et al. (1989) law and the extinction maps of Schlafly & Finkbeiner (2011).
2.2.2 GNIRS/Gemini spectroscopy
Near-infrared spectra of NGC 4395 and Ark 564 were collected using The Gemini Near-IR spectrograph (GNIRS, Elias et al., 2006) in the cross-dispersed mode. It allows simultaneous z+J, H and K band observations, covering the spectral range 0.8 2.5m in a single exposure. GNIRS science detector consist of an ALADDIN 1k 1k InSb array. The instrument setup includes a 32 l/mm grating and a 0.8 arcsec slit, giving a spectral resolution of R1300 (or 320 km s-1 FWHM). Individual exposures were taken, nodding the source in a ABBA pattern along the slit. Right after the observation of the science frames, an A0V star was observed at a similar airmass, with the purpose of flux calibration and telluric correction.
The NIR data were reduced using the XDGNIRS pipeline (v2.0)222Based on the Gemini IRAF packages, which delivers a full reduced, wavelength and flux calibrated, 1D spectrum with all orders combined (Mason et al., 2015). Briefly, the pipeline cleans the 2D images from radiative events and prepares a master flat constructed from quartz IR lamps to remove pixel to pixel variation. Thereafter, the s-distortion solution is obtained from daytime pinholes flats and applied to the science and telluric images to rectify them. Argon lamp images are then used to find the wavelength dispersion solution, followed by the extraction of 1D spectra from the combined individual exposures. The telluric features from the science spectrum are removed using the spectrum of a A0V star. Finally, the flux calibration is achieved assuming a black body shape for the standard star (Pecaut & Mamajek, 2013) scaled to its -band magnitude (Skrutskie et al., 2006). The different orders are combined in to a single 1D spectrum and corrected for Galactic extinction using the Cardelli et al. (1989) law and the extinction maps of Schlafly & Finkbeiner (2011).
The final reduced NIR spectra in the regions of interest to this work are shown in Fig. 6.
In order to measure the flux of the lines for the subsample of objects described above, we modelled the observed profiles with a suitable function that best represents them and then integrated the flux under that function. To this purpose we employ the liner routine (Pogge & Owen 1993). This software performs a least-square fit of a model line profile (Gaussian, Lorentzian, or Voight functions) to a given line or set of blended lines to determine the flux, peak position and FWHM of the individual components. Typically, one or two Gaussian components were necessary to represent the coronal lines. For the permitted lines of H i a broad component associated to the BLR was employed. In this process, the underlying continuum emission was approximated by a linear fit.
For the optical part, the measurement of the H flux was preceded by the removal of the underlying power-law continuum and the pseudo-continuum produced by the Fe ii lines that contaminates H. This was done following the prescription of Boroson & Green (1992).
Table 1 shows the measured optical emission line flux ratio between [Fe vii] 6087 and the broad component of H (column 3) and the NIR ratios for [Si vi] 1.964 m/Br (column 4), [Si x] 1.431 m/Pa (column 5), and [S viii] 0.9914 m/Pa (column 6). For the latter three ratios, the flux associated to the broad component of the Brackett and Paschen line were employed. Table 2 in the Appendix list the flux of the broad components of H, Pa and Br for the AGN with available NIR data. Note that because the optical and NIR spectra were taken on different dates and in most cases, different telescopes, the intrinsic line ratios H/Pa and H/Br largely depart from their theoretical value. This, however, does not affect our results as we do not employ in our analysis line ratios between the two spectral regions.
| Galaxy | log | [Fe vii]/H | [Si vi]/Br | [Si x]/Pa | [S viii]/Pa | Data Source |
|---|---|---|---|---|---|---|
| Mrk 335 | 7.230.04 | 0.0480.005 | 0.40 | 0.040.01 | 0.0220.006 | 6 |
| Fairall9 | 8.290.09 | 0.0380.003 | 0.11 | 0.080.01 | 0.040.01 | 5,10 |
| NGC 863 | 7.570.06 | … | 0.240.07 | … | … | 6 |
| 3C 120 | 7.740.04 | … | 0.33 | 0.080.02 | 0.030.01 | 5 |
| Mrk 707 | 6.500.10a | 0.0250.002 | 0.38 | … | … | 5,7 |
| Mrk 110 | 7.290.10 | 0.050.002 | … | … | … | 7 |
| NGC 3227 | 6.780.10 | … | 0.750.20 | … | 0.0120.004 | 3 |
| Mrk 142 | 6.290.10 | 0.020.004 | … | … | … | 7 |
| SBS 1116+583A | 6.560.09 | 0.010.002 | … | … | … | 7 |
| PG 1126-041 | 8.08b | … | 0.280.02 | 0.040.01 | 0.0250.002 | 3 |
| NGC 3783 | 7.370.08 | 0.050.002 | 0.42 | 0.050.01 | 0.0230.003 | 5 |
| Mrk 1310 | 6.210.08 | 0.030.002 | 0.57 | 0.060.01 | 0.060.01 | 5 |
| NGC 4051 | 6.130.12 | 0.1250.01 | 0.960.11 | 0.330.02 | 0.2050.030 | 3,9 |
| NGC 4151 | 7.550.05 | 0.020.001 | 0.510.05 | 0.050.01 | 0.0570.003 | 3,10 |
| Mrk 202 | 6.130.17 | 0.020.002 | … | … | … | 7 |
| Mrk 766 | 6.820.05 | 0.030.002d | 0.780.10 | 0.050.01 | 0.0450.002 | 3 |
| Mrk 50 | 7.420.06 | 0.0050.001 | … | … | … | 7 |
| NGC 4395 | 5.450.13 | 0.090.005 | 1.18 | 0.020.01 | 0.0530.006 | 7,8 |
| Mrk 771 | 7.760.20 | 0.030.002 | … | … | … | 7 |
| NGC 4748 | 6.410.11 | … | 0.930.06 | 0.060.02 | 0.1370.042 | 3 |
| PG 1307+085 | 8.540.13 | 0.010.002 | … | … | … | 7 |
| MGC-6-30-15 | 6.600.12 | 0.0170.002 | … | … | … | 5 |
| NGC 5548 | 7.720.02 | 0.040.003 | 0.610.09 | 0.110.01 | 0.1220.011 | 3,7 |
| PG1448+273 | 6.970.08 | … | 0.570.11 | … | … | 3 |
| Mrk 290 | 7.280.02 | 0.020.002 | … | … | … | 7 |
| Mrk 841 | 8.10c | 0.0080.002 | 0.20 | 0.020.01 | 0.0240.002 | 5 |
| 3C 390.3 | 8.640.04 | 0.020.001 | … | … | … | 7 |
| NGC 6814 | 7.040.06 | … | 0.13 | … | … | 5 |
| Mrk 509 | 8.050.04 | … | 0.170.02 | … | … | 3,10 |
| Ark 564 | 6.590.17 | 0.060.007 | 1.080.10 | 0.300.01 | 0.1010.006 | 8,11 |
| NGC 7469 | 6.960.05 | 0.020.001 | 0.600.05 | 0.070.01 | 0.0370.006 | 5 |
1. Masses are from Bentz & Katz (2015) unless stated otherwise; (a) – Park et al. (2017); (b) – Dasyra et al. (2007); (c) – Woo & Urry (2002). 2. This optical emission line flux ratio was determined in this work unless otherwise stated. In all cases, the flux of the CL is normalized to the flux of the broad component of the H i line. (d) – Rodríguez-Ardila et al. (2005). 3. NIR emission line flux ratios from Riffel et al. (2006) except when indicated. 4 – This work. 5. – SOAR; 6 – CASLEO; 7 – SDSS; 8 – Gemini; 9 – NED; 10 – AGN Watch; 11 – HST.
3 Coronal line diagnostic diagrams
The dependence between the effective temperature of the disc and BH mass predicted by accretion theory (cf. Frank et al., 2002) is investigated below using the CL emission as a proxy for the disc temperature. The approach was recently explored with photoionization simulations by Cann et al. (2018) who show that for intermediate to low BH mass sources ( M⊙), lines of high IP are favoured with respect to those of lower IP. Here, we expand the photoionization study to the high BH mass range, M⊙, and confront predictions with observations.
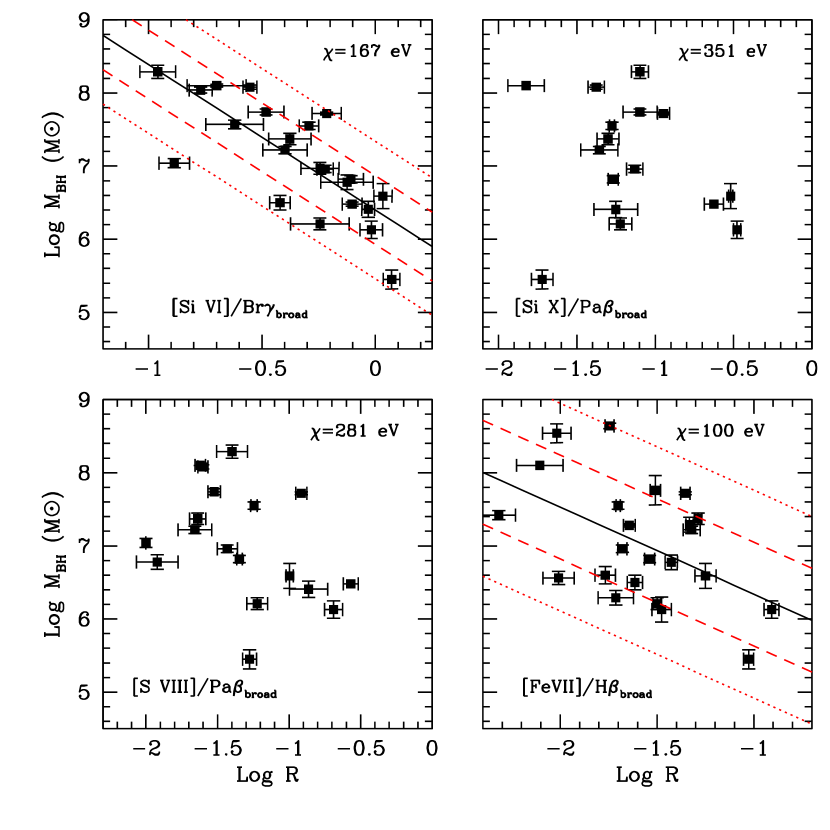
Fig. 1 presents new diagnostic diagrams in which the BH mass for each object (see Column 2 of Table 1) in the sample is plotted against a specific CL flux normalised to the closest in wavelength H I broad emission. The first diagram in Fig. 1-upper left panel, involving [Si vi] 1.9641 m/Br, IP [Si vi] = 167 eV, shows a clear linear trend between this ratio and over almost three orders of magnitude in BH mass. A linear regression yields log( log ([Si vi]/Br, and dispersion 0.47 dex (1 sigma) in BH mass. The regression was carried out using the LtsFit package333http://www-astro.physics.ox.ac.uk/mxc/software/lts (Cappellari et al., 2013), which accounts for the errors in all variables. The Pearson correlation coefficient is = -0.76, with a null probability of Pr = 3.8.
A weak trend for the ratio involving [Fe vii] (r=-0.5), and no trend for the IR CL with IP 260 eV, are found. The correlation index for [S viii]/Pa is = -0.44, that for [Si x]/Pa, is = -0.3.
In doing these diagrams, attention is paid to the following issues: line ratios are close in wavelength to minimize reddening; the bulk of CL is produced at the inner parsecs and is of photoionisation origin (e.g. Prieto & Viegas, 2000; Prieto et al., 2002; Müller-Sánchez et al., 2011; Rodríguez-Ardila et al., 2006), therefore the choice of normalization to H i broad is aimed at producing a most genuine tracer of the conditions next to the accretion disc; the CL high critical density, cm-3 warrants its survival in the inner high density environment of AGN.
The CL in the diagrams, though, are sensitive to different energy ranges of the ionizing continuum. This is illustrated in Fig 2, which shows a common used parametrization of an AGN ionizing continuum by a Shakura-Sunyaev (SS) accretion disc (Shakura & Sunyaev, 1973) that accounts for the big blue bump, and a combination of power-laws to account for the high energy range (e.g. Osterbrock & Ferland, 2006; Panda et al., 2018).
| (1) |
The first term is the parametrization of a SS disc, represented by an exponential cutoff at the disc effective temperature, , and a power law with =-0.33 accounting for the low energy tail of the disc. The low energy limit to the disk is set by the secondary IR-exponential cutoff at 0.01 Ryd. The high energies are represented by a broken power law, = -1 and a high high-energy cutoff at 100 keV.
The IP of the lines used in this work are marked on the ionizing continuum in Fig. 2. They sample the bulk of the ionizing spectrum over the 13.6 - 351 eV energy range. The figure shows different ionizing continua for different and BH spin (see Sec. 4). The increase in and spin leads to a progressive shift of the disc emission peak towards higher energies. It can be observed that only when spin is considered, the accretion disc samples adequately the required high energies to produced these CL.
4 Coronal emission as diagnostic of accretion disc temperature
If CL are photoionized by the accretion disc, following accretion predictions, a trend between CL strength and BH mass may be expected specifically for those lines whose IP get relatively close to the disc peak emission (Fig. 2), i.e. a potential correlation between CL strength and the disc effective temperature, is foreseen. This possibility is investigated below.
Following on the thin disc approximation, for a Schwarzschild BH can be approximated as e.g. (Lynden-Bell, 1969; Frank et al., 2002):
| (2) |
where, is the BH mass, is the accretion rate in Eddington units, is the BH radiation efficiency, is the inner-most stable circular orbit for a non-rotating black hole in terms of the gravitational radius (G is the gravitational constant, c is the velocity of light). The equation is normalised to the average parameters characterizing the objects in the sample: average of 108 M⊙, average accretion rate 0.1 , and accretion efficiency of 6%.
When a non-zero BH spin is assumed, a more realistic approach is obtained given the mounting evidence for spinning BHs (see Lynden-Bell, 1969; Campitiello et al., 2018; Reynolds, 2019, and references therein). The inner-most stable orbit becomes smaller and increases accordingly. In the case of co-rotation, the disc temperature reaches the highest values. Assuming a conservative spin of 10%, (hereafter a= 0.1) and co-rotation yields . Keeping the other parameters the same as above, and rounding to - we get
| (3) |
For the range of BH masses in this work , and spin a = 0.1, gets in the range of a few K, decreasing with increasing BH mass. For higher spin, e.g. = 0.5, increases by factor of two.
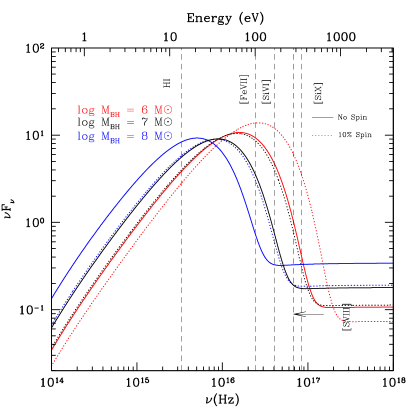
Fig. 2 compares the ionizing continuum for the cases of non-spinning and spin . It can be seen that only in the case of spinning BH the disc peak temperature moves close to the IP energies of [Si vi] and [Fe vii]. Yet, for the range of BH mass considered, the accretion disc energies fall short from those required to account for [Si x] and [S viii] lines. For the case of non-rotating BH, disc photons become overall less energetic for all the CLs.
On the above premises, for the range of BH masses in this work, a trend between and the excitation state of [Si vi] or [Fe vii] lines may be expected, whereas no trend involving the higher IP lines [Si x] or [S viii] is foreseen. For the latter, they are however expected to be good proxies of the disc temperature for BH mass below 106 M⊙, as inferred from Cann et al. (2018) simulations. We believe this prediction may be at the root of the observed [Si vi] / Br – correlation, and of the lack of any relation with the higher IP lines [S viii] or [Si x] (Fig. 1). We test this hypothesis over the next subsection.
We note, however, that for the [Fe vii] line, a weak trend with BH mass is observed, (Fig. 1), even though and have similar IP. We believe the causes are that [Fe vii] / H is subjected to the large variability exhibited by H - variability studies in the near-IR indicate the Paschen and Brackett lines being less variable (Landt et al., 2011) - and the inherent uncertainty in the measurement of broad H, affected by a stronger underlying power-law continuum and the Fe ii pseudo-continuum.
Fig. 2 also suggests a dependence as well with lower IP lines, e.g [O iii] 5007 (IP = 35 eV). However the observational evidence for such trend would in general be elusive as intermediate to low ionization lines, being formed at larger radii from the center, are subjected to additional formation mechanisms as star formation and shocks.
4.1 Coronal Line emission as diagnostic of the disc temperature
To probe the CL emission as a proxy of the disc temperature, we make use of the photoionization code CLOUDY (Ferland et al., 2017). The goal is to test whether the observed linear trend [Si vi] /Br – BH mass and lack of correlation with the higher IP lines can be reproduced in CLOUDY. To that aim, a range of electron densities, , cloud’s distances, r, and ionisation parameters, U, that commensurate with the observed emissivity and location of CL emission are probed.
Specifically, the selected range of parameters are as follows. The CL emission has been resolved, to extend over several tens of parsec to upmost 100 pc (Prieto et al., 2005), the bulk of the emission is mostly nuclear and accounted by photoionization (Rodríguez-Ardila et al., 2006; Müller-Sánchez et al., 2011; Rodríguez-Ardila et al., 2017; May et al., 2018).
As input to CLOUDY, the distance of the CL clouds to the centre r, is taken in the 0.3 pc 100 pc range, the lowest limit set by the location of the broad-line-region (Bentz et al., 2013; Martínez-Aldama et al., 2019).
Models are run for densities, , in the cm-3 range, the upper limit set by the critical density of the CLs probed - cm-3, the lower one by the average densities inferred from the mid-IR [Ne v] lines, IP=97 eV, (Fernández-Ontiveros et al., 2016), and ionization parameter, U, in the high end, -1 1 range, to cope with CL observed emissivity (Ferguson et al., 1997; Rodríguez-Ardila et al., 2006).
The input ionizing continuum is Eq. 1 (Fig. 2), normalised to = 0.1, representative of the AGN in the sample - average Lbol erg s-1. Solar abundances and a cloud size equivalent to a H column density, = 1023 cm-2 are used.
Fig. 3 shows CLOUDY predictions for the CL ratios employed in this work as a function of (in the right axis), and of (on the left axis) following the transformation in Eq. 3. Data are shown with open squares on top (same as in Fig. 1). CLOUDY predictions that best constrain the data are shown. Limited cases are discussed in the text. We note that as the CL data is normalised to HI broad line region, to compare with CLOUDY predictions, these being derived for densities at least two orders of magnitude below that of the broad line region, a correction factor to the models is applied. This factor is inferred from the compilation of narrow and broad H fluxes in a sample of 54 nearby AGN (Riffel et al., 2006), the narrow/broad Br ratio being in the 8 - 20 range. A factor 15 was chosen as best compromise to scale down CLOUDY predictions to the range of [Si vi]/Br observed. Having fixed the scale for this ratio, those for the other CL line ratios were derived by imposing theoretical H i recombination ratios. Accordingly, a factor of 25 is applied to CLOUDY’s [Fe vii]/H, and 90 to both [S viii]/Pa and [Si x]/Pa.
Focusing on [Si vi]/Br, CLOUDY results are similar in the range of densities probed (), enclosing all the observed data. Best predictions are for cloud distances, pc, and and cm-3, which give the closest to the linear dependence observed for the BH mass range in this work, M⊙ (left axis). For BH mass below M⊙, CLOUDY predictions change abruptly. In any case, only one galaxy falls in this range.
CLOUDY dependence with distance r is that of a slight increase in the CL ratios with increasing r, model’s trend are similar though. r 0.3 pc (used in Fig. 3) provides best agreement. Predictions for clouds at tens or hundred of parsecs failed at reproducing the data unless densities are much smaller, but this would penalize the CL emission strength, making it undetectable (e.g. Contini et al., 2002). Regarding , models with progressively depart from the observed linear trend, severely penalises [S viii] and [Si x] emissivities.
Focusing on [Fe vii]/H, the same models that constrain [Si vi]/Br also account for the spread of the iron ratio (Fig. 1). This consistency in the modeling may a priori be expected if considered that the IP of [Si vi] and [Fe vii] are close to the peak temperature of the accretion disc for the range of BH mass considered (Fig. 2), so both lines should be sensitive to the spectrum of the accretion disc although their dependence with the may be different. As discussed in former sections, a linear dependence with BH mass as that seen with [Si vi]/Br was also expected for [Fe vii] / , which is not the case (Fig. 1). Interestingly, CLOUDY does not predict a linear dependence with the temperature but a rather complicated one, which already sets aside this ratio as a temperature indicator. A reason may reside on the fact that collisional excitation of optical lines is more sensitive to the temperature than the IR lines.
None of the models above pass any close to the observed [Si x]/Pa and [S viii]/Pa values (Fig. 3). Both line ratios show a scatter diagram when compared with BH mass (Fig. 1), which we attribute to their IPs falling at the high energy end of the accretion disc spectrum (Fig. 2) for any of the BH mass considered. In this case, no dependence with is expected, which is hinted by CLOUDY predictions. It can be seen in Fig. 3 that the prediction for [S viii]/Pa is a very weak dependence with the temperature, models are almost a straight line in ; a stronger dependence is predicted for [Si x]/Pa but for the high temperature range only. It should be noted that the range of parameters probed are at the limit of what is feasible for coronal emission in terms of maximum density and minimum r. Increasing the density, decreasing r, will progressively shift the models to the loci of these data but will not change the dependence with - for the range of accretion discs -BH mass - considered.
5 Overall view: potential of coronal gas for BH mass determination and disc accretion
Using bona-fide BH mass estimate from reverberation mapping and the line ratio [Si vi] 1.963m/Br as genuine tracer of the AGN ionizing continuum, a novel BH-mass scaling relation over almost three orders of magnitude in BH mass, M⊙, is found (Fig. 1). It follows the dependence ([Si vi]/Pa)1.99±0.37, with a dispersion in BH mass of 0.44 dex (Sec. 3). Following on the thin accretion disc approximation and after surveying a basic parameter space for CL production, we believe that a key parameter driving this correlation is the effective temperature of the accretion disc, the observed correlation being formally in line with the thin disc prediction .
For a suitable range of densities cm-3, and ionization parameter to account for CL emissivities, photoionization models yield a narrow dependence log() – log([Si vi]/Br) close to the linear trend observed between log and log([Si vi]/Br). On the assumption that the difference between the broad (used in Fig. 1) and narrow (used in CLOUDY) flux is a scale factor of the order of 15, as inferred from observations (Sec. 4.1), CLOUDY predictions fall onto the empirical BH mass - ([Si vi]/Br relation.
The BH mass - CL dependence is sensitive to the IP of the CL employed. The use of [Si vi] 1.963 m restricts the dependence to BH masses in the range of to M⊙ (Fig. 1), potentially up to M⊙ but not yet tested, presumably because of the disc temperature for these masses favors [Si vi] emission. In the same line of reasoning, an equivalent relationship involving other CLs, e.g, [Fe vii] 6087, with IP close to the peak emission of the disc for these range of BH mass should be expected. The complex dependence of [Fe vii] / H with temperature as predicted by CLOUDY makes this line unsuitable for and, in turn, for BH mass diagnosis (Sect. 4). Other prominent CLs are those from Ne4+ IP = 97 eV. Yet, the ones in the UV are much subjected to reddening. Those in the mid-IR are available for few sources with good BH mass determination. Still, we advance from first analysis a positive result.
Conversely, for the same BH mass range and objects above, no correlation involving the higher IP lines, [Si x] and [S viii], IP 250 eV is observed (Fig. 1). This is because the IP of these lines sample hotter discs, and in turn smaller BH masses. Accordingly, no dependence with , within the range of BH mass under study, is foreseen, which is indeed consistent with CLOUDY predictions (Fig. 3). These lines are however expected to show a dependence with the disc temperature with decreasing BH masses below 106 M⊙, becoming thus potential candidates for BH mass determination at intermediate BH masses, as suggested by (Cann et al., 2018). Testing this low mass end is currently limited by the lack of suitable data.
Above M⊙, disc temperatures are foreseen in the K regime. Lower ionization lines would then be more favoured than higher ones. As expected, CLOUDY predicts a general decrease in [Si vi]/Br with decreasing temperature (Fig. 3); observationally, [Si vi]/Br decreases with increasing BH mass (Fig. 1). The high BH mass tail in the local universe is the realm of elliptical and bulge dominated objects often associated with LINERS. Parsecs-scale near-IR observations have so far proven the elusiveness of CL emission in a few nearby cases (Müller-Sánchez et al., 2013), in line with this prediction. These sources would appear as upper limits at the high mass range in Fig. 1.
If the above predictions are correct, some intrinsic scatter in the proposed BH mass scaling relation should be present. This may reflect a range of properties of the individual objects. Prime assumptions involved in the modeling are the radiation efficiency, accretion rate, and spin, all being fixed to a reference of 10% in the BH mass – thin disc approximation relation (Eq. 3). Among these, an increase in spin or accretion rate translates into a progressive increase in (Campitiello et al., 2018, 2019). An increase in efficiency would produce the opposite effect. Because of the exponential dependence of these parameters, the expected increase in efficiency with increasing spin would yield little change in . An increase of at most a factor two in is achieved for spin 0.5%, co-rotation and efficiency 10%, but a factor of 1.4 for maximum spin, and 40% efficiency. Overall the net effect in BH mass is in the 10 dex range. Regarding CLOUDY predictions, the dependence of [Si vi]/Br on density and ionization parameter is small (Fig. 3) provided we are in the optimal range for production of CL emission, cm-3, log . With a final compendium of 31 objects, the dispersion in BH mass with the proposed calibration is 0.47 dex - one , which compares with 0.44 dex inferred from the relation in 49 galactic bulges with direct dynamical BH mass estimate (Gültekin et al., 2006).
The present BH mass scaling relation is restricted to Type 1 AGN including narrow line Type 1, and BH masses in the M⊙ range. The limitation to Type I is currently driven by the need to normalise to broad H i gas. Attempts to normalise to narrow H i introduce excessive scatter possibly because of stellar contamination and the large size of the H ii region as compared with nuclear, parsec scale, CL region.
The proposed scaling offers an economic, physically motivated, alternative for BH estimate using single epoch spectra that avoid large telescope time (reverberation mapping) or absolute flux calibration (the continuum luminosity method, Landt et al. (2013) and references therein). With James Webb Space Telescope and big surveys in the IR region, large samples of AGNs could be weighted using this approach.
Acknowledgements
We are grateful to H. Netzer for critical review, E. Churazov, B. Czerny, A. Askar for discussions. A.R.A acknowledges partial support from CNPq Fellowship (311935/2015-0 & 203746/2017-1), S.P. from the Polish Funding Agency National Science Centre, project 2017/26/A/ST9/00756 (MAESTRO 9) and MNiSW grant DIR/WK/2018/12. S.P would like to acknowledge the computational facility at Nicolaus Copernicus Astronomical Center.
References
- Abazajian et al. (2009) Abazajian, K. N., Adelman-McCarthy, J. K., Agüeros, M. A., et al. 2009, The Astrophysical Journal Supplement Series, 182, 543
- Baldwin & Stone (1984) Baldwin, J., & Stone, R. P. 1984, Monthly Notices of the Royal Astronomical Society, 206, 241
- Bentz & Katz (2015) Bentz, M. C., & Katz, S. 2015, PASP, 127, 67, doi: 10.1086/679601
- Bentz et al. (2013) Bentz, M. C., Denney, K. D., Grier, C. J., et al. 2013, ApJ, 767, 149, doi: 10.1088/0004-637X/767/2/149
- Binette et al. (1996) Binette, L., Wilson, A. S., & Storchi-Bergmann, T. 1996, A&A, 312, 365
- Boroson & Green (1992) Boroson, T. A., & Green, R. F. 1992, ApJS, 80, 109, doi: 10.1086/191661
- Campitiello et al. (2019) Campitiello, S., Celotti, A., Ghisellini, G., & Sbarrato, T. 2019, A&A, 625, A23, doi: 10.1051/0004-6361/201834167
- Campitiello et al. (2018) Campitiello, S., Ghisellini, G., Sbarrato, T., & Calderone, G. 2018, A&A, 612, A59, doi: 10.1051/0004-6361/201731897
- Cann et al. (2018) Cann, J. M., Satyapal, S., Abel, N. P., et al. 2018, ApJ, 861, 142, doi: 10.3847/1538-4357/aac64a
- Cappellari et al. (2013) Cappellari, M., Scott, N., Alatalo, K., et al. 2013, MNRAS, 432, 1709, doi: 10.1093/mnras/stt562
- Cardelli et al. (1989) Cardelli, J. A., Clayton, G. C., & Mathis, J. S. 1989, The Astrophysical Journal, 345, 245
- Clemens et al. (2004) Clemens, J. C., Crain, J. A., & Anderson, R. 2004, in Ground-based Instrumentation for Astronomy, Vol. 5492, International Society for Optics and Photonics, 331–340
- Contini et al. (2002) Contini, M., Viegas, S. M., & Prieto, M. A. 2002, A&A, 386, 399, doi: 10.1051/0004-6361:20020245
- Cushing et al. (2004) Cushing, M. C., Vacca, W. D., & Rayner, J. T. 2004, Publications of the Astronomical Society of the Pacific, 116, 362
- Czerny & Elvis (1987) Czerny, B., & Elvis, M. 1987, ApJ, 321, 305, doi: 10.1086/165630
- Dasyra et al. (2007) Dasyra, K. M., Tacconi, L. J., Davies, R. I., et al. 2007, ApJ, 657, 102, doi: 10.1086/510552
- Davidson & Netzer (1979) Davidson, K., & Netzer, H. 1979, Reviews of Modern Physics, 51, 715, doi: 10.1103/RevModPhys.51.715
- Elias et al. (2006) Elias, J. H., Rodgers, B., Joyce, R. R., et al. 2006, in Ground-based and Airborne Instrumentation for Astronomy, Vol. 6269, International Society for Optics and Photonics, 626914
- Ferguson et al. (1997) Ferguson, J. W., Korista, K. T., Baldwin, J. A., & Ferland, G. J. 1997, ApJ, 487, 122, doi: 10.1086/304611
- Ferland et al. (2020) Ferland, G. J., Done, C., Jin, C., Landt, H., & Ward, M. J. 2020, MNRAS, 494, 5917, doi: 10.1093/mnras/staa1207
- Ferland & Osterbrock (1986) Ferland, G. J., & Osterbrock, D. E. 1986, ApJ, 300, 658, doi: 10.1086/163841
- Ferland et al. (2017) Ferland, G. J., Chatzikos, M., Guzmán, F., et al. 2017, Rev. Mexicana Astron. Astrofis., 53, 385. https://arxiv.org/abs/1705.10877
- Fernández-Ontiveros et al. (2016) Fernández-Ontiveros, J. A., Spinoglio, L., Pereira-Santaella, M., et al. 2016, ApJS, 226, 19, doi: 10.3847/0067-0049/226/2/19
- Frank et al. (2002) Frank, J., King, A., & Raine, D. J. 2002, Accretion Power in Astrophysics: Third Edition (Cambridge University Press)
- Gültekin et al. (2006) Gültekin, K., Miller, M. C., & Hamilton, D. P. 2006, ApJ, 640, 156, doi: 10.1086/499917
- Lamperti et al. (2017) Lamperti, I., Koss, M., Trakhtenbrot, B., et al. 2017, MNRAS, 467, 540, doi: 10.1093/mnras/stx055
- Landt et al. (2011) Landt, H., Bentz, M. C., Peterson, B. M., et al. 2011, MNRAS, 413, L106, doi: 10.1111/j.1745-3933.2011.01047.x
- Landt et al. (2013) Landt, H., Ward, M. J., Peterson, B. M., et al. 2013, MNRAS, 432, 113, doi: 10.1093/mnras/stt421
- Lynden-Bell (1969) Lynden-Bell, D. 1969, Nature, 223, 690, doi: 10.1038/223690a0
- Martínez-Aldama et al. (2019) Martínez-Aldama, M. L., Czerny, B., Kawka, D., et al. 2019, ApJ, 883, 170, doi: 10.3847/1538-4357/ab3728
- Mason et al. (2015) Mason, R. E., Rodriguez-Ardila, A., Martins, L., et al. 2015, The Astrophysical Journal Supplement Series, 217, 13
- May et al. (2018) May, D., Rodríguez-Ardila, A., Prieto, M. A., et al. 2018, MNRAS, 481, L105, doi: 10.1093/mnrasl/sly155
- Moustakas & Kennicutt (2006) Moustakas, J., & Kennicutt, Robert C., J. 2006, ApJS, 164, 81, doi: 10.1086/500971
- Müller-Sánchez et al. (2011) Müller-Sánchez, F., Prieto, M. A., Hicks, E. K. S., et al. 2011, ApJ, 739, 69, doi: 10.1088/0004-637X/739/2/69
- Müller-Sánchez et al. (2013) Müller-Sánchez, F., Prieto, M. A., Mezcua, M., et al. 2013, ApJ, 763, L1, doi: 10.1088/2041-8205/763/1/L1
- Osterbrock & Ferland (2006) Osterbrock, D. E., & Ferland, G. J. 2006, Astrophysics of gaseous nebulae and active galactic nuclei (University Science Books, California, USA)
- Panda et al. (2018) Panda, S., Czerny, B., Adhikari, T. P., et al. 2018, ApJ, 866, 115, doi: 10.3847/1538-4357/aae209
- Park et al. (2017) Park, S., Woo, J.-H., Romero-Colmenero, E., et al. 2017, ApJ, 847, 125, doi: 10.3847/1538-4357/aa88a3
- Pecaut & Mamajek (2013) Pecaut, M. J., & Mamajek, E. E. 2013, The Astrophysical Journal Supplement Series, 208, 9
- Pogge & Owen (1993) Pogge, R., & Owen, J. 1993, S.l.: OSU International
- Prieto et al. (2005) Prieto, M. A., Marco, O., & Gallimore, J. 2005, MNRAS, 364, L28, doi: 10.1111/j.1745-3933.2005.00099.x
- Prieto et al. (2002) Prieto, M. A., Pérez García, A. M., & Rodríguez Espinosa, J. M. 2002, MNRAS, 329, 309, doi: 10.1046/j.1365-8711.2002.04985.x
- Prieto et al. (2010) Prieto, M. A., Reunanen, J., Tristram, K. R. W., et al. 2010, MNRAS, 402, 724, doi: 10.1111/j.1365-2966.2009.15897.x
- Prieto & Viegas (2000) Prieto, M. A., & Viegas, S. M. 2000, ApJ, 532, 238, doi: 10.1086/308532
- Reunanen et al. (2003) Reunanen, J., Kotilainen, J. K., & Prieto, M. A. 2003, MNRAS, 343, 192, doi: 10.1046/j.1365-8711.2003.06771.x
- Reynolds (2019) Reynolds, C. S. 2019, Nature Astronomy, 3, 41, doi: 10.1038/s41550-018-0665-z
- Riffel et al. (2006) Riffel, R., Rodríguez-Ardila, A., & Pastoriza, M. G. 2006, A&A, 457, 61, doi: 10.1051/0004-6361:20065291
- Rodríguez-Ardila et al. (2005) Rodríguez-Ardila, A., Contini, M., & Viegas, S. M. 2005, MNRAS, 357, 220, doi: 10.1111/j.1365-2966.2005.08628.x
- Rodríguez-Ardila et al. (2017) Rodríguez-Ardila, A., Prieto, M. A., Mazzalay, X., et al. 2017, MNRAS, 470, 2845, doi: 10.1093/mnras/stx1401
- Rodríguez-Ardila et al. (2011) Rodríguez-Ardila, A., Prieto, M. A., Portilla, J. G., & Tejeiro, J. M. 2011, ApJ, 743, 100, doi: 10.1088/0004-637X/743/2/100
- Rodríguez-Ardila et al. (2006) Rodríguez-Ardila, A., Prieto, M. A., Viegas, S., & Gruenwald, R. 2006, ApJ, 653, 1098, doi: 10.1086/508864
- Rodríguez-Ardila et al. (2002) Rodríguez-Ardila, A., Viegas, S. M., Pastoriza, M. G., Prato, L., & Donzelli, C. J. 2002, ApJ, 572, 94, doi: 10.1086/340192
- Schlafly & Finkbeiner (2011) Schlafly, E. F., & Finkbeiner, D. P. 2011, The Astrophysical Journal, 737, 103
- Shakura & Sunyaev (1973) Shakura, N. I., & Sunyaev, R. A. 1973, A&A, 24, 337
- Shields (1978) Shields, G. A. 1978, Nature, 272, 706, doi: 10.1038/272706a0
- Skrutskie et al. (2006) Skrutskie, M., Cutri, R., Stiening, R., et al. 2006, The Astronomical Journal, 131, 1163
- Vacca et al. (2003) Vacca, W. D., Cushing, M. C., & Rayner, J. T. 2003, Publications of the Astronomical Society of the Pacific, 115, 389
- Woo & Urry (2002) Woo, J.-H., & Urry, C. M. 2002, ApJ, 579, 530, doi: 10.1086/342878
Appendix A Optical Spectra


| Galaxy | H | Pa | Br |
|---|---|---|---|
| Mrk 335 | 115.41.2 | 1705 | 26.73.1 |
| Fairall 9 | 49.00.3 | 107.98.4 | 43.14.7 |
| NGC 863 | … | 493 | 10.42.9 |
| 3C 120 | … | 223.07.0 | 46.36.5 |
| Mrk 707 | 10.70.3 | … | 4.80.4 |
| Mrk 110 | 5.20.1 | … | … |
| NGC 3227 | … | 168.710.2 | 20.03.9 |
| Mrk 142 | 8.60.07 | … | … |
| SBS 1116+583A | 4.70.2 | … | … |
| PG 1126-041 | … | 101.83.7 | 13.30.07 |
| NGC 3783 | 469.315.7 | 348.719.1 | 60.49.8 |
| Mrk 1310 | 3.490.07 | 11.41.1 | 1.40.4 |
| NGC 4051 | 4.80.2 | 66.61.7 | 13.10.8 |
| NGC 4151 | 758.57.9 | 712.58.8 | 125.010.8 |
| Mrk 202 | 6.300.17 | … | … |
| Mrk 766 | 82.93.0 | 117.81.8 | 20.02.26 |
| Mrk 50 | 16.00.5 | … | … |
| NGC 4395 | 1.100.02 | 30.51.1 | 1.90.2 |
| Mrk 771 | 12.50.2 | … | … |
| NGC 4748 | … | 60.12.2 | 9.70.5 |
| PG 1307+085 | 17.20.2 | … | … |
| MGC-6-30-15 | 110.00.4 | … | … |
| NGC 5548 | 31.41.0 | 49.32.9 | 16.32.0 |
| PG1448+273 | … | … | 2.400.10 |
| Mrk 290 | 23.90.5 | … | … |
| Mrk 841 | 43.61.2 | 146.710.4 | 26.17.5 |
| 3C 390.3 | 43.30.7 | … | … |
| NGC 6814 | … | 81.013.3 | 11.93.5 |
| Mrk 509 | … | 1824.777.9 | 349.021.8 |
| Ark 564 | 16.00.2 | 59.01.5 | 5.70.4 |
| NGC 7469 | 85.51.2 | 153.17.3 | 20.71.4 |