Present address: ]CIC nanoGUNE, E-20018 Donostia - San Sebastian, Spain Present address: ]Physik-Institut, University of Zurich, Winterthurerstrasse190, 8057 Zurich, Switzerland
Optical properties of LaNiO3 films tuned from compressive to tensile strain
Abstract
Materials with strong electronic correlations host remarkable – and technologically relevant – phenomena such as magnetism, superconductivity and metal-insulator transitions. Harnessing and controlling these effects is a major challenge, on which key advances are being made through lattice and strain engineering in thin films and heterostructures, leveraging the complex interplay between electronic and structural degrees of freedom. Here we show that the electronic structure of LaNiO3 can be tuned by means of lattice engineering. We use different substrates to induce compressive and tensile biaxial epitaxial strain in LaNiO3 thin films. Our measurements reveal systematic changes of the optical spectrum as a function of strain and, notably, an increase of the low-frequency free carrier weight as tensile strain is applied. Using density functional theory (DFT) calculations, we show that this apparently counter-intuitive effect is due to a change of orientation of the oxygen octahedra. The calculations also reveal drastic changes of the electronic structure under strain, associated with a Fermi surface Lifshitz transition. We provide an online applet to explore these effects. The experimental value of integrated spectral weight below 2 eV is significantly (up to a factor of 3) smaller than the DFT results, indicating a transfer of spectral weight from the infrared to energies above 2 eV. The suppression of the free carrier weight and the transfer of spectral weight to high energies together indicate a correlation-induced band narrowing and free carrier mass enhancement due to electronic correlations. Our findings provide a promising avenue for the tuning and control of quantum materials employing lattice engineering.
I Introduction
Rare-earth nickelates with the chemical formula RNiO3 (with R being a rare earth element) exhibit a rich structural, electronic and magnetic phase diagram Torrance et al. (1992); García-Muñoz et al. (1992); Catalan (2008). In this series of materials La3+ has the largest radius, with the effect that LaNiO3 is a paramagnetic metal at all temperatures. Intensive research has been motivated by the predicted similarity to cuprates of engineered heterostructures of LaNiO3 and other rare earth nickelates Chaloupka and Khaliullin (2008); Kumah et al. (2014); Ismail-Beigi et al. (2017); Phillips et al. (2017); Disa et al. (2017), efforts which were recently extended to materials that contain elements even further away on the periodic table, such as cobaltates Lee et al. (2019). For the smaller rare earths the material is an antiferromagnetic insulator at low temperatures, which passes to an insulating paramagnetic state above the Néel temperature and undergoes an insulator to metal transition at a still higher temperature. The low temperature insulating state is characterized by two inequivalent nickel sites with electronic states akin to low-spin and high-spin accompanied by a concomitant rearrangement of the oxygen atoms in a breathing distortion Mizokawa et al. (2000); Park et al. (2012); Mazin et al. (2007); Johnston et al. (2014); Subedi et al. (2015); Seth et al. (2017). This "negative " type of bi-stability is understood to arise from an effective attractive intra-atomic electron-electron interaction Hirsch (1985); van der Marel and Sawatzky (1985); Varma (1988); Strand (2014) and is of interest for materials engineering aimed at superconductivity Fowlie (2018). It is interesting in this context that —based on structural and electronic similarities to the cuprates— superconductivity has been predicted for strained LaNiO3/LaGaO3 superlattices Chaloupka and Khaliullin (2008). We also note that superconductivity was recently observed in hole doped infinite layer NdNiO2 Li et al. (2019).
Advances in the epitaxial thin film growth on substrates with the perovskite structure have opened an alternative route to rare-earth substitution for controlling the electronic state of transition-metal oxides Catalano et al. (2018). Strain is extensively used in heterostructure engineering of the rare earth nickelates with the composition RNiO3. The great advantage of this technique is that both compressive and tensile strain conditions can be achieved due to the substrate-imposed epitaxial constraints, producing large structural distortions and electronic effects. Compressive strain mostly modifies the in-plane bond angles while tensile strain is more efficient in modifying the out-of-plane bond angles Fowlie et al. (2019) (see later). The circumstance that LaNiO3 is exceptional in this class of materials in that it is metallic at all temperatures, motivated us to study the role of strain on the electronic structure of this particular compound. Unstrained LaNiO3 is a metal with the rhombohedral () structure Zhu et al. (2013); Guo et al. (2018). The main effect of strain is to lower the symmetry by reducing the space group to a monoclinic space group (and its supergroups, (see Appendix B), which results in slight orbital polarization, i.e., in a splitting between energies of local Ni-centered electronic states. This degeneracy lifting has a profound impact on the transport and optical properties of thin films.
Previous optical studies of strained LaNiO3 films have revealed the impact of strain on the optical conductivity and on the enhancement of the electron mass Ouellette et al. (2010); Stewart et al. (2011). We extend the optical range to energies below 1 meV using a combination of (time-domain and continuous wave) reflection, transmission and ellipsometric spectroscopy. We obtain values of the free carrier mass enhancement that are consistent with the aforementioned reports, and extend those results with a finer set of strains. Importantly, we relate the observed trends in the strain-dependent optical spectra to Fermi surface (Lifshitz) transitions, and indeed changes in the Fermi surface topology of LaNiO3 due to misfit strain have been previously seen in angle resolved photoemission (ARPES) experiments Yoo et al. (2015). We demonstrate that these transitions have a profound effect on the velocities of Fermi surface states that control the low-frequency conductivity.
II Strain dependence of the optical conductivity
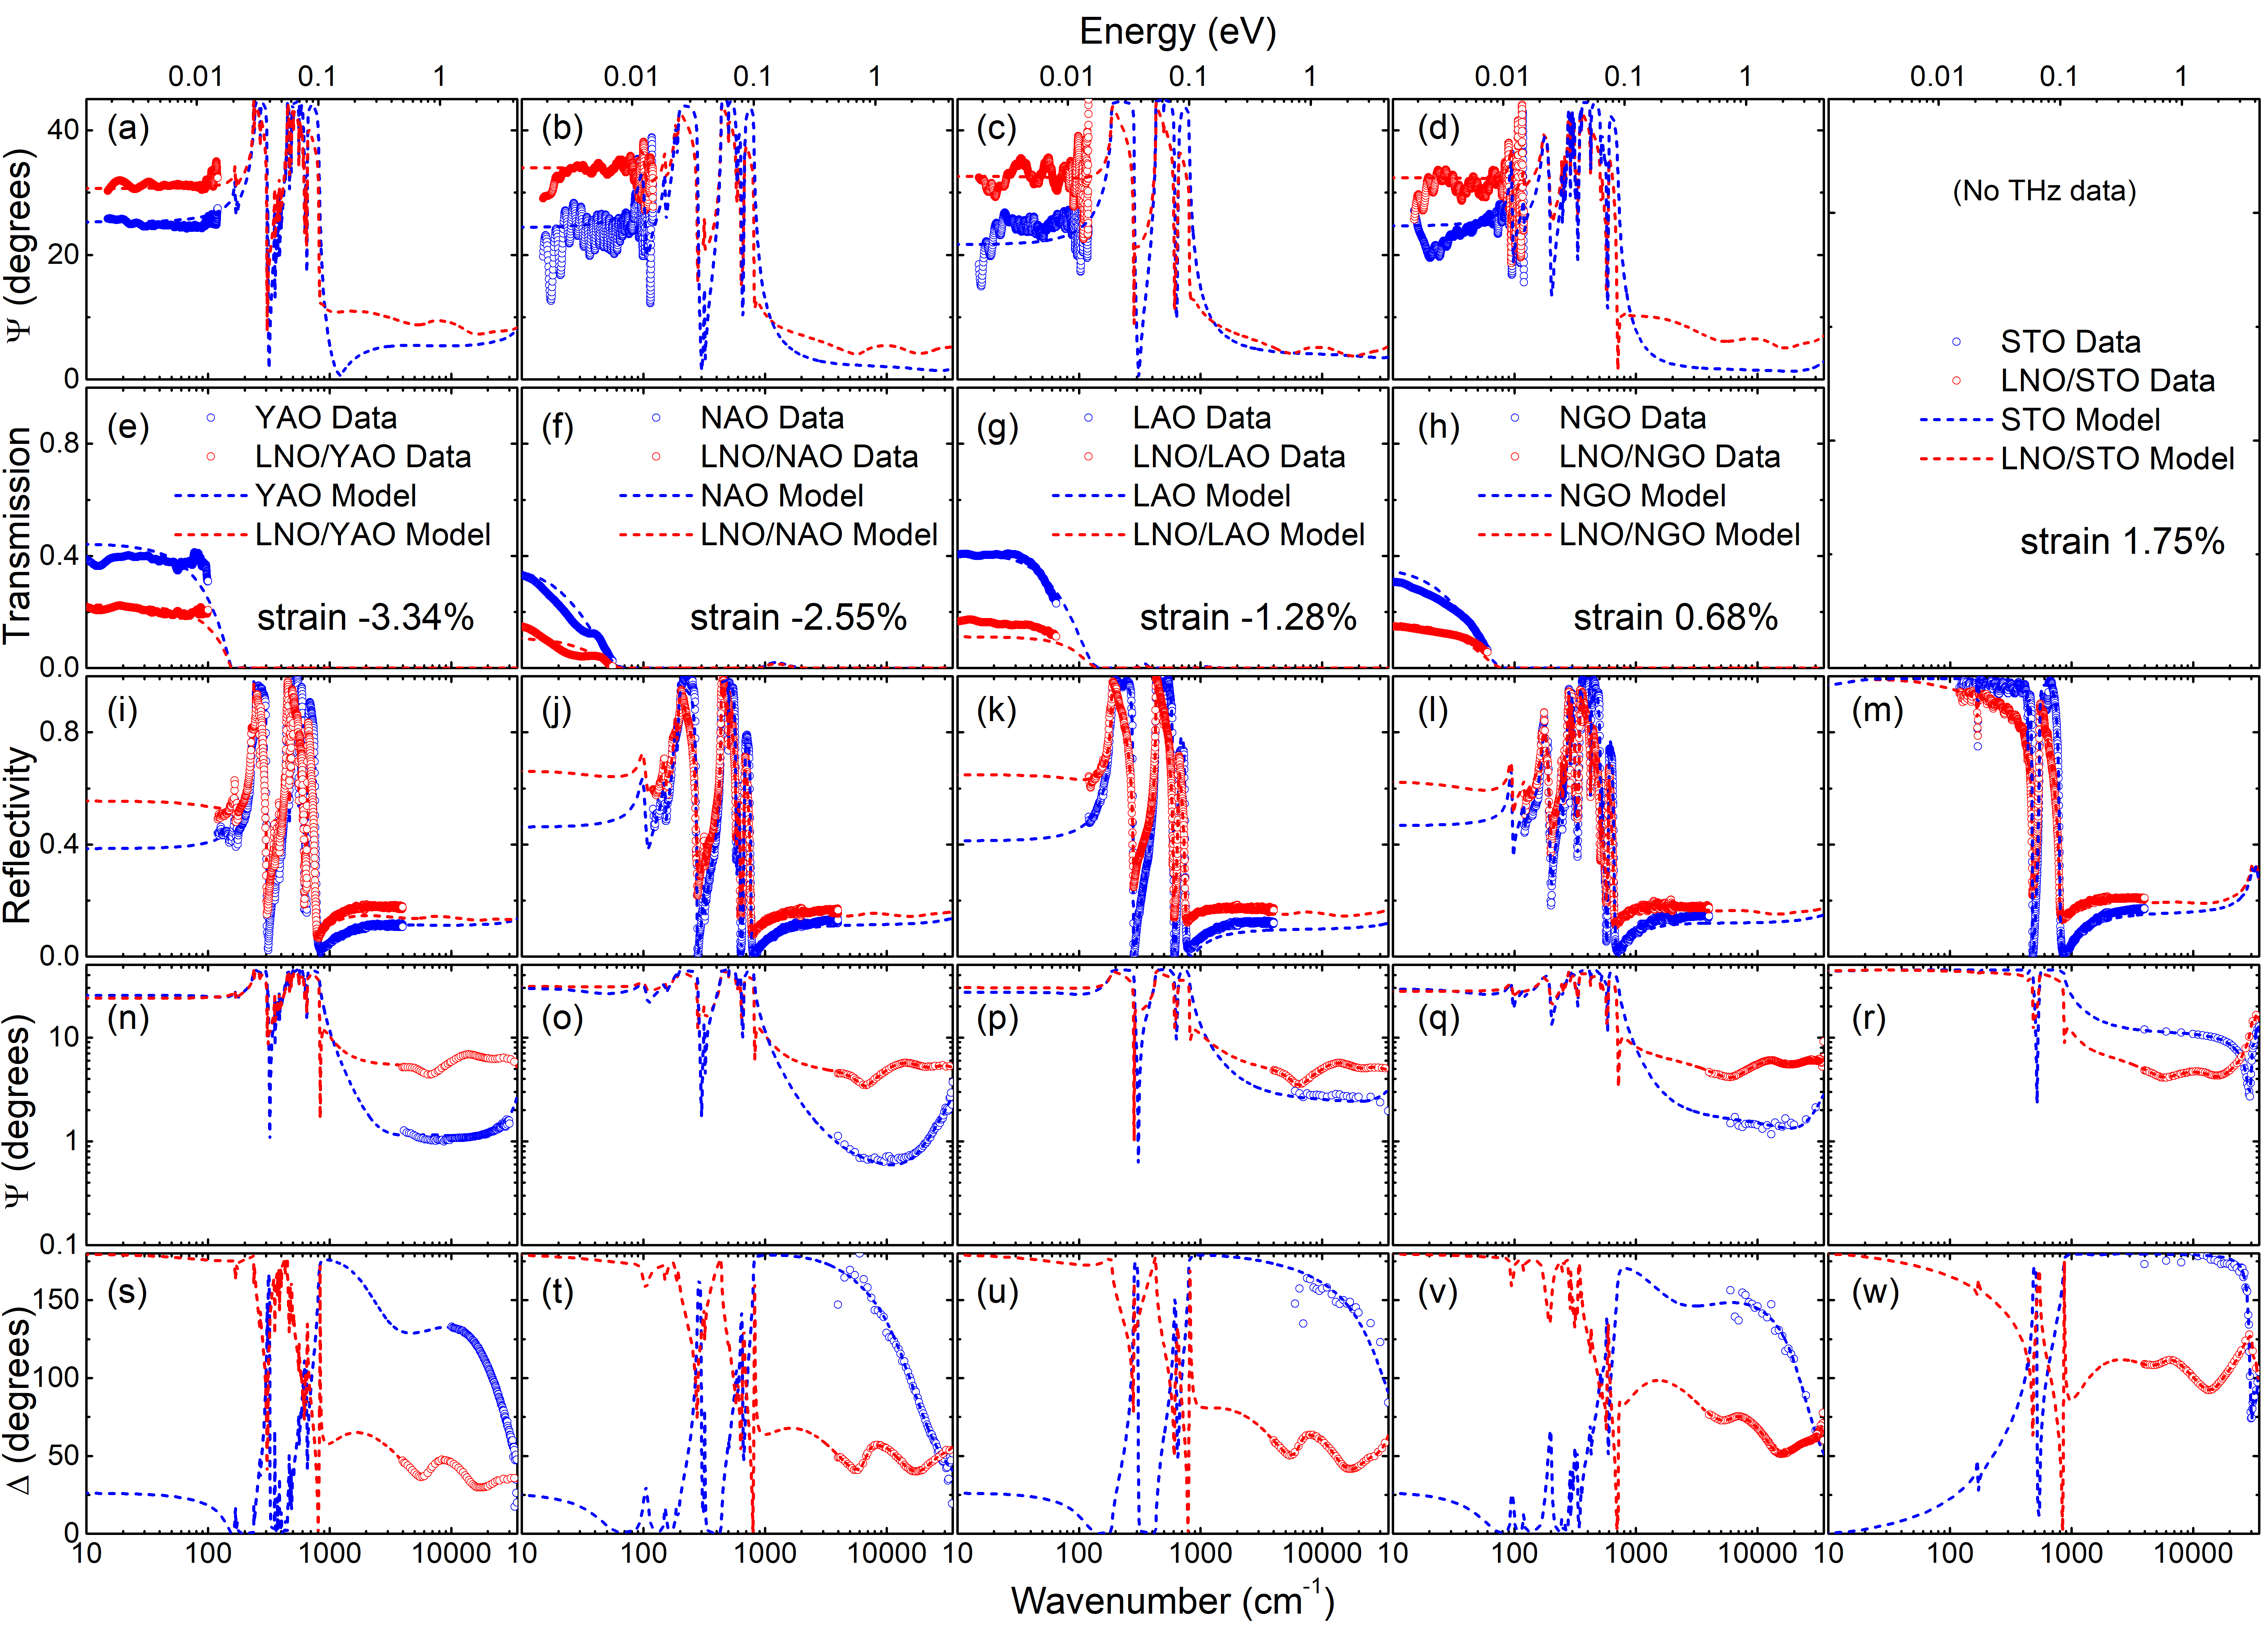
We measured the optical spectra of LaNiO3 thin films with substrate-induced strain ranging from highly compressive (-%) to moderate tensile (+%). Details of the sample preparation are provided in Appendix A. Film specifications are summarized in Table 1. THz transmission and ellipsometry was measured from to ; infrared reflectivity from to and near infrared/visible/ultraviolet (NIR/VIS/UV) ellipsometry from to . The data were collected at using ultra high vacuum helium flow cryostats. Due to the high (of order ) dielectric constant of SrTiO3 no reliable THz ellipsometry and transmission data could be obtained for bare and film-covered SrTiO3. Ellipsometry provides the ratio where and are the reflection coefficient for and polarized light. In the THz range we used an angle of incidence of 65 with the surface normal. In this range only could be obtained with sufficient precision. In the NIR/VIS/UV range both and were measured for angles of incidence with the surface normal varying from 65 to 70 for the different samples (values indicated in Fig. 1). For each film/substrate combination the spectra of the bare substrate and of the film-covered substrate were measured. We did not observe significant in-plane anisotropy of the optical constants, which confirms the observations in Ref. Stewart et al., 2011. The parameters of a Drude-Lorentz expansion were adjusted with the help of the program RefFit Kuzmenko (2005) to fit the Fresnel equations for transmission, reflection and ellipsometry of stratified media to the full set of data for each film/substrate combination shown in Fig. 1. These fits were used to generate the complex dielectric function and, associated to this, the optical conductivity. The corresponding optical conductivities are given in Fig. 2. In order to fit the spectra in the infrared range at low temperature it was necessary to model the optical conductivity at low frequencies as a superposition of a narrow and a broad Drude peak Nakajima et al. (2010); Cheng et al. (2012). For all temperatures and strains the DC conductivity, , obtained on the same samples using four probe measurements fell within the noise level of the optical conductivity at the lowest frequencies of the measured range (i.e. ). To optimize the result of the Drude-Lorentz fit we therefore used the transport data as an additional constraint. The error bars are obtained by varying the relative weights of the different types of spectra (transmission, reflection, ellipsometry) in the fit procedure.
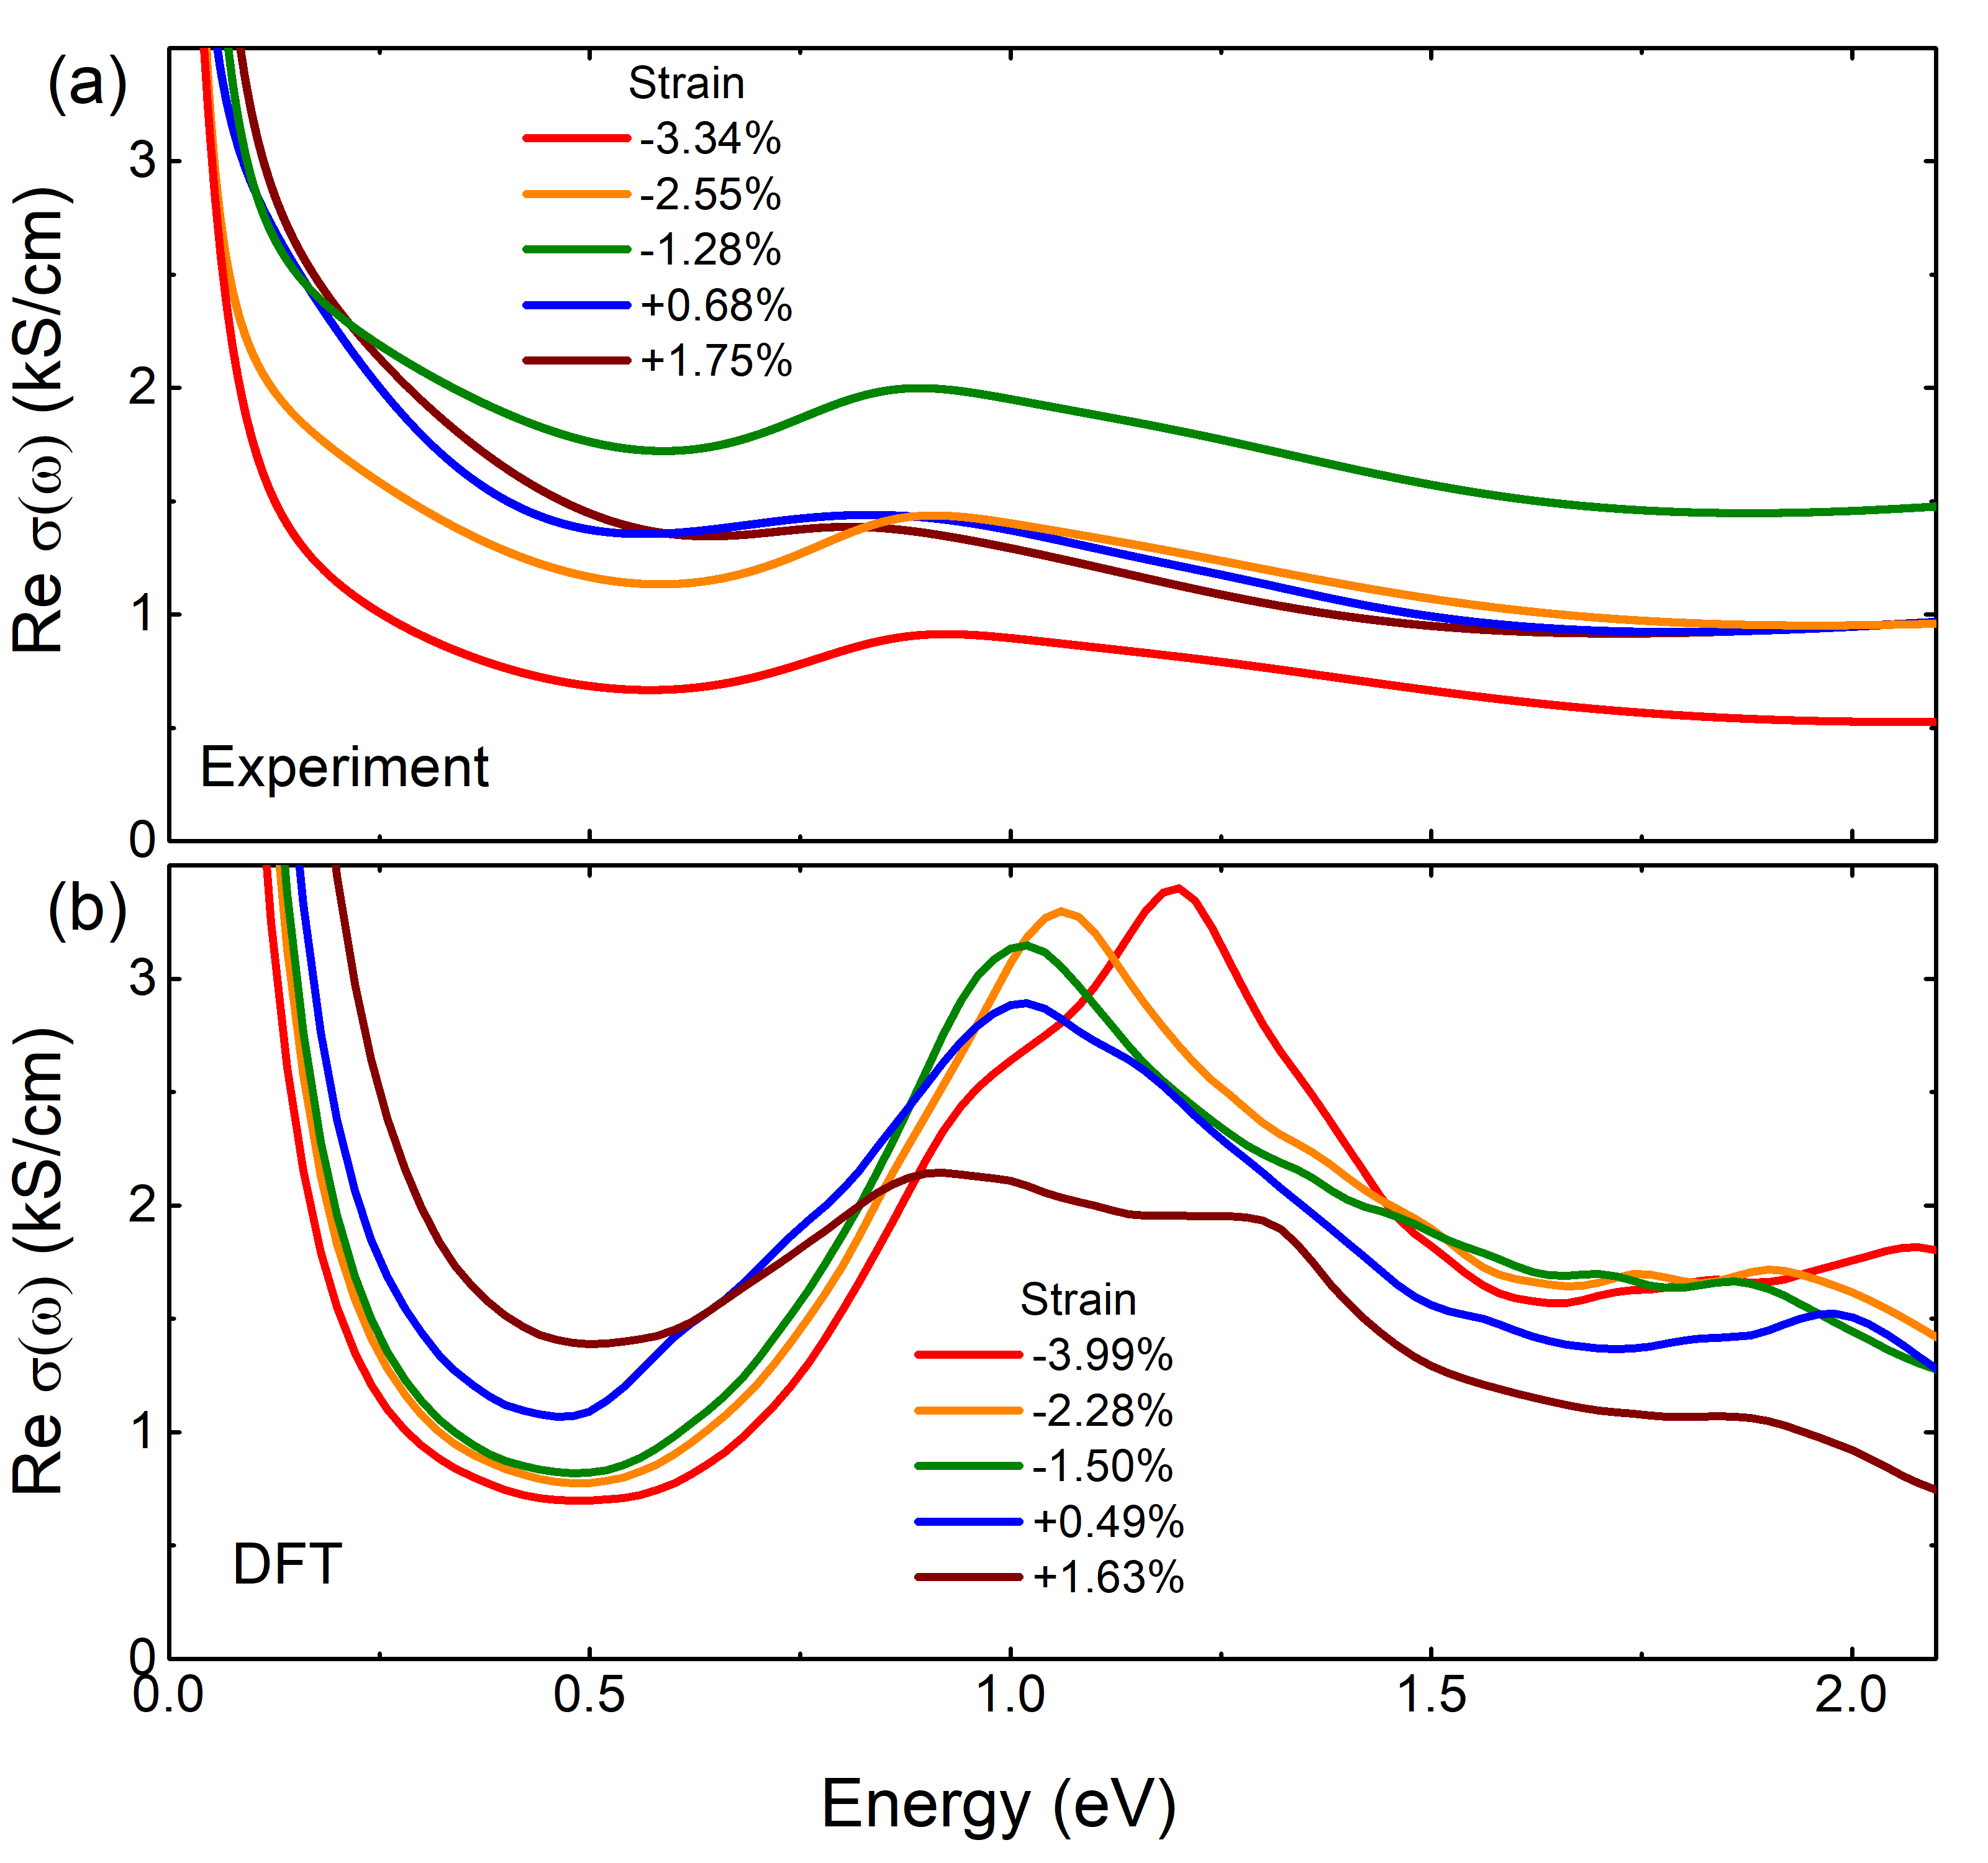
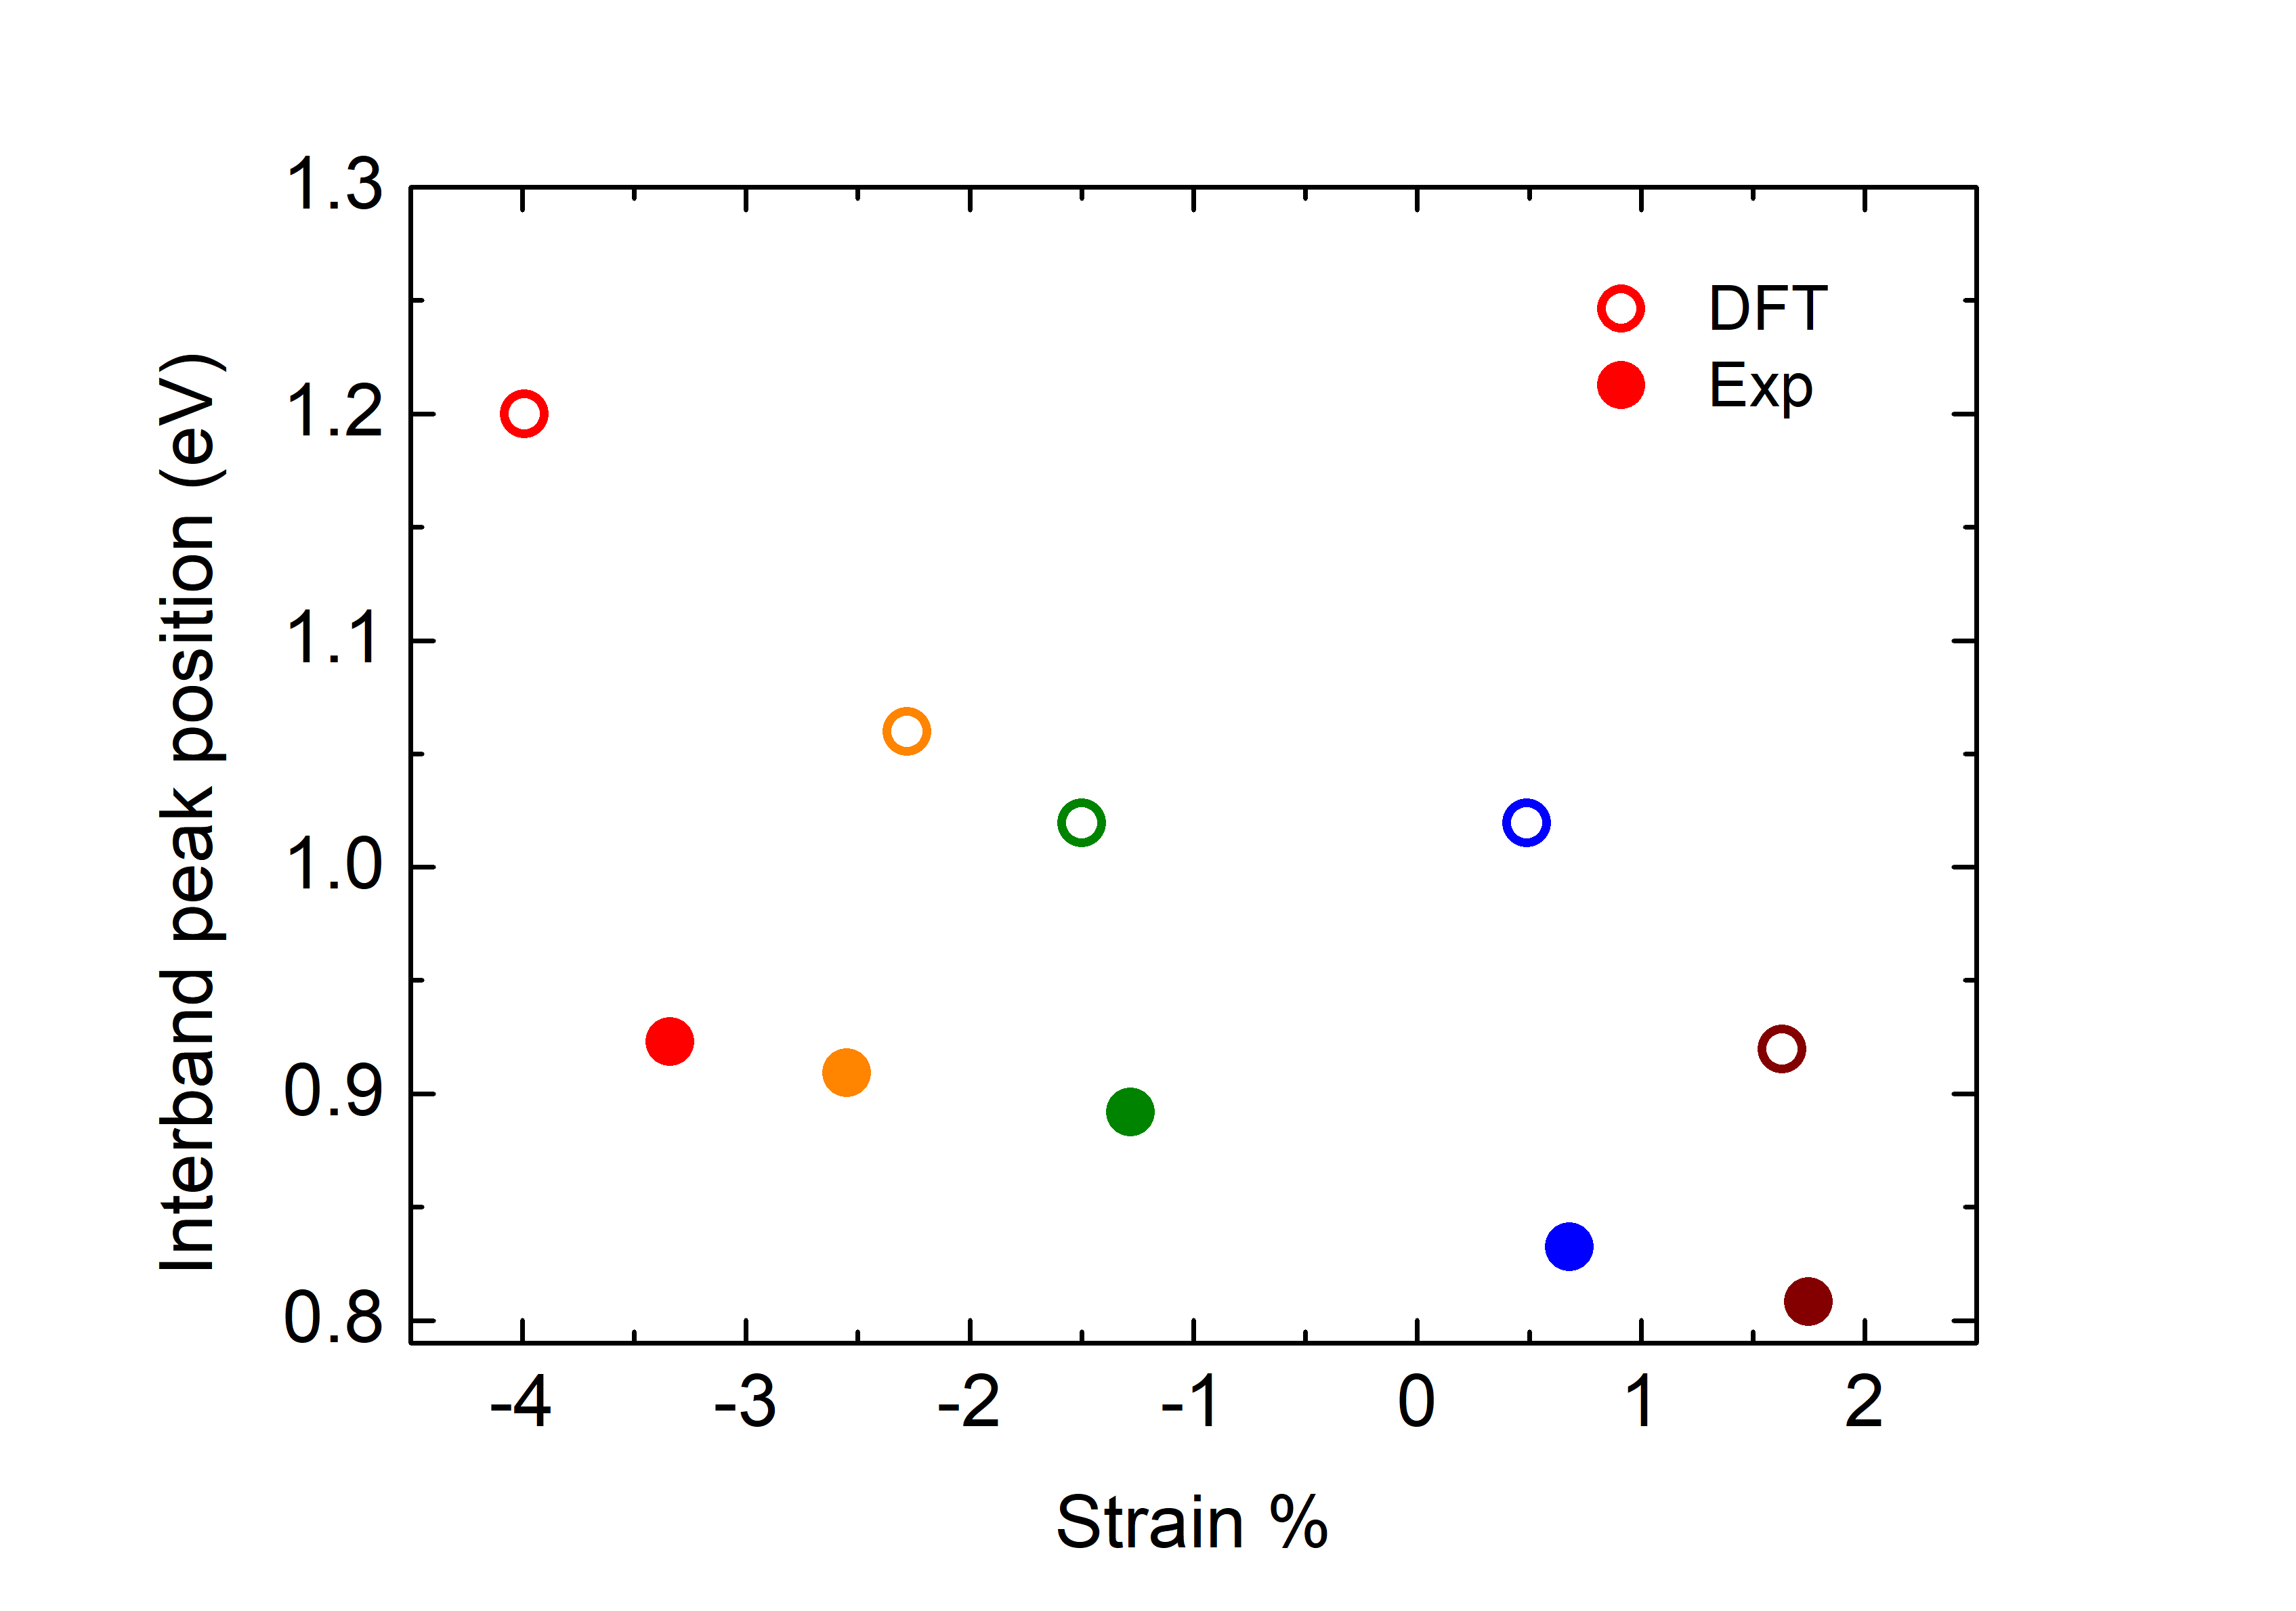
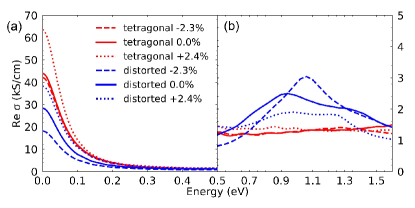
The optical conductivities at are shown in Fig. 2a. We observe a broad peak around , which has been reported previously for LaNiO3 Ouellette et al. (2010); Stewart et al. (2011) and for the metallic high temperature phase of RNiO3 with R = Sm, Nd Ruppen et al. (2015). The spectrum at low frequencies is dominated by the zero energy mode due to the free carrier response. For frequencies above approximately the optical conductivity falls well above the tail of the Drude peak. Empirically this line shape resembles a superposition of a broad Drude peak ( = ) and a narrow one ( ). Given that the two-Drude fit only captures the gross features in the infrared part of the spectrum, and finer details are buried by the strong phonon peaks of substrate and film, it is not possible to provide a detailed analysis of the scattering rate. We note however that the superposition of a broad and a narrow Drude peak is expected for a Fermi-liquid Berthod et al. (2013) for which the quasi-particle scattering rate has the following frequency dependence Götze and Wölfle (1972); Berthod et al. (2013): . Indeed, the narrow peak corresponds to the frequency range dominated by the constant part of the scattering rate, while the broader one is due to the frequency-dependent term. This observation supports the well-established Fermi-like temperature dependence of the resistivity of bulk and thick film LaNiO3 below Sreedhar et al. (1992); Son et al. (2010). In thin films the exponent is usually lower Scherwitzl et al. (2011); Scherwitzl (2012). Recently LaNiO3 films on LSAT substrates were found to show -linear resistivity below 1 K as a result of magnetic impurity-induced short-range antiferromagnetic fluctuations Liu et al. (2020). We note that the peak position, indicated in Fig. 3, decreases gradually going from the most compressive to the most tensile strain.
We also determined the integrated spectral weight, defined as:
| (1) |
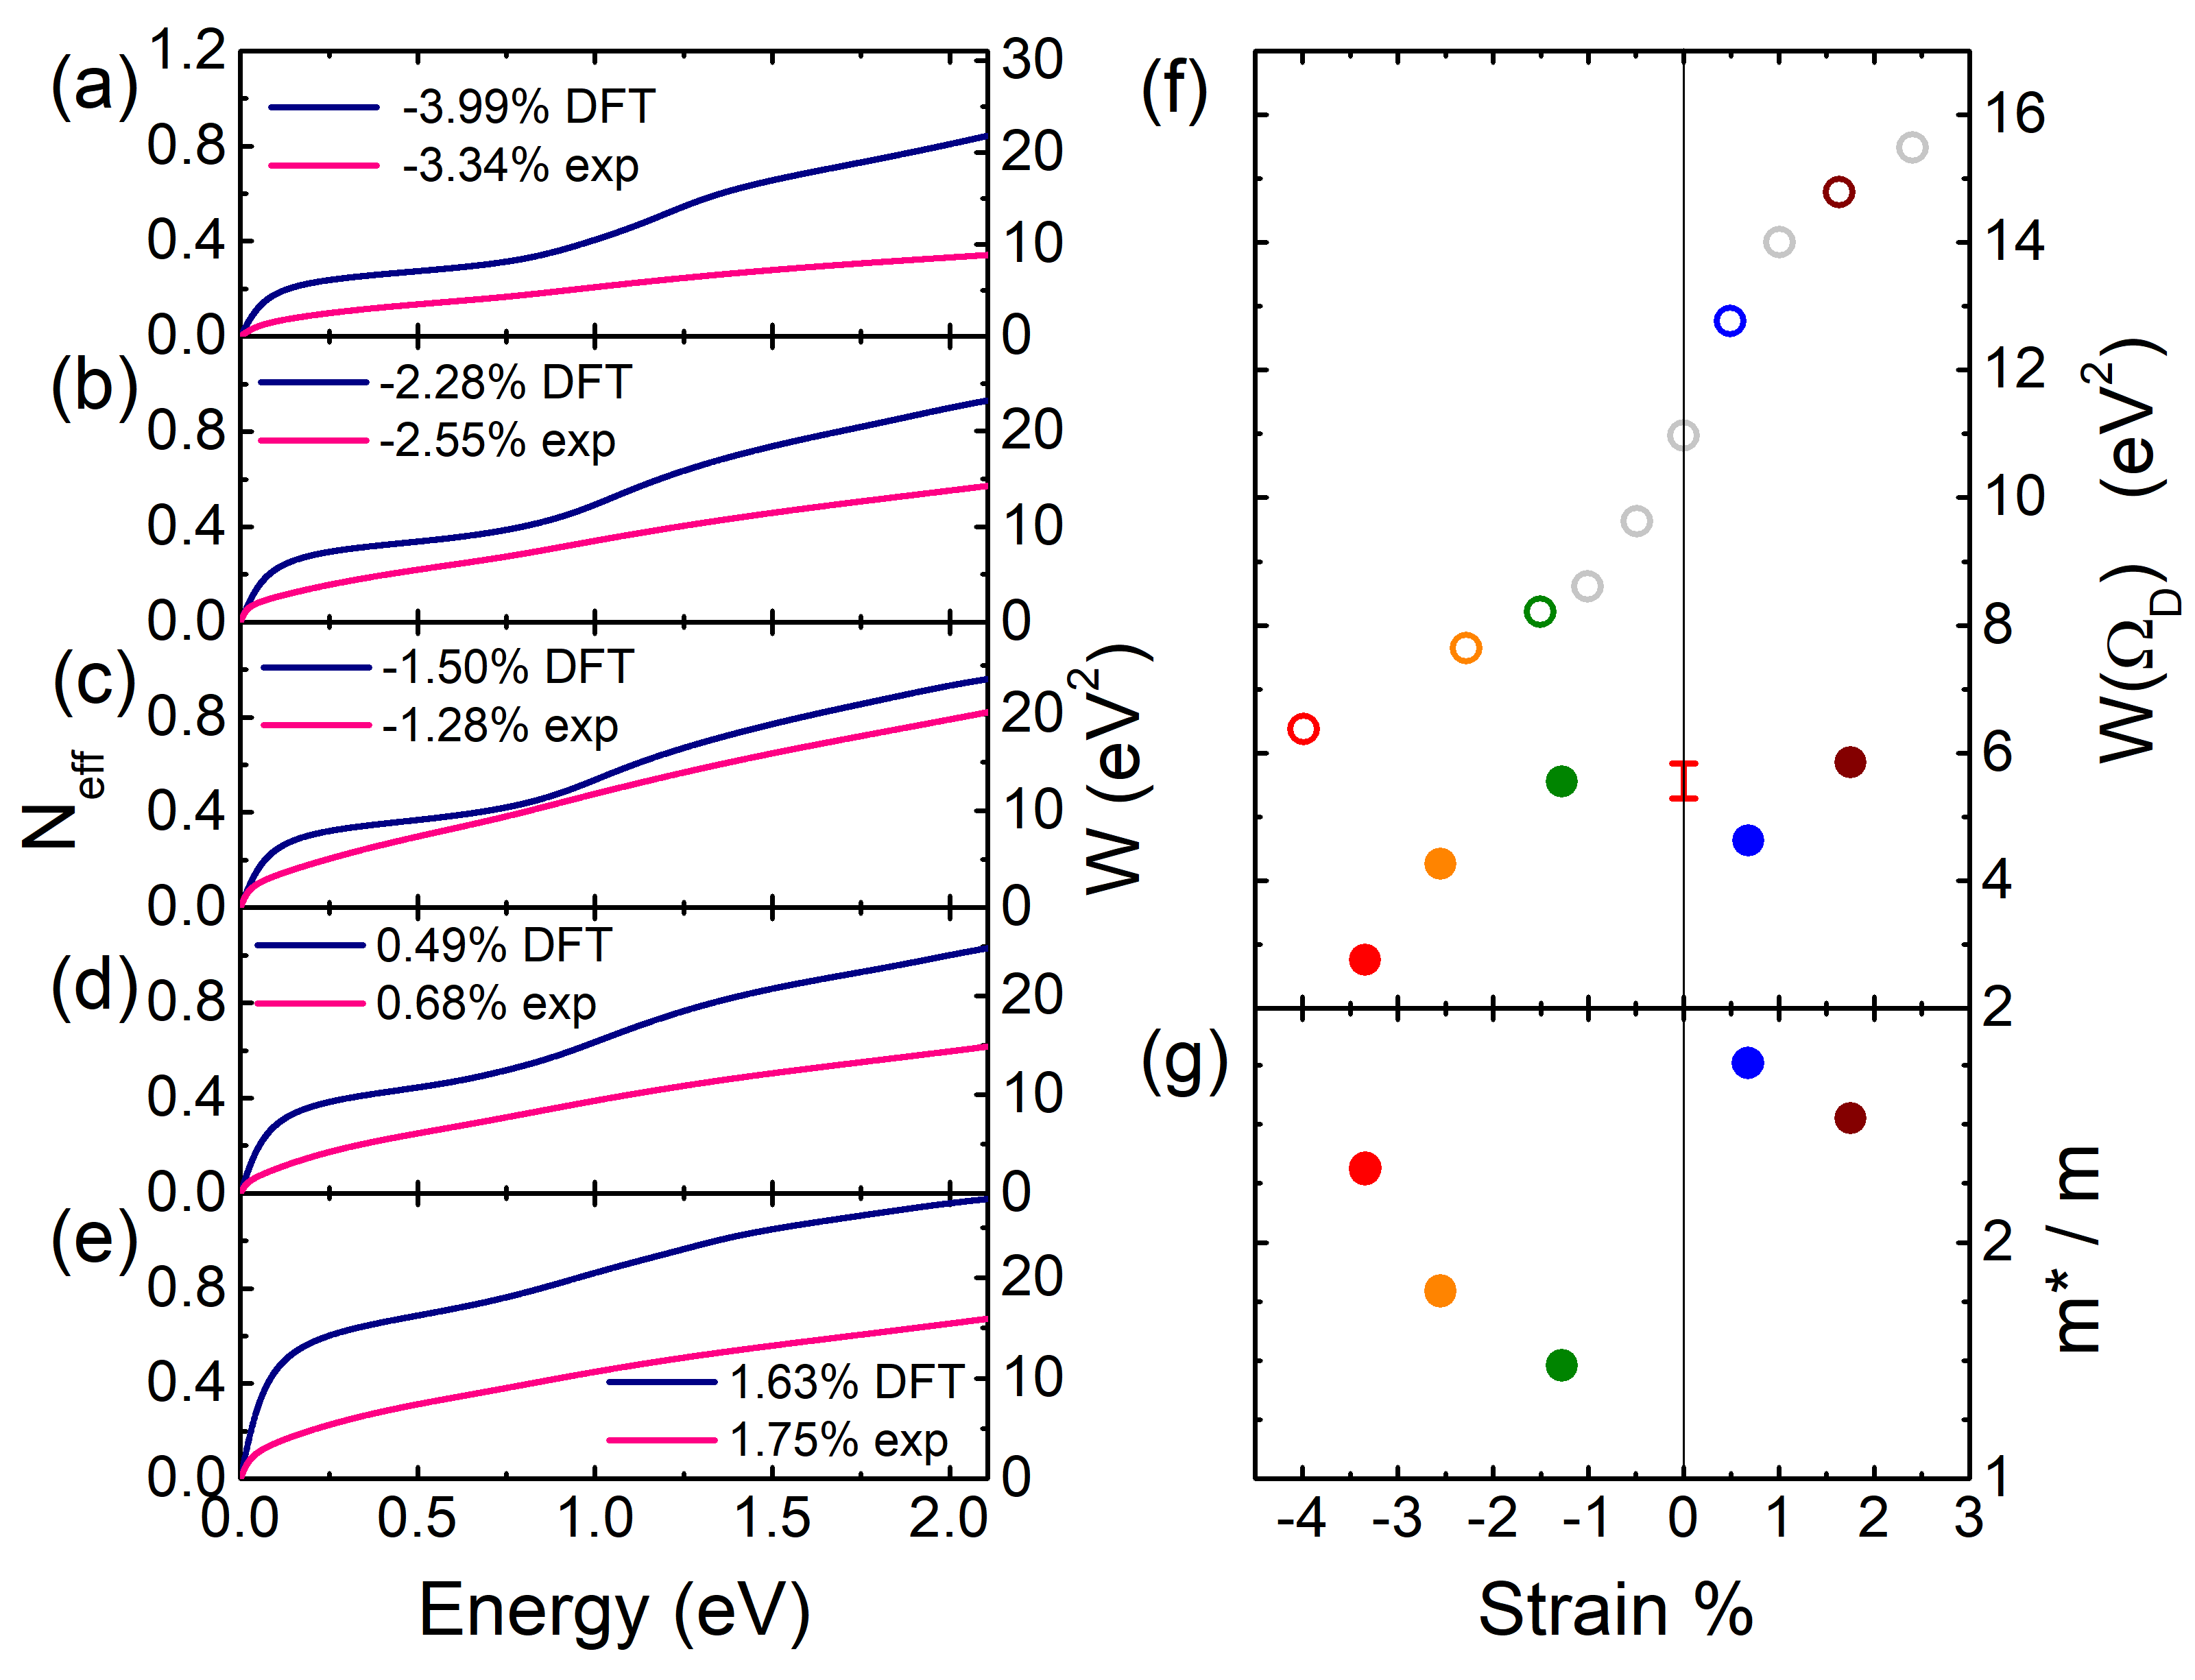
where is the volume of one formula unit, the reduced Planck constant, and the electron charge and mass respectively. The resulting experimental and theoretical effective number of carriers are displayed in Fig. 4a-e. By virtue of the -sum rule the limiting value of for corresponds to the number of electrons per formula unit, and the spectral weight in this limit corresponds to the squared plasma frequency of all (core and conduction) electrons: . Of particular interest is the spectral weight of the narrow Drude peak, corresponding to , taking which is well above the Drude width but small enough not to include interband transitions and mid-infrared spectral weight. The values of as a function of strain are displayed in Fig. 4f. A key observation is that the experimental data display an overall increase of the Drude weight by approximately a factor of two when going from the most compressive to the most tensile strain. It increases from most compressive to -1.3 strain, suddenly drops between -1.3 and +0.68 and then increases again when the tensile strain increases to 1.75%.
III Strain dependence of the electronic structure
We have performed electronic band structure calculations using density functional theory (DFT), and display the computed optical conductivities of this compound in the aforementioned range of strain values in Fig. 2b (for calculation details see Appendix B). We see that the overall frequency dependence of the experimental data in Fig. 2a as a function of strain is qualitatively well accounted for by the DFT results.
By comparing to calculations for a (hypothetical) tetragonal structure without NiO6 octahedral distortions (see Fig. 5), we obtain direct evidence that the broad peak around is due to optical inter-band transitions, being allowed as a result of the band-backfolding occurring in the distorted structure.
The lowering of symmetry and the presence of two Ni atoms per unit cell allow for optical transitions that would otherwise be forbidden in the undistorted tetragonal structure. The decrease of the position of this peak from compressive to tensile strain displayed in Fig. 3 is also qualitatively captured by the DFT calculations.
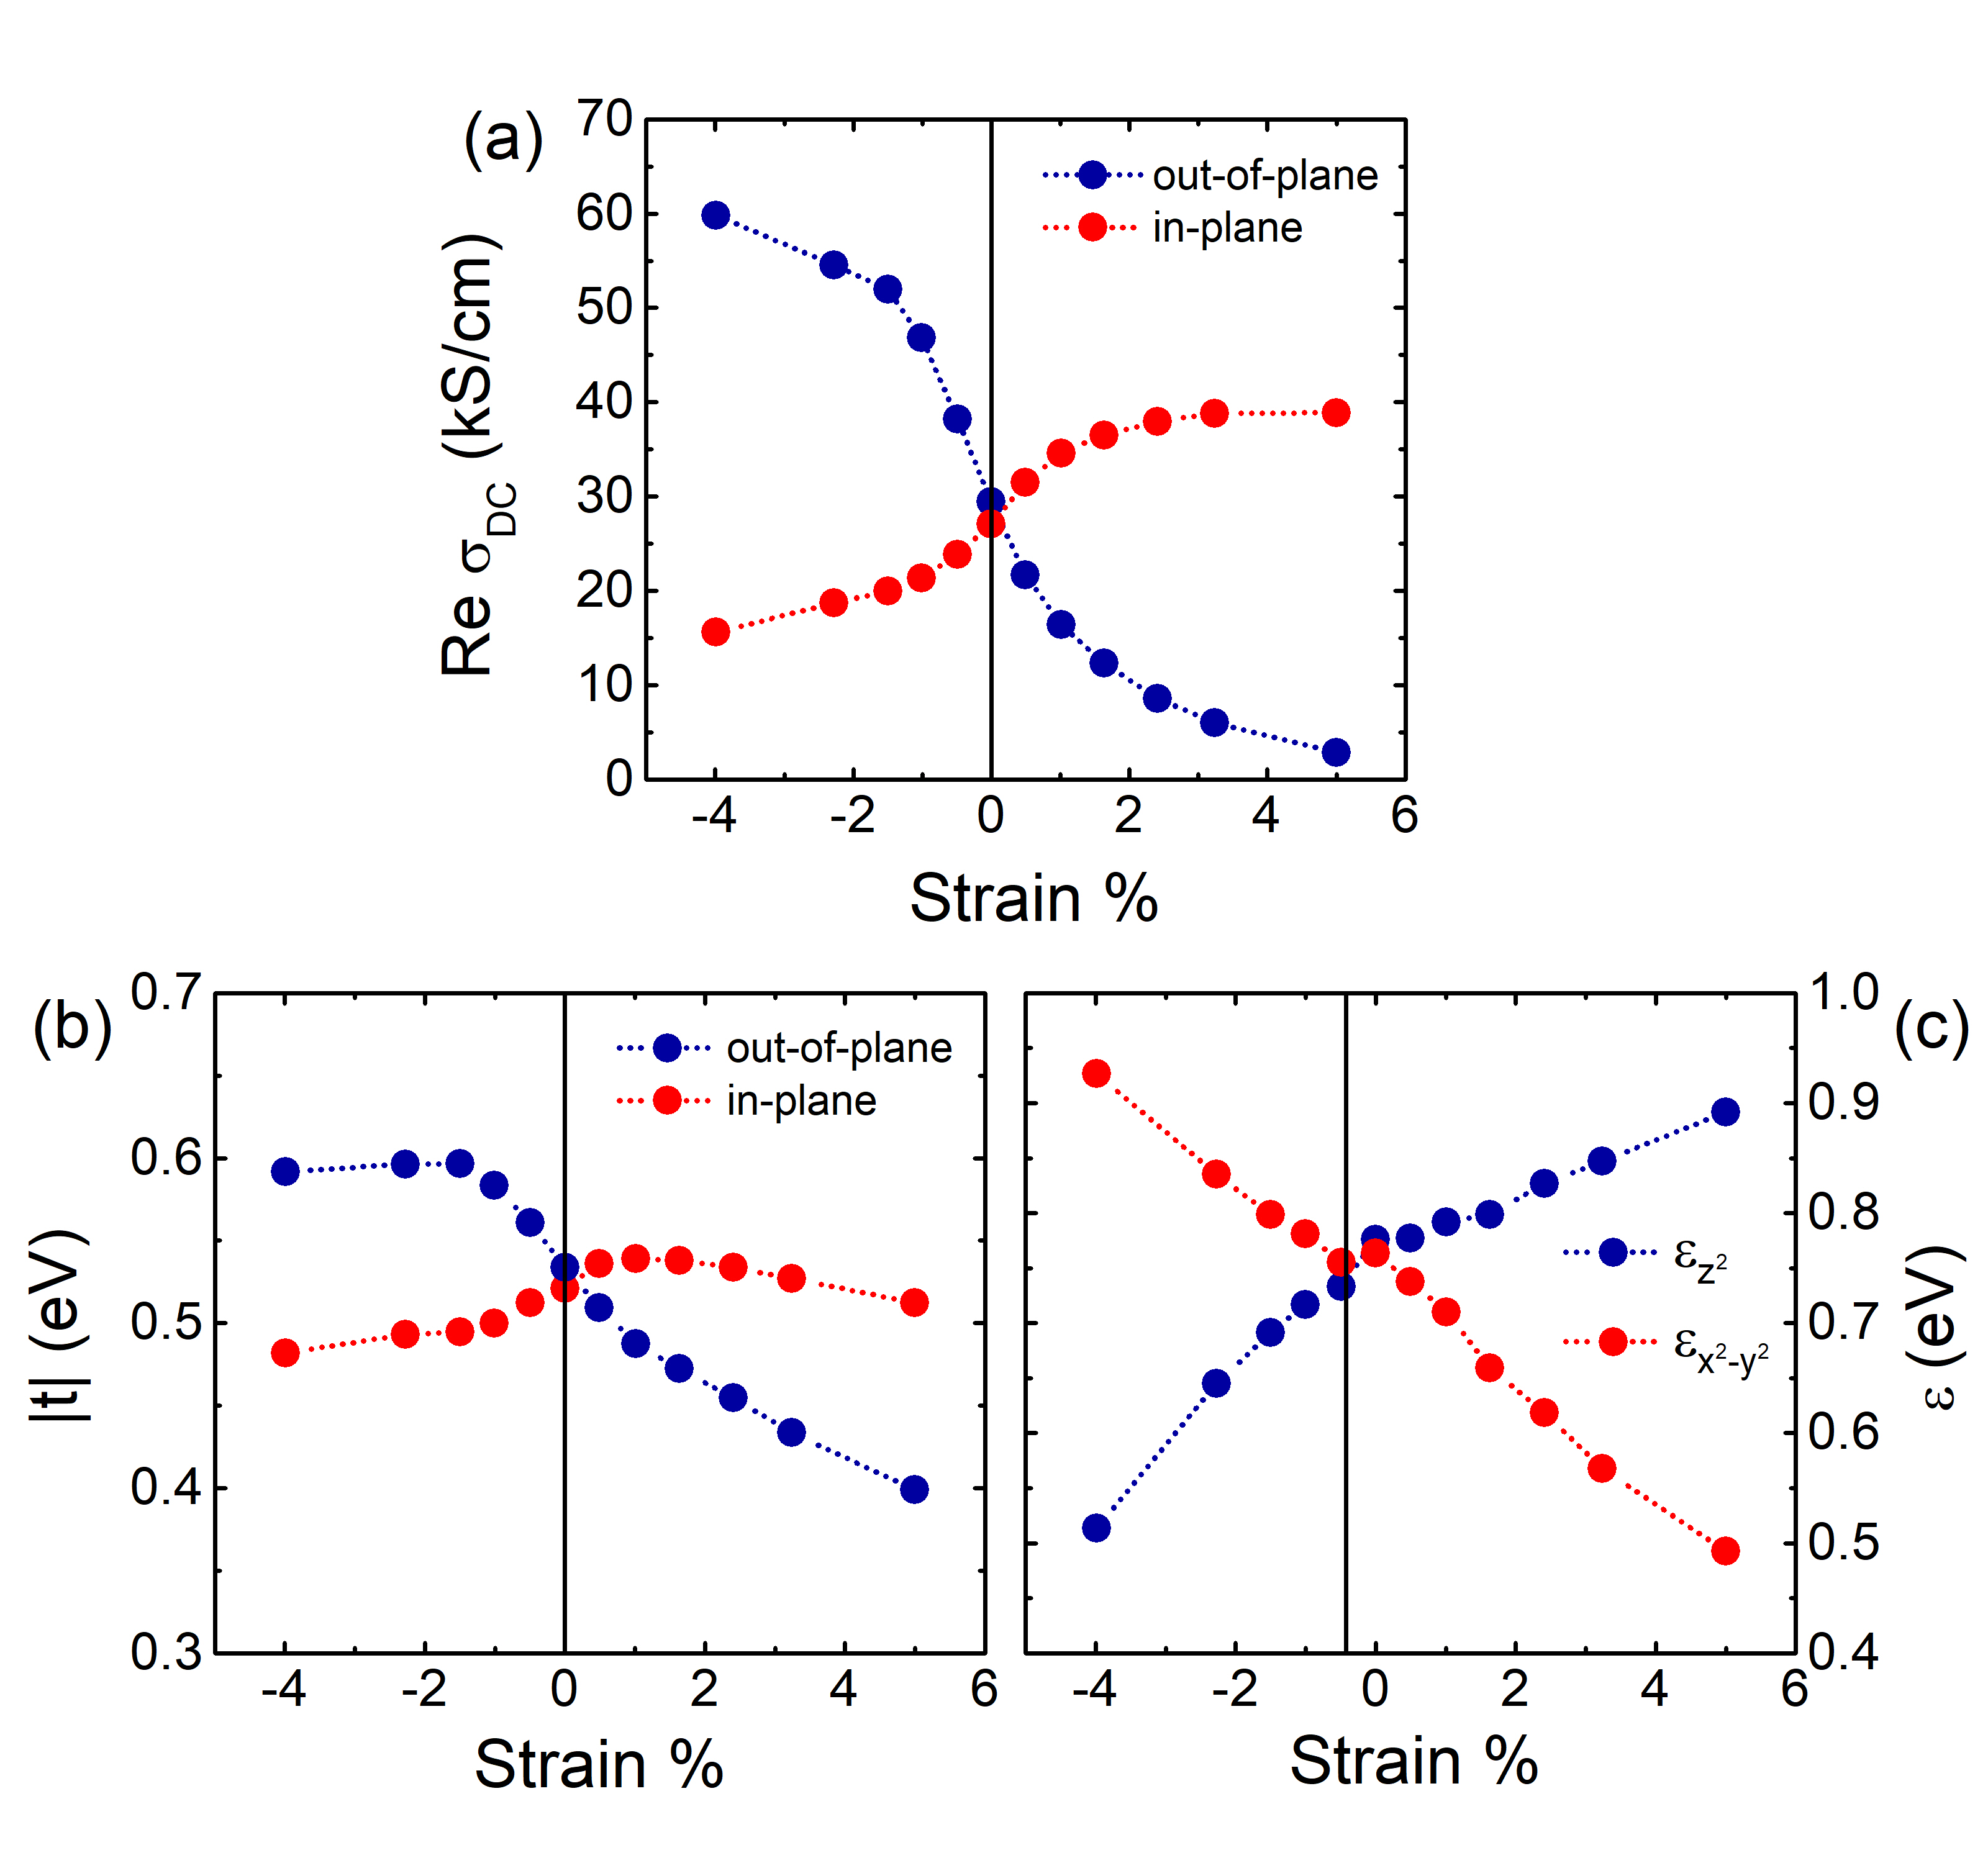
We compare in Fig. 4 the computed (DFT) values of the spectral weight as a function of strain with the experimental data. A key observation is that experiment and computation both display an overall increase of the Drude weight (Fig. 4f) by approximately a factor of two when going from the most compressive to the most tensile strain. This trend may appear as counter-intuitive: one might have expected an overall decrease of the inter-atomic in-plane hopping strength, and hence of , when atoms get farther away from one another under tensile strain. Our DFT calculations correspondingly yield the opposite trend of a decrease of the out-of-plane Drude weight and conductivity from compressive to tensile (see Appendix B and Fig. 6), a prediction which we leave for future experimental confirmation. Explaining these apparently counter-intuitive trends is one of the main emphases of our work.
A striking feature of the DFT calculations – absent from the experimental data – is the sharp increase between -1% and +1% strain. The experimental values even show a slight dip at +0.7% strain. 111Since the measured optical response depends on the film thickness, one may suspect that this discrepancy could result from assuming the wrong value for the film thickness, or from the presence of a dead (i.e. insulating) layer. However, the thicknesses of these films are accurately known from X-ray diffraction. Since even for the insulating phase of RNiO3 the spectral weight in the visible part of the spectrum is not so different from the metallic phase Ruppen et al. (2015), the assumption of a dead layer cannot explain the low value of Neff(2eV) for the tensile samples. Moreover, transport experiments on films on LaAlO3 as a function of film thickness have demonstrated that the films switch as a whole from metal to insulator at a critical thickness Fowlie et al. (2017). The other observation from Fig. 4f is that the experimental Drude weight is systematically smaller than the DFT computed value, leading to effective masses of around two (see Fig. 4g and further discussion below): this is a hallmark of correlation effects.
These two observations are not limited to the low-frequency Drude weight but apply to the integrated spectral weight for all measured frequencies, as shown in Fig. 4a-e. The experimental optical conductivity at negative strain shows a clear peak at eV separated from the Drude peak by a minimum at eV. For positive strain there is a weak maximum, almost a shoulder, at eV. In the theoretical spectra we also see that the minimum at eV is constant for negative strain, and starts to fill up for positive strain. While experiment and DFT agree on this qualitative aspect, the spectral weight evolves differently in theory and experiment when passing from negative to positive strain.
To analyze this further it is of interest to make an estimate of the mass enhancement by comparing the measured and calculated spectral weights of the Drude peak:
| (2) |
The mass enhancement, shown in Fig. 4g, is between about and , consistent with previous reports Ouellette et al. (2010); Stewart et al. (2011); King et al. (2014). Based on dynamical mean-field theory calculations, this is the expected range of mass enhancements resulting from the on-site Hubbard and Hund’s rule interactions in these compounds Ouellette et al. (2010); Stewart et al. (2011); Deng et al. (2012); Peil et al. (2014); Nowadnick et al. (2015); Yoo et al. (2015). Most members of the RNiO3 family exhibit a metal-insulator transition which has been characterized as a ‘site selective’ Mott transition Park et al. (2012); Subedi et al. (2015). While LaNiO3 remains metallic at all temperatures, it is overwhelmingly natural to assume that the Hubbard and Hund’s -interaction play an important role in the physical properties of this material. One of the most typical consequences of the on-site interaction is a transfer of optical spectral weight from the free carrier response of the Ni band to high energy Basov et al. (2011). Consequently most of the missing free carrier spectral weight is recovered in the oxygen- to Ni- transitions which span over approximately 10 eV. The fact that in Fig. 4a-e the spectral weight difference between experiment and DFT persists up to 2 eV is therefore a strong indication that the low energy spectral weight is suppressed by the Hubbard and Hund’s -interaction.
In order to understand the evolution of the electronic structure as a function of strain, we now turn to an in-depth analysis of how the structural changes evolve as a function of strain and, in turn, how they affect electronic structure as computed from DFT – this is the focus of Figs. 7 and 8.
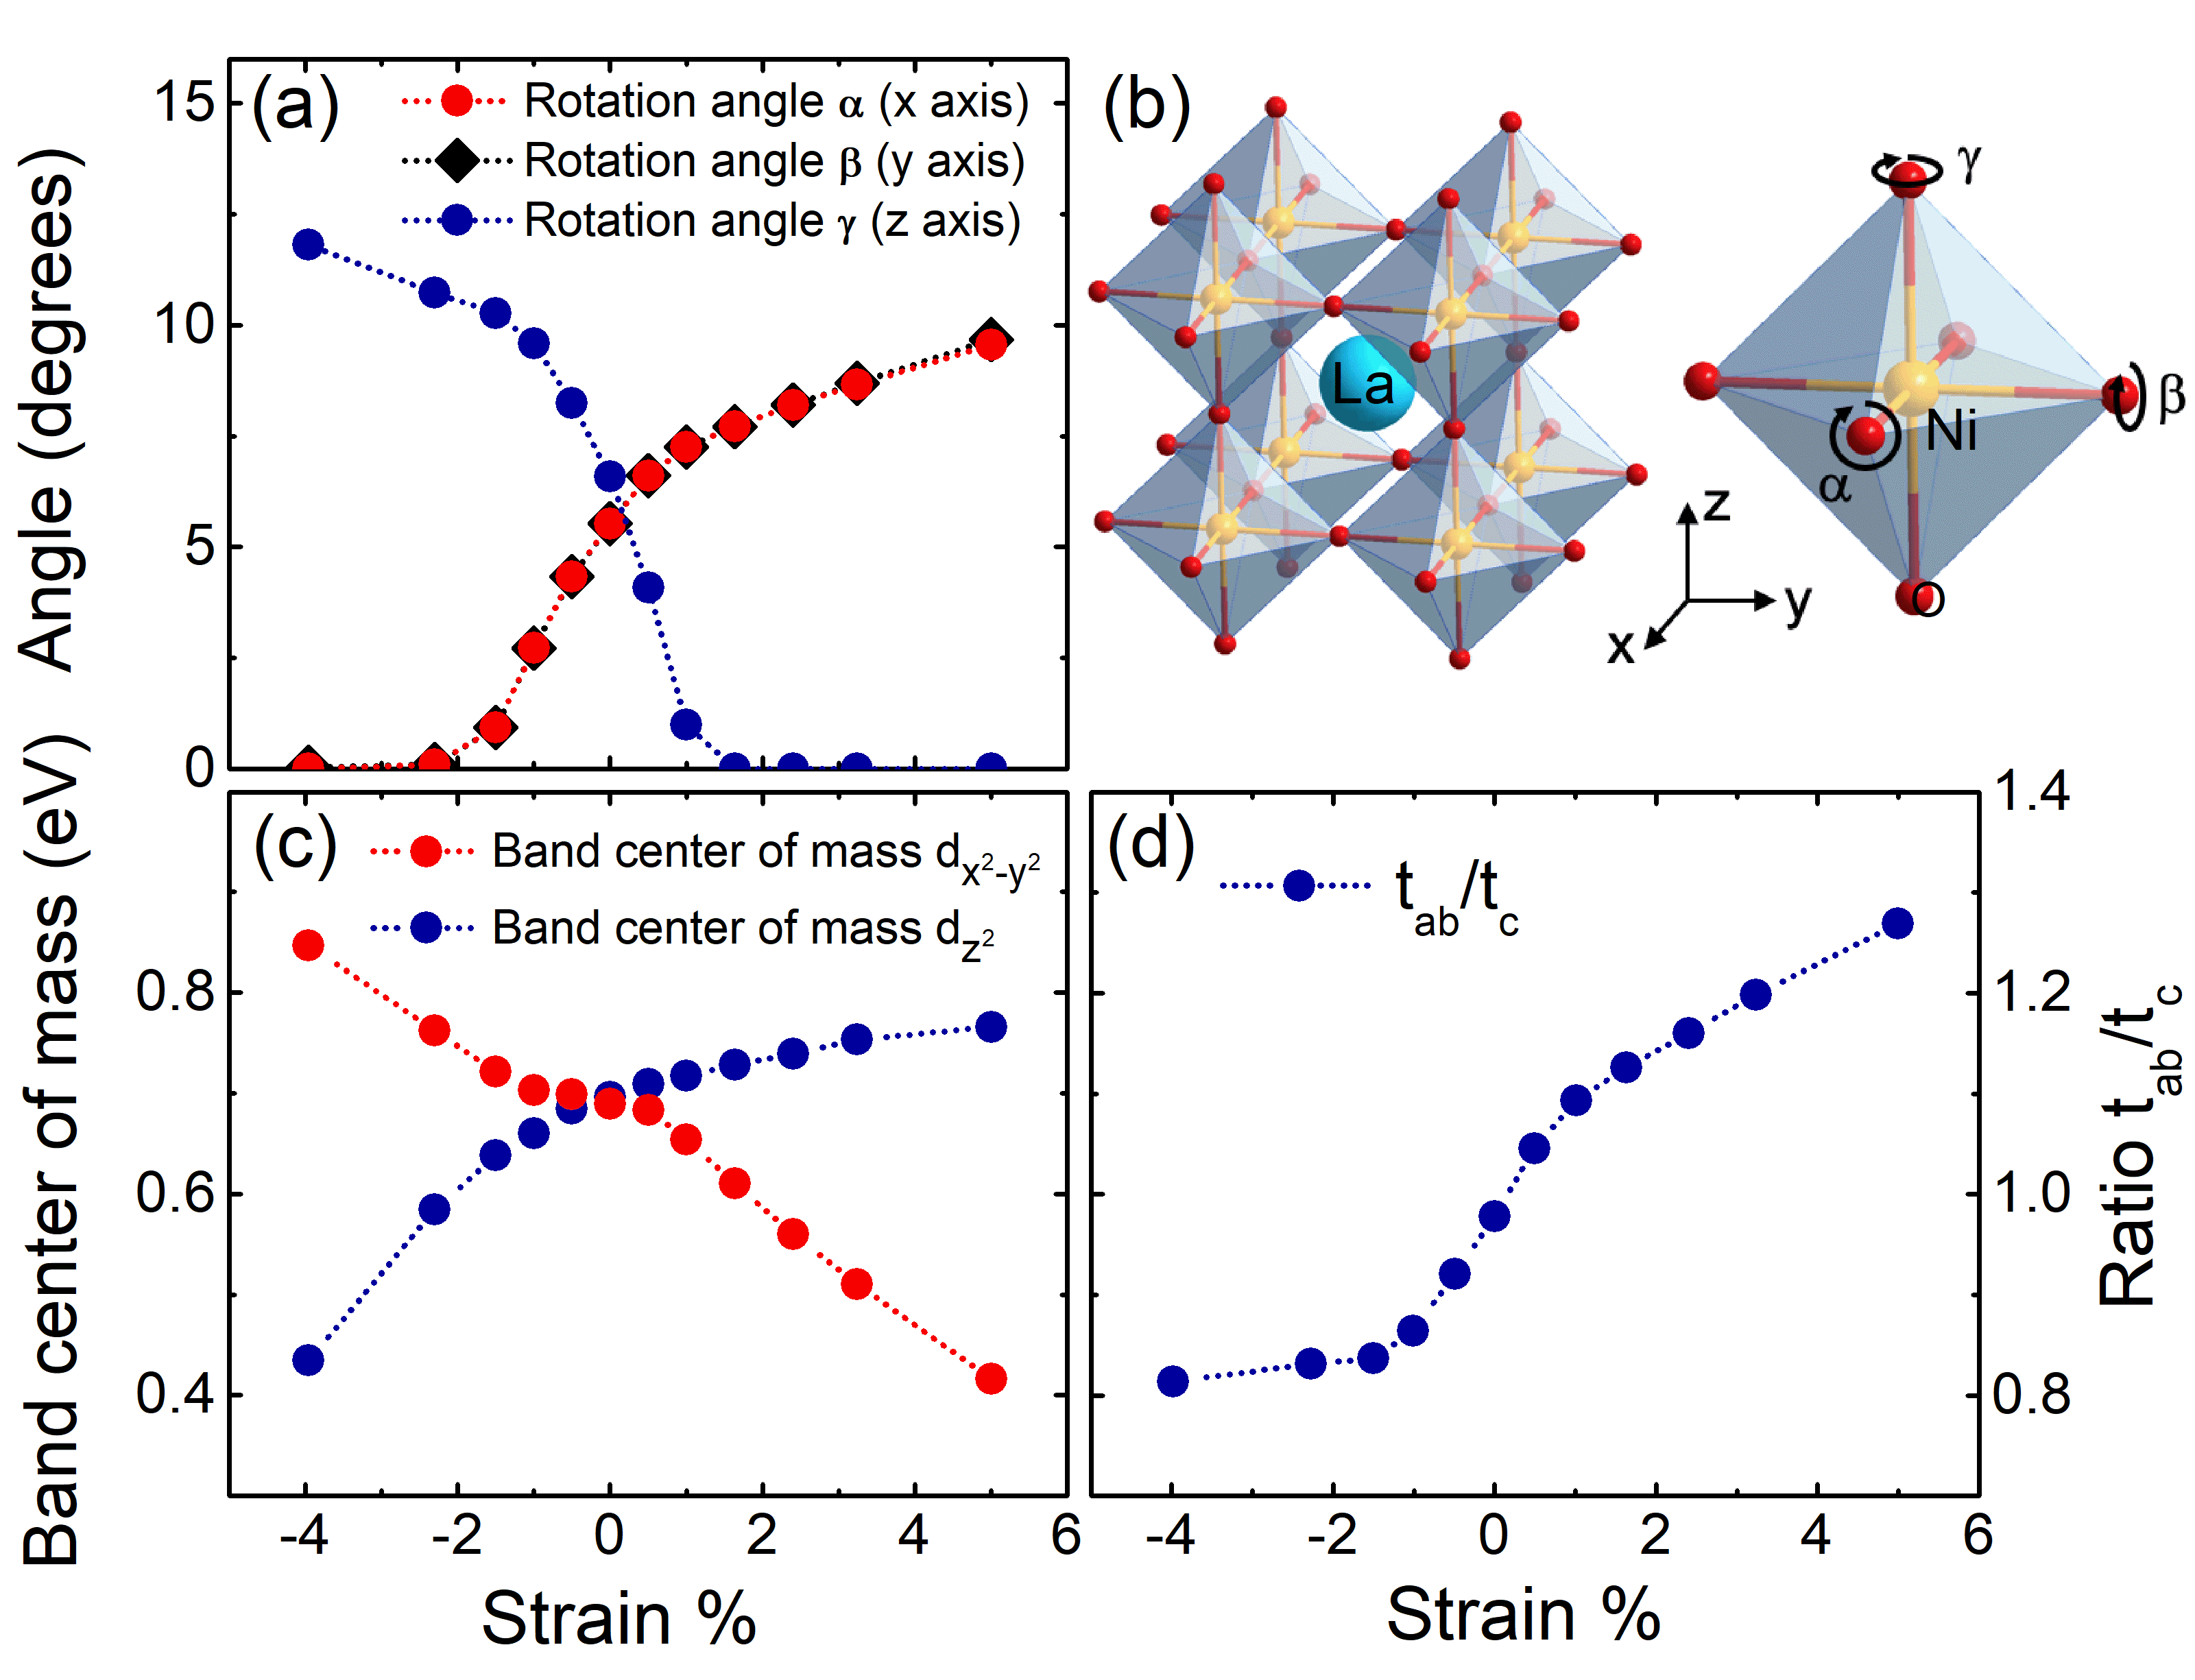
The first important consideration is a structural one. Fig. 7a displays the strain dependence of the rotations of the NiO6 octahedra with respect to the () axis (‘tilts’) and with respect to the -axis (‘rotations’), as obtained from our DFT structural relaxation calculations (see Appendix B for details). As reported in previous work May et al. (2010); Peil et al. (2014), tensile strain promotes tilts and suppresses rotations, while compressive strain has the opposite effect. As a consequence, tensile strain distorts the out-of-plane Ni-O-Ni bond, keeping the in-plane bond angles almost unchanged Fowlie et al. (2019), making the (oxygen mediated) effective nickel-nickel in-plane hopping more favorable than the out-of-plane hopping. Fig. 7d displays the ratio of in-plane to out-of-plane Ni-Ni effective hopping , obtained from a maximally localized Wannier function construction Marzari and Vanderbilt (1997); Souza et al. (2001); Pizzi et al. (2019) for Ni-centered orbitals of symmetry (see Appendix B). This ratio is seen to increase from about 0.8 to 1.2 when going from compressive to tensile strain. At the same time, the compression of the c-axis under tensile strain leads to an energetic destabilization of the out-of-plane antibonding orbital in comparison to the in-plane one.
Fig. 7c displays the intra- crystal field splitting (relative stabilization energy of the in-plane orbital), defined from the center of mass of each band (the first moment), which is negative for tensile strain and positive for compressive strain. Both effects, the favoring of the in-plane hopping and the stabilization of the orbital, give rise to an increase of the conductivity when going from compressive to tensile strain. These considerations provide an insight into the important factors to explain the behavior of the conductivity.
However, the low-frequency (Drude) part of the spectral weight is essentially a Fermi surface property, and the observed changes in the optical response therefore motivate a detailed analysis of the DFT Fermi surface.
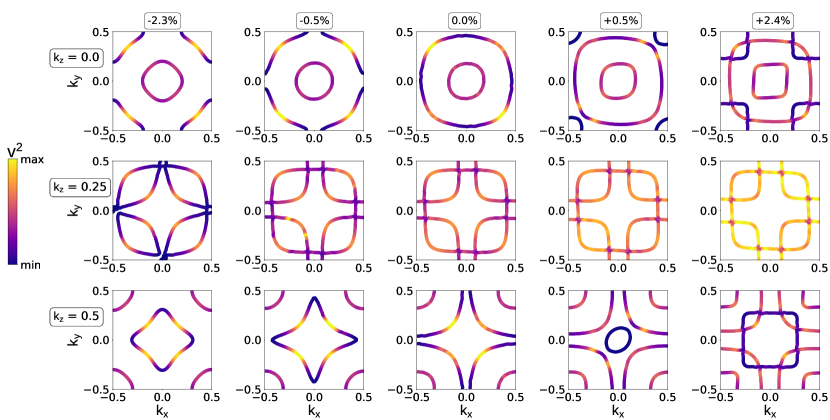
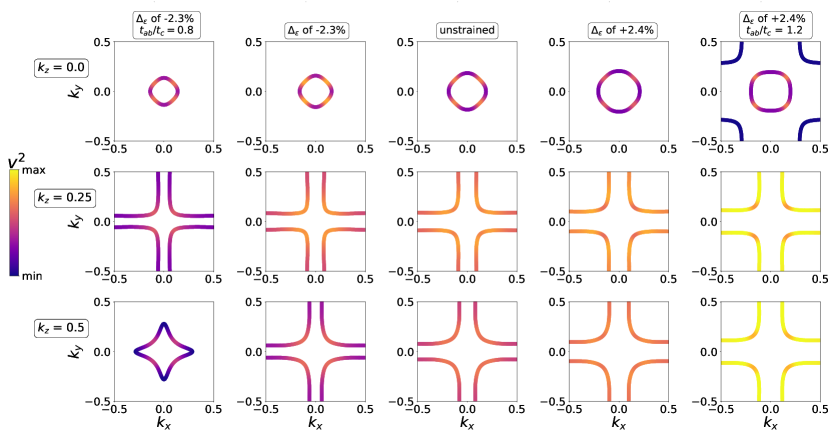
In Fig. 8 we display the calculated Fermi surfaces for five values of strain, as in-plane cuts for three different values of the out-of-plane momentum . The striking observation is that a transition in the topology of the Fermi surface (Lifshitz transition) is found as soon as a small strain is applied to the unstrained compound, for both compressive and tensile strain. Focusing for example on the cut, we see that an additional Fermi surface sheet appears at the zone corner when a small tensile strain is applied, while the outer Fermi surface sheet switches from closed to open (i.e from -centered to -centered) under compressive strain. We have calculated the magnitude of the in-plane electronic velocity as the momentum varies along each Fermi surface sheet, and displayed the result in Fig. 8 as a color intensity map. This reveals the considerable increase of the in-plane velocity from compressive to tensile strain, especially visible e.g. for the cut.
Overall, our calculated Fermi surfaces are in good agreement with the ARPES data of Yoo et al. Yoo et al. (2015). Comparing the images in panels (c) and (d) of Fig. 3 from Ref. Yoo et al., 2015 (corresponding to compressive and tensile strains, respectively), one can clearly see at least one signature of the Lifshitz transition. Specifically, on going from compressive to tensile strain, a pocket at point (folded to point ) emerges. This is exactly the picture one can infer from our Fig. 8 ( cut, strains from -2.3 % to +2.4 %). Another notable feature is a star-shaped sheet visible both in our Fig. 8 ( cut, strains -0.5 % and -2.3 %) and in Fig. 3(c) of Ref. Yoo et al., 2015 displaying the plane. It seems to us that the precise topology of this sheet is harder to determine unambiguously from the reported ARPES data. This sheet is definitely open at tensile strains and its neck is defined by a flat band close to the Fermi level (the band along in Fig. 1 of Ref. Yoo et al., 2015 and the -like band along in our Fig. 11). Both in our DFT results and in ARPES the band moves up when going from tensile to compressive strain. However, while in our calculations it clearly crosses the Fermi level at a strain slightly below zero, thus closing the star-shaped sheet, its fate is less clear in ARPES data at -1.3 % strain. Yoo et al. infer the band position from the maxima of the energy-distribution curves (EDCs) and the results shown in Fig. 1 of Ref. Yoo et al., 2015 indicate that at -1.3 % the -band is still below the Fermi level. However, the band is very flat and lies very close to the Fermi level, and a more detailed analysis of the data may be necessary. Nevertheless, the comparison of trends observed in our calculations and in ARPES suggests that the star-shaped sheet closes at some value of the strain on the compressive side, even if slightly below -1.3 % strain. Hence we conclude that there is overall reasonable qualitative agreement between our results and the ARPES data and a clear indication of a Fermi surface Lifshitz transition.
The strain dependence of the two key electronic structure parameters and can be directly connected to the evolution of the Fermi surface topology. We show in Appendix B that by starting from an Wannier model for the (hypothetical) tetragonal structure without octahedral rotations and tilts, the calculated DFT trends in the Fermi surface can be semi-quantitatively explained when these two parameters are varied. We encourage the reader to explore this further with an interactive applet that we provide online Bin . We emphasize that the evolution of the hopping anisotropy () and the change in the crystal-field splitting () both result, when taken into account separately, in a decrease of the Drude weight when strain is increased. However, the magnitude of the changes seen in the conductivity (factor of two), as well as the evolution of the Fermi surface, can only be understood when both ingredients are considered together.
Taken together, our findings on the calculated electronic structure provide a consistent explanation of the overall trends for the strain dependence of the optical spectra, and in particular explain why tensile strain leads to an increase of the Drude weight and optical conductivity. We note that a Lifshitz Fermi surface transition under strain has indeed been observed by ARPES spectroscopy for this material Yoo et al. (2015).
IV Conclusions
In conclusion, our optical measurements reveal a remarkable sensitivity of the electronic structure of LaNiO3 to strain. In contrast to naive intuition, the in-plane low-frequency Drude weight increases by a factor close to two when we lattice-tune the material from highly compressive (-3.34%) to moderate tensile (+1.75%) biaxial strain. Our density functional theory calculations reveal that these effects are due to drastic changes of the electronic structure under strain, caused by the changes in tilts and rotations of the NiO6 octahedra. Our DFT calculations reveal a topological change of the Fermi surface (Lifshitz transition), which strongly modifies the velocity of carriers on the different Fermi surface sheets. We have provided a simple explanation of the evolution of the topology of the Fermi surface and of these trends, based on the changes of both the crystal field splitting and ratio of in-plane to out-of-plane hopping under strain. A prediction of our theory is that the Drude weight associated with the out-of-plane conductivity should correspondingly decrease from compressive to tensile strain. Our experimental results also reveal that interaction effects are sensitive to strain, with an enhancement factor of the optical effective mass ranging between about and . The evolution of the electronic structure ultimately results from the structural changes under strain (rotations, tilts and aspect ratio of the octahedra), illustrating the rich interplay between structural and electronic aspects of transition-metal oxides. This interplay can be leveraged in tuning electronic functionalities of oxides by strain engineering. Strain tuning of the electronic structure of LaNiO3 and the detailed theoretical description thereof provide important tools for extending the use of this material in applications such as electrodes, gas-sensing and catalysis Catalano et al. (2018).
V Acknowledgements.
This project was supported by the Swiss National Science Foundation project 200020-179157 (DvdM), 200021-163103 (ABK), 200020-185061 (ABK), 200020-179155 (JMT), NCCR MARVEL (HS, OP), the European Research Council project 319286-QMAC (AG, JMT), and the Österreichische Forschungsförderungsgesellschaft COMET program IC-MPPE project 859480 (OP). The Flatiron Institute is a division of the Simons Foundation. NB acknowledges P. Marsik for useful discussions regarding the THz ellipsometry setup.
Appendix A Thin film growth and characterization
| Substrate | YAlO3 | NdAlO3 | LaAlO3 | NdGaO3 | SrTiO3 |
| Space group | Pnma | Rc | Rc | Pnma | Pmm |
| Substrate (i) (Å) | 3.71 | 3.74 | 3.789 | 3.864 | 3.905 |
| Film -axis constant (ii) (Å) | 3.87 | 3.953 | 3.91 | 3.822 | 3.818 |
| Film cell volume (Å3) | 53.3 | 55.3 | 56.1 | 57.1 | 58.2 |
| Film strain | |||||
| Film thickness (uc)(iii) | 16 | 13 | 14 | 14 | 13 |
We used commercial single-crystal YAlO3, NdAlO3, LaAlO3, NdGaO3 and SrTiO3 substrates from CrysTec GmbH with a surface area and thickness. All surfaces were (001)-oriented in pseudo-cubic notation. Prior to deposition all substrates were thermally treated in flowing oxygen to ensure atomically-flat step-terrace surfaces. For each film/substrate a combination of two identical substrates was used at the same time to produce twin samples, one for optics and the other for DC transport measurements. The epitaxial LaNiO3 films were deposited via radio frequency off-axis magnetron sputtering at a temperature of in an oxygen:argon mix of 2:7 maintained at .
After deposition, the surface quality of the films was verified by atomic force microscopy and the step-terrace topography of the substrate was seen to be retained. The crystalline properties were checked using X-ray diffraction. Bragg-Brentano scans showed finite thickness oscillations, indicating a high quality film and providing the precise film thickness after fitting Lichtensteiger (2018) (see Table 1). The positions of the peaks gave the lattice constants of each film/substrate.
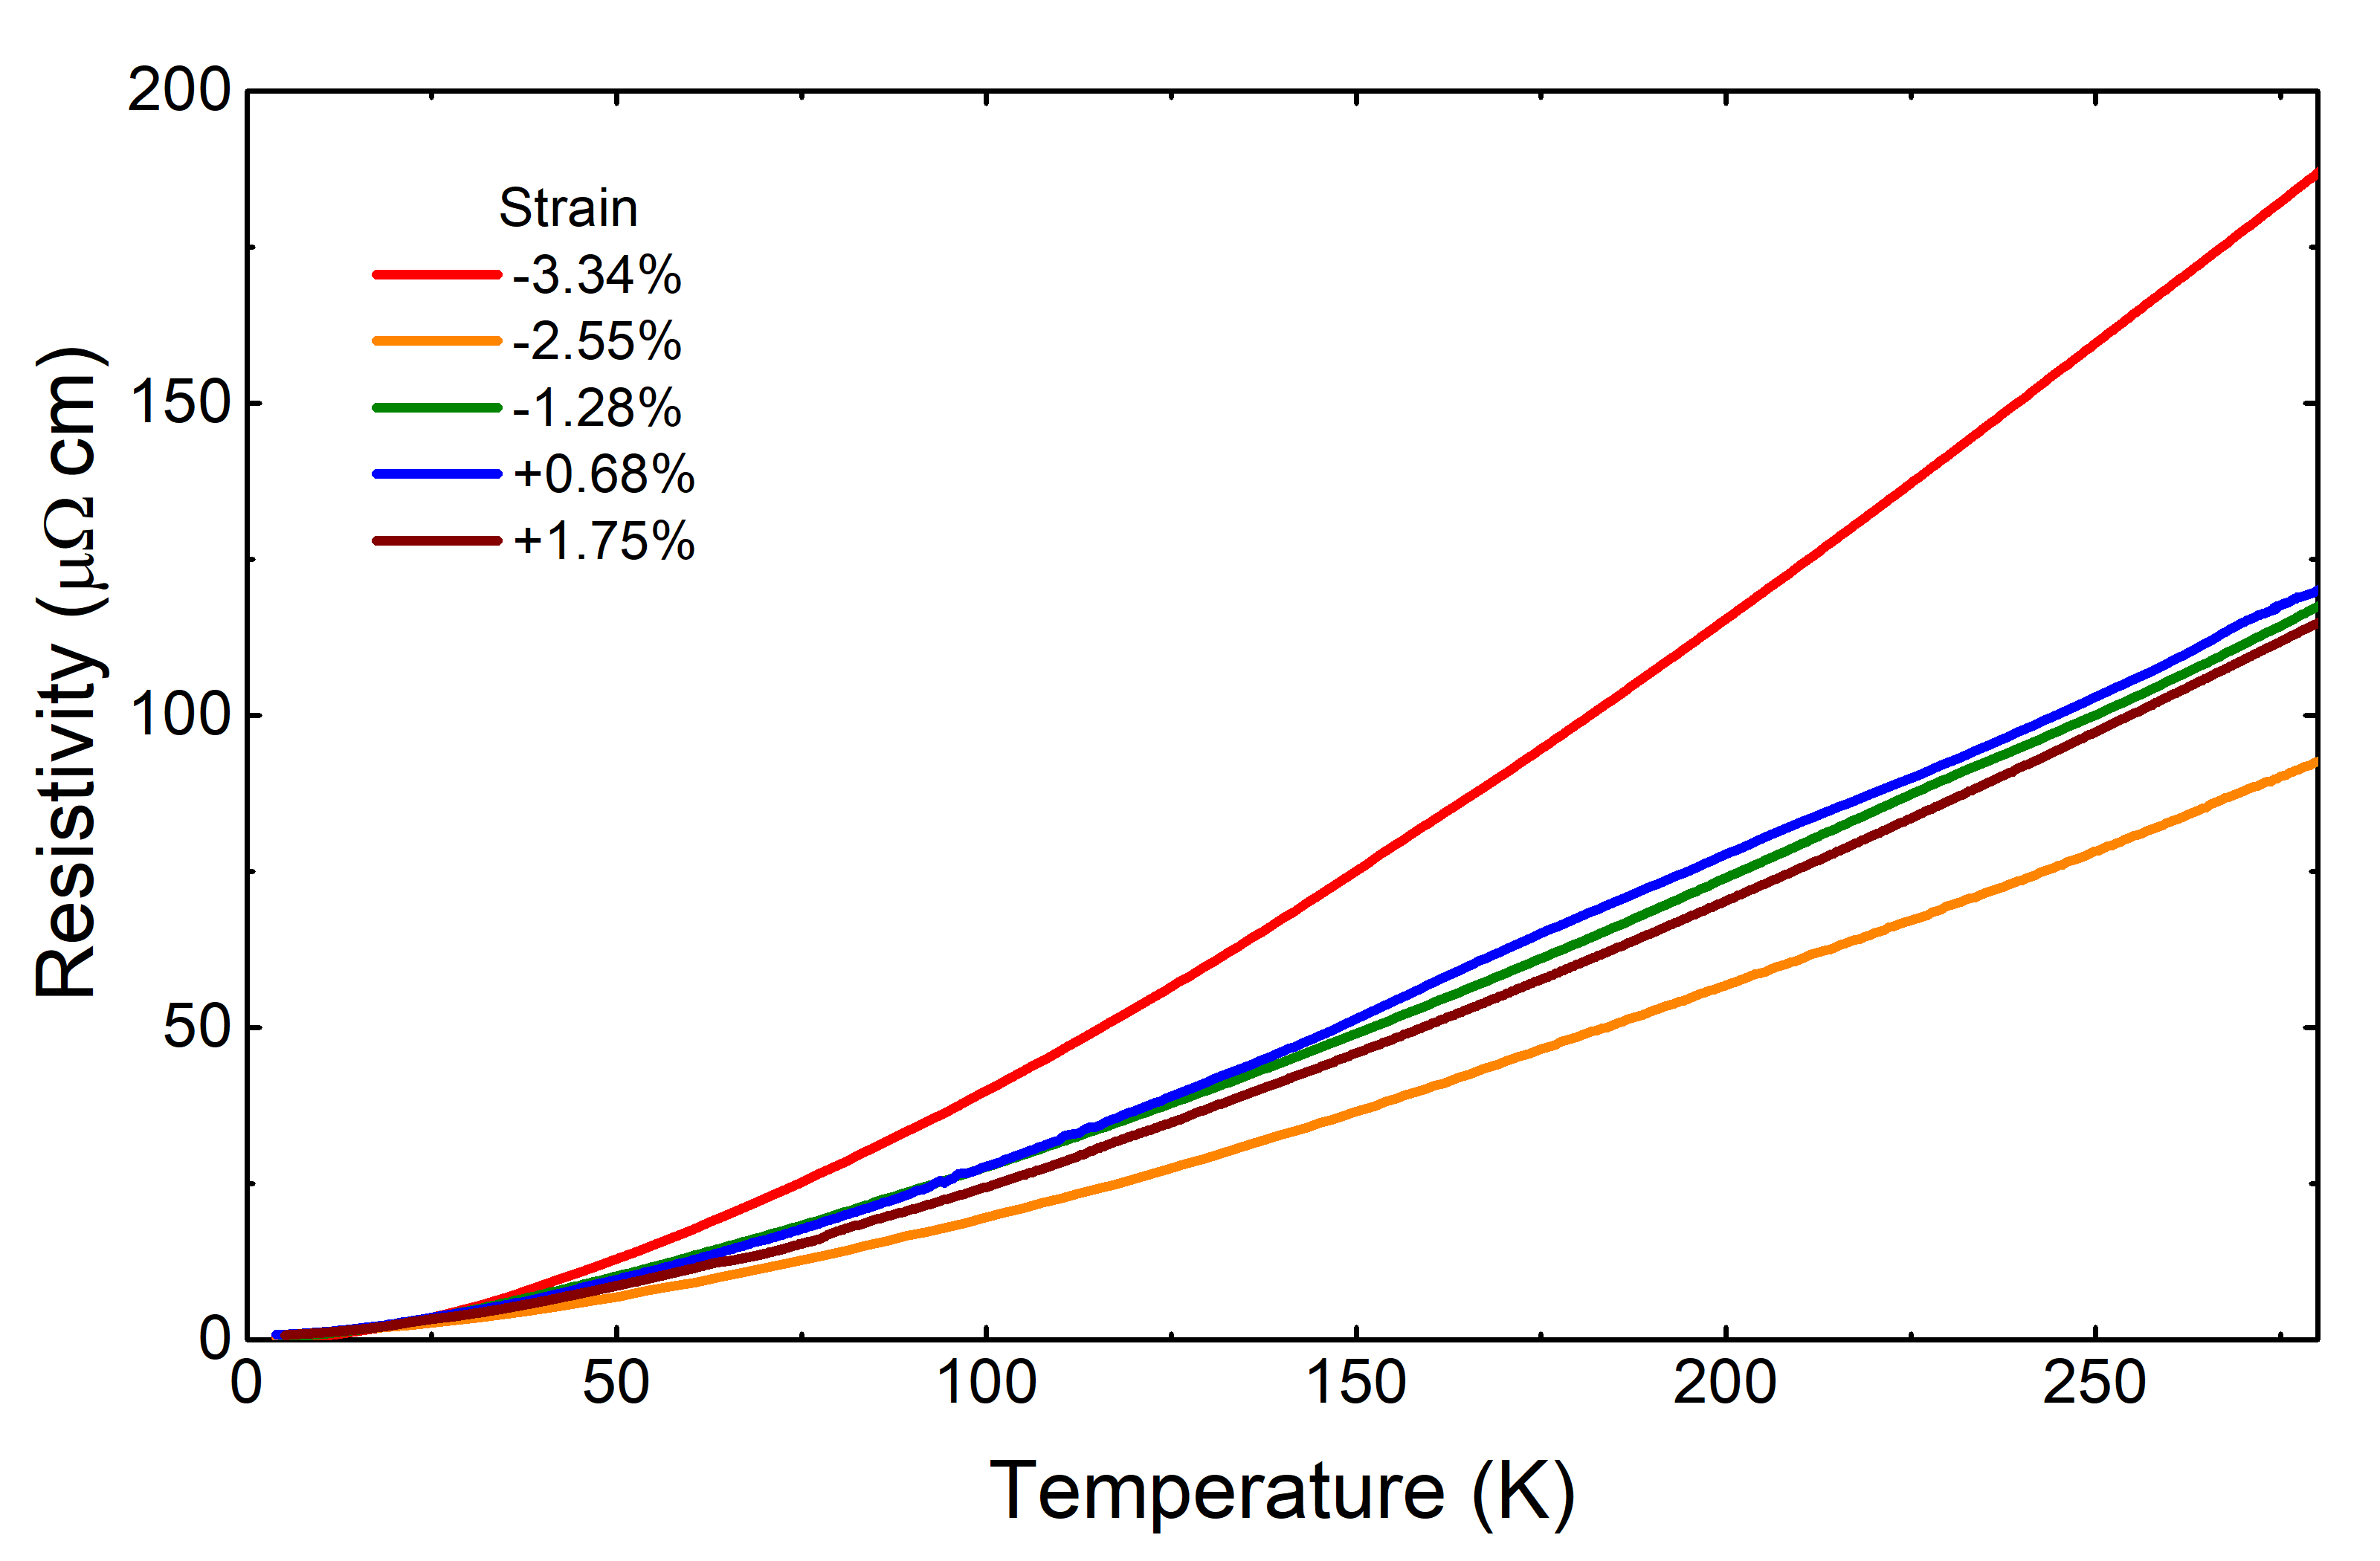
For each film/substrate combination the member of the twin samples destined for transport measurements was etched into multiple Hall bars, contacted with sputtered platinum contacts and bonded with aluminum wires. Then the DC resistivity (displayed in Fig. 9) was recorded in a 4He dipping station down to .
The presence of twin domains in the LaAlO3 and NdAlO3 substrates influences the terahertz transmission. In the case of LaAlO3 and LaNiO3 films on LaAlO3 substrates, we managed to cancel this interference effect by a proper incoming polarisation orientation. This was not possible for NdAlO3 and LaNiO3 films on NdAlO3 substrates.
Appendix B Electronic band structure calculations
Crystal structure relaxation was performed within the generalized gradient approximation (Perdew-Burke-Ernzerhof parametrization, PBE) Perdew et al. (1996) using the projected-augmented waves (PAW) method Blöchl (1994) as implemented in the Vienna Ab-initio Simulation Package (VASP) Kresse and Joubert (1999); Kresse and Hafner (1993); Kresse and Furthmüller (1996). The integration over the Brillouin zone was done using a -mesh with points and a plane-wave cutoff of . Structure relaxation was considered converged when the forces were smaller than . The in-plane velocities of the states on the Fermi surfaces, shown in Fig. 8 and Fig. 10 have been calculated with the BoltzTraP2 software package Madsen et al. (2018).
A film of LaNiO3 was simulated using a unit cell, which corresponds to octahedral rotation pattern in Glazer notation Glazer (1972). The primitive cell of this structure contains four formula units with oppositely oriented tilts and rotations of the NiO6 octahedra. The strain effect of the substrate was taken into account by constraining the in-plane pseudo-cubic vectors , to the corresponding vectors of a generic cubic substrate. The strain values are defined with respect to the lattice constant of the PBE-relaxed bulk structure (). We used the method of Ref. Peil et al., 2014. The in-plane lattice parameters were fixed and all other degrees of freedom, such as the out-of-plane lattice vector, oxygen, and cation positions, are allowed to relax. For most of the strains, except for the very large ones, the final space group of the relaxed unit cell remained . For the extreme compressive strain (-4.0%) with vanishing -, -rotation angles, , and for the extreme tensile strain (+5.0%) with the relaxation converged to unit cells corresponding to supergroups of : under compression and under tension.
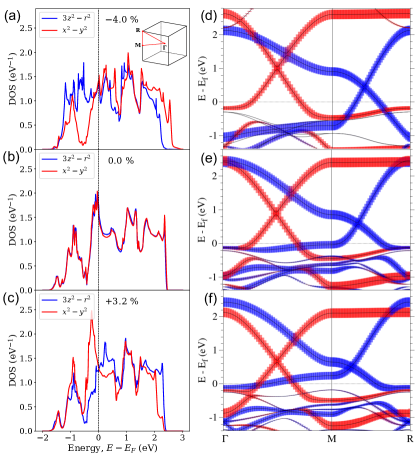
In Fig. 11 we show the resulting density of states and the band structure along a high symmetry path through the Brillouin zone for three different strains. To evaluate the orbital character of the band structure, as shown in Fig. 11d-f, we projected the Kohn-Sham wavefunctions onto -like (, ) local states centered on the Ni atoms. We selected band states in a narrow energy window ([, ] ) around the Fermi level, corresponding to antibonding states in the local frame of octahedra, which are then transformed into projected localized orbitals (PLOs) as defined in Refs. Amadon et al., 2008; Schüler et al., 2018.
To calculate the hopping ratios , shown in Fig. 7, we constructed a low-energy Wannier Hamiltonian on a k-grid using maximally-localized Wannier functions Marzari and Vanderbilt (1997); Souza et al. (2001); Pizzi et al. (2019) of Ni- symmetry. For all strains we used a frozen energy window ([, ] ) to improve the quality of the Wannier fit. We checked that the Wannier functions are centered exactly on the atomic positions and confirmed that the resulting Wannier Hamiltonian is real. However, it should be noted that the employed -like basis is not sufficient to accurately match the band structure for states below the frozen energy. From the Wannier model we extracted the on-site energies (Fig. 6c), which show the same trend as the band center of mass shown in main text Fig. 7 c. Additionally, we calculated effective in-plane and out-of-plane hopping amplitudes (Fig. 6b) via
| (3) |
For the sum runs over all real-space vectors without any out-of-plane component and without any in-plane components for , respectively. The indices are orbital indices and is the number of Ni-atoms at the same distance , e.g. there are two nearest neighbor out-of-plane hoppings and four nearest neighbor in-plane hoppings.
Optical conductivities for the relaxed structures have been calculated using WIEN2k Blaha et al. (2018) and the transport code implemented in the TRIQS/DFTTools package Aichhorn et al. (2016), which is based on the TRIQS library Parcollet et al. (2015). We used a denser -mesh of points and assumed a fixed scattering rate of for all strains. The DC conductivity was calculated from the relation , where is the spectral weight tensor defined as
| (4) |
is the group velocity of the ’th band for momentum value , is the volume of the primitive cell, and is the Fermi-Dirac distribution. As discussed in the main text, under tensile strain the in-plane DC conductivity increases. In the calculations, the out-of-plane DC conductivity shows the exact opposite behavior, it decreases under tensile strain (see Fig. 6a)
To demonstrate the effect of oxygen-octahedra rotations and tilts we also performed calculations for (hypothetical) undistorted tetragonal structures using the in- and out-of-plane lattice constants of the fully relaxed distorted structures. The octahedral distortions, rotations, and tilts allow for optical inter-band transitions, leading to a pronounced weight in the optical conductivity around observed in theory and experiment (see main text Fig. 2). This weight is not present in the optical conductivity of the undistorted tetragonal structures, as shown in Fig. 5. In the low-frequency region of the optical conductivity we observe two effects: First, the DC conductivities are larger for the tetragonal structures, due to larger inter-site hoppings as a result of straight bonds. Second, the trend of a conductivity decrease under increased strain is still present (although only weakly pronounced for tensile strains), which can be traced back to how the crystal-field splitting evolves under strain (see Fig. 4).
In Fig. 10 we show the effect on the Fermi surface and the velocities when tuning the crystal field splitting and the hopping ratio starting from the unstrained tetragonal structure (middle column). Note that the additional sheets visible in Fig. 8 of the main text are Fermi surface reconstructions due to a two Ni-atom (twice as large) unit cell. Only if both the change in and the change in are accounted for (first and last column) can the Lifshitz transitions under strain be qualitatively reproduced. The changes in and also lead to higher in-plane velocities, when adjusted in accordance with the effect of tensile strain (i.e. decreases and increases), as seen from the color-coding of the Fermi surfaces. We encourage the reader to further explore the effect of and on the Fermi surface and the band structure with our interactive online applet (Ref. Bin, ).
Appendix C Data availability
The datasets generated and analyzed during the current study are available in Ref. yar, 2020. These will be preserved for 10 years. All other data that support the plots within this paper and other findings of this study are available from the corresponding author upon reasonable request.
References
- Torrance et al. (1992) J. B. Torrance, P. Lacorre, A. I. Nazzal, E. J. Ansaldo, and C. Niedermayer, Phys. Rev. B 45, 8209 (1992).
- García-Muñoz et al. (1992) J. L. García-Muñoz, J. Rodríguez-Carvajal, P. Lacorre, and J. B. Torrance, Phys. Rev. B 46, 4414 (1992).
- Catalan (2008) G. Catalan, Phase Transitions 81, 729 (2008).
- Chaloupka and Khaliullin (2008) J. Chaloupka and G. Khaliullin, Phys. Rev. Lett. 100, 016404 (2008).
- Kumah et al. (2014) D. Kumah, A. Disa, J. Ngai, H. Chen, A. Malashevich, J. W. Reiner, S. Ismail-Beigi, F. J. Walker, and C. Ahn, Adv. Mater. 26, 1935 (2014).
- Ismail-Beigi et al. (2017) S. Ismail-Beigi, F. J. Walker, A. S. Disa, K. M. Rabe, and C. Ahn, Nat. Rev. Mater. 2, 17060 (2017).
- Phillips et al. (2017) P. J. Phillips, X. Rui, A. B. Georgescu, A. S. Disa, P. Longo, E. Okunishi, F. Walker, C. H. Ahn, S. Ismail-Beigi, and R. F. Klie, Phys. Rev. B 95, 205131 (2017).
- Disa et al. (2017) A. S. Disa, A. B. Georgescu, J. L. Hart, D. P. Kumah, P. Shafer, E. Arenholz, D. A. Arena, S. Ismail-Beigi, M. L. Taheri, F. J. Walker, and C. H. Ahn, Phys. Rev. Materials 1, 024410 (2017).
- Lee et al. (2019) S. Lee, A. T. Lee, A. B. Georgescu, G. Fabbris, M.-G. Han, Y. Zhu, J. W. Freeland, A. S. Disa, Y. Jia, M. P. M. Dean, F. J. Walker, S. Ismail-Beigi, and C. H. Ahn, Phys. Rev. Lett. 123, 117201 (2019).
- Mizokawa et al. (2000) T. Mizokawa, D. I. Khomskii, and G. A. Sawatzky, Phys. Rev. B 61, 11263 (2000).
- Park et al. (2012) H. Park, A. J. Millis, and C. A. Marianetti, Phys. Rev. Lett. 109, 156402 (2012).
- Mazin et al. (2007) I. I. Mazin, D. I. Khomskii, R. Lengsdorf, J. A. Alonso, W. G. Marshall, R. M. Ibberson, A. Podlesnyak, M. J. Martínez-Lope, and M. M. Abd-Elmeguid, Phys. Rev. Lett. 98, 176406 (2007).
- Johnston et al. (2014) S. Johnston, A. Mukherjee, I. Elfimov, M. Berciu, and G. A. Sawatzky, Phys. Rev. Lett. 112, 106404 (2014).
- Subedi et al. (2015) A. Subedi, O. E. Peil, and A. Georges, Phys. Rev. B 91, 075128 (2015).
- Seth et al. (2017) P. Seth, O. E. Peil, L. Pourovskii, M. Betzinger, C. Friedrich, O. Parcollet, S. Biermann, F. Aryasetiawan, and A. Georges, Phys. Rev. B 96, 205139 (2017).
- Hirsch (1985) J. E. Hirsch, Phys. Rev. Lett. 54, 1317 (1985).
- van der Marel and Sawatzky (1985) D. van der Marel and G. A. Sawatzky, Solid State Commun. 55, 937 (1985).
- Varma (1988) C. M. Varma, Phys. Rev. Lett. 61, 2713 (1988).
- Strand (2014) H. U. R. Strand, Phys. Rev. B 90, 155108 (2014).
- Fowlie (2018) J. Fowlie, Electronic and structural properties of LaNiO3-based heterostructures, Ph.D. thesis, University of Geneva (2018).
- Li et al. (2019) D. Li, K. Lee, B. Y. Wang, M. Osada, S. Crossley, H. R. Lee, Y. Cui, Y. Hikita, and H. Y. Hwang, Nature 572, 624 (2019).
- Catalano et al. (2018) S. Catalano, M. Gibert, J. Fowlie, J. Íñiguez, J.-M. Triscone, and J. Kreisel, Rep. Prog. Phys 81, 046501 (2018).
- Fowlie et al. (2019) J. Fowlie, C. Lichtensteiger, M. Gibert, H. Meley, P. Willmott, and J.-M. Triscone, Nano Lett. 19, 4188 (2019).
- Zhu et al. (2013) M. Zhu, P. Komissinskiy, A. Radetinac, M. Vafaee, Z. Wang, and L. Alff, Applied Phys. Lett. 103, 141902 (2013).
- Guo et al. (2018) H. Guo, L. Li, W. Z .and Zhao, C. F. Hu, Z.and Chang, C. Kuo, W. Schmidt, A. Piovano, T.-W. Pi, O. Sobolev, D. I. Khomskii, L. H. Tjeng, and A. C. Komarek, Nat. Commun. 9, 43 (2018).
- Ouellette et al. (2010) D. G. Ouellette, S. B. Lee, J. Son, S. Stemmer, L. Balents, A. J. Millis, and S. J. Allen, Phys. Rev. B 82, 165112 (2010).
- Stewart et al. (2011) M. K. Stewart, C.-H. Yee, J. Liu, M. Kareev, R. K. Smith, B. C. Chapler, M. Varela, P. J. Ryan, K. Haule, J. Chakhalian, and D. N. Basov, Phys. Rev. B 83, 075125 (2011).
- Yoo et al. (2015) H. K. Yoo, S. I. Hyun, L. Moreschini, H.-D. Kim, Y. J. Chang, C. H. Sohn, D. W. Jeong, S. Sinn, Y. S. Kim, A. Bostwick, E. Rotenberg, J. H. Shim, and T. W. Noh, Sci. Rep. 5, 8746 (2015).
- Kuzmenko (2005) A. Kuzmenko, Rev. Sci. Instrum. 76, 083108 (2005).
- Nakajima et al. (2010) M. Nakajima, S. Ishida, K. Kihou, Y. Tomioka, T. Ito, Y. Yoshida, C.-H. Lee, H. Kito, A. Iyo, H. Eisaki, K. M. Kojima, and S.-I. Uchida, Phys. Rev. B 81, 104528 (2010).
- Cheng et al. (2012) B. Cheng, B. F. Hu, R. Y. Chen, G. Xu, P. Zheng, J. L. Luo, and N. L. Wang, Phys. Rev. B 86, 134503 (2012).
- Ruppen et al. (2015) J. Ruppen, J. Teyssier, O. E. Peil, S. Catalano, M. Gibert, J. Mravlje, J.-M. Triscone, A. Georges, and D. van der Marel, Phys. Rev. B 92, 155145 (2015).
- Berthod et al. (2013) C. Berthod, J. Mravlje, X. Deng, R. Zitko, D. van der Marel, and A. Georges, Phys. Rev. B 87, 115109 (2013).
- Götze and Wölfle (1972) W. Götze and P. Wölfle, Phys. Rev. B 6, 1226 (1972).
- Sreedhar et al. (1992) K. Sreedhar, J. M. Honig, M. Darwin, M. McElfresh, P. M. Shand, J. Xu, B. C. Crooker, and J. Spalek, Phys. Rev. B 46, 6382 (1992).
- Son et al. (2010) J. Son, P. Moetakef, J. M. LeBeau, D. Ouellette, L. Balents, S. J. Allen, and S. Stemmer, Applied Phys. Lett. 96, 062114 (2010).
- Scherwitzl et al. (2011) R. Scherwitzl, S. Gariglio, M. Gabay, P. Zubko, M. Gibert, and J.-M. Triscone, Phys. Rev. Lett. 106, 246403 (2011).
- Scherwitzl (2012) R. Scherwitzl, Metal-insulator transitions in nickelate heterostructures, Ph.D. thesis, University of Geneva (2012).
- Liu et al. (2020) C. Liu, V. F. C. Humbert, T. M. Bretz-Sullivan, G. Wang, D. Hong, F. Wrobel, J. Zhang, J. D. Hoffman, J. E. Pearson, J. S. Jiang, C. Chang, A. Suslov, N. Mason, M. R. Norman, and A. Bhattacharya, Nature Commun. 11, 1402 (2020).
- Note (1) Since the measured optical response depends on the film thickness, one may suspect that this discrepancy could result from assuming the wrong value for the film thickness, or from the presence of a dead (i.e. insulating) layer. However, the thicknesses of these films are accurately known from X-ray diffraction. Since even for the insulating phase of RNiO3 the spectral weight in the visible part of the spectrum is not so different from the metallic phase Ruppen et al. (2015), the assumption of a dead layer cannot explain the low value of Neff(2eV) for the tensile samples. Moreover, transport experiments on films on LaAlO3 as a function of film thickness have demonstrated that the films switch as a whole from metal to insulator at a critical thickness Fowlie et al. (2017).
- King et al. (2014) P. D. C. King, H. Wei, Y. F. Nie, M. Uchida, C. Adamo, S. Zhu, X. He, I. Bozovic, S. D.G., and K. Shen, Nat. Nanotechnol. 9, 443 (2014).
- Deng et al. (2012) X. Deng, M. Ferrero, J. Mravlje, M. Aichhorn, and A. Georges, Phys. Rev. B 85, 125137 (2012).
- Peil et al. (2014) O. E. Peil, M. Ferrero, and A. Georges, Phys. Rev. B 90, 045128 (2014).
- Nowadnick et al. (2015) E. A. Nowadnick, J. P. Ruf, H. Park, P. D. C. King, D. G. Schlom, K. M. Shen, and A. J. Millis, Phys. Rev. B 92, 245109 (2015).
- Basov et al. (2011) D. N. Basov, R. D. Averitt, D. van der Marel, M. Dressel, and K. Haule, Rev. Mod. Phys. 83, 471 (2011).
- May et al. (2010) S. J. May, J.-W. Kim, J. M. Rondinelli, E. Karapetrova, N. A. Spaldin, A. Bhattacharya, and P. J. Ryan, Phys. Rev. B 82, 014110 (2010).
- Marzari and Vanderbilt (1997) N. Marzari and D. Vanderbilt, Phys. Rev. B 56, 12847 (1997).
- Souza et al. (2001) I. Souza, N. Marzari, and D. Vanderbilt, Phys. Rev. B 65, 035109 (2001).
- Pizzi et al. (2019) G. Pizzi, V. Vitale, R. Arita, S. Bluegel, F. Freimuth, G. Geranton, M. Gibertini, D. Gresch, C. Johnson, T. Koretsune, J. Ibanez, H. Lee, J.-M. Lihm, D. Marchand, A. Marrazzo, Y. Mokrousov, J. I. Mustafa, Y. Nohara, Y. Nomura, L. Paulatto, S. Ponce, T. Ponweiser, J. Qiao, F. Thole, S. S. Tsirkin, M. Wierzbowska, N. Marzari, D. Vanderbilt, I. Souza, A. A. Mostofi, and J. R. Yates, J. Phys. Condens. Matter 32, 165902 (2019).
- (50) “Online Interactive Fermi Surface Applet,” https://lnostrain.page.link/applet Note: It will take a few minutes until the application is loaded and built if it has not been used by anyone recently. Once loaded, click on RUN_ME.ipynb and follow the instructions therein.
- Lichtensteiger (2018) C. Lichtensteiger, Journal of Applied Crystallography 51, 1745 (2018).
- Perdew et al. (1996) J. P. Perdew, K. Burke, and M. Ernzerhof, Phys. Rev. Lett. 77, 3865 (1996).
- Blöchl (1994) P. E. Blöchl, Phys. Rev. B 50, 17953 (1994).
- Kresse and Joubert (1999) G. Kresse and D. Joubert, Phys. Rev. B 59, 1758 (1999).
- Kresse and Hafner (1993) G. Kresse and J. Hafner, Phys. Rev. B 47, 558 (1993).
- Kresse and Furthmüller (1996) G. Kresse and J. Furthmüller, Phys. Rev. B 54, 11169 (1996).
- Madsen et al. (2018) G. K. Madsen, J. Carrete, and M. J. Verstraete, CompAppendixut. Phys. Commun. 231, 140 (2018).
- Glazer (1972) A. M. Glazer, Acta Cryst. B 28, 3384 (1972).
- Amadon et al. (2008) B. Amadon, F. Lechermann, A. Georges, F. Jollet, T. O. Wehling, and A. I. Lichtenstein, Phys. Rev. B 77, 205112 (2008).
- Schüler et al. (2018) M. Schüler, O. E. Peil, G. J. Kraberger, R. Pordzik, M. Marsman, G. Kresse, T. O. Wehling, and M. Aichhorn, J. Phys. Condens. Matter 30, 475901 (2018).
- Blaha et al. (2018) P. Blaha, K. Schwarz, G. K. H. Madsen, D. Kvasnicka, J. Luitz, R. Laskowski, F. Tran, and L. D. Marks, WIEN2k, An Augmented Plane Wave + Local Orbitals Program for Calculating Crystal Properties (K. Schwarz, Techn. Univ. Wien, Austria, 2018).
- Aichhorn et al. (2016) M. Aichhorn, L. Pourovskii, P. Seth, V. Vildosola, M. Zingl, O. E. Peil, X. Deng, J. Mravlje, G. J. Kraberger, C. Martins, M. Ferrero, and O. Parcollet, Comput. Phys. Commun. 204, 200 (2016).
- Parcollet et al. (2015) O. Parcollet, M. Ferrero, T. Ayral, H. Hafermann, I. Krivenko, L. Messio, and P. Seth, Comput. Phys. Commun. 196, 398 (2015).
- yar (2020) DOI:10.26037/yareta:jif2uzxdfrgctma6b4rknipqoe (2020).
- Fowlie et al. (2017) J. Fowlie, M. Gibert, G. Tieri, A. Gloter, J. Iniguez, A. Filippetti, S. Catalano, S. Gariglio, A. Schober, M. Guennou, J. Kreisel, O. Stephan, and J.-M. Triscone, Advanced Materials 29, 1605197 (2017).