Observing superluminous supernovae and long gamma ray bursts as potential birthplaces of repeating fast radio bursts
Abstract
Superluminous supernovae (SLSNe) and long gamma ray bursts (LGRBs) have been proposed as progenitors of repeating Fast Radio Bursts (FRBs). In this scenario, bursts originate from the interaction between a young magnetar and its surrounding supernova remnant (SNR). Such a model could explain the repeating, apparently non-Poissonian nature of FRB121102, which appears to display quiescent and active phases. This bursting behaviour is better explained with a Weibull distribution, which includes parametrisation for clustering. We observed 10 SLSNe/LGRBs for 63 hours, looking for repeating FRBs with the Effelsberg-100 m radio telescope, but have not detected any bursts. We scale the burst rate of FRB121102 to an FRB121102-like source inhabiting each of our observed targets, and compare this rate to our upper burst rate limit on a source by source basis. By adopting a fiducial beaming fraction of 0.6, we obtain 99.99% and 83.4% probabilities that at least one, and at least half of our observed sources are beamed towards us respectively. One of our SLSN targets, PTF10hgi, is coincident with a persistent radio source, making it a possible analogue to FRB121102. We performed further observations on this source using the Effelsberg-100 m and Parkes-64 m radio telescopes. Assuming that PTF10hgi contains an FRB121102-like source, the probabilities of not detecting any bursts from a Weibull distribution during our observations are 14% and 16% for Effelsberg and Parkes respectively. We conclude by showing that a survey of many short observations increases burst detection probability for a source with Weibull distributed bursting activity.
keywords:
transients: fast radio bursts – transients: gamma-ray bursts – transients: supernovae – methods: observational1 Introduction
Fast Radio Bursts (FRBs) are bright, highly dispersed, millisecond-duration radio transients of unknown origin. Since their inaugural detection (Lorimer et al., 2007), close to 100 FRB discoveries have been published111frbcat.org (Petroff et al., 2016). FRBs are believed to be extragalactic due to their high dispersion measures (DM), which far exceed the expected Galactic DM contribution. This belief has strenthened as FRBs have been increasingly localized to host galaxies (Chatterjee et al., 2017; Bannister et al., 2019; Ravi et al., 2019; Prochaska et al., 2019; Marcote et al., 2020). While most FRBs detected so far have been single events, FRB121102 was the first to be seen to repeat (Spitler et al., 2016), and recently nine repeating FRBs have also been detected at CHIME (CHIME/FRB Collaboration et al., 2019; The CHIME/FRB Collaboration et al., 2019). The repeating nature of some FRBs suggest that there are possibly two populations of FRBs, repeating and non-repeating.
FRB121102 has been localized to a host galaxy (Michilli et al., 2018), and its host identified as a low-metallicity dwarf galaxy at a redshift of (Tendulkar et al., 2017), with a stellar mass of M⊙ and a star formation rate of 0.23 M⊙ per year (Bassa et al., 2017). A compact persistent radio source with a projected size of < 0.7 pc was detected alongside FRB121102 (Marcote et al., 2017) and was determined to be co-located to within a projected distance of < 40 pc to the bursting source.
Evidence for coincidence between FRB121102 and the persistent radio source, along with the identification of the host galaxy, led to the suggestion of two types of progenitor models: a magnetar wind nebula containing a young magnetar, embedded within a supernova remnant (SNR) (Metzger et al., 2017); or a low luminosity active galactic nucleus (AGN) acting as the persistent radio source, with the bursting activity either originating from the AGN itself (Romero et al., 2016), or through interaction with a nearby neutron star (NS) (e.g. Zhang, 2018a). In the case of FRB121102, the AGN model was initially thought unlikely, as dwarf galaxies rarely contain AGNs, along with the fact that no evidence of an AGN in the optical spectrum was observed (Tendulkar et al., 2017). However, a recent survey has shown that AGNs can be found offset from the optical center of dwarf galaxies (Reines et al., 2020). Additionally, the recently observed large and decreasing rotation measures (RMs) of FRB121102 ( rad/m2) (Michilli et al., 2018), have drawn analogies between the system and the Galactic center magnetar, J1745-2900 ( rad/m2) and Sagittarius A* system (Desvignes et al., 2018).
Supernovae occur from the collapse of massive stars into black holes (BHs) or NSs. In some rare cases the remnant BH or NS powers a relativistic jet into the circumstellar medium (Woosley, 1993), and internal shocks within these jets can produce long gamma-ray bursts (LGRBs) (Rees & Meszaros, 1994). Type-I superluminous supernovae (SLSNe) are a subclass of supernovae which are hydrogen poor, orders of magnitude more luminous, have shorter decay times than the typical Type-I supernovae, and have been postulated to be the precursor of LGRBs (Gal-Yam, 2019). The high luminosity is powered by a newly-born magnetar, where the magnetar spin-dowon rate is tied to the short decay time (Greiner et al., 2015). In addition to producing a fast-spinning NS with a strong magnetic field that could produce more luminous radio bursts than Galactic NSs, Type-I SLSNe and the resulting LGRBs also seem to occur more often in low-mass, low-metallicity galaxies (Fruchter et al., 2006; Perley et al., 2016). Type-I SLSNe and LGRBs can therefore explain the repeating nature of FRB121102 and its coincident persistent radio source. Note that throughout this paper, any mention of SLSNe is exclusively referring to Type-I SLSNe.
For FRB121102, the persistent radio source’s luminosity is consistent with a model of radio emission from an SNR which is powered by a young magnetar (Metzger et al., 2017). A radio burst could therefore originate from the magnetosphere of such a magnetar in a similar fashion to pulsar giant pulses (Cordes & Wasserman, 2016). Similarities in burst properties between FRB121102 and the Crab pulsar have been observed, although whether giant pulses from the Crab can be scaled to the energies of FRB121102 is unclear (see Hessels et al., 2019, and discussion therein). Alternatively, Metzger et al. (2019) have modelled FRBs as synchrotron maser emissions from within an SNR. In that scenario, a central engine releases ultrarelativistic particles which collide with a mildly relativistic magnetized ion-electron shell. The deceleration of the shell through forward shocks would then produce FRBs through a synchrotron maser mechanism. Metzger et al. (2019) illustrate both production of FRBs within a large frequency range, 0.1–10 GHz, and the apparently dormant and clustering phases of bursts observed from FRB121102.
Shortly after the explosion, an SNR is optically thick at radio frequencies, so radio bursts from an embedded magnetar cannot be detected. If the SNR is mainly ionized by the reverse shock, it can be probed at radio frequencies after a timescale of centuries (Piro, 2016). However, assuming that along with the reverse shock of the supernova ejecta, the SNR is photoionized from within by the magnetar, the SNR becomes optically thin at the frequency of the bursting emission after yrs (Metzger et al., 2017). At 1.4 and 6 GHz, is 8.7 and 4.9 yrs respectively, in the emitted frame.
In this work we have identified and observed nine SLSNe and LGRBs as suitable sources for a targeted repeating FRB search at high frequencies (5.3–9.3 GHz) with the Effelsberg 100-m Radio Telescope. The motivation for choosing this frequency range is that the SNR model allows for younger, and hence more, sources to be observable; and that FRB121102 has been observed to emit at these frequencies (Gajjar et al., 2018). We later added PTF10hgi to our 5.3–9.3 GHz survey and observed it during commissioning time for the phased array feed (PAF) receiver at Effelsberg at 1.4 GHz and with the ultra wideband low (UWL) Parkes 64-m Radio Telescope receiver (0.7–4.0 GHz). This addition was made following the discovery of a radio source coincident with the SLSN PTF10hgi at 6 GHz with the VLA (Eftekhari et al., 2019). This is the first detection of a persistent radio source coincident with SLSNe/LGRBs, and it could be analogous to FRB121102’s persistent radio source. If an FRB were to be detected from PTF10hgi it would prove the theorised connection between FRBs and SLSNe/LGRBs. Additionally, the age of PTF10hgi was roughly nine years at the time of observing, so its SNR should be only recently optically thin at 1.4 GHz. With our wide range of frequencies we could potentially observe the optically thick-thin transition of the SNR.
Similar surveys have been performed recently: Law et al. (2019) observed 10 SLSN using the Karl G. Jansky Very Large Array (VLA) for 8.5 hrs at 3 GHz, where they managed to detected the persistent radio source of PTF10hgi in their radio image searching. Men et al. (2019) observed five LGRBs and one short GRB for 20 hrs using the Robert C. Byrd Green Bank Telescope (GBT) at 820 MHz and 2 GHz, and the Arecibo Radio Telescope at 1.4 GHz. Madison et al. (2019) observed six short GRBs, which originate from the merger of neutron stars and could leave behind a magnetar capable of producing repeating FRBs, for 20 hrs using the GBT at 2 GHz and Arecibo at 1.4 GHz. No FRBs were detected in these surveys.
2 Observations
Our obsevations were carried out using The Effelsberg 100-m Radio Telescope in Effelsberg, Germany; and The Parkes 64-m Radio Telescope in New South Wales, Australia. The receivers used at Effelsberg were the S45mm single pixel receiver, and the PAF; and at Parkes, the UWL receiver. These will be described in their respective subsections below.
The selection process for our targets was as follows. A list of SLSNe and LGRBs was gathered from the Open Supernova Catalog222https://sne.space (Guillochon et al., 2017) and the Swift GRB Catalog333https://swift.gsfc.nasa.gov/archive/grb_table.html with each source being older than five years, and at a maximum redshift of 0.4. The age cut-off was conservatively set to five years to include only SNRs which are optically thin in the observing band of the receiver. The redshift limit was set with respect to detections of FRB121102 at Effelsberg: By combining the radiometer equation (Dicke, 1946) and the brightness drop-off of the inverse square law, it follows that a detection with a signal to noise (S/N) of 40 at a redshift could be detected with a S/N of 10 at with the S45mm receiver.
The observed targets are listed in Table 1, and the complete list of observations can be found in Table 2. The range of our observations spans from June 2017 to September 2019. To reassure ourselves that the PAF system was working properly, we observed a test pulsar, B1612+07, for five minutes every hour during observations of PTF10hgi. To detect it we folded the test pulsar data using dspsr from the pulsar analysis software library psrchive444http://psrchive.sourceforge.net/. For 42.3 of our total 63 observing hours, we observed our original nine targets with the S45mm receiver for 1–2 hrs each time with a 5 month cadence. We observed PTF10hgi for 5.3 hrs, split into two observations of roughly 2.5 hrs each spaced a month apart with the S45mm receiver; for 13 hrs with the PAF receiver for 1.5–4 hrs each day for four days; and for 2.3 hours over three observations with the UWL spaced across six months. The strategy of multiple short observations was motivated by the apparent clustering of bursts from FRB121102 (Oppermann et al., 2018).
The total DMs of our potential radio sources can be broken down into individual contributions by various components
| (1) |
where and are the DM contribution of the Milky Way (MW) and its halo, respectively, is the contribution of the intergalactic medium (IGM), and is the contribution of the host galaxy and the local environment of the source. The varies between different lines of sight (LoS), but in general does not exceed 100 pc cm-3 for LoSs away from the Galactic plane, which is the case for most of our targets. Using the Galactic electron density model YMW16 (Yao et al., 2017), we obtain DM values between 22 and 143 pc cm-3 for our targets. We assume a DM value of 50–80 pc cm-3 (Prochaska & Zheng, 2019). To estimate the DM we use the relation pc cm-3 (Zhang, 2018b) reulting in a DM range of 66-311 pc cm-3. The estimated DM from recent FRB localisations are in agreement with this relation (Bannister et al., 2019; Ravi et al., 2019). Note that LoS variations might vary from 100 to 250 pc cm-3 for DM for our redshift range depending on models for halos’ gas profile of ionized baryons (McQuinn, 2014, Fig. 1, bottom panel). The component can vary between FRB progenitor models, types of host galaxies and local environments, orientation of the host galaxy, and the LoS to the source through its host (Walker et al., 2018). The estimate for FRB121102 is in the range of 55–225 pc cm-3 (Tendulkar et al., 2017). Using this range for our DM, the estimated total DM of our targets falls in the range of 220–700 pc cm-3.
| Source name | Discovery date | RA | DEC | Type | DM [pc cm] | |
|---|---|---|---|---|---|---|
| GRB050826 | 2005/08/26 | 055102.6 | -02∘39′28.8′′ | 0.297 | LGRB | 600 |
| GRB051109B | 2005/11/09 | 230152.6 | +38∘39′46.8′′ | 0.080 | LGRB | 330 |
| GRB111225A | 2011/11/25 | 005237.9 | +51∘34′22.8′′ | 0.297 | LGRB | 590 |
| PTF09cnd | 2009/08/07 | 161208.94 | +51∘29′16.1′′ | 0.258 | SLSN | 450 |
| PTF10uhf | 2010/08/05 | 165247 | +47∘36′21.76′′ | 0.288 | SLSN | 480 |
| PTF10bjp | 2010/01/09 | 100634 | +67∘59′19.0′′ | 0.358 | SLSN | 550 |
| SN2010gx | 2010/03/13 | 112546.71 | -08∘49′41.4′′ | 0.230 | SLSN | 430 |
| PTF12dam | 2012/04/10 | 142446.20 | +46∘13′48.3′′ | 0.107 | SLSN | 320 |
| LSQ12dlf | 2012/07/10 | 015029.8 | -21∘48′45′′ | 0.250 | SLSN | 440 |
| PTF10hgi | 2010/05/15 | 163747 | +06∘12′32.3′′ | 0.099 | SLSN | 330 |
| Source name | UT Date | UTC | MJD | Duration [min] | Frequency [GHz] |
| GRB050826 | 20170630 | 11:18:41 | 57934.47131 | 58 | 5.3–9.3 |
| GRB050826 | 20171128 | 22:21:04 | 58085.93130 | 147 | 5.3–9.3 |
| GRB050826 | 20180330 | 16:31:30 | 58207.68854 | 120 | 5.3–9.3 |
| GRB050826 | 20181023 | 00:46:50 | 58414.03252 | 60 | 4.6–5.1 |
| GRB050826 | 20181023 | 04:08:30 | 58414.17257 | 60 | 4.6–5.1 |
| GRB051109B | 20171128 | 16:03:34 | 58085.66194 | 120 | 5.3–9.3 |
| GRB051109B | 20180330 | 09:23:50 | 58207.39155 | 90 | 5.3–9.3 |
| GRB051109B | 20181022 | 17:00:20 | 58413.70856 | 60 | 4.6–5.1 |
| GRB111225A | 20171128 | 18:12:54 | 58085.75896 | 120 | 5.3–9.3 |
| GRB111225A | 20180330 | 11:06:51 | 58207.46309 | 46 | 5.3–9.3 |
| GRB111225A | 20180330 | 18:35:50 | 58207.77488 | 51 | 5.3–9.3 |
| GRB111225A | 20181022 | 18:12:00 | 58413.75833 | 60 | 5.3–9.3 |
| PTF09cnd | 20170630 | 13:21:01 | 57934.55626 | 48 | 5.3–9.3 |
| PTF09cnd | 20180330 | 05:11:30 | 58207.21632 | 120 | 5.3–9.3 |
| PTF09cnd | 20181022 | 22:37:30 | 58413.94271 | 60 | 4.6–5.1 |
| PTF10uhf | 20170630 | 15:17:01 | 57934.63682 | 55 | 5.3–9.3 |
| PTF10uhf | 20180330 | 07:17:50 | 58207.30405 | 120 | 5.3–9.3 |
| PTF10uhf | 20181022 | 21:36:40 | 58413.90046 | 60 | 4.6–5.1 |
| PTF10bjp | 20170630 | 12:27:31 | 57934.51911 | 48 | 5.3–9.3 |
| PTF10bjp | 20171129 | 01:26:14 | 58086.05988 | 120 | 5.3–9.3 |
| PTF10bjp | 20180330 | 01:01:20 | 58207.04259 | 120 | 5.3–9.3 |
| PTF10bjp | 20180330 | 14:08:10 | 58207.58900 | 18 | 5.3–9.3 |
| PTF10bjp | 20181022 | 19:31:50 | 58413.81377 | 60 | 4.6–5.1 |
| SN2010gx | 20171129 | 04:41:44 | 58086.19565 | 14 | 5.3–9.3 |
| SN2010gx | 20180329 | 22:57:00 | 58206.95625 | 120 | 5.3–9.3 |
| PTF12dam | 20170630 | 14:23:11 | 57934.59943 | 50 | 5.3–9.3 |
| PTF12dam | 20171129 | 03:38:04 | 58086.15144 | 60 | 5.3–9.3 |
| PTF12dam | 20180330 | 03:09:40 | 58207.13171 | 120 | 5.3–9.3 |
| PTF12dam | 20181022 | 20:35:00 | 58413.85764 | 60 | 4.6–5.1 |
| LSQ12dlf | 20171128 | 20:17:54 | 58085.84576 | 120 | 5.3–9.3 |
| LSQ12dlf | 20180330 | 12:01:00 | 58207.50069 | 120 | 5.3–9.3 |
| LSQ12dlf | 20181022 | 23:43:40 | 58413.98866 | 60 | 4.6–5.1 |
| PTF10hgi | 20190205 | 18:48:31 | 58519.78369 | 42 | 0.7–4 |
| PTF10hgi | 20190210 | 02:24:52 | 58524.10060 | 155 | 4–8 |
| PTF10hgi | 20190220 | 20:15:55 | 58534.84439 | 44 | 0.7–4 |
| PTF10hgi | 20190308 | 01:14:42 | 58550.05187 | 160 | 4–8 |
| PTF10hgi | 20190323 | 23:54:29 | 58565.99618 | 216 | 1.222-1.452 |
| PTF10hgi | 20190324 | 22:54:32 | 58566.95454 | 236 | 1.222-1.452 |
| PTF10hgi | 20190325 | 23:18:01 | 58567.97085 | 90 | 1.222-1.452 |
| PTF10hgi | 20190326 | 23:11:26 | 58568.96627 | 236 | 1.222-1.452 |
| PTF10hgi | 20190830 | 05:05:15 | 58725.21198 | 55 | 0.7–4 |
2.1 S45mm receiver
The S45mm receiver is located in the secondary focus of The Effelsberg Telescope, and yields 4 GHz of bandwidth between either 4–8 GHz or 5.3–9.3 GHz. The receiver has an SEFD of 18 Jy. All the observations made using this receiver in this work are in the 5.3–9.3 GHz mode, except for the observations of PTF10hgi, which were taken in the 4–8 GHz mode. The data are recorded with full Stokes using two ROACH2 backends, each capturing 2 GHz of the band, with a 131 s sampling rate, and a 0.976562 MHz channel bandwidth across 4096 channels. The resultant data are in a Distributed Aquisition and Data Analysis (DADA) format555http://psrdada.sourceforge.net, from which Stokes I is extracted.
During the observaion on 22nd October 2018, a problem occurred with the S45mm receiver, resulting in poor attenuation levels making the receiver temporarily inoperable, and the use of a different receiver was needed. The S60mm receiver on Effelsberg was used instead, with 500 MHz of bandwidth at 4.6–5.1 GHz, 82 s sampling rate, 512 channels with 0.976562 MHz bandwidth, and an SEFD of 18 Jy. The data are recorded as sub-banded SIGPROC666http://sigproc.sourceforge.net filterbanks, which are a stream of n-bit numbers corresponding to multiple polarization and/or frequency channels over time, and are concatenated before processing.
2.2 PAF receiver
The Effelsberg PAF (Deng et al., 2018) is a dense array of antenna elements installed at the telescope’s primary focus, adapted from the models used by ASKAP (Hay & O’Sullivan, 2008; Johnston et al., 2008). Its 188 elements form a checkerboard shape over a 1.2 m diameter circle and the output of these elements are combined to form beams, controlled by varying the element weights.
In its current state, the Effelsberg PAF can produce 22 beams, with 230 MHz of bandwidth centered at 1337 MHz, and an SEFD of 34 Jy. Currently the data are recorded and stored on disk as total intensity DADA files with 512 channels of 0.449074 MHz bandwidth each, and a 216 s sampling time. The data can also be recorded as baseband data. This will be used in future surveys for real-time processing, where we will use the raw voltage data captured from a ring buffer to create full Stokes files with significantly higher frequency and time resolutions than our standard filterbanks.
2.3 UWL receiver
The UWL receiver (Dunning et al., 2015) is a wideband receiver at the Parkes telescope with an SEFD of 25 Jy. It has a bandwidth of 3.3 GHz, ranging from 0.7 to 4 GHz. The data were recorded in two different modes with the MEDUSA backend: full Stokes, with a sampling time of 1024 s and a channel bandwdith of 2 MHz across 1664 channels for the first observation; and Stokes I, with a sampling time of 256 s and 0.5 MHz channel bandwidth across 6656 channels for the latter two observations. The 256 s data were downsampled by a factor of four for consistency and to reduce computation time during analysis. The data are in a Pulsar Flexible Image Transport System (PSRFITS) format (Hotan et al., 2004).
2.4 Data processing
All data products are initially converted to SIGPROC filterbank format before being processed. For the S45mm, S60mm, and UWL data, the PRESTO777github.com/scottransom/presto (Ransom, 2011) software package was used for single pulse searching. We used PRESTO’s rfifind to identify radio frequency interference (RFI) in the data and create an RFI mask to apply to the data. The data were dedispersed from 0–2000 pc cm-3 in steps of 2 pc cm-3 for the S45mm and S60mm data, and in steps of 1 pc cm-3 for the UWL data, and subsequently searched for single pulses using PRESTO’s singlepulsesearch.py with a S/N threshold of 7.
PRESTO searches for single pulses by dedispersing the data and convolving the dedispersed time series with boxcar filters of varying widths to optimise the S/N. PRESTO uses a pre-determined list of boxcar widths to use, so by setting a maximum candidate width, PRESTO will search using boxcars up to that width. We search up to the nearest boxcar width of 20 ms, which is 19.6 ms. We set this limit as FRBs tend not to have widths greater than a few ms at our observed frequencies, and 20 ms is roughly the DM sweep in the S45mm band for the lower limit of the estimated DMs of our targets.
We also compute the spectral modulation index of the candidates, which evaluates the fractional variation of a candidate across its spectrum and distinguishes narrowband RFI from broadband signals (Spitler et al., 2012). The candidate’s modulation index, , is calculated as the normalized standard deviation of intensity across frequency, and must be below the modulation index threshold,
| (2) |
where is the number of frequency channels, and is the signal to noise threshold applied to the data. The candidates were then plotted and analysed by eye with a DM over time plot with marker sizes increasing with S/N. Promising candidates were further inspected using PRESTO’s waterfaller.py plotting tool, which shows the the candidate’s dynamic spectrum and can be downsampled and subbanded at will.
For the PAF data, the GPU based single pulse search software HEIMDALL888sourceforge.net/projects/heimdall-astro was used. This was done to handle the vast amount of multibeam data taken, and to exploit HEIMDALL’s coincidencing capabilities. HEIMDALL’s single pulse searching uses the same convolution method as PRESTO, but achieves much greater processing speeds by utilising GPUs rather than CPUs. For the Effelsberg PAF, every frequency channel is calibrated independently, and channels affected by RFI stronger than the calibration source have undefined pointing positions, resulting in so-called badly beamformed channels. A considerable portion of the channels in the PAF data needed to be zapped during the processing due to both badly beamformed channels, and channels persistently contaminated with RFI. These channels amounted to 89 MHz, or 39% of the PAF band, and were flagged to be ignored by HEIMDALL. The data were dedispersed from 0–2000 pc cm-3. The DM steps in HEIMDALL are determined by the pulse broadening induced by the size of the DM step, so each DM trial is a function of the previous DM value and the data parameters (Levin, 2012). An initial detection threshold of was applied. HEIMDALL groups candidates which are close in DM and time, and the group’s candidate with the highest S/N is the candidate given by HEIMDALL. This multi-beam data needed to be coincidenced in order to identify false candidates appearing across many beams simultaneously, so the single pulse candidates were ran through HEIMDALL’s coincidencer. The candidates were then sifted further in order to reduce the large number of false positives with low DMs and large widths: an increased S/N threshold of 8, a low DM threshold of 20 pc cm-3, and a maximum candidate width of 28 ms were applied. In addition, candidates detected in mulitple beams go through further sifting. By taking the beam with the strongest S/N as the reference point, the other beam detections need to occur within the adjacent beams for the candidate to pass the sifting. The remaining candidates were then run through our own plotting tool999github.com/ghenning/PAFcode which plots dedispersed time series, dynamic spectrum, and a dedispersed dynamic spectrum. The dynamic spectra can also be downsampled and subbanded by factors of our choosing. These plots were then inspected by eye.
We are aware of potential difficulties due to the DM sweep across the 4–8 GHz band. For a DM of 500 pc cm-3 the sweep is 50 ms, so a narrowband signal might be difficult to distinguish from zero-DM RFI. At the start of each observation we do however observe the pulsar B0355+54, which has a DM of 57 pc cm-3, and are able to detect its single pulses.
3 Results & Analysis
From the 63 hours of observational data, we have not detected any single pulses from any of the sources observed above our fluence limits of 0.04 Jy ms for the S45mm receiver, 0.53 Jy ms for the PAF receiver, and 0.07 Jy ms for the UWL receiver, for burst widths of ms.
Assuming Poissonian statistics, we can estimate the upper-limit to the rate of bursts emitted above our detection threshold on a source-by-source basis (Gehrels, 1986, Table 1). We also estimate the burst rate of an FRB121102-like source from each of the SLSNe/LGRBs observed. The C-band results from the observed SLSNe/LGRBs and the PTF10hgi results with the PAF and UWL receivers are shown in their respective following subsections.
To estimate the rate of an FRB121102-like source at different locations we make use of a brightness distribution power-law,
| (3) |
where and are the rate and energy, respectively, and are values for a reference source, and is the FRB brightness distribution power-law index. Here we use as estimated by James (2019) independently of instrumental sensitivity by combining the multi-telescope observing campaign of FRB121102 (1.4 and 3 GHz, Law et al., 2017) and the GBT BL observations (6 GHz, Gajjar et al., 2018). An index of was obtained by Gourdji et al. (2019) from 41 FRB121102 bursts at 1.4 GHz using Arecibo. These values of are inconsistent with each other, potentially due to Arecibo’s survey probing unprecedentedly low burst energies of FRB121102, or its high sensitivity (Gourdji et al., 2019). We choose because the sensitivity of Effelsberg is closer to GTB and VLA than Arecibo, and this value is partially derived from detections in C-band.
The rate calculation also requires a relation between fluence and energy of a transient, considered specifically for the case of FRBs as Macquart & Ekers (2018)
| (4) |
where is the intrinsic bandwidth of an FRB, is the source’s redshift, is the spectral index, is the total energy of a burst, and is the luminosity distance to the bursting source. The spectral index for FRBs is not well constrained, and given the absence of information we assume a flat spectrum with negating the need for a k-correction. James (2019) argues that Eq. 4 applies for bursts more broad-band than the observing bandwidth. Bursts from FRB121102 have smaller fractional bandwidth (Hessels et al., 2019, Fig. 1), so Eq. 4 can be written as the observed fluence averaged across the observing band, , (James, 2019, Eq. 8)
| (5) |
We can then estimate the rate of bursts from FRB121102-like sources located at different luminosity distances/redshifts, for surveys with different sensitivities by combining eqs. 3 and 5:
| (6) |
with the subscripts of 0 being the values for FRB121102, and being the fluence limit.
3.1 C-band observations of SLSNe/LGRBs
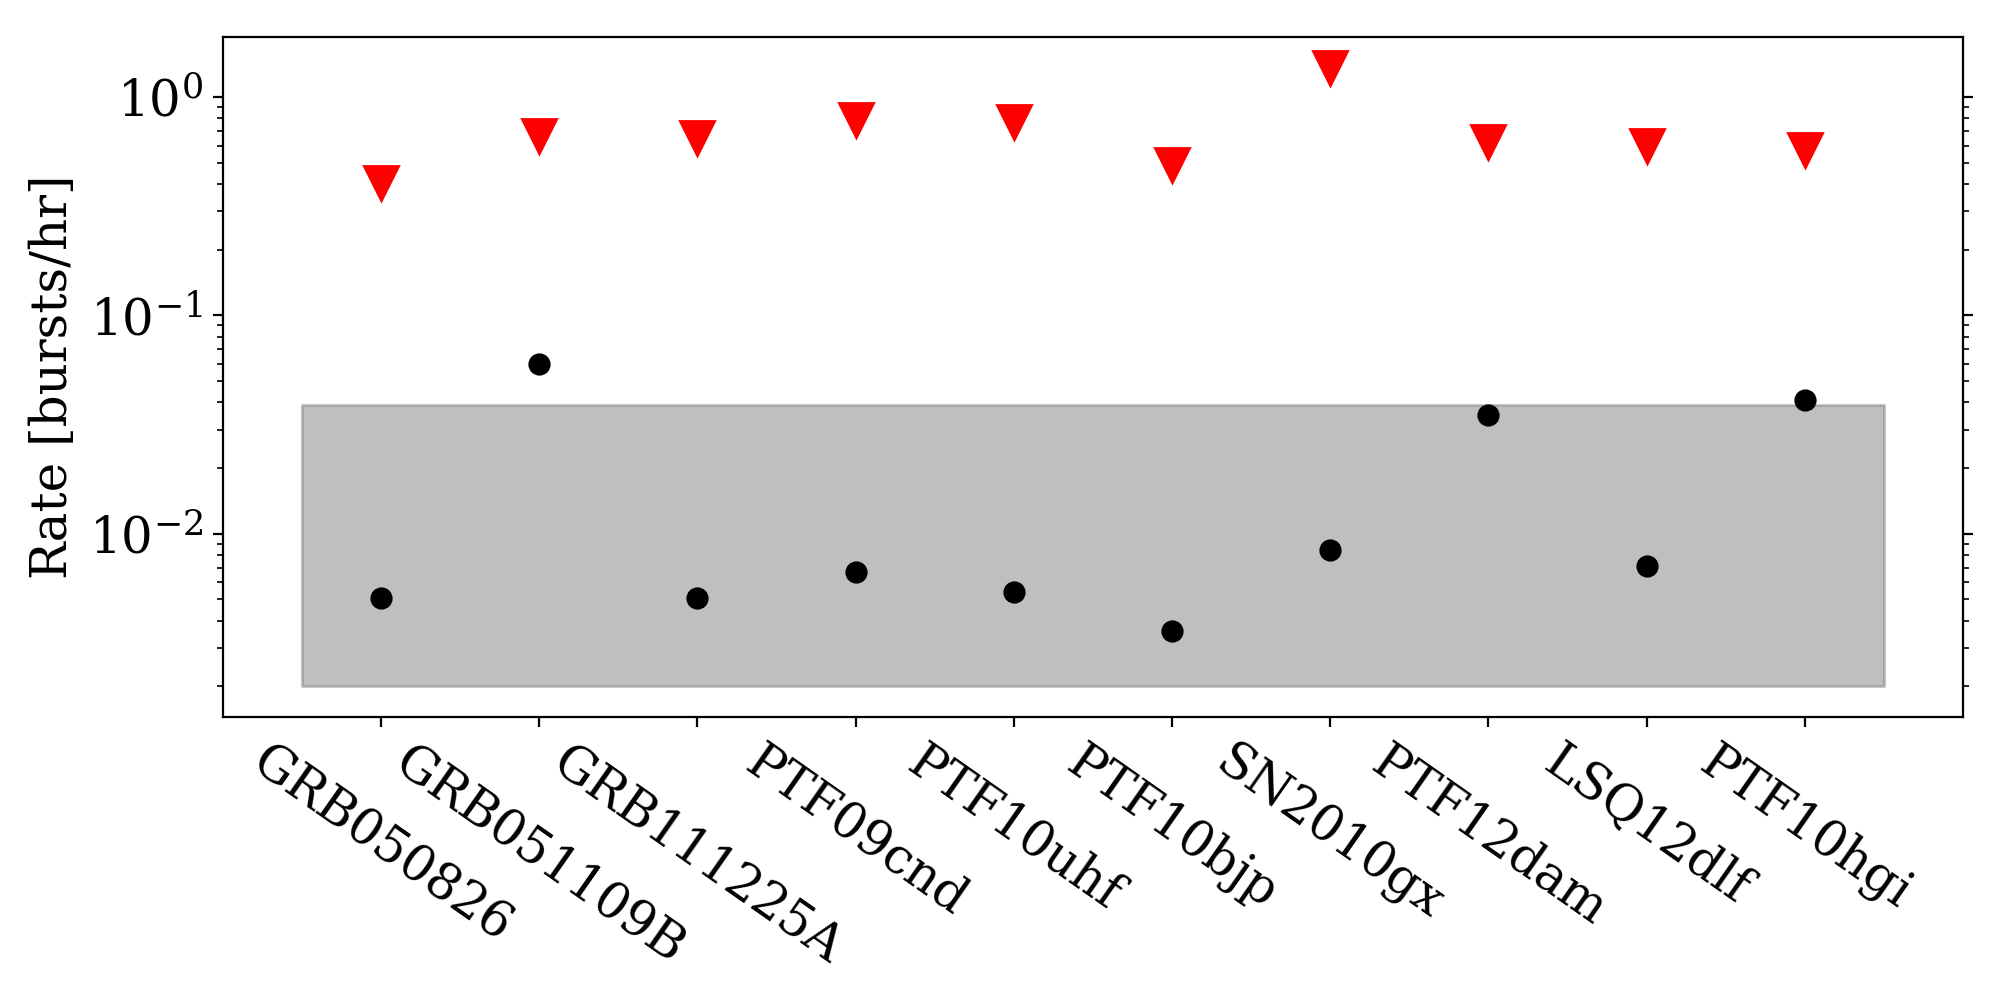
The 95% confidence level (CL) upper-limit to the burst rates we obtain from our observations, assuming Poissonian statistics, are in the range of 0.4–1.4 bursts/hr and are shown in Table 3 and Fig. 1.
Observing campaigns of FRB121102 at high frequencies have reported various average burst rates. Gajjar et al. (2018) reported 21 detections in a single 6 hr observation at the Green Bank Telescope (GBT) using the 4–8 GHz Breakthrough Listen (BL) Digital Backend. Spitler et al. (2018) have three detections in 22 hrs with the 4.6–5.1 GHz, S60mm receiver at Effelsberg in an observing campaign spanning 4 months.
We also have obtained a rate of 0.012 bursts/hr (1 error)101010All uncertainties in burst rates reported here are 1 errors. from an ongoing campaign using the 4–8 GHz, S45mm receiver at Effelsberg (Hilmarsson et al., 2020). In that campaign, which yields a single detection from 86 hrs of observations spanning two years, FRB121102 is observed for 2–3 hours at a time with a roughly two week cadence (with gaps due to telescope/receiver maintenance). This rate is more robust than previously reported rates in the sense that it is a long-term average consisting of multiple observations, and does not depend on a single bursting phase. It is also obtained using the same observational setup as in this work.
Using the burst rate of FRB121102 from Hilmarsson et al. (2020) of 0.012 bursts/hr, we estimate the burst rate of an FRB121102-like source located at each of the SLSNe/LGRBs observed. Since we are working with the same observational setup and identical bursts at different locations, we can simplify Eq. 6 by setting and to 1:
| (7) |
The hypothetical rate of an FRB121102-like source located at our sources of interest can be found in Table 3, and is shown in Fig. 1. There we have also estimated the number of bursts we would have expected to see from an FRB121102-like source during our observations, as well as how long we need to observe each source without a detection in order to constrain our estimated rates, i.e. the observation time required for the upper limit to the rate to reach the scaled rate.
The scaled rates from FRB121102 are influenced by the difference in luminosity distance between FRB121102 and the SLSNe/LGRBs, yet they do fall within the 1 range of FRB121102’s rate at C-band. This also implies that the time needed to constrain the scaled rates reaches impractical observation times for most of the sources (upwards of 300 hours). However, three of our sources, GRB051109B, PTF12dam, and PTF10hgi, have luminosity distances less than FRB121102, and therefore have a higher scaled rate than FRB121102. Since no bursts were detected in this work, constraining the scaled rates of these three sources is quite a feasible task for further surveys.
| Obs. band [GHz] | Source name | [hr] | [hr-1] | [Mpc] | [hr-1] | [hr] | |
| 4–8 | FRB121102 | - | - | 950 | 0.012 | - | - |
| GRB050826 | 7.4 | 0.41 | 1550 | 0.01 | 0.04 | 582 | |
| GRB051109B | 4.5 | 0.67 | 370 | 0.06 | 0.27 | 50 | |
| GRB111225A | 4.6 | 0.65 | 1550 | 0.01 | 0.02 | 582 | |
| PTF09cnd | 3.8 | 0.79 | 1320 | 0.01 | 0.03 | 447 | |
| PTF10uhf | 3.9 | 0.77 | 1500 | 0.01 | 0.02 | 550 | |
| PTF10bjp | 6.1 | 0.49 | 1930 | 0.01 | 0.02 | 831 | |
| SN2010gx | 2.2 | 1.4 | 1150 | 0.01 | 0.02 | 358 | |
| PTF12dam | 4.8 | 0.62 | 500 | 0.03 | 0.17 | 85 | |
| LSQ12dlf | 5 | 0.60 | 1270 | 0.01 | 0.04 | 420 | |
| PTF10hgi | 5.3 | 0.57 | 460 | 0.04 | 0.21 | 73 | |
| 1.2–1.4 | FRB121102 | - | - | 950 | 0.11 | - | - |
| PTF10hgi | 13.0 | 0.41 | 460 | 0.4 | 5 | 14 | |
| 0.7–4.0 | FRB121102 | - | - | 950 | 0.62 | - | - |
| PTF10hgi | 2.3 | 2.26 | 460 | 2.2 | 5 | 3 | |
| 99.5% CL upper-limit. | |||||||
3.2 PAF & UWL observations of PTF10hgi
We repeat the analysis from the previous section for the 13 hrs of PTF10hgi data taken with the PAF and the 2.3 hrs taken with the UWL. In order to do so, we use the rate from a recent FRB121102 survey (28 bursts in 116 hrs) performed at L-band using the P217mm 7-beam ( Jy) receiver at the Effeslberg telescope. The average burst rate is 0.24 bursts/hr above a fluence of 0.14 Jy ms (Cruces et al., 2020).
This rate must to be scaled to the PAF and UWL receivers, which we do using Eq. 6. For the factor of we use the radiometer equation (Dicke, 1946)
| (8) |
where SEFD is the system equivalent flux density, S/N is the signal to noise, is the number of polarizations, is the receiver bandwidth, and is the burst width. The rate conversion from Eq. 6 then becomes
| (9) |
where the last two bracketed terms are equal to 1 when converting rates for the same source. The FRB121102 burst rate scaled to the PAF and UWL receivers is bursts/hr above 0.53 Jy ms, and bursts/hr above 0.07 Jy ms respectively. Note that we are scaling burst energies to different observing bandwidths, so under the assumption that does not depend on the central frequency of the observing bandwidth we add an additional term of to Eq. 9 when scaling from the P217mm receiver to the PAF and UWL receivers.
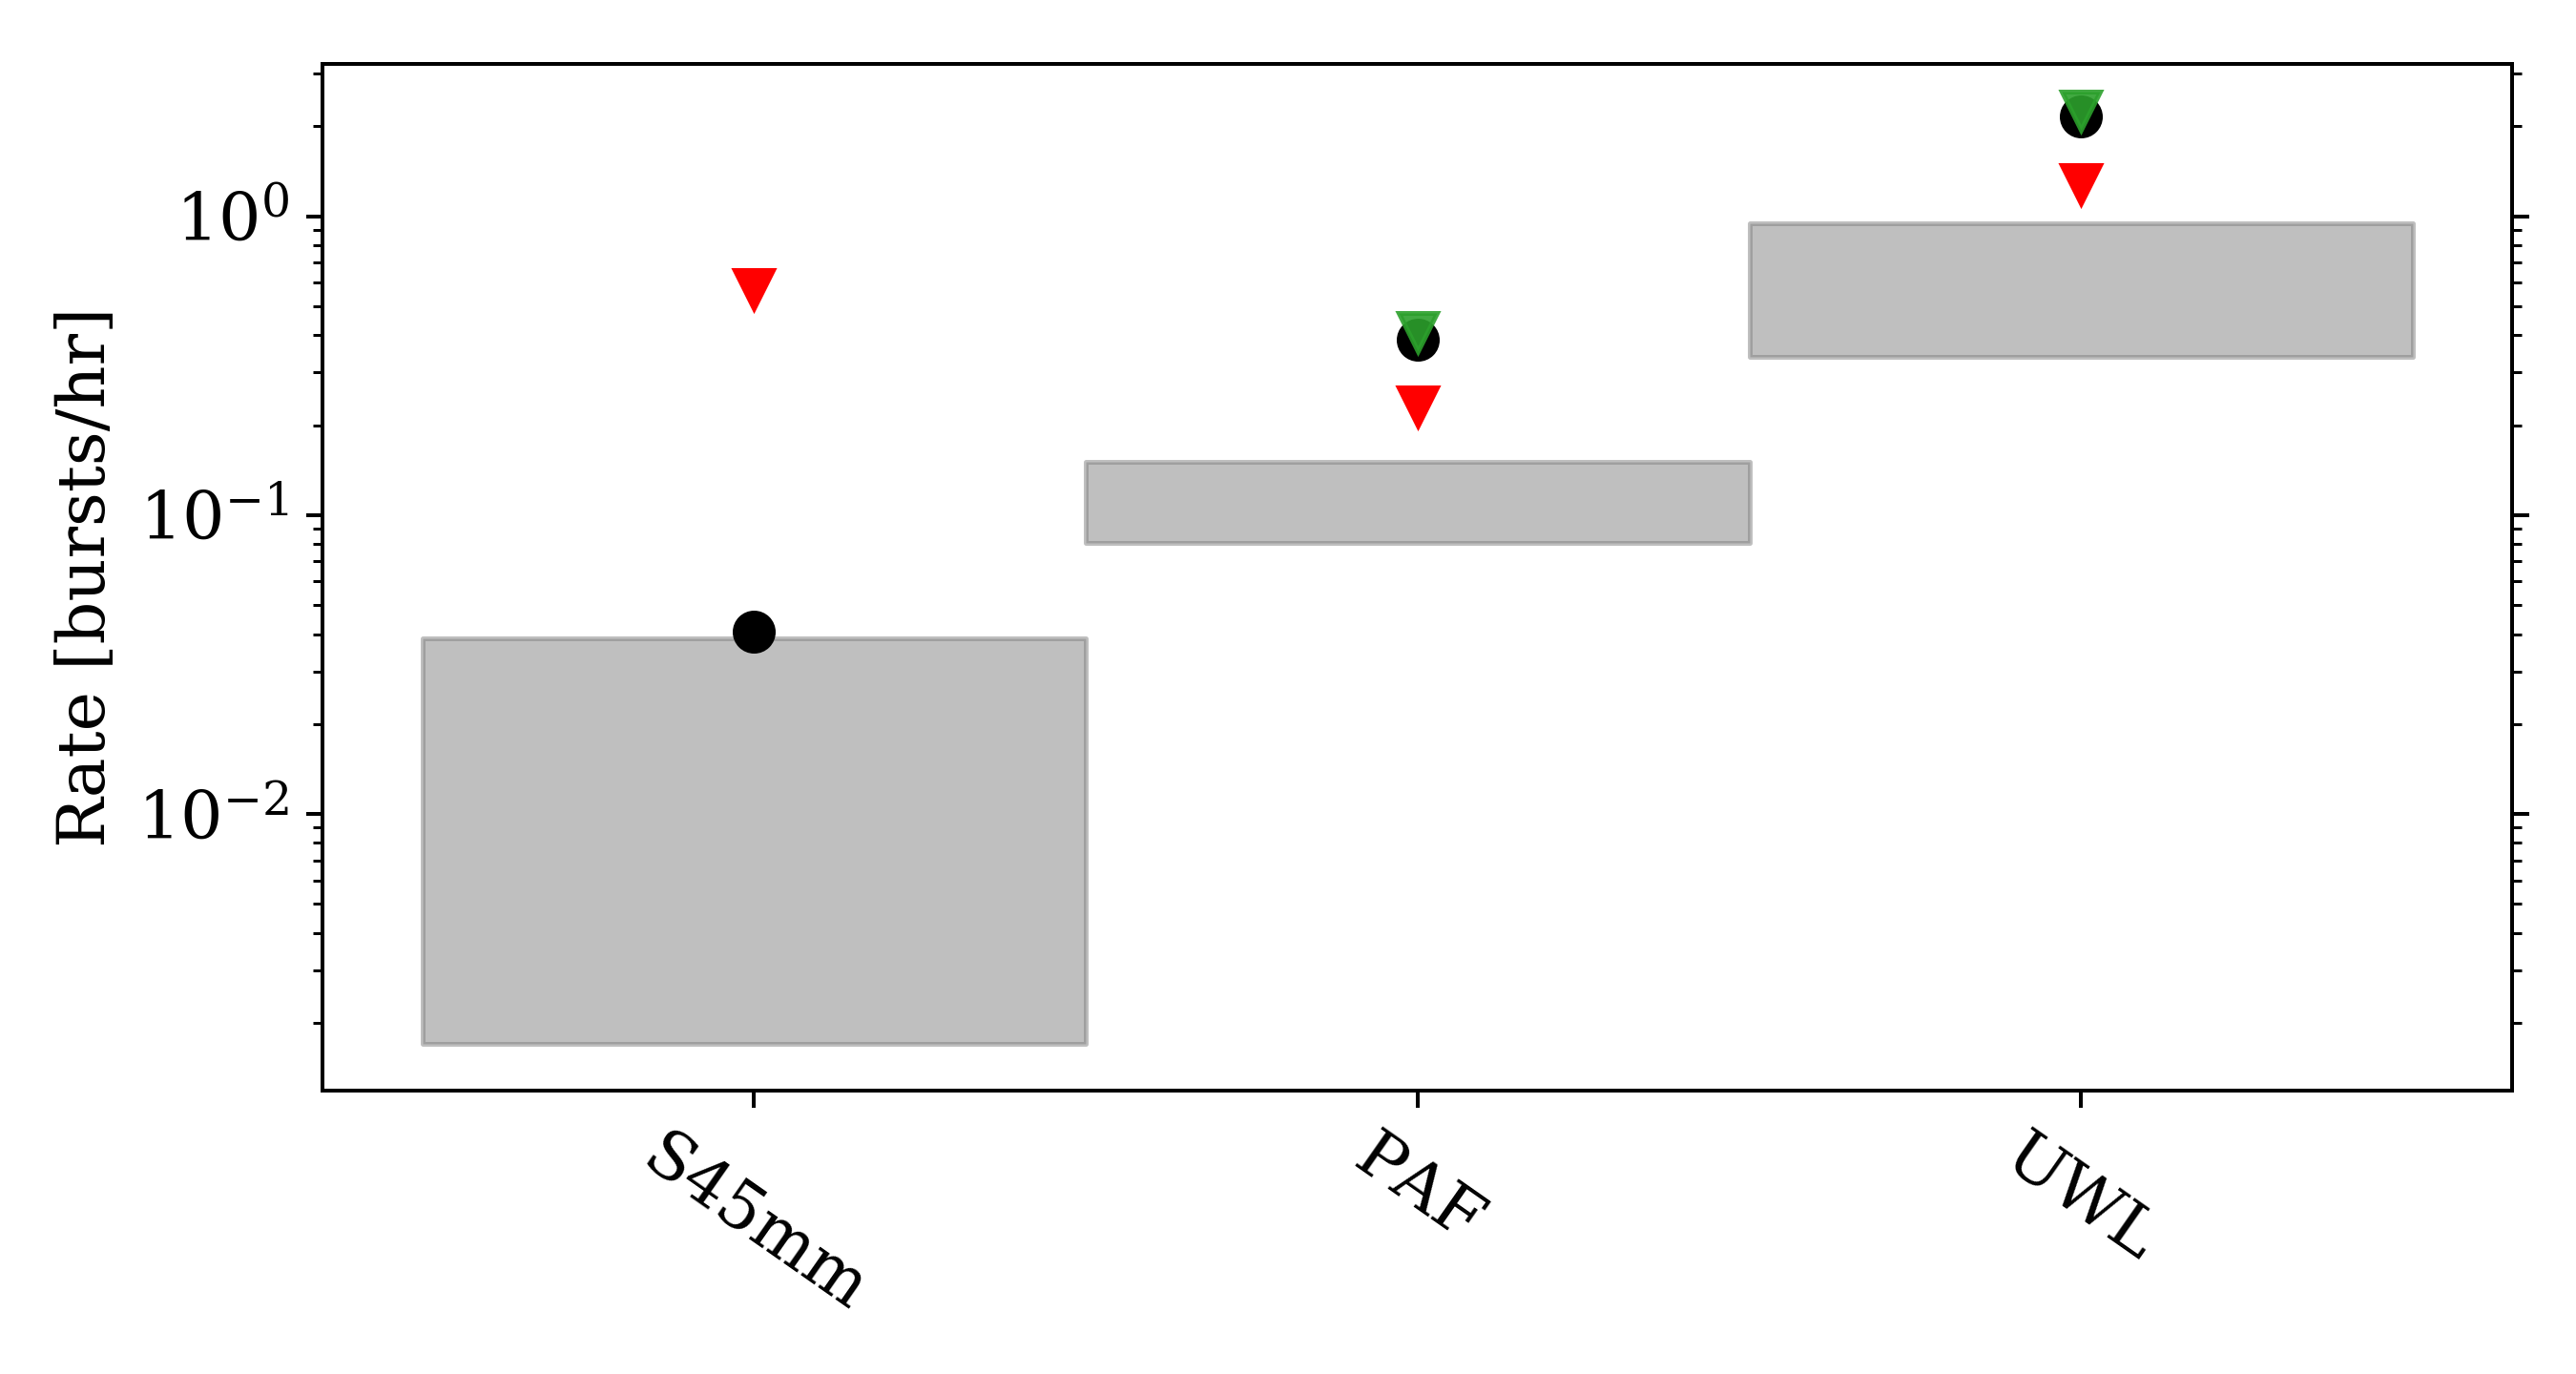
The resulting rate, obtained by using Eq. 9, for an FRB121102-like source located at PTF10hgi is bursts/hr for the PAF receiver, and bursts/hr for the UWL receiver. From the 13 hour observations with the PAF, we would have expected to detect 4–7 bursts on average by assuming this rate. We exclude this rate at the 99% confidence level for such a source inhabiting PTF10hgi. Likewise, for the 2.3 hour observations with the UWL receiver we would have expected 4–6 bursts on average, and exclude this rate at the 99% confidence level. The results are shown in the bottom section of Table 3 and in Fig. 2.
The fact that we do not detect any bursts and rule out the rate of an FRB121102-like source with a Poissonian distributed bursting activity inhabiting PTF10hgi can be interpreted in various ways: i) The most straightforward reason is that PTF10hgi simply does not contain a repeating FRB source, or at the very least not a source as active as FRB121102, as FRB121102 might be an abnormally active bursting source (e.g. Palaniswamy et al., 2018). ii) The assumption that FRBs are related to young magnetars within SNRs might not be correct. iii) The FRB121102-like source may have been observed during a quiescent state, so no bursts were emitted during our observations. If this were the case, it would directly imply that the bursting activity of the source is non-Poissonian. iv) PTF10hgi’s age was roughly nine years at the time of the observations, so the SNR could be at the threshold of being optically thin at 1.4 GHz (Metzger et al., 2017). The SNR could simply still be opaque at 1.4 GHz, meaning that we cannot observe emitted bursts at that frequency, given that the emission has to travel through the SNR. v) The emission might be beamed and the bursts were not beamed towards us at the time of observing, so we were unable to detect bursts from the source.
3.3 Beaming fraction
Emission mechanisms that generate luminous radio emissions are generally beamed, so a beaming fraction for our model should be taken into consideration. The beaming fraction, , is the fraction of the celestial sky covered by the radio beam, and in the case of rotation it is how much is covered during a single rotation.
The coherent emission process by a single unit (particle or bunch of particles) has a beaming opening angle of , where is the Lorentz factor of the unit. Cordes & Chatterjee (2019) discuss three possibilities of FRB beaming geometries. First is a relativistic jet comprised of emission from multiple incoherent units, and whose beaming is thus much greater than from the coherent emission of a single unit. Second is a relativistic jet rotating around an axis, where the beam sweeps out an annulus shaped area during each revolution, similar to pulsars. Third is quasi-isotropic emission from a spherical shell.
Within the magnetar model framework, two distinct locations of emission have been discussed in the literature: a synchrotron maser mechanism from relativistic shocks in the material surrounding the magnetar (Lyubarsky, 2014; Beloborodov, 2017), and pulsar-like emission in the magnetosphere (Kumar et al., 2017; Yang & Zhang, 2018). Metzger et al. (2019) model a synchrotron maser in a baryon-loaded shell that can produce bursts over the full area of the SNR, relating to the aforementioned third beaming gemoetry. The geometric probability of having a burst pointed towards an observer is therefore 1. Similarly, Beloborodov (2019) proposes that FRBs are produced in an electron-positron plasma in the helical-B winds of a rotating magnetar, where the geometric probability is on the order of steradians over the celestial sphere. The lower limit to the beaming fraction of a burst is for a single emitting unit. If multiple units are emitting, then the beaming fraction of a single FRB follows the first beaming scenario previously described. The probability of a burst being directed towards an observer depends on the rate of burst generation and the beaming of each burst, but the details are beyond the scope of this paper.
However, we can estimate beaming fractions relating to the second, pulsar-like beaming geometry using the Crab pulsar, which has been used to model extragalactic FRBs (Cordes & Wasserman, 2016). We estimate the beaming fraction of the pulsar-like emission as a function of the opening angle of the emission beam, , and the angle between the rotation and magnetic axes, (Tauris & Manchester, 1998, Eq. 7). For the Crab, is estimated to be between 45 and 70 degrees (Lyne et al., 2013), and can be calculated from the pulsar’s period (Everett & Weisberg, 2001, Eq. 7). The period of the Crab is 33.3 ms111111atnf.csiro.au/research/pulsar/psrcat/ (Manchester et al., 2005), resulting in . Thus the beaming fraction of the Crab is between 0.5–0.7.
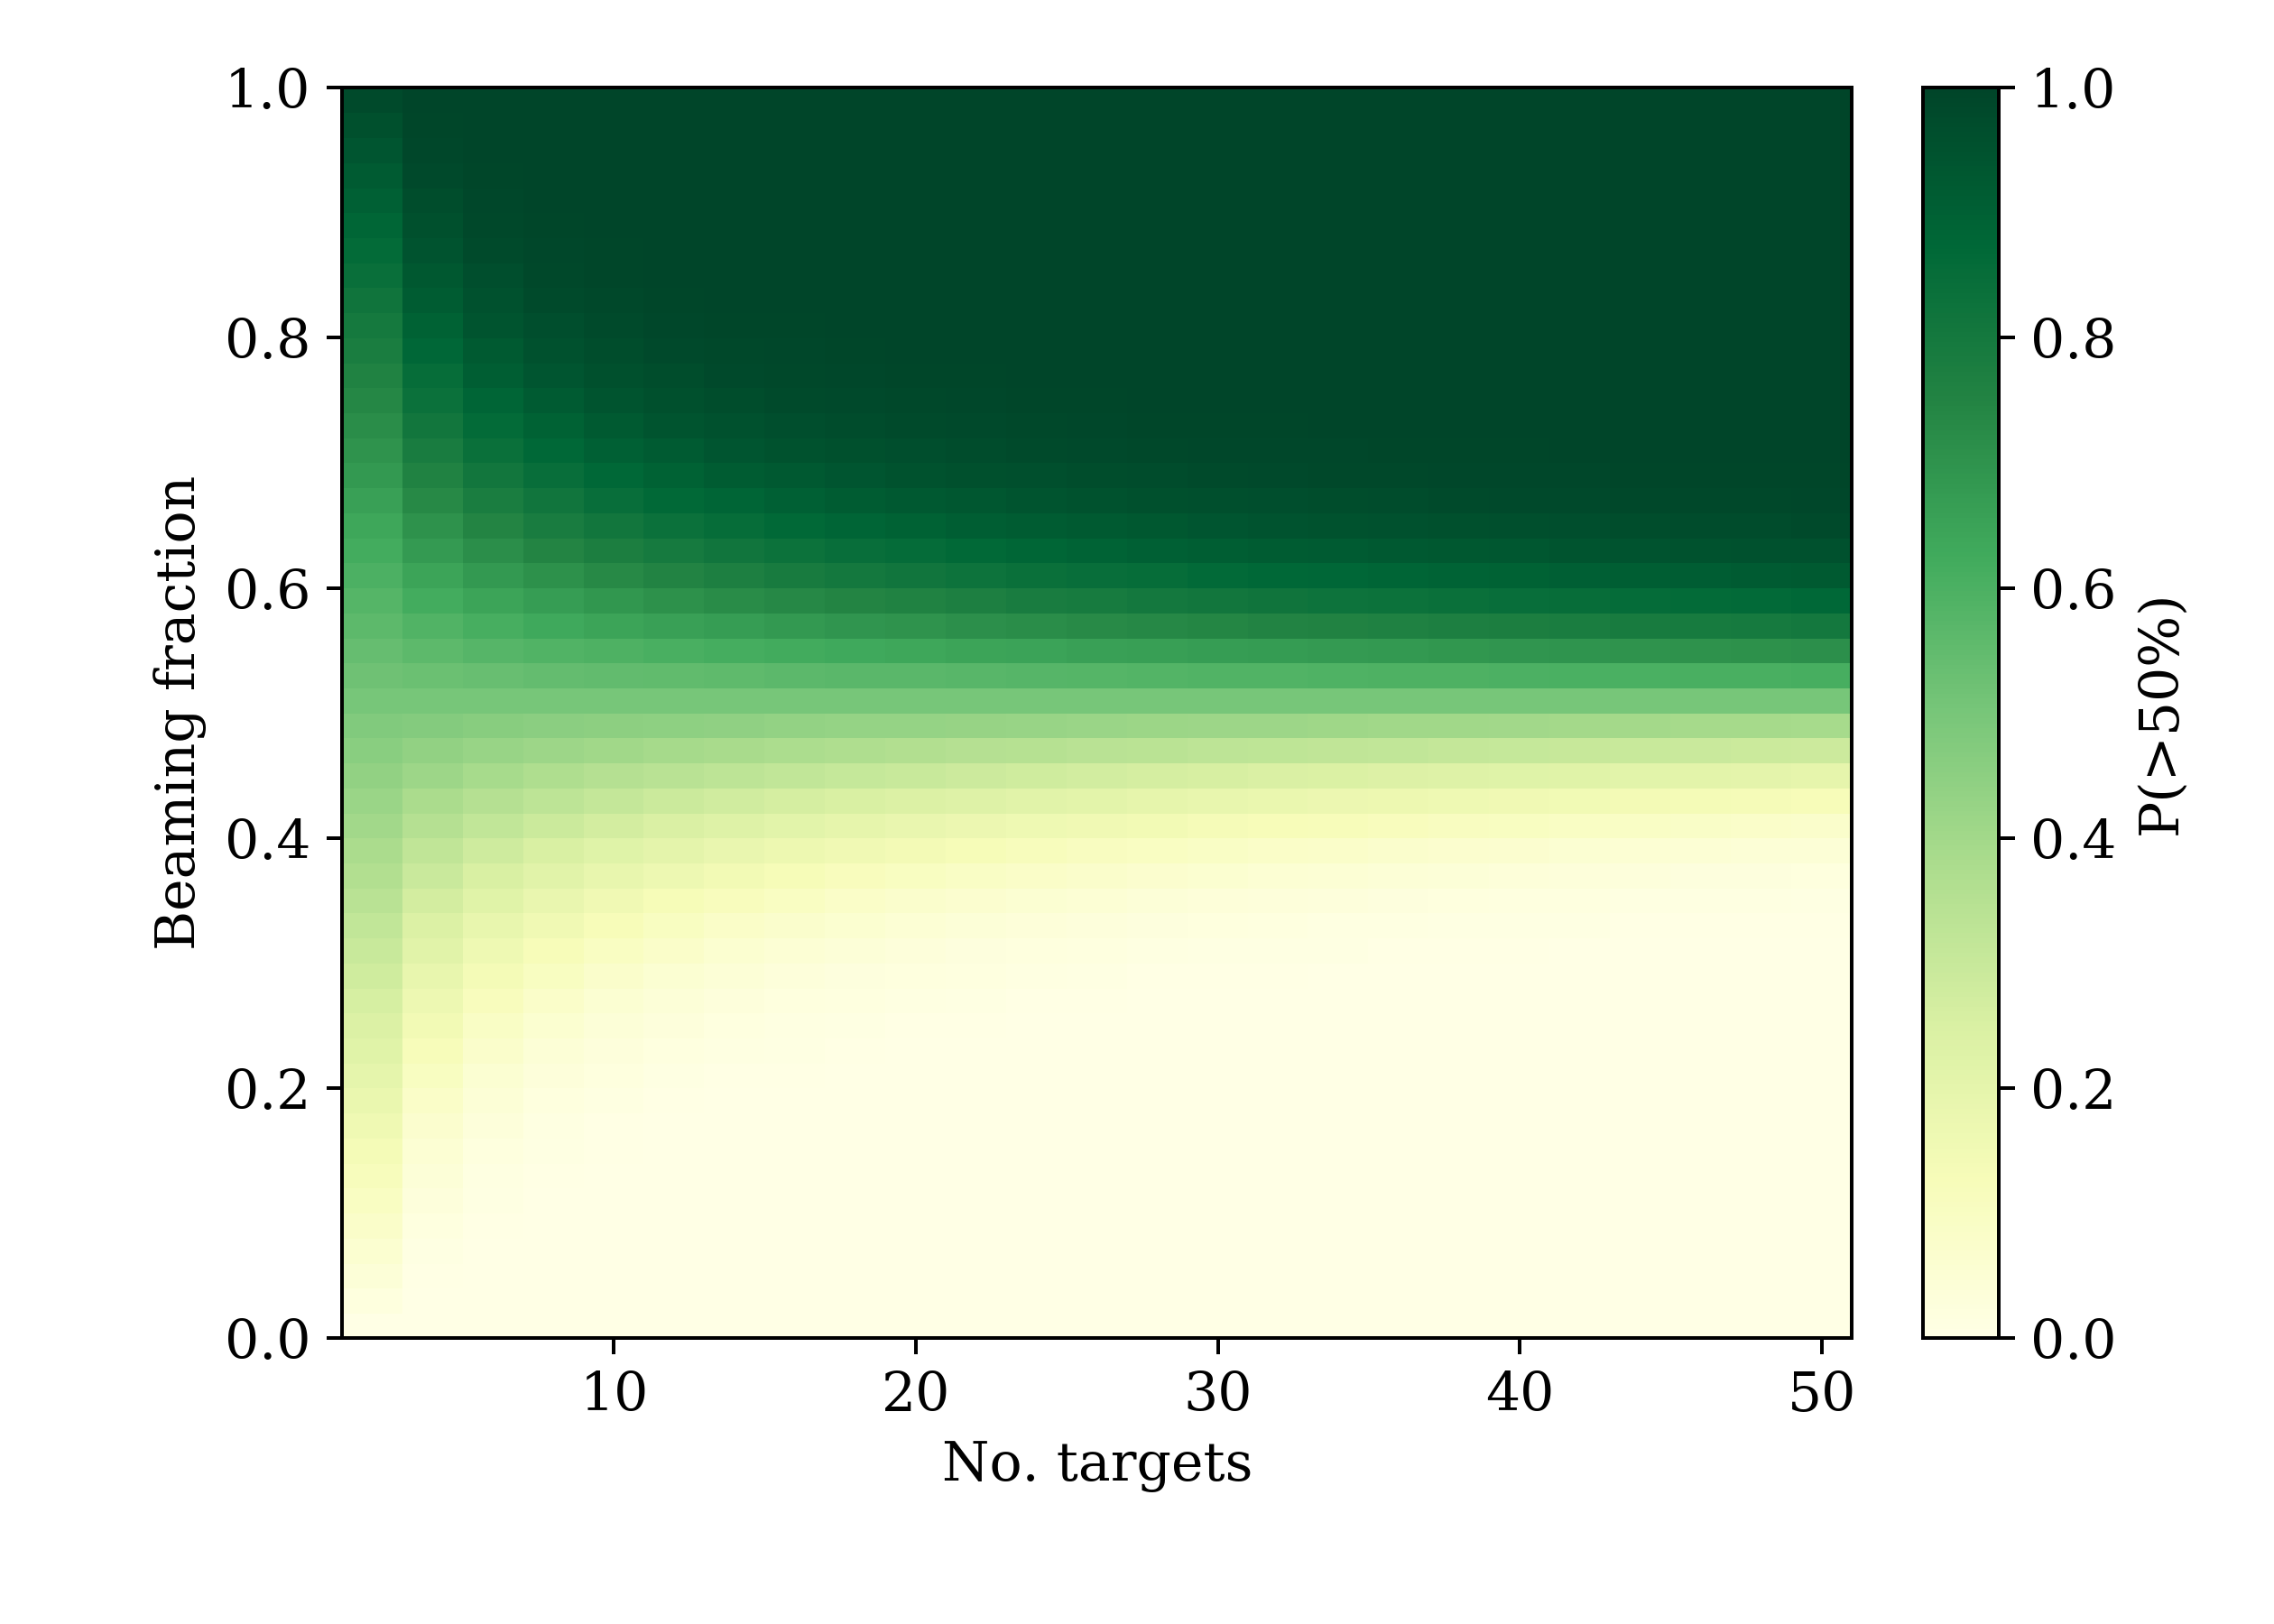
Assuming a fiducial beaming fraction value of 0.6, there is a 99.99% probability that at least one of our sources is beamed towards us and an 83.4% probability of at least half being beamed towards us. We also plot the probability that half or more of targeted sources are beamed towards us, , as a function of various number of sources, , and beaming fractions in Fig. 3. From this figure we see that consistently reaches above 70% for and .
3.4 Poisson & Weibull distributions
Repeating bursts from FRB121102 have hitherto been treated as if they follow the Poissonian process, which describes discrete, stochastically occurring events with a known average time between them. A Poisson distribution describes the probability to observe a number of events following the Poisson process for an certain time period (e.g. an observation).
FRB121102 does not appear to follow this process. FRB121102 goes through phases of quiescence and activity (Spitler et al., 2016; Law et al., 2017), i.e. observed bursts appear clustered together. A better way to describe bursts from FRB121102 might be with a Weibull distribution, which has a more complex parametrization than a Poissonian distrubution. A Weibull distribution has a shape parameter, , which describes the degree of clustering; a rate parameter ; and is written as Oppermann et al. (2018, Eq. 2):
| (10) |
where are the intervals between subsequent bursts and is the gamma function. For , the Weibull distribution becomes a Poissoinan distribution. If , a clustering with small intervals between bursts is favoured, so if a burst is detected, and observer is more likely to detect subsequent bursts on a short timescale afterwards. Oppermann et al. (2018) performed an analysis on L-band observations of FRB121102 in order to estimate and . They find that the posterior mean values of the shape parameter and rate are and bursts/hr, respectively. They also find that the Poissonian case of is strongly disfavored. Cruces et al. (2020) performed the same analysis on their aforementioned survey, and obtain a shape factor of and a rate of bursts/hr. These Weibull analysis rates are consistent with the Poissonian rate of bursts/hr above 0.14 Jy ms from Cruces et al. (2020).
We can estimate the probability of not detecting a burst from a source with Weibull-distributed bursting activity for an observation of duration as Oppermann et al. (2018, Eq. 18):
| (11) |
where is the bursting rate, is the gamma function, and is the incomplete gamma function. The likelihood for multiple observations can be obtained by multiplying the probabilities of each individual observation, given that the cadence of the observations is greater than the spacing between bursts.
We can estimate this probability for our 13 hr PAF observations at L-band of PTF10hgi (consisting of four separate observations of 1.5–4 hrs, see Table 2). We use the values from Cruces et al. (2020) of and bursts/hr. First we need to scale this rate from FRB121102 to PTF10hgi and from the P217mm receiver to the PAF receiver using Eq. 9, resulting in a rate of bursts/hr. The resulting probability of not detecting a burst from these observations, assuming that PTF10hgi contains an FRB121102-like source, is 14%.
We repeat this analysis for the UWL observations, which were three observations of 42, 44, and 55 minutes, using the same shape factor and rate. The scaled rate of PTF10hgi from the P217mm to the UWL receiver is 2.42 bursts/hr, and we obtain a 16% probability of not detecting a burst from these observations.
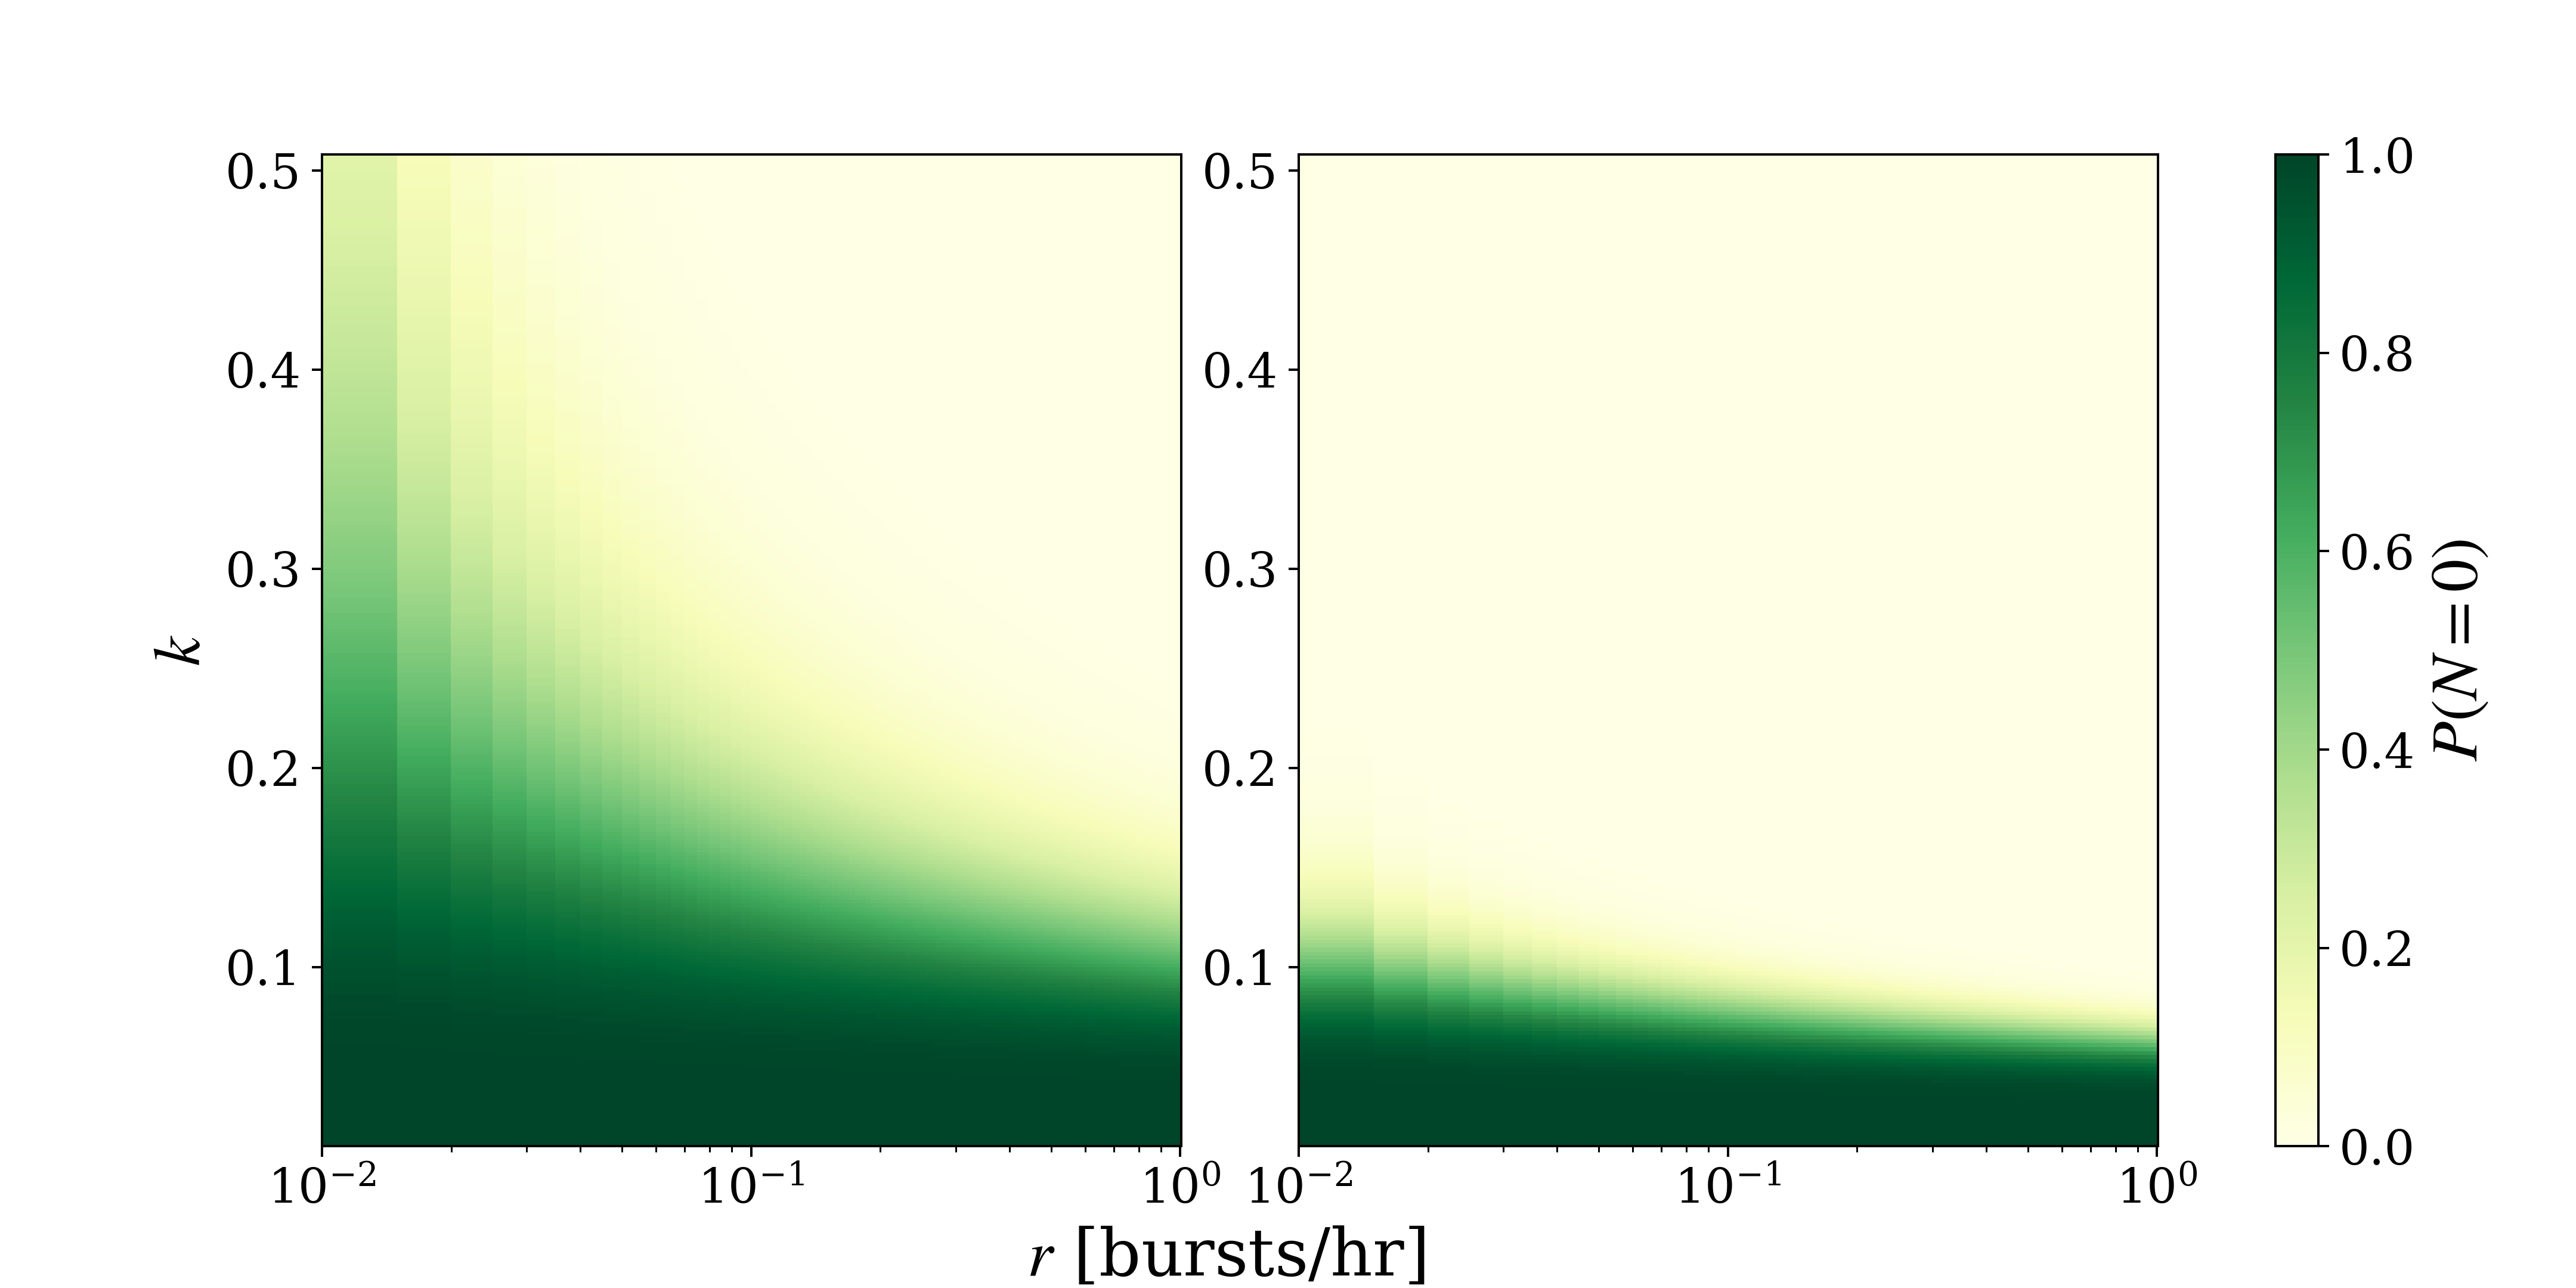
To perform the same calculations for the S45mm receiver observations, a burst event analysis for C-band observations of FRB121102 is needed in order to estimate the shape parameter and rate . This analysis is beyond the scope of this work, however we plot the probability of detecting zero bursts as a function of the shape parameter and rate. We illustrate two cases: the observations of PTF10hgi with the S45mm receiver presented here, and a hypothetical survey of 24 3-hr sessions (i.e. the time required to constrain the upper rate limit, see Table 3), shown in Fig. 4. There we see that the probability of not detecting any bursts rapidly decreases with increasing , and that we can already exclude the L-band parameters from our observations. The lack of bursts detected from FRB121102 at C-band, compared to L-band detections, might lead one to believe that and are frequency dependent, with both being lower at higher frequencies. If we were to continue obsering PTF10hgi at C-band in the same fashion until we have reached the time to constrain the Poisson rate, we could also place constraints on and . This hypothetical survey of 72 hrs shows that there is 0% chance of not detecting a burst for and burst/hr, and would constrain the upper-limit of to if no burst was detected.
4 Discussion & Conclusions
In this work we investigate the possibility of SLSNe/LGRBs hosting FRB121102-like progenitors. We have observed 10 targets for 63 hours using the S45mm (5.3–9.3 GHz) and PAF (1.2–1.5 GHz) receivers at Effelsberg and the UWL receiver (0.7–4 GHz) at Parkes, but have found no bursts.
By assuming an FRB121102-like source is located at our observed targets, we have estimated their scaled burst rates with respect to luminosity distance, redshift, and telescope sensitivity. We have also calculated the upper limit rate for each source, based on our non-detections. The rate upper limits do not constrain any of the scaled rates at C-band, but the scaled rates for three of our sources, GRB051109B, PTF12dam, and PTF10hgi, can be constrained with a reasonable amount of observing time.
PTF10hgi is a source of particular interest, as a persistent radio source which is coincident with the SLSN was recently detected. This system could be analogous to FRB121102, and detecting an FRB originating from it could be instrumental in deciphering the enigmatic nature of these bursts. We have therefore spent 5.3 hrs observing PTF10hgi at 6 GHz with the S45mm receiver, 13 hrs at 1.4 GHz during the commissioning of the PAF receiver at Effelsberg, and 2.3 hrs at 2.4 GHz with the UWL receiver at Parkes. We did not detect any bursts from those observations, and rule out at the 99% CL the scaled PAF and UWL rates at L-band of an FRB121102-like source inhabiting PTF10hgi. There are several possibilities for why we have not detected any bursts: i) PTF10hgi does not contain an FRB121102-like source, ii) FRBs might not be related to young magnetars within SNRs, iii) the source was observed during a quiescent state, iv) PTF10hgi’s SNR might still be opaque at L-band, v) or bursts from the source are simply not beamed towards us,
When we adopt a beaming fraction of 0.6 for our sources we show there is 99.99% chance that at least one of our hypothetical targets would be beamed towards us, and an 83.4% probability that at least five of them are beamed towards us. From Fig. 3 we note that for beaming fractions larger than 0.6, at least half of the sources will consistently have a high probability of being beamed towards us.
The clustering of bursts from FRB121102 could be better explained with a Weibull rather than a Poissonian distribution (Oppermann et al., 2018). Using a shape factor of and a scaled rate of 0.43 bursts/hr for a Weibull distribution (Cruces et al., 2020) we estimate a 14% probability of not detecting a burst from our PAF receiver observations of PTF10hgi, assuming it contains an FRB121102-like source. By using the same shape factor and a rate of 2.42 bursts/hr for our UWL observations we estimate a 16% probability of not detecting a burst. We do not have an estimate of the shape factor at C-band, however we plot the probability of not detecting a burst as a function of and for our S45mm receiver observations of PTF10hgi in Fig. 4, and show that the L-band rate and shape factor are already excluded.
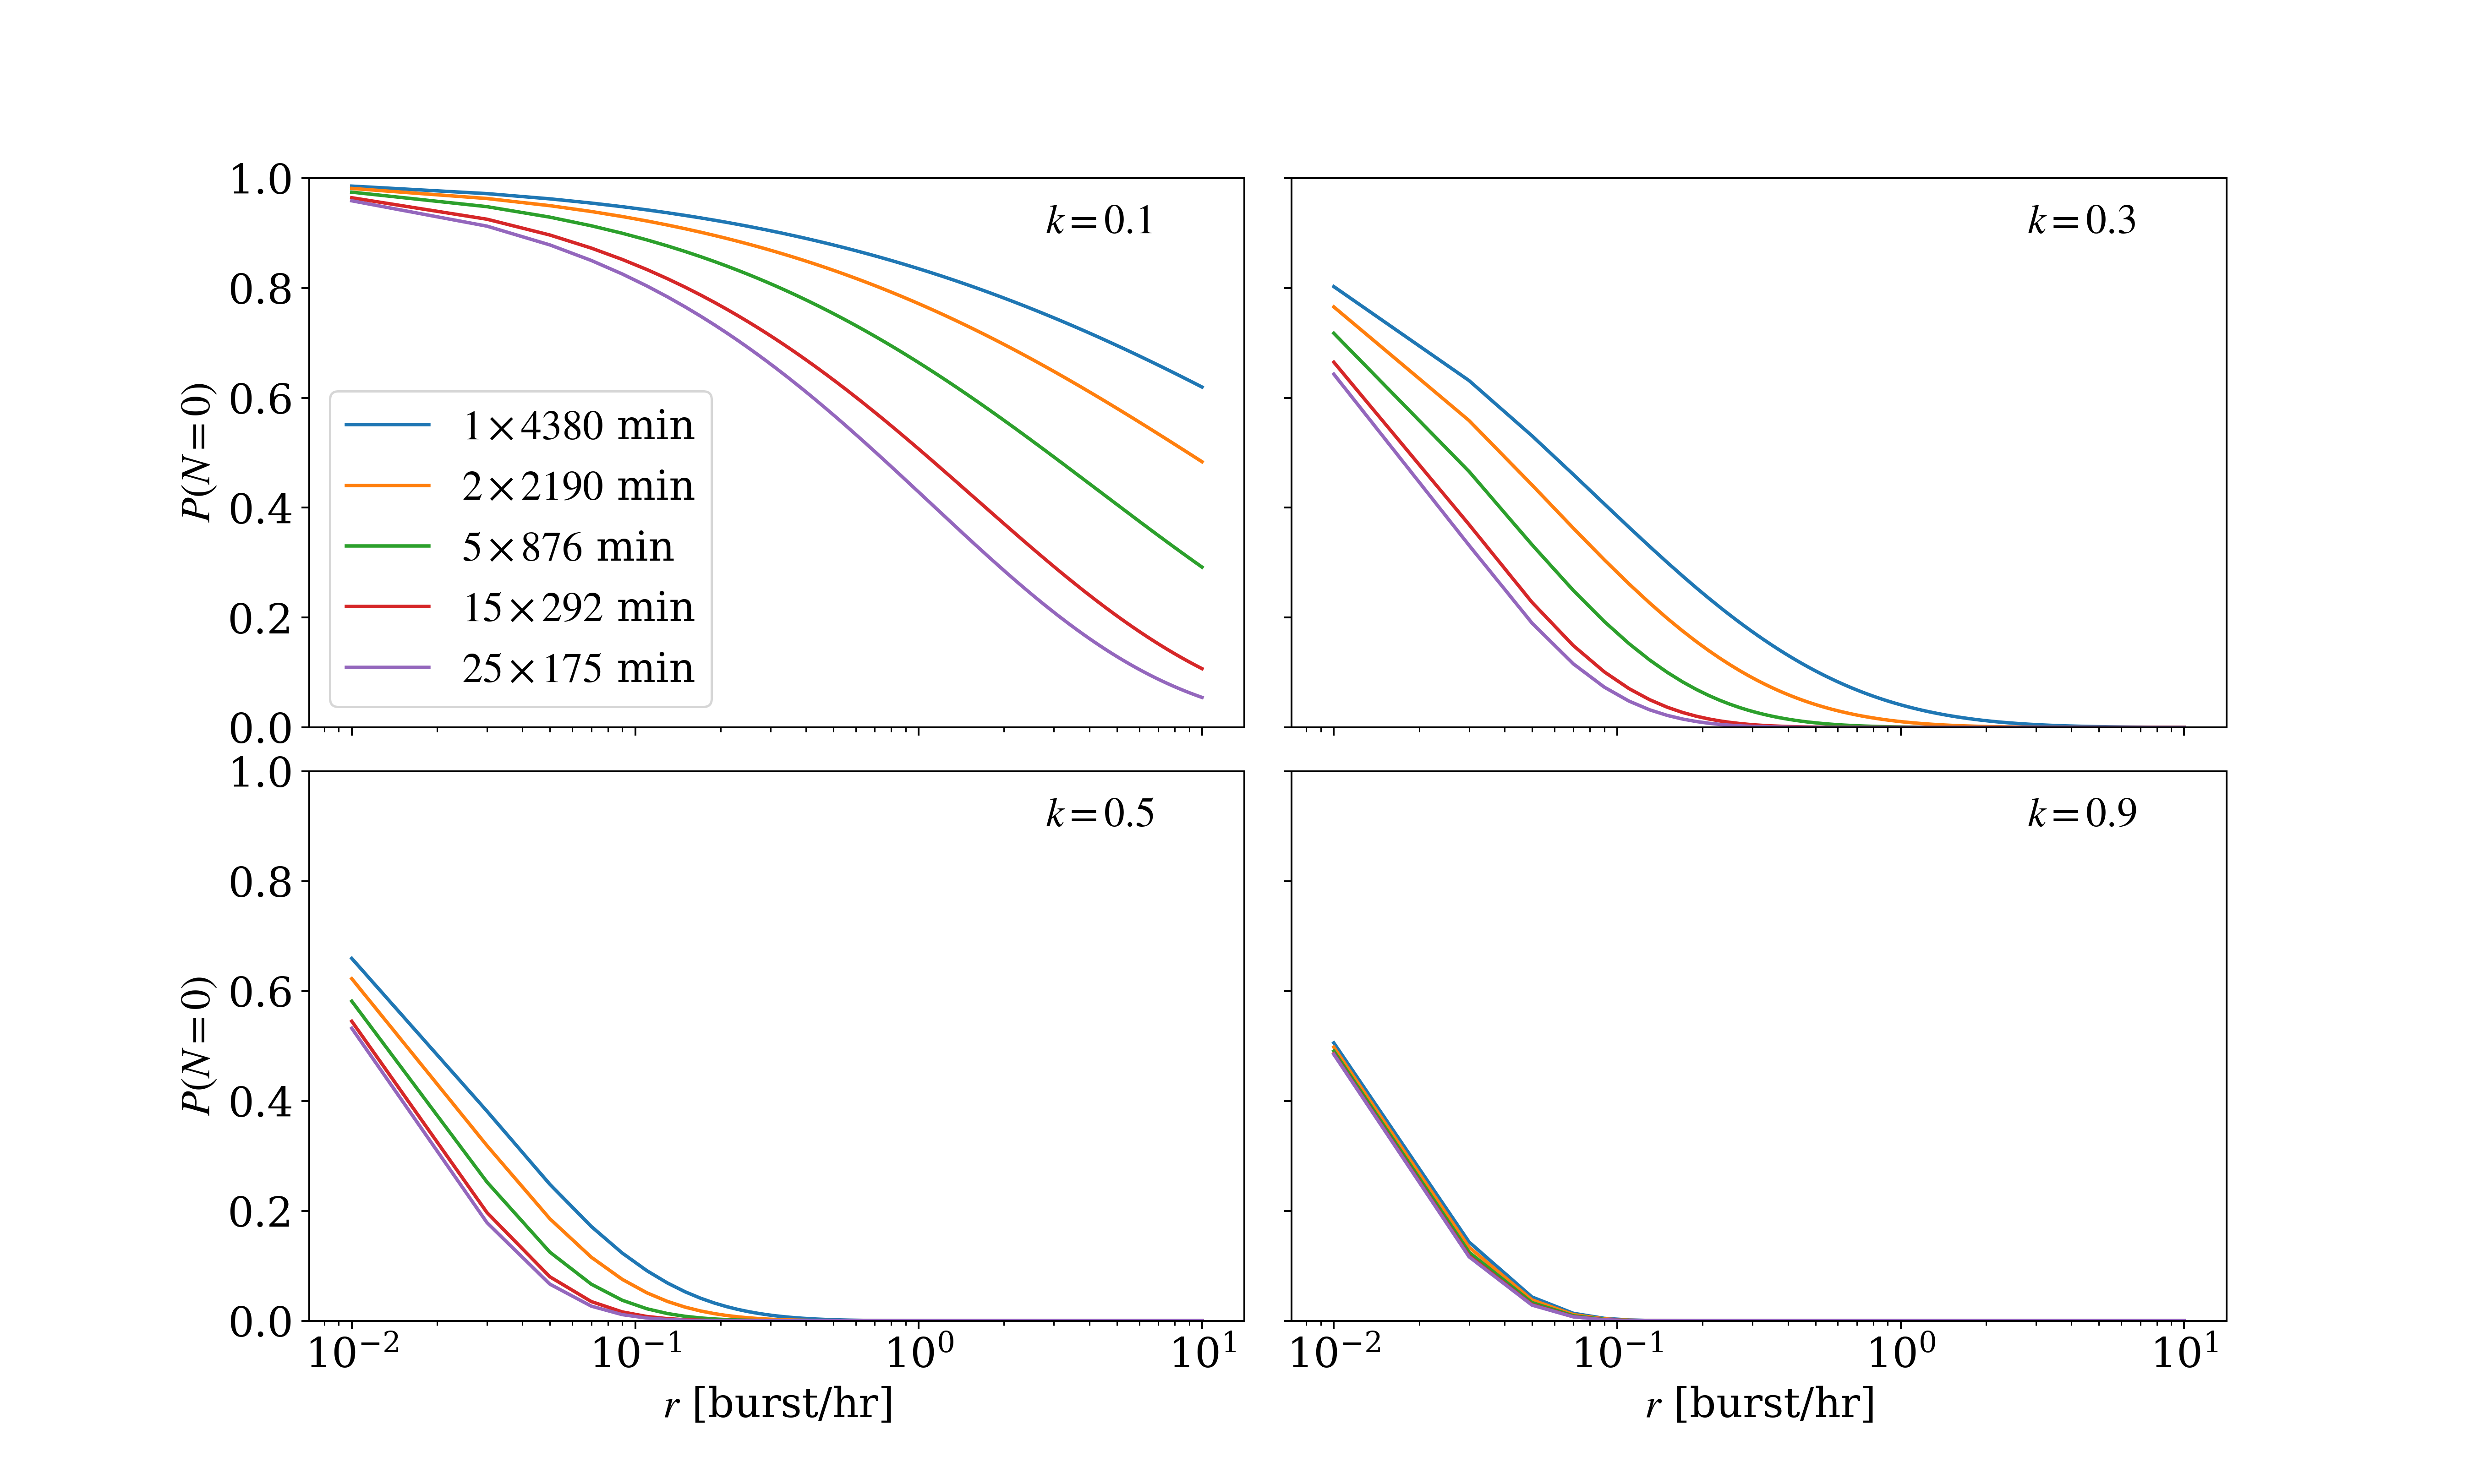
We have several recommendations for future surveys which may follow up this work. By assuming that SLSNe/LGRBs contain FRB121102-like sources, we must expect that they also have clustering of emission, along with periods of dormancy. We should also assume that the bursts are beamed to some degree. Therefore we suggest that observing multiple sources for short periods of time on a regular basis would be ideal. The advantage of observing a source which has clustered burst phases across multiple short observations rather than a few (or one) long observations is shown in Fig. 5. There we plot the probability of detecting zero bursts for a survey totaling 73 hrs across different number of observations as a function of burst rate for a source with different shape factors. As we move further away from the Poissonian case of , it becomes increasingly important to split a survey into multiple observations in order to maximize the probability of detecting a burst. Since the rate scaling is dependent on distance, choosing sources closer than FRB121102 is advised. Finally, SLSNe/LGRBs with coincident persistent radio sources, like PTF10hgi, should be the primary sources to observe for future surveys of this kind; they should preferably be observed at higher frequencies, as we cannot be certain that the SNR is transparent at L-band. The UWL might be the ideal instrument for following up on this work for two reasons: i) The SNR of the targets observed here are most likely transparent in at least the upper part of UWL’s band, making the optically thick-thin transition potentially observable with a single receiver. ii) The scaled FRB121102 UWL rates are higher than the ones for the S45mm receiver. This implies that the time needed to constrain the 95% CL upper rate limits of the targets observed in this work with the UWL is much less than for the S45mm receiver. We show in Table 4 that these times range between 1–16 hrs.
Recent localisations of FRBs (Bannister et al., 2019; Ravi et al., 2019; Prochaska et al., 2019; Marcote et al., 2020) have revealed host galaxies differing from FRB121102, with them being lenticular or spiral in shape, and more massive. The localisation of FRB180916.J1058+65 (Marcote et al., 2020) is of particular interest, as it is the only other localised repeating FRB. The host of FRB180916.J1058+65 is a spiral galaxy and is both more massive and has higher metallicity than the host of FRB121102, rendering it different to hosts of SLSNe/LGRBs as well. This bursting source also has no persistent radio counterpart, and the burst absolute RM value is roughly rad m-2, three orders of magnitude lower than FRB121102. The two bursting sources are however both localised within star forming regions of their respective host galaxies. FRB180916.J1058+65 still fits within the framework of a magnetar embedded in an SNR if the system is a few hundred years old (Marcote et al., 2020). By then the persistent radio source would have faded and the RM decreased to the observed value. This begs the question whether or not the host galaxy of FRB121102 is a typical host of repeating FRBs. Expanding future surveys like in this work to include galaxies similar to hosts of other localised FRBs could be more fruitful.
| Source name | [hr-1] | [hr] |
|---|---|---|
| GRB050826 | 0.3 | 11 |
| GRB051109B | 3.2 | 1 |
| GRB111225A | 0.3 | 11 |
| PTF09cnd | 0.4 | 8 |
| PTF10uhf | 0.3 | 10 |
| PTF10bjp | 0.2 | 16 |
| SN2010gx | 0.4 | 7 |
| PTF12dam | 1.9 | 2 |
| LSQ12dlf | 0.4 | 8 |
| PTF10hgi | 2.2 | 1 |
Acknowledgements
Based on observations with the 100-m telescope of the MPIfR (Max-Planck-Institut für Radioastronomie) at Effelsberg. Some of the results of this paper have been derived using the FRUITBAT package (Batten, 2019). The Parkes radio telescope is funded by the Commonwealth of Australia for operation as a National Facility managed by CSIRO. The time for this project was allocated from the Director’s Discretionary Time under the Project ID PX048. We thank Vincent Morello for assisting with our Parkes observations, and C. R. H. Walker for excellent comments and discussions. LGS is a Lise Meitner independent research group leader and acknowledges support from the Max Planck Society. We thank the referees for their comments which helped improving this manuscript.
References
- Bannister et al. (2019) Bannister K. W., et al., 2019, Science
- Bassa et al. (2017) Bassa C. G., et al., 2017, ApJ, 843, L8
- Batten (2019) Batten A., 2019, The Journal of Open Source Software, 4, 1399
- Beloborodov (2017) Beloborodov A. M., 2017, ApJ, 843, L26
- Beloborodov (2019) Beloborodov A. M., 2019, arXiv e-prints, p. arXiv:1908.07743
- CHIME/FRB Collaboration et al. (2019) CHIME/FRB Collaboration et al., 2019, Nature, 566, 235
- Chatterjee et al. (2017) Chatterjee S., et al., 2017, Nature, 541, 58
- Cordes & Chatterjee (2019) Cordes J. M., Chatterjee S., 2019, ARA&A, 57, 417
- Cordes & Wasserman (2016) Cordes J. M., Wasserman I., 2016, MNRAS, 457, 232
- Cruces et al. (2020) Cruces M., et al., 2020, arXiv e-prints, p. arXiv:2008.03461
- Deng et al. (2018) Deng X., et al., 2018, in Weltevrede P., Perera B. B. P., Preston L. L., Sanidas S., eds, IAU Symposium Vol. 337, Pulsar Astrophysics the Next Fifty Years. pp 330–331, doi:10.1017/S1743921317009899
- Desvignes et al. (2018) Desvignes G., et al., 2018, ApJ, 852, L12
- Dicke (1946) Dicke R. H., 1946, Review of Scientific Instruments, 17, 268
- Dunning et al. (2015) Dunning A., Bowen M., Bourne M., Hayman D., Smith S. L., 2015, in 2015 IEEE-APS Topical Conference on Antennas and Propagation in Wireless Communications (APWC). pp 787–790, doi:10.1109/APWC.2015.7300180
- Eftekhari et al. (2019) Eftekhari T., et al., 2019, ApJ, 876, L10
- Everett & Weisberg (2001) Everett J. E., Weisberg J. M., 2001, ApJ, 553, 341
- Fruchter et al. (2006) Fruchter A. S., et al., 2006, Nature, 441, 463
- Gajjar et al. (2018) Gajjar V., et al., 2018, ApJ, 863, 2
- Gal-Yam (2019) Gal-Yam A., 2019, ARA&A, 57, 305
- Gehrels (1986) Gehrels N., 1986, ApJ, 303, 336
- Gourdji et al. (2019) Gourdji K., Michilli D., Spitler L. G., Hessels J. W. T., Seymour A., Cordes J. M., Chatterjee S., 2019, ApJ, 877, L19
- Greiner et al. (2015) Greiner J., et al., 2015, Nature, 523, 189
- Guillochon et al. (2017) Guillochon J., Parrent J., Kelley L. Z., Margutti R., 2017, The Astrophysical Journal, 835, 64
- Hay & O’Sullivan (2008) Hay S. G., O’Sullivan J. D., 2008, Radio Science, 43, RS6S04
- Hessels et al. (2019) Hessels J. W. T., et al., 2019, ApJ, 876, L23
- Hilmarsson et al. (2020) Hilmarsson G. H., et al., 2020, arXiv e-prints, p. arXiv:2009.12135
- Hotan et al. (2004) Hotan A. W., van Straten W., Manchester R. N., 2004, Publ. Astron. Soc. Australia, 21, 302
- James (2019) James C. W., 2019, MNRAS, 486, 5934
- Johnston et al. (2008) Johnston S., et al., 2008, Experimental Astronomy, 22, 151
- Kumar et al. (2017) Kumar P., Lu W., Bhattacharya M., 2017, MNRAS, 468, 2726
- Law et al. (2017) Law C. J., et al., 2017, ApJ, 850, 76
- Law et al. (2019) Law C. J., et al., 2019, arXiv e-prints, p. arXiv:1910.02036
- Levin (2012) Levin L., 2012, PhD thesis, Swinburne University of Technology
- Lorimer et al. (2007) Lorimer D. R., Bailes M., McLaughlin M. A., Narkevic D. J., Crawford F., 2007, Science, 318, 777
- Lyne et al. (2013) Lyne A., Graham-Smith F., Weltevrede P., Jordan C., Stappers B., Bassa C., Kramer M., 2013, Science, 342, 598
- Lyubarsky (2014) Lyubarsky Y., 2014, MNRAS, 442, L9
- Macquart & Ekers (2018) Macquart J. P., Ekers R., 2018, MNRAS, 480, 4211
- Madison et al. (2019) Madison D. R., et al., 2019, arXiv e-prints, p. arXiv:1909.11682
- Manchester et al. (2005) Manchester R. N., Hobbs G. B., Teoh A., Hobbs M., 2005, AJ, 129, 1993
- Marcote et al. (2017) Marcote B., et al., 2017, ApJ, 834, L8
- Marcote et al. (2020) Marcote B., et al., 2020, Nature, 577, 190
- McQuinn (2014) McQuinn M., 2014, ApJ, 780, L33
- Men et al. (2019) Men Y., et al., 2019, MNRAS, 489, 3643
- Metzger et al. (2017) Metzger B. D., Berger E., Margalit B., 2017, ApJ, 841, 14
- Metzger et al. (2019) Metzger B. D., Margalit B., Sironi L., 2019, MNRAS, 485, 4091
- Michilli et al. (2018) Michilli D., et al., 2018, Nature, 553, 182
- Oppermann et al. (2018) Oppermann N., Yu H.-R., Pen U.-L., 2018, MNRAS, 475, 5109
- Palaniswamy et al. (2018) Palaniswamy D., Li Y., Zhang B., 2018, ApJ, 854, L12
- Perley et al. (2016) Perley D. A., et al., 2016, ApJ, 830, 13
- Petroff et al. (2016) Petroff E., et al., 2016, Publ. Astron. Soc. Australia, 33, e045
- Piro (2016) Piro A. L., 2016, ApJ, 824, L32
- Prochaska & Zheng (2019) Prochaska J. X., Zheng Y., 2019, MNRAS, 485, 648
- Prochaska et al. (2019) Prochaska J. X., et al., 2019, Science, 366, 231
- Ransom (2011) Ransom S., 2011, PRESTO: PulsaR Exploration and Search TOolkit (ascl:1107.017)
- Ravi et al. (2019) Ravi V., et al., 2019, Nature, 572, 352
- Rees & Meszaros (1994) Rees M. J., Meszaros P., 1994, ApJ, 430, L93
- Reines et al. (2020) Reines A. E., Condon J. J., Darling J., Greene J. E., 2020, ApJ, 888, 36
- Romero et al. (2016) Romero G. E., del Valle M. V., Vieyro F. L., 2016, Phys. Rev. D, 93, 023001
- Spitler et al. (2012) Spitler L. G., Cordes J. M., Chatterjee S., Stone J., 2012, ApJ, 748, 73
- Spitler et al. (2016) Spitler L. G., et al., 2016, Nature, 531, 202
- Spitler et al. (2018) Spitler L. G., et al., 2018, ApJ, 863, 150
- Tauris & Manchester (1998) Tauris T. M., Manchester R. N., 1998, MNRAS, 298, 625
- Tendulkar et al. (2017) Tendulkar S. P., et al., 2017, ApJ, 834, L7
- The CHIME/FRB Collaboration et al. (2019) The CHIME/FRB Collaboration et al., 2019, arXiv e-prints, p. arXiv:1908.03507
- Walker et al. (2018) Walker C. R. H., Ma Y. Z., Breton R. P., 2018, arXiv e-prints, p. arXiv:1804.01548
- Woosley (1993) Woosley S. E., 1993, ApJ, 405, 273
- Yang & Zhang (2018) Yang Y.-P., Zhang B., 2018, ApJ, 868, 31
- Yao et al. (2017) Yao J. M., Manchester R. N., Wang N., 2017, ApJ, 835, 29
- Zhang (2018a) Zhang B., 2018a, ApJ, 854, L21
- Zhang (2018b) Zhang B., 2018b, ApJ, 867, L21