Structural asymmetry along protein sequences
and co-translational folding
Abstract
Proteins are translated from the N- to the C-terminus, raising the basic question of how this innate directionality affects their evolution. To explore this question, we analyze structures from the protein data bank (PDB). We find remarkable enrichment of -helices at the C terminus and -strands at the N terminus. Furthermore, this asymmetry correlates with sequence length and contact order, both determinants of folding rate, hinting at possible links to co-translational folding (CTF). Hence, we propose the ‘slowest-first’ scheme, whereby protein sequences evolved structural asymmetry to accelerate CTF: the slowest of the cooperatively-folding segments are positioned near the N terminus so they have more time to fold during translation. A phenomenological model predicts that CTF can be accelerated by asymmetry, up to double the rate, when folding time is commensurate with translation time; analysis of the PDB reveals that structural asymmetry is indeed maximal in this regime. This correspondence is greater in prokaryotes, which generally require faster protein production. Altogether, this indicates that accelerating CTF is a substantial evolutionary force whose interplay with stability and functionality is encoded in sequence asymmetry.
Introduction
All proteins are translated sequentially from the N- to the C-terminus, and are thus inherently asymmetric [1]. One example of such N-to-C asymmetry is signal peptides, which enable translocation across membranes, and are located at the N terminus [2]. This raises the general question of whether and how asymmetry in protein production is leveraged to gain evolutionary advantage. Here we examine structural data from the protein data bank (PDB) in search of traces of such adaptation. We analyzed the distribution of secondary structure along the sequence for PDB proteins, finding two striking patterns of asymmetry. First, disordered residues are principally located at the ends of sequences, and depleted towards the middle. Second, -strands are enriched by near the N terminus, while -helices are enriched by at the C terminus. These findings agree qualitatively with previous reports [3, 4, 5, 6, 7, 8, 9, 10, 11]. This asymmetry peaks at intermediate values of sequence length and contact order – which both correlate negatively with folding rate – indicating a possible link between secondary structure asymmetry and folding.
Hence, we further explore the possibility that asymmetry may accelerate protein production, and is therefore a signature of evolutionary adaptation. Production of functional proteins from mRNA comprises two concerted processes: directional translation and cooperative folding. The rate of translation is limited by trade-offs between speed, accuracy and dissipation [12, 13, 14, 15]. Folding quickly has certain advantages: unfolded proteins lead to aggregation, putting a significant burden on the cell [16, 17, 18]; faster folding allows quicker responses to environmental changes [19, 20]. Moreover, organisms whose fitness depends on fast self-reproduction would benefit from accelerated protein production that can shorten division time [21, 22]. Proteins may begin folding during translation, although the extent to which this varies across the proteome is unclear [23, 24, 25, 26, 27, 28, 29, 30, 31, 32, 33, 34], and depends on the collective dynamics of the folding process. Thus, in principle, faster production times may be achieved if proteins finish folding and translation at around the same time. This co-translational folding (CTF) enables adaptations that increase yield and kinetics of protein production [30, 31, 32, 35, 34]. For example, nascent peptides interact with ribosomes and chaperones to reduce aggregation and misfolding [36, 37, 38, 39, 40], while translation rates can be tuned to facilitate correct folding [26, 41, 42, 43]. Specifically, we ask if structural asymmetry may have evolved for fast and efficient production via CTF.
We show that the structural asymmetry observed in proteins is consistent with a scheme for accelerating CTF based on the directional nature of translation and the heterogeneity of folding rates along the sequence [44, 45, 46, 47, 48, 49] – e.g. cooperatively-folding protein segments containing -sheets may fold slower compared to those containing -helices [50]. In the proposed slowest-first scheme, protein sequences take advantage of this heterogeneity by evolving structural asymmetry: the slowest-folding segments are enriched at the N-terminus [5, 6, 7, 8, 9, 10, 11], so that they are translated first and have more time to fold. This scheme applies to proteins composed of several independently-folding segments. Therefore, due to the cooperative nature of the many-body folding process, the scheme is more likely to apply to larger proteins.
A simple model predicts that, under the slowest-first scheme, production rate can be almost doubled when folding time is equivalent to translation time. To examine this hypothesis, we estimate the ratio of folding to translation time of the PDB proteins and compare it with their asymmetry, finding that asymmetry peaks when folding time is commensurate with translation time. In this region, proteins are twice as likely to exhibit asymmetry that favours the slowest-first scheme. We see more evidence for this scheme in prokaryotic proteins, which is consistent with prokaryotes’ greater need for fast protein production due to more frequent cell division. Taken together, these findings suggest that proteins sequences have been adapted for accelerated CTF via structural asymmetry.
Results
Protein secondary structure is asymmetric
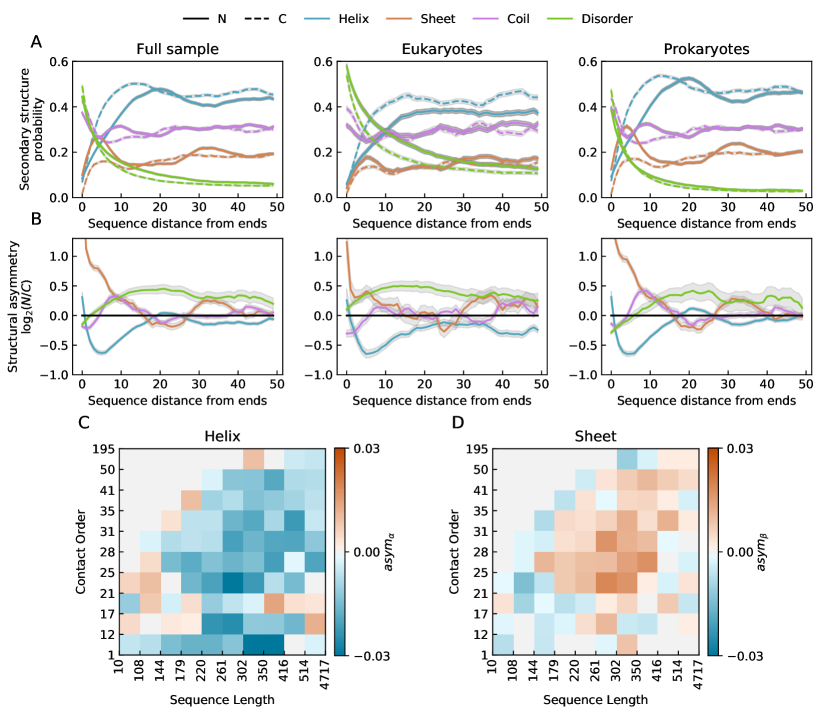
Given the vectorial nature of protein translation, one may expect corresponding asymmetries in protein structure. To probe this, we study a non-redundant set of proteins from the Protein Data Bank (PDB) [51]. We find that these PDB proteins exhibit significant asymmetry in secondary structure (Fig. 1A-B), even when counting each SCOP family once (SI Fig 2). For example, the first residues at the N terminus are on average more likely to form strands, and the first residues at the C terminus are more likely to form helices (in Fig. 1B this is reported in scale, but we report here). This asymmetry is stronger for prokaryotic proteins (; ) than for eukaryotic proteins (; ). The substantial asymmetry points to an evolutionary driving force which we further investigate.
In both N- and C-termini, the -helix and -strand distributions have a well-defined shape: they exhibit periodicity in the positioning of these elements along the sequence. This periodicity is matched by several -type protein folds where -helices and -strands are arranged in alternating order (SI Fig. 3). These folds tend to be more abundant in prokaryotic proteins (SI Table 1); for example, ferredoxin-like folds exhibit high asymmetry, significant periodicity at the N-terminus, and are times more common in prokaryotes.
The distribution of disordered regions exhibits a different pattern of asymmetry: disordered residues are enriched at both ends of proteins compared to the middle [3, 4]. Eukaryotic proteins are significantly more disordered, where the probability of disorder is well approximated by , where is the distance from the end, while in prokaryotic proteins the probability of disorder decays as . Proteins also tend to be more disordered at the N termini [3]: eukaryotic proteins are more likely to be disordered within the first residues of the N terminus compared to the C terminus (prokaryotes: ). Although prokaryotic proteins are less disordered than eukaryotic ones, the ratio of the numbers of residues in strands and helices is the same.
Structural asymmetry correlates with sequence length and contact order
To better understand the asymmetry, we examined correlations with sequence length, , and contact order, CO. CO is the average sequence distance between intra-protein contacts,
| (1) |
where and are pairs of residue indices for each contact [52]. High CO is likely to result in greater entropy loss between the unfolded and transition state, thus increasing folding time.
To quantify secondary structure asymmetry, we calculate the magnitude of asymmetry normalized by length,
| (2) | ||||
where () and () are the number of residues in a -helices (-strands) in the N and C halves of a protein sequence.
We find that asymmetry is a non-monotonic function of both and CO (Fig. 1C-D; this is to some extent expected since and CO are correlated, ). In particular, there is a region of intermediate length () and intermediate CO () where structural asymmetry is most apparent (SI Fig. 4). The fact that both quantities correlate negatively with folding rate (, ; CO, ; SI Fig. 5) [53, 52, 54, 55], taken together with proteins’ inherent asymmetry due to vectorial translation, leads us to suspect that the origins of this asymmetry may be related to co-translational folding.
Co-translational folding appears to be widespread
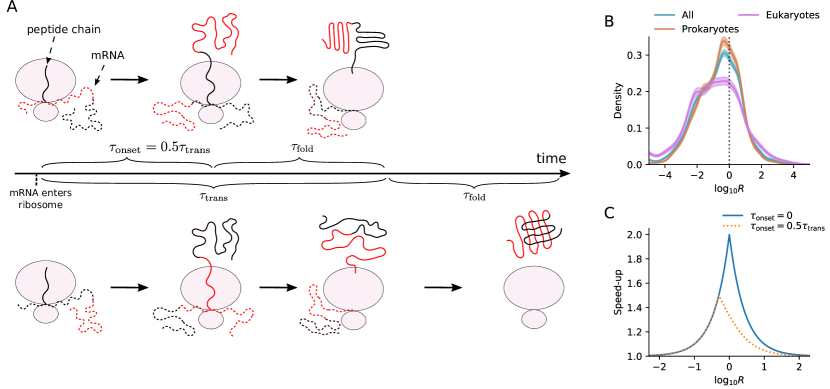
During protein production, the ribosome advances along the mRNA from the N to the C terminus (Fig. 2A). Proteins may fold in stages during translation [24, 56, 28, 27, 57, 25, 58, 59, 60, 61, 26], but the extent to which this happens in still unclear [33, 62, 57, 63, 64, 65, 37, 66]. In principle, one way to maximise the rate of production and to minimise aggregation is by making proteins fold faster than they are translated, or at a similar rate. We can obtain a rough approximation of how often this occurs by estimating folding rates and translation rates of proteins. We estimate the folding rate using a power law scaling with length (not CO) fitted to data from the protein folding kinetics database (PFDB) [54] (Methods). We assume an average translation rate that depends on the organism. Thus we can estimate the ratio of folding time to translation time ,
| (3) |
The estimated distribution exhibits a peak in the region of commensurate times (Fig. 2B). For the of proteins (CI , SI Fig. 6) that lie in the region , folding may be quicker than translation, suggesting that co-translational folding (CTF) is common. In comparison, a more rigorous method estimated that in of proteins in E. coli, at least one domain will fully fold before translation finishes [67]. Examining prokaryotic proteins and eukaryotic proteins separately reveals a sharper peak in the distribution for prokaryotic proteins in the region of commensurate folding and translation times, . Notably, a greater fraction of prokaryotic proteins () are in this regime compared to eukaryotic proteins ().
Folding rate asymmetry can speed up co-translational folding
Fig. 2A shows two scenarios where the folding rate is determined by a rate-limiting fold (red segment) [68, 49, 69, 66]. This bottleneck represents an independent, cooperatively-folding segment (i.e. a ‘foldon’ [47]) that folds slowly. If the bottleneck is located at the N terminus (top in Fig. 2A), then the production time is minimal, where is the time it takes for the segment to be translated, pass through the nm long ribosome tunnel and be free of steric constraints [30, 55, 56, 70]. In the other extreme, if the rate-limiting fold includes the C terminus (bottom in Fig. 2A), production time is maximized [71], In this case, the last element can escape the ribosome quickly after being translated since it is not delayed by downstream translation [72]. Thus, production rate can be accelerated by a factor,
| (4) |
In the limit , one finds from Eqs. 3-4 that the speedup as a function of (Fig. 2D) is
| (5) |
A maximal, twofold speedup is achieved when translation time equals folding time, , and taking shifts this maximum towards .
In practice, depends on the size of the cooperatively-folding protein segment. It has been suggested that such a ‘foldon’ can have as few as 20 residues [47, 73], but in general, cooperatively-folding units appear to be larger than this – proteins that are observed to fold via two-state kinetics can vary greatly in size [74, 75, 76]. Thus, this speedup may only be applicable to larger proteins that fold via multi-state kinetics; this is compatible with the prediction that a speedup is substantial only when .
Structural asymmetry is maximum for commensurate folding and translation times
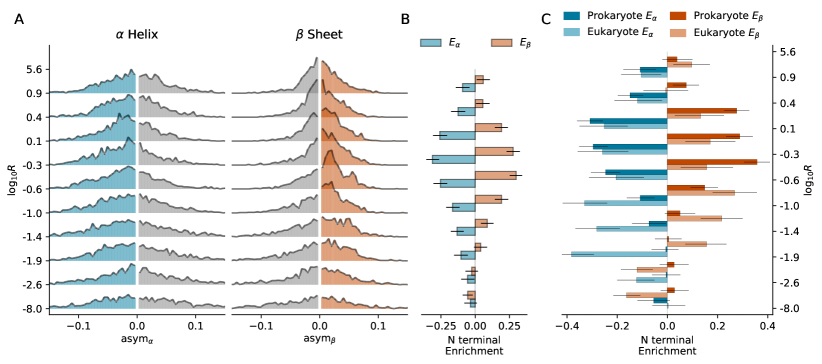
The speedup curve (Fig. 2D) implies that proteins can benefit the most from structural asymmetry when . Hence, we estimate the magnitude of asymmetry as a function of , and plot the distributions in Fig. 3A. We note that is not estimated very precisely, and thus it is useful to average out the errors by examining the proteins in large bins (deciles). At intermediate , the means of the distributions shift away from zero, indicative of strong bias.
To capture the magnitude of these shifts we calculate the N terminal enrichment, , defined as the fraction of proteins with positive asymmetry (i.e. enriched at the N terminus) minus the fraction of proteins with negative asymmetry (enriched at the C terminus), for both helices and strands:
| (6) | ||||
Fig. 3B shows that in the deciles with maximum asymmetry, proteins in the PDB are times as likely to be enriched in -strands in the N terminus, while -helices are times more likely to be enriched in the C-terminal half. This maximum is found when (the confidence intervals for the estimate give ; SI Fig. 7). This region of maximal asymmetry overlaps with the region of maximal speedup (Fig. 2D, Eq. 5), suggesting that asymmetry evolves because it enhances CTF. To help put these figures in context, in the pentile where proteins have maximum asymmetry (), of proteins have (which, for the mean length, , and an average -strand length of residues, corresponds to about three extra -strands near the N terminus) while half as many have (the opposite case) (SI Fig 8).
Prokaryotes exhibit greater asymmetry than Eukaryotes
We looked at asymmetry for prokaryotic and eukaryotic proteins separately, finding that when asymmetry is maximum, prokaryotes exhibit more asymmetry than eukaryotes – strands are more likely to be enriched at the N terminus in prokaryotes compared to eukaryotes (Fig. 3C). Typically, prokaryotic cells divide more frequently than eukaryotic cells [22], and thus have a greater need for fast production of functional proteins. The analysis is therefore consistent with the slowest-first scheme that implies that the stronger pressure on prokaryotes should lead to greater asymmetry.
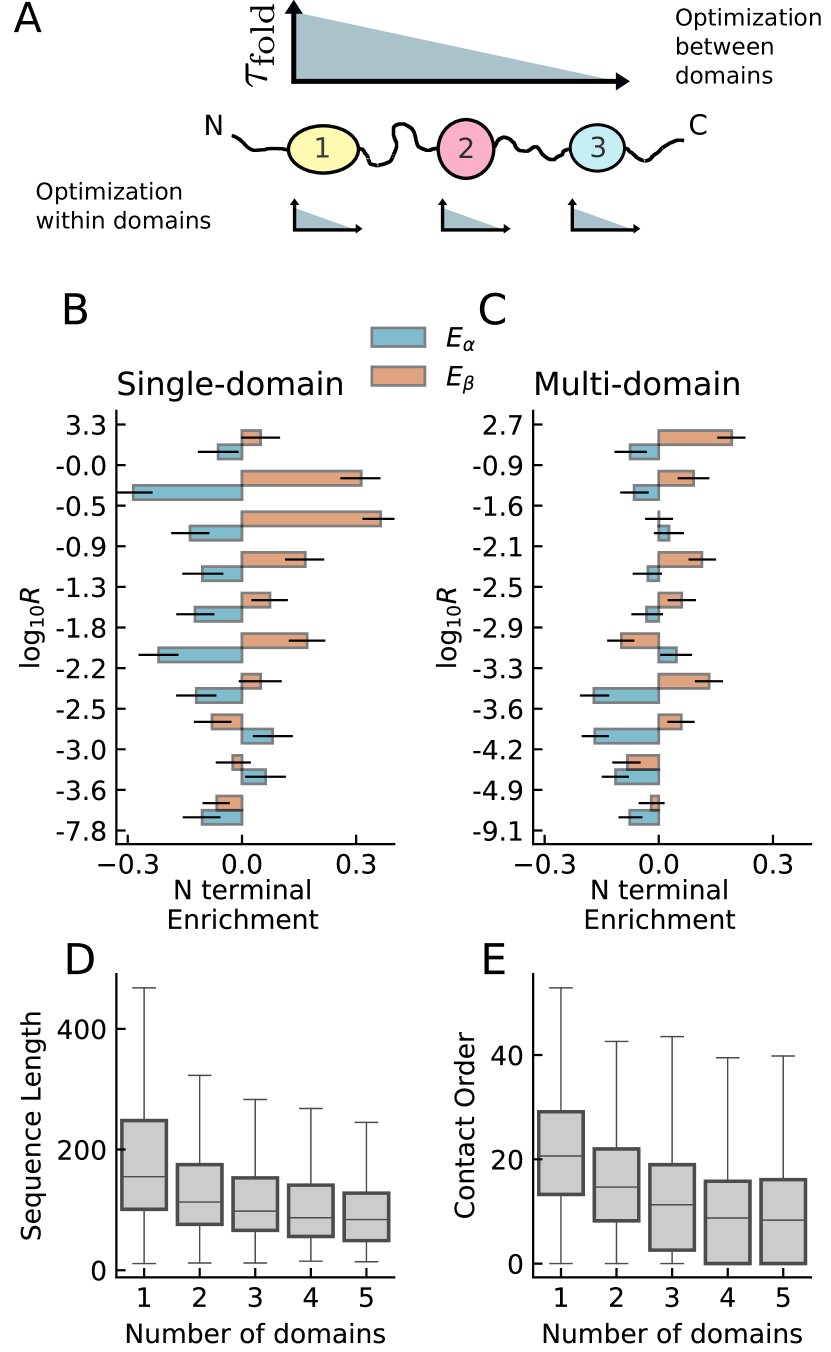
Multi-domain proteins are optimized for CTF via distinct mechanisms
Multi-domain proteins can be potentially adapted at two levels: within domains, and between domains (Fig. 4A). To test this, we isolated individual domains in the PDB (using Pfam) [77], and calculated CO and asymmetry for each domain as in Fig. 3. While intra-domain optimization of secondary structure clearly occurs within single-domain proteins, it is much weaker within multi-domain proteins (Fig. 4B-C). Inter-domain optimization entails ordering the slowest-folding domains at the N terminus, for which we find no significant bias (SI Fig. 9). Instead, we find that as the number of domains increases, the size and CO of individual domains decreases (Fig. 4D-E). Thus CTF is maintained in multi-domain proteins mostly by using faster-folding domains throughout.
Discussion
We examined the hypothesis that proteins are selected for CTF to hasten protein production and reduce aggregation/misfolding, but this may not be equally true for all proteins. As an example, we showed that in prokaryotes, which have a greater burden of cell growth, proteins tend to have more asymmetry than in eukaryotes. Topological constraints may preclude early folding of the N terminus if the C-terminus is also part of the folding nucleus [66]. More generally, CTF may be hindered in some proteins by interactions with the ribosome [57]. Long-lived proteins [78] may derive little benefit from an increase in production speed. On the other hand, proteins produced in large quantities need to fold quickly as aggregation can increase non-linearly with concentration [79]. Some of these predictions can be tested when sufficient data for protein lifespan [80], expression levels [81], and structure become available. While we showed that asymmetry is apparent in a broad set of proteins, further analysis of an extended data set may be able to detect the sub-classes of proteins that will benefit most from asymmetry.
Our model proposes an absolute maximum of a twofold acceleration in protein production, which at first glance, may seem insignificant compared to the range of protein folding times ( orders of magnitude). However, we show that this acceleration is only possible when folding time is similar to translation time (i.e. on the order of seconds to minutes). We expect that, even for a single protein, decreasing production time by seconds to minutes can increase fitness, and when this is applied over a large group of proteins this should be quite substantial.
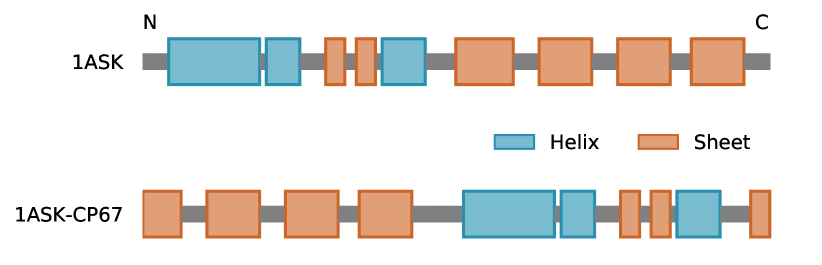
To experimentally test the slowest-first mechanism, we suggest studying CTF of multiple proteins with , which differ in and . In particular, we propose to use proteins whose sequences are related by circular permutation, while having identical structures [82, 83, 84, 65]. Circular permutants with opposite structural asymmetry, as the example in Fig. 5, should fold at significantly different rates. Additional experimental control of is possible via synonymous codon mutations [85] or in vitro expression systems [29]. Thus, one can test whether asymmetry in secondary structure can lead to acceleration of CTF, and how this depends on .
CTF for multi-domain proteins is more complex
Multi-domain proteins exhibit less asymmetry than single-domain proteins. Due to interactions between domains [87, 56, 40, 70, 42], optimization via asymmetry may not be feasible — instead, a safe strategy is to fold each domain before translating subsequent domains. To explain the lack of intra-domain asymmetry (Fig. 4C), we propose a simple mechanical argument. When a -sheet forms, the protein chain contracts. This results in a pulling force on both the ribosome [88, 89], and on any upstream domains. This extra resistance to -sheet formation may preclude the early formation of -strands at the N terminal side of a domain. If this is true, then the domain in position 1 should still exhibit asymmetry; we currently lack sufficient statistical power to conclusively test this (SI Fig. 10). Further tests could look at CTF of a -rich domain in the the presence or absence of an upstream domain [90, 91].
Disorder is enriched at both sequence ends
The N and C termini principally share a notable tendency for disorder near the end, which suggests that they are affected by the same physical end effect. The amino acid at the end is linked to the chain by only one peptide bond, leaving it more configurational freedom than an amino acid in the centre of the protein, which is constrained by two bonds. This entropic contribution to the free energy of the loose ends, of order , can induce disorder in marginally stable structures.
Since disordered regions do not need time to fold, placing them towards the C-terminus gives the other residues more time to fold. Yet, we find a similar, slightly stronger, tendency for disorder near the N-terminus (green curves in Fig. 1B), particularly in eukaryotes. This may result from other determinants of protein evolution; e.g., disordered regions tend to interact with some ribosome-associating chaperones [92, 93]. If disorder at the N terminus is related to chaperones, we expect that asymmetry will be higher for slow-folding proteins as they are more prone to aggregation. We find that bias for disorder at the N-terminus is strongest for slow-folding proteins (high , and CO; SI Fig.11), but only for prokaryotes, not eukaryotes. Given the absence of a correlation between , and CO and disorder asymmetry in eukaryotic proteins, the question of why eukaryotic proteins are more disordered at the N terminus remains open.
Considering tertiary structure
We used secondary structure as a proxy for folding rate, but there are also contributions from tertiary structure. To evaluate this assumption, we ran coarse-grained simulations of CTF of three structurally-asymmetric proteins while varying , for both the original sequence and of the reverse sequence. We find that these proteins fold faster when -strands are translated first, in the relevant region of (SI Fig. 12).
We also studied the effect of tertiary structure by looking at asymmetry in surface accessibility. strands at the N terminus are less likely to be exposed to solvent than strands at the C terminus; this bias is stronger for prokaryotic proteins (first 20 residues: ) compared to eukaryotic proteins () (SI Fig 12). Since solvent-exposed -strands are less likely to form part of a folding nucleus [94], this suggests that -strands at the N terminus are more likely to nucleate folding compared to those at the C terminus.
Alternatives explanations for asymmetry
We can think of only few examples of inherent asymmetry in proteins. The ends have a slight chemical difference (carbon vs nitrogen), but one atom seems insignificant. Amino acids are chiral, but we cannot say how this could lead to asymmetry in secondary structure. The only remaining driving force for asymmetry, in our view, is the unidrectional translation process.
One theory exists that predicts asymmetry in -helices: Marenduzzo et al. show that in a model of a growing, self-interacting string, the string forms helices at the growing (C) end [7], and suggest that this bias affected protein evolution. However, this fails to address why there are more beta sheets at the N terminal, nor does it explain why asymmetry depends on protein length.
We could also consider that -strands are typically less open to solvent, and hence we also see asymmetry in solvent accessibility (SI Fig 12). Thus, it is possible that -strand asymmetry is a by-product of a driving force for having the N terminal side less exposed to solvent. The only explanation we can think of for such a driving force is to have the folding nucleus located at the N terminus, which is effectively covered by the ‘slowest-first’ hypothesis since a folding nucleus can be considered a rate-limiting fold.
We need more data on folding rates
The data used to fit Eq. 7 are sparse ( proteins), biased towards small, single-domain proteins, and typically obtained from in vitro refolding experiments [54]. To test whether our conclusions are robust to sampling, we estimate confidence intervals using bootstrapping with sample sizes equal to the original sample size, and half that amount; we perform this test on both the reduced version of the PFDB data set used in the main figures, and on a second version of the PFDB data set (Methods; SI Fig. 7). In addition, we calculate the main results using using a different protein folding data set, ACPro [95], which partially overlaps with PFDB, but includes larger proteins (SI Fig. 14). In all of the above analyses, the point of maximum asymmetry is found to be , which corresponds to the region where CTF speed-up is possible. However, to fully overcome the aforementioned limitations, further experiments are needed.
Analysis is consistent with hypothesis that proteins are selected for CTF via secondary structure
To sum, in the proposed the slowest-first mechanism, CTF can be accelerated by positioning the slowest-folding parts of a protein near the N terminus so that they have more time to fold. A survey of the PDB shows that the estimated acceleration correlates with asymmetry in secondary structure. In particular, the rate of production can be almost doubled when translation time is similar to folding time, and indeed these proteins exhibit the maximal asymmetry in secondary structure distribution. Altogether, there appears to be substantial evolutionary selection, manifested in sequence asymmetry, for proteins that can fold during translation.
Methods
Data
We extracted a set of proteins from the Protein Data Bank (PDB) [51]. We include proteins where the SEQRES records exactly match the corresponding Uniprot sequence (not mutated, spliced, or truncated) [96]. We include proteins that have been fused or have purification tags, but for these we again only include the part that exactly matches the Uniprot sequence. For each unique protein sequence, we only include the most recent structure. We used SIFTS to map PDB and Uniprot entries [97]. We exclude proteins with predicted signal peptides as little is known about whether such proteins undergo CTF; we used Signal-P5.0 to identify signal peptides [98]. Using the above criteria we extracted a set of domains by matching PDB entries to Pfam domains [77]. We assume that domains identified in Pfam via homology are independent folding units. helix and -strands are identified through annotations in the PDB; disorder is inferred from residues with missing coordinates. To calculate contact order, we only consider contacts between residues where carbons are within ; we confirm that the correlation in Fig. 1D is robust to choice of this cutoff (SI Fig. 15).
We use the protein folding kinetics database (PFDB) for estimating folding rates [54]. For our main results we only used entries with realistic physical conditions ( , and ) and ignored folding rates which had been extrapolated to ; in total, proteins. We test a second version of the PFDB data set without excluding proteins, and using folding rates which were extrapolated to ; proteins. We also use the ACPro data set [95] to test the robustness of our conclusions; proteins.
Predicting folding and translation rate
The folding rate, (in units of 1/sec), is estimated by a power-law fit as a function of the protein’s length:
| (7) |
where is sequence length in residues; and are free parameters. We fit these parameters using data from the PFDB [54] to get confidence intervals of and (with correlation coefficient , and p-value ). We consider that proteins that are observed to fold via multi-state kinetics may be badly approximated by a single folding rate; we thus repeat the analyses with the 89 two-state proteins in the PFDB, finding the area of maximum asymmetry within . The estimate from Eq. 7 is limited for the following reasons: (i) It is extracted from a small set of 122 proteins. (ii) It disregards the effects of secondary structure, contact order order, and other important determinants. (iii) The data is from in vitro measurements. (vi) The data is biased towards small, single-domain proteins. Thus, it is only a rough predictor for the folding rates of individual proteins in the set, as the standard deviation between estimated and empirical folding rates is . For all these reasons, we use Eq. 7 as an estimator of the average folding rate of sets of proteins of similar length where the large sampling size of each bin is expected to reduce the errors as .
We tested whether the predicted folding rates of proteins in the PDB are within certain approximate bounds on realistic folding rates. A lower bound to folding time has been estimated at [99], while we take the doubling time of E. coli, roughly minutes, as an approximate upper bound. Of course, many proteins rely on chaperones, so their bare estimated folding time may be longer than the upper bound, while others come from organisms with much longer doubling times. Even so, according to Eq. 7 only of proteins are estimated to have a folding time greater than minutes, while only of proteins are estimated to fold faster than the lower bound. Given the magnitude of the error in estimating the folding time of individual proteins, Eq. 7 appears to yield estimates that are mostly within the biologically reasonable regime. Furthermore, in estimating the folding rate of large proteins, a common assumption is that they consist of multiple independently-folding domains [100] – which considerably reduces the estimated folding time of the slowest proteins – but we neglect to make this assumption.
In principle, we could have used structural/topological measures (such as contact order, long-range order, etc. [101]) to slightly improve the fit to Eq. 7. However these typically involve numerous methodological choices and additional parameters [102], and the scaling relations are entirely empirical. In contrast, scaling of folding time with length has a robust theoretical background [103, 104, 105, 106, 107, 53, 108, 109]; the exact form of of the scaling is debated, but a power law is favoured slightly [104, 110].
We assume the translation rate, , depends on the organism (host organism for viral proteins), such that is amino acids per second for eukaryotes and for prokaryotes.
Data Availability
The non-redundant sets of proteins and domains, along with the data used in the figures and Supplementary Information, will be made available on Zenodo.
Code Availability
Simulation and analysis code, along with code used to make all figures, are accessible at https://github.com/jomimc/FoldAsymCode.
Acknowledgements
We acknowledge Albert J. Libchaber for stimulating discussions and comments on the manuscript. This work was supported by the Institute for Basic Science, Project Code IBS-R020-D1.
Competing Interests
The authors declare that they have no competing financial interests.
Correspondence
Correspondence and requests for materials should be addressed to J.M. (email: jmmcbride@protonmail.com) and T.T. (tsvitlusty@gmail.com).
Author Contributions
J.M. and T.T. designed research; J.M. performed research; J.M. analyzed data; J.M. and T.T. wrote the paper.
References
- Salas et al. [1965] M. Salas, M. A. Smith, W. M. Stanley, A. J. Wahba, and S. Ochoa. Direction of reading of the genetic message. J. Biol. Chem., 3995:3988–3995, 1965.
- von Heijne [1990] G. von Heijne. The signal peptide. J. Membrane Biol., 115(3):195–201, 1990. 10.1007/BF01868635.
- Lobanov et al. [2010] M. Y. Lobanov, E. I. Furletova, N. S. Bogatyreva, M. A. Roytberg, and O. V. Galzitskaya. Library of disordered patterns in 3d protein structures. Plos Comput. Biol., 6(10):1–10, 2010. 10.1371/journal.pcbi.1000958.
- Lobanov et al. [2020] M. Y. Lobanov, I. V. Likhachev, and O. V. Galzitskaya. Disordered residues and patterns in the protein data bank. Molecules, 25(7):1522, 2020. 10.3390/molecules25071522.
- Thornton and Chakauya [1982] J. M. Thornton and B. L. Chakauya. Conformation of terminal regions in proteins. Nature, 298(5871):296–297, 1982. 10.1038/298296a0.
- Bhattacharyya et al. [2002] R. Bhattacharyya, D. Pal, and P. Chakrabarti. Secondary structures at polypeptide-chain termini and their features. Acta Crystallogr. D., 58(10 Part 2):1793–1802, 2002. 10.1107/S0907444902013069.
- Marenduzzo et al. [2005] D. Marenduzzo, T. X. Hoang, F. Seno, M. Vendruscolo, and A. Maritan. Form of growing strings. Phys. Rev. Lett., 95:098103, 2005. 10.1103/PhysRevLett.95.098103.
- Krishna and Englander [2005] M. M. G. Krishna and S. W. Englander. The n-terminal to c-terminal motif in protein folding and function. P. Natl. Acad. Sci. Usa., 102(4):1053–1058, 2005. 10.1073/pnas.0409114102.
- Laio and Micheletti [2006] A. Laio and C. Micheletti. Are structural biases at protein termini a signature of vectorial folding? Proteins., 62(1):17–23, 2006. 10.1002/prot.20712.
- Saunders et al. [2011] R. Saunders, M. Mann, and C. M. Deane. Signatures of co-translational folding. Biotechnol. J., 6(6):742–751, 2011. 10.1002/biot.201000330.
- Baiesi et al. [2019] M. Baiesi, E. Orlandini, F. Seno, and A. Trovato. Sequence and structural patterns detected in entangled proteins reveal the importance of co-translational folding. Sci. Rep., 9(1):8426, 2019. 10.1038/s41598-019-44928-3.
- Hopfield [1974] J. J. Hopfield. Kinetic proofreading: A new mechanism for reducing errors in biosynthetic processes requiring high specificity. P. Natl. Acad. Sci. Usa., 71(10):4135–4139, 1974. 10.1073/pnas.71.10.4135.
- Ninio [1975] J. Ninio. Kinetic amplification of enzyme discrimination. Biochimie, 57(5):587 – 595, 1975. https://doi.org/10.1016/S0300-9084(75)80139-8.
- Drummond and Wilke [2009] D. A. Drummond and C. O. Wilke. The evolutionary consequences of erroneous protein synthesis. Nat. Rev. Genet., 10(10):715–724, 2009. 10.1038/nrg2662.
- Piñeros and Tlusty [2020] W. D. Piñeros and T. Tlusty. Kinetic proofreading and the limits of thermodynamic uncertainty. Phys. Rev. E, 101:022415, 2020. 10.1103/PhysRevE.101.022415.
- Dobson [1999] C. M. Dobson. Protein misfolding, evolution and disease. Trends Biochem. Sci., 24(9):329 – 332, 1999. https://doi.org/10.1016/S0968-0004(99)01445-0.
- López-Otín et al. [2013] C. López-Otín, M. A. Blasco, L. Partridge, M. Serrano, and G. Kroemer. The hallmarks of aging. Cell, 153(6):1194–1217, 2013. 10.1016/j.cell.2013.05.039.
- Santra et al. [2019] M. Santra, K. A. Dill, and A. M. R. de Graff. Proteostasis collapse is a driver of cell aging and death. P. Natl. Acad. Sci. Usa., 116(44):22173–22178, 2019. 10.1073/pnas.1906592116.
- Spriggs et al. [2010] K. A. Spriggs, M. Bushell, and A. E. Willis. Translational regulation of gene expression during conditions of cell stress. Mol. Cell, 40(2):228–237, 2010. 10.1016/j.molcel.2010.09.028.
- de Nadal et al. [2011] E. de Nadal, G. Ammerer, and F. Posas. Controlling gene expression in response to stress. Nat. Rev. Genet., 12(12):833–845, 2011. 10.1038/nrg3055.
- Dill et al. [2011] K. A. Dill, K. Ghosh, and J. D. Schmit. Physical limits of cells and proteomes. P. Natl. Acad. Sci. Usa., 108(44):17876–17882, 2011. 10.1073/pnas.1114477108.
- Zubkov [2014] M. V. Zubkov. Faster growth of the major prokaryotic versus eukaryotic co2 fixers in the oligotrophic ocean. Nat. Commun., 5(1):3776, 2014. 10.1038/ncomms4776.
- Alexandrov [1993] N. Alexandrov. Structural argument for n-terminal initiation of protein folding. Protein Sci., 2(11):1989–1991, 1993. 10.1002/pro.5560021121.
- Evans et al. [2008] Michael S. Evans, Ian M. Sander, and Patricia L. Clark. Cotranslational folding promotes -helix formation and avoids aggregation in vivo. J. Mol. Biol., 383(3):683 – 692, 2008. https://doi.org/10.1016/j.jmb.2008.07.035.
- Holtkamp et al. [2015] W. Holtkamp, G. Kokic, M. Jäger, J. Mittelstaet, A. A. Komar, and M. V. Rodnina. Cotranslational protein folding on the ribosome monitored in real time. Science, 350(6264):1104–1107, 2015. 10.1126/science.aad0344.
- Kim et al. [2015] S. J. Kim, J. S. Yoon, H. Shishido, Z. Yang, L. A. A. Rooney, J. M. Barral, and W. R. Skach. Translational tuning optimizes nascent protein folding in cells. Science, 348(6233):444–448, 2015. 10.1126/science.aaa3974.
- Wruck et al. [2017] F. Wruck, A. Katranidis, K. H. Nierhaus, G. Büldt, and M. Hegner. Translation and folding of single proteins in real time. P. Natl. Acad. Sci. Usa., 114(22):E4399–E4407, 2017. 10.1073/pnas.1617873114.
- Nilsson et al. [2017] O. B. Nilsson, A. A. Nickson, J. J. Hollins, S. Wickles, A. Steward, R. Beckmann, G. von Heijne, and J. Clarke. Cotranslational folding of spectrin domains via partially structured states. Nat. Struct. & Mol. Bio., 24(3):221–225, 2017. 10.1038/nsmb.3355.
- Samelson et al. [2018] A. J. Samelson, E. Bolin, S. M. Costello, A. K. Sharma, E. P. O’Brien, and S. Marqusee. Kinetic and structural comparison of a protein’s cotranslational folding and refolding pathways. Sci. Adv, 4(5), 2018. 10.1126/sciadv.aas9098.
- Liutkute et al. [2020a] M. Liutkute, E. Samatova, and M. V. Rodnina. Cotranslational folding of proteins on the ribosome. Biomolecules, 10(1):97, 2020a. 10.3390/biom10010097.
- Zhang and Ignatova [2011] G. Zhang and Z. Ignatova. Folding at the birth of the nascent chain: Coordinating translation with co-translational folding. Curr. Opin. Struc. Biol., 21(1):25 – 31, 2011. https://doi.org/10.1016/j.sbi.2010.10.008.
- Trovato and O’Brien [2016] F. Trovato and E. P. O’Brien. Insights into cotranslational nascent protein behavior from computer simulations. Annu. Rev. Biophys., 45(1):345–369, 2016. 10.1146/annurev-biophys-070915-094153.
- Cabrita et al. [2016] L. D. Cabrita, A. M. E. Cassaignau, H. M. M. Launay, C. A. Waudby, T. Wlodarski, C. Camilloni, M. E. Karyadi, A. L. Robertson, X. Wang, A. S. Wentink, L. S. Goodsell, C. A. Woolhead, M. Vendruscolo, C. M. Dobson, and J. Christodoulou. A structural ensemble of a ribosome–nascent chain complex during cotranslational protein folding. Nature Structural & Molecular Biology, 23(4):278–285, 2016. 10.1038/nsmb.3182.
- Waudby et al. [2019] C. A. Waudby, C. M. Dobson, and J. J. Christodoulou. Nature and regulation of protein folding on the ribosome. Trends Biochem. Sci., 44(11):914 – 926, 2019. https://doi.org/10.1016/j.tibs.2019.06.008.
- Kramer et al. [2019] G. Kramer, A. Shiber, and B. Bukau. Mechanisms of cotranslational maturation of newly synthesized proteins. Annu. Rev. Biochem., 88(1):337–364, 2019. 10.1146/annurev-biochem-013118-111717.
- Kaiser et al. [2006] C. M. Kaiser, H. C. Chang, V. R. Agashe, S. K. Lakshmipathy, S. A. Etchells, M. Hayer-Hartl, F. U. Hartl, and J. M. Barral. Real-time observation of trigger factor function on translating ribosomes. Nature, 444(7118):455–460, 2006. 10.1038/nature05225.
- Kaiser et al. [2011] C. M. Kaiser, D. H. Goldman, J. D. Chodera, I. Tinoco, and C. Bustamante. The ribosome modulates nascent protein folding. Science, 334(6063):1723–1727, 2011. 10.1126/science.1209740.
- O’Brien et al. [2012] E. P. O’Brien, J. Christodoulou, M. Vendruscolo, and C. M. Dobson. Trigger factor slows co-translational folding through kinetic trapping while sterically protecting the nascent chain from aberrant cytosolic interactions. J. Am. Chem. Soc., 134(26):10920–10932, 2012. 10.1021/ja302305u.
- O’Brien et al. [2014] E. P. O’Brien, M. Vendruscolo, and C. M. Dobson. Kinetic modelling indicates that fast-translating codons can coordinate cotranslational protein folding by avoiding misfolded intermediates. Nat. Commun., 5(1):2988, 2014. 10.1038/ncomms3988.
- Liu et al. [2019a] K. Liu, K. Maciuba, and C. M. Kaiser. The ribosome cooperates with a chaperone to guide multi-domain protein folding. Mol. Cell, 74(2):310 – 319.e7, 2019a. https://doi.org/10.1016/j.molcel.2019.01.043.
- Jacobs and Shakhnovich [2017] W. M. Jacobs and E. I. Shakhnovich. Evidence of evolutionary selection for cotranslational folding. P. Natl. Acad. Sci. Usa., 114(43):11434–11439, 2017. 10.1073/pnas.1705772114.
- Bitran et al. [2020] A. Bitran, W. M. Jacobs, X. Zhai, and E. Shakhnovich. Cotranslational folding allows misfolding-prone proteins to circumvent deep kinetic traps. P. Natl. Acad. Sci. Usa., 117(3):1485–1495, 2020. 10.1073/pnas.1913207117.
- Walsh et al. [2020] I. M. Walsh, M. A. Bowman, I. F. Soto Santarriaga, A. Rodriguez, and P. L. Clark. Synonymous codon substitutions perturb cotranslational protein folding in vivo and impair cell fitness. P. Natl. Acad. Sci. Usa., 117(7):3528–3534, 2020. 10.1073/pnas.1907126117.
- Fersht [1997] Alan R Fersht. Nucleation mechanisms in protein folding. Curr. Opin. Struc. Biol., 7(1):3 – 9, 1997. https://doi.org/10.1016/S0959-440X(97)80002-4.
- Ensign et al. [2007] Daniel L. Ensign, Peter M. Kasson, and Vijay S. Pande. Heterogeneity even at the speed limit of folding: Large-scale molecular dynamics study of a fast-folding variant of the villin headpiece. J. Mol. Biol., 374(3):806–816, 2007. https://doi.org/10.1016/j.jmb.2007.09.069.
- Lindorff-Larsen et al. [2011] K. Lindorff-Larsen, S. Piana, R. O. Dror, and D. E. Shaw. How fast-folding proteins fold. Science, 334(6055):517–520, 2011. 10.1126/science.1208351.
- Englander and Mayne [2014] S. W. Englander and L. Mayne. The nature of protein folding pathways. P. Natl. Acad. Sci. Usa., 111(45):15873–15880, 2014. 10.1073/pnas.1411798111.
- Malhotra and Udgaonkar [2016] P. Malhotra and J. B. Udgaonkar. How cooperative are protein folding and unfolding transitions? Protein Sci., 25(11):1924–1941, 2016. https://doi.org/10.1002/pro.3015.
- Jacobs and Shakhnovich [2016] W. M. Jacobs and E. I. Shakhnovich. Structure-based prediction of protein-folding transition paths. Biophys. J., 111(5):925 – 936, 2016. https://doi.org/10.1016/j.bpj.2016.06.031.
- Morrissey et al. [2004] M. P. Morrissey, Z. Ahmed, and E. I. Shakhnovich. The role of cotranslation in protein folding: A lattice model study. Polymer, 45(2):557 – 571, 2004. https://doi.org/10.1016/j.polymer.2003.10.090.
- Berman et al. [2000] H. M. Berman, J. Westbrook, Z. Feng, G. Gilliland, T. N. Bhat, H. Weissig, I. N. Shindyalov, and P. E. Bourne. The protein data bank. Nucleic Acids Res., 28(1):235–242, 2000. 10.1093/nar/28.1.235.
- Ivankov et al. [2003] D. N. Ivankov, S. O. Garbuzynskiy, E. Alm, K. W. Plaxco, D. Baker, and A. V. Finkelstein. Contact order revisited: Influence of protein size on the folding rate. Protein Sci., 12(9):2057–2062, 2003. 10.1110/ps.0302503.
- Naganathan and Muñoz [2005] A. N. Naganathan and V. Muñoz. Scaling of folding times with protein size. J. Am. Chem. Soc., 127(2):480–481, 2005. 10.1021/ja044449u.
- Manavalan et al. [2019] B. Manavalan, K. Kuwajima, and J. Lee. Pfdb: A standardized protein folding database with temperature correction. Sci. Rep., 9(1):1588, 2019. 10.1038/s41598-018-36992-y.
- Zhao et al. [2020] Victor Zhao, William M. Jacobs, and Eugene I. Shakhnovich. Effect of protein structure on evolution of cotranslational folding. Biophys. J., 119(6):1123 – 1134, 2020. https://doi.org/10.1016/j.bpj.2020.06.037.
- Notari et al. [2018] L. Notari, M. Martínez-Carranza, J. A. Farías-Rico, P. Stenmark, and G. von Heijne. Cotranslational folding of a pentarepeat -helix protein. J. Mol. Biol., 430(24):5196 – 5206, 2018. https://doi.org/10.1016/j.jmb.2018.10.016.
- Kemp et al. [2019] G. Kemp, R. Kudva, A. de la Rosa, and G. von Heijne. Force-profile analysis of the cotranslational folding of hemk and filamin domains: Comparison of biochemical and biophysical folding assays. J. Mol. Biol., 431(6):1308 – 1314, 2019. https://doi.org/10.1016/j.jmb.2019.01.043.
- Mercier and Rodnina [2018] E. Mercier and M. V. Rodnina. Co-translational folding trajectory of the hemk helical domain. Biochemistry-us., 57(25):3460–3464, 2018. 10.1021/acs.biochem.8b00293.
- Liutkute et al. [2020b] M. Liutkute, M. Maiti, E. Samatova, J. Enderlein, and M. V. Rodnina. Gradual compaction of the nascent peptide during cotranslational folding on the ribosome. eLife, 9:e60895, 2020b. 10.7554/eLife.60895.
- Elfageih et al. [2020] R. Elfageih, A. Karyolaimos, G. Kemp, J. W. de Gier, G. von Heijne, and R. Kudva. Cotranslational folding of alkaline phosphatase in the periplasm of escherichia coli. Protein Sci., 29(10):2028–2037, 2020. https://doi.org/10.1002/pro.3927.
- Khushoo et al. [2011] Amardeep Khushoo, Zhongying Yang, Arthur E. Johnson, and William R. Skach. Ligand-driven vectorial folding of ribosome-bound human cftr nbd1. Mol. Cell, 41(6):682 – 692, 2011. https://doi.org/10.1016/j.molcel.2011.02.027.
- Waudby et al. [2018] C. A. Waudby, T. Wlodarski, M. E. Karyadi, A. M. E. Cassaignau, S. H. S. Chan, A. S. Wentink, J. M. Schmidt-Engler, C. Camilloni, M. Vendruscolo, L. D. Cabrita, and J. Christodoulou. Systematic mapping of free energy landscapes of a growing filamin domain during biosynthesis. P. Natl. Acad. Sci. Usa., 115(39):9744–9749, 2018. 10.1073/pnas.1716252115.
- Eichmann et al. [2010] C. Eichmann, S. Preissler, R. Riek, and E. Deuerling. Cotranslational structure acquisition of nascent polypeptides monitored by nmr spectroscopy. P. Natl. Acad. Sci. Usa., 107(20):9111–9116, 2010. 10.1073/pnas.0914300107.
- Guinn et al. [2018] E. J. Guinn, P. Tian, M. Shin, R. B. Best, and S. Marqusee. A small single-domain protein folds through the same pathway on and off the ribosome. P. Natl. Acad. Sci. Usa., 115(48):12206–12211, 2018. 10.1073/pnas.1810517115.
- Marsden et al. [2018] A. P. Marsden, J. J. Hollins, C. O’Neill, P. Ryzhov, S. Higson, C. A. T. F. Mendonça, T. O. Kwan, G. K. Lee, A. Steward, and J. Clarke. Investigating the effect of chain connectivity on the folding of a beta-sheet protein on and off the ribosome. J. Mol. Biol., 430(24):5207 – 5216, 2018. https://doi.org/10.1016/j.jmb.2018.10.011.
- Tian et al. [2018] P. Tian, A. Steward, R. Kudva, T. Su, P. J. Shilling, A. A. Nickson, J. J. Hollins, R. Beckmann, G. von Heijne, J. Clarke, and R. B. Best. Folding pathway of an ig domain is conserved on and off the ribosome. P. Natl. Acad. Sci. Usa., 115(48):E11284–E11293, 2018. 10.1073/pnas.1810523115.
- Ciryam et al. [2013] P. Ciryam, R. I. Morimoto, M. Vendruscolo, C. M. Dobson, and E. P. O’Brien. In vivo translation rates can substantially delay the cotranslational folding of the escherichia coli cytosolic proteome. P. Natl. Acad. Sci. Usa., 110(2):E132–E140, 2013. 10.1073/pnas.1213624110.
- Friel et al. [2003] C. T. Friel, A. P. Capaldi, and S. E. Radford. Structural analysis of the rate-limiting transition states in the folding of im7 and im9: Similarities and differences in the folding of homologous proteins. J. Mol. Biol., 326(1):293 – 305, 2003. https://doi.org/10.1016/S0022-2836(02)01249-4.
- Hanazono et al. [2016] Y. Hanazono, K. Takeda, and K. Miki. Structural studies of the n-terminal fragments of the ww domain: Insights into co-translational folding of a beta-sheet protein. Sci. Rep., 6(1):34654, 2016. 10.1038/srep34654.
- Liu et al. [2019b] K. Liu, X. Chen, and C. M. Kaiser. Energetic dependencies dictate folding mechanism in a complex protein. P. Natl. Acad. Sci. Usa., 116(51):25641–25648, 2019b. 10.1073/pnas.1914366116.
- Chen et al. [2020] X. Chen, N. Rajasekaran, K. Liu, and C. M. Kaiser. Synthesis runs counter to directional folding of a nascent protein domain. Nat. Commun., 11(1):5096, 2020. 10.1038/s41467-020-18921-8.
- Nissley et al. [2020] D. A. Nissley, Q. V. Vu, F. Trovato, N. Ahmed, Y. Jiang, M. S. Li, and E. P. O’Brien. Electrostatic interactions govern extreme nascent protein ejection times from ribosomes and can delay ribosome recycling. J. Am. Chem. Soc., 142(13):6103–6110, 2020. 10.1021/jacs.9b12264.
- Hu et al. [2016] W. Hu, Z. Y. Kan, L. Mayne, and S. W. Englander. Cytochrome c folds through foldon-dependent native-like intermediates in an ordered pathway. P. Natl. Acad. Sci. Usa., 113(14):3809–3814, 2016. 10.1073/pnas.1522674113.
- de Prat Gay et al. [1995] Gonzalo de Prat Gay, Javier Ruiz-Sanz, José L. Neira, Fernando J. Corrales, Daniel E. Otzen, Andreas G. Ladurner, and Alan R. Fersht. Conformational pathway of the polypeptide chain of chymotrypsin inhibitor-2 growing from its n terminusin vitro. parallels with the protein folding pathway. J. Mol. Biol., 254(5):968 – 979, 1995. https://doi.org/10.1006/jmbi.1995.0669.
- Fersht et al. [1999] A. Fersht et al. Structure and Mechanism in Protein Science: A Guide to Enzyme Catalysis and Protein Folding. Macmillan, 1999.
- Jones and Wittung-Stafshede [2003] K. Jones and P. Wittung-Stafshede. The largest protein observed to fold by two-state kinetic mechanism does not obey contact-order correlation. J. Am. Chem. Soc., 125(32):9606–9607, 2003. 10.1021/ja0358807.
- El-Gebali et al. [2019] S. El-Gebali, J. Mistry, A. Bateman, S. R. Eddy, A. Luciani, S. C. Potter, M. Qureshi, L. J. Richardson, G. A. Salazar, A. Smart, E. L. L. Sonnhammer, L. Hirsh, L. Paladin, D. Piovesan, S. C. E. Tosatto, and R. D. Finn. The pfam protein families database in 2019. Nucleic Acids Res., 47(D1):D427–D432, 2019. 10.1093/nar/gky995.
- Toyama and Hetzer [2013] B. H. Toyama and M. W. Hetzer. Protein homeostasis: Live long, won’t prosper. Nat. Rev. Mol. Cell Bio., 14(1):55–61, 2013. 10.1038/nrm3496.
- Wang [2005] W. Wang. Protein aggregation and its inhibition in biopharmaceutics. Int. J. Pharmaceut., 289(1):1 – 30, 2005. https://doi.org/10.1016/j.ijpharm.2004.11.014.
- Fornasiero et al. [2018] E. F. Fornasiero, S. Mandad, H. Wildhagen, M. Alevra, B. Rammner, S. Keihani, F. Opazo, I. Urban, T. Ischebeck, M. S. Sakib, M. K. Fard, K. Kirli, T. P. Centeno, R. O. Vidal, R. U. Rahman, E. Benito, A. Fischer, S. Dennerlein, P. Rehling, I. Feussner, S. Bonn, M. Simons, H. Urlaub, and S. O. Rizzoli. Precisely measured protein lifetimes in the mouse brain reveal differences across tissues and subcellular fractions. Nat. Commun., 9(1):4230, 2018. 10.1038/s41467-018-06519-0.
- Yun et al. [2007] H. Yun, J. W. Lee, J. Jeong, J. Chung, J. M. Park, H. N. Myoung, and S. Y. Lee. Ecoprodb: The escherichia coli protein database. Method. Biochem. Anal., 23(18):2501–2503, 2007. 10.1093/bioinformatics/btm351.
- Miller et al. [2002] E. J. Miller, K. F. Fischer, and S. Marqusee. Experimental evaluation of topological parameters determining protein-folding rates. P. Natl. Acad. Sci. Usa., 99(16):10359–10363, 2002. 10.1073/pnas.162219099.
- Lo et al. [2008] W. C. Lo, C. C. Lee, C. Y. Lee, and P. C. Lyu. Cpdb: A database of circular permutation in proteins. Nucleic Acids Res., 37:D328–D332, 2008. 10.1093/nar/gkn679.
- Kemplen et al. [2015] K. R. Kemplen, D. De Sancho, and J. Clarke. The response of greek key proteins to changes in connectivity depends on the nature of their secondary structure. J. Mol. Biol., 427(12):2159 – 2165, 2015. https://doi.org/10.1016/j.jmb.2015.03.020.
- Komar et al. [1999] A. A. Komar, T. Lesnik, and C. Reiss. Synonymous codon substitutions affect ribosome traffic and protein folding during in vitro translation. Febs Lett., 462(3):387 – 391, 1999. https://doi.org/10.1016/S0014-5793(99)01566-5.
- Clarkson et al. [1997] W. D. Clarkson, A. H. Corbett, B. M. Paschal, H. M. Kent, A. J. McCoy, L. Gerace, P. A. Silver, and M. Stewart. Nuclear protein import is decreased by engineered mutants of nuclear transport factor 2 (ntf2) that do not bind gdp-ran11edited by i. b. holland. J. Mol. Biol., 272(5):716 – 730, 1997. https://doi.org/10.1006/jmbi.1997.1255.
- Han et al. [2007] J. H. Han, S. Batey, A. A. Nickson, S. A. Teichmann, and J. Clarke. The folding and evolution of multidomain proteins. Nat. Rev. Mol. Cell Bio., 8(4):319–330, 2007. 10.1038/nrm2144.
- Goldman et al. [2015] D. H. Goldman, C. M. Kaiser, A. Milin, M. Righini, I. Tinoco, and C. Bustamante. Mechanical force releases nascent chain–mediated ribosome arrest in vitro and in vivo. Science, 348(6233):457–460, 2015. 10.1126/science.1261909.
- Leininger et al. [2019] S. E. Leininger, F. Trovato, D. A. Nissley, and E. P. O’Brien. Domain topology, stability, and translation speed determine mechanical force generation on the ribosome. P. Natl. Acad. Sci. Usa., 116(12):5523–5532, 2019. 10.1073/pnas.1813003116.
- Batey et al. [2005] S. Batey, L. G. Randles, A. Steward, and J. Clarke. Cooperative folding in a multi-domain protein. J. Mol. Biol., 349(5):1045 – 1059, 2005. https://doi.org/10.1016/j.jmb.2005.04.028.
- Kemp et al. [2020] G. Kemp, O. B. Nilsson, P. Tian, R. B. Best, and G. von Heijne. Cotranslational folding cooperativity of contiguous domains of -spectrin. P. Natl. Acad. Sci. Usa., 2020. 10.1073/pnas.1909683117.
- Alamo et al. [2011] M. Alamo, D. J. Hogan, S. Pechmann, V. Albanese, P. O. Brown, and J. Frydman. Defining the specificity of cotranslationally acting chaperones by systematic analysis of mrnas associated with ribosome-nascent chain complexes. Plos Biol., 9(7):1–23, 2011. 10.1371/journal.pbio.1001100.
- Willmund et al. [2013] F. Willmund, M. del Alamo, S. Pechmann, T. Chen, V. Albanèse, E. B. Dammer, J. Peng, and J. Frydman. The cotranslational function of ribosome-associated hsp70 in eukaryotic protein homeostasis. Cell, 152(1):196 – 209, 2013. https://doi.org/10.1016/j.cell.2012.12.001.
- Nölting and Agard [2008] B. Nölting and D. A. Agard. How general is the nucleation-condensation mechanism? Proteins., 73(3):754–764, 2008. 10.1002/prot.22099.
- Wagaman et al. [2014] A. S. Wagaman, A. Coburn, I. Brand-Thomas, B. Dash, and S. S. Jaswal. A comprehensive database of verified experimental data on protein folding kinetics. Protein Sci., 23(12):1808–1812, 2014. 10.1002/pro.2551.
- Consortium [2018] The UniProt Consortium. Uniprot: A worldwide hub of protein knowledge. Nucleic Acids Res., 47(D1):D506–D515, 2018. 10.1093/nar/gky1049.
- Dana et al. [2018] J. M. Dana, A. Gutmanas, N. Tyagi, G. Qi, C. O’Donovan, M. Martin, and S. Velankar. Sifts: Updated structure integration with function, taxonomy and sequences resource allows 40-fold increase in coverage of structure-based annotations for proteins. Nucleic Acids Res., 47(D1):D482–D489, 2018. 10.1093/nar/gky1114.
- Almagro Armenteros et al. [2019] J. J. Almagro Armenteros, K. D. Tsirigos, C. K. Sønderby, T. N. Petersen, O. Winther, S. Brunak, G. von Heijne, and H. Nielsen. Signalp 5.0 improves signal peptide predictions using deep neural networks. Nat. Biotechnol., 37(4):420–423, 2019. 10.1038/s41587-019-0036-z.
- Kubelka et al. [2004] J. Kubelka, J. Hofrichter, and W. A. Eaton. The protein folding ‘speed limit’. Curr. Opin. Struc. Biol., 14(1):76 – 88, 2004. https://doi.org/10.1016/j.sbi.2004.01.013.
- Rollins and Dill [2014] G. C. Rollins and K. A. Dill. General mechanism of two-state protein folding kinetics. J. Am. Chem. Soc., 136(32):11420–11427, 2014. 10.1021/ja5049434.
- Song et al. [2010] J. Song, K. Takemoto, H. Shen, H. Tan, M. M. Gromiha, and T. Akutsu. Prediction of protein folding rates from structural topology and complex network properties. IPSJ Transactions on Bioinformatics, 3:40–53, 2010. 10.2197/ipsjtbio.3.40.
- Wagaman and Jaswal [2014] A. S. Wagaman and S. S. Jaswal. Capturing protein folding-relevant topology via absolute contact order variants. Journal of Theoretical and Computational Chemistry, 13(01):1450005, 2014. 10.1142/S0219633614500059.
- Thirumalai [1995] D. Thirumalai. From minimal models to real proteins: Time scales for protein folding kinetics. J. Phys. I France, 5(11):1457–1467, 1995. 10.1051/jp1:1995209.
- Gutin et al. [1996] A. M. Gutin, V. I. Abkevich, and E. I. Shakhnovich. Chain length scaling of protein folding time. Phys. Rev. Lett., 77:5433–5436, 1996. 10.1103/PhysRevLett.77.5433.
- Cieplak et al. [1999] M. Cieplak, T. X. Hoang, and M. S. Li. Scaling of folding properties in simple models of proteins. Phys. Rev. Lett., 83:1684–1687, 1999. 10.1103/PhysRevLett.83.1684.
- Koga and Takada [2001] N. Koga and S. Takada. Roles of native topology and chain-length scaling in protein folding: A simulation study with a gō-like model. J. Mol. Biol., 313(1):171 – 180, 2001. https://doi.org/10.1006/jmbi.2001.5037.
- Li et al. [2002] M. S. Li, D. K. Klimov, and D. Thirumalai. Dependence of folding rates on protein length. J. Phys. Chem. B, 106(33):8302–8305, 2002. 10.1021/jp025837q.
- Lane and Pande [2012] T. J. Lane and V. S. Pande. A simple model predicts experimental folding rates and a hub-like topology. J. Phys. Chem. B, 116(23):6764–6774, 2012. 10.1021/jp212332c.
- Garbuzynskiy et al. [2013] S. O. Garbuzynskiy, D. N. Ivankov, N. S. Bogatyreva, and A. V. Finkelstein. Golden triangle for folding rates of globular proteins. P. Natl. Acad. Sci. Usa., 110(1):147–150, 2013. 10.1073/pnas.1210180110.
- Lane and Pande [2013] T. J. Lane and V. S. Pande. Inferring the rate-length law of protein folding. Plos One, 8(12):1–5, 2013. 10.1371/journal.pone.0078606.