SiO emission as a probe of Cloud-Cloud Collisions in Infrared Dark Clouds††thanks: Based on observations carried out with the IRAM 30m Telescope under projects 041-18. IRAM is supported by INSU/CNRS (France), MPG (Germany) and IGN (Spain).
Abstract
Infrared Dark Clouds (IRDCs) are very dense and highly extincted regions that host the initial conditions of star and stellar cluster formation. It is crucial to study the kinematics and molecular content of IRDCs to test their formation mechanism and ultimately characterise these initial conditions. We have obtained high-sensitivity Silicon Monoxide, SiO(2-1), emission maps toward the six IRDCs, G018.8200.28, G019.27+00.07, G028.5300.25, G028.67+00.13, G038.9500.47 and G053.11+00.05 (cloud A, B, D, E, I and J, respectively), using the 30-m antenna at the Instituto de Radioastronomía Millimétrica (IRAM30m). We have investigated the SiO spatial distribution and kinematic structure across the six clouds to look for signatures of cloud-cloud collision events that may have formed the IRDCs and triggered star formation within them. Toward clouds A, B, D, I and J we detect spatially compact SiO emission with broad line profiles which are spatially coincident with massive cores. Toward the IRDCs A and I, we report an additional SiO component that shows narrow line profiles and that is widespread across quiescent regions. Finally, we do not detect any significant SiO emission toward cloud E. We suggest that the broad and compact SiO emission detected toward the clouds is likely associated with ongoing star formation activity within the IRDCs. However, the additional narrow and widespread SiO emission detected toward cloud A and I may have originated from the collision between the IRDCs and flows of molecular gas pushed toward the clouds by nearby HII regions.
keywords:
ISM: clouds; ISM: individual objects: G018.8200.28, G019.27+00.07, G028.5300.25, G028.67+00.13, G038.9500.47, G053.11+00.05; ISM: molecules; ISM: HII regions; ISM: kinematics and dynamics.1 Introduction
Infrared Dark Clouds (IRDCs) are relatively dense (n(H2) 103-104 cm-3; Tan et al. 2014) and cold (T 25 K; Pillai et al. 2006) regions of the sky, first detected as dark features against the mid-Infrared (IR) galactic background (Perault et al. 1996, Egan et al. 1998). These massive clouds show very little level of star formation activity, present H2 column densities similar to those measured in known high-mass star forming regions (Rathborne et al. 2006, Simon et al. 2006b, Peretto & Fuller 2010) and furthermore they can host cold cores, i.e., the earliest phase of massive star formation. For all these reasons, in the past decade IRDCs have been proposed as the birthplace of massive stars ( 8 M⊙) and stellar clusters (Carey et al. 2000, Rathborne et al. 2006, Battersby et al. 2010). It is nowadays clear that IRDCs are the densest regions of Giant Molecular Clouds (e.g., Barnes et al. 2018), harbouring star formation at a wide range of stellar mass i.e., from low- to high-mass star and stellar cluster formation (Foster et al. 2014, Sanhueza et al. 2017, Pillai et al. 2019). However, it is not entirely clear yet the mechanism that ignites the star formation process in such clouds.
As seen by means of simulations, both the mechanisms responsible for assembling the cloud, such as flow-driven formation scenario, gravitational collapse, cloud-cloud collisions (Hennebelle et al. 2008, Heitsch et al. 2009, Nguyen Luong 2012, Tasker & Tan 2009, Van Loo et al. 2014) and the dynamical processes that IRDCs undergo during their lifetime (Klessen & Glover 2016, Kruijssen et al. 2019), can efficiently initiate the star formation process within the clouds. However, it is not yet entirely clear the relative importance of magnetic field, turbulence and gravity in regulating the formation of molecular dense structures at all scales (Commerçon et al. 2011, Fontani et al. 2018, Yang et al. 2019). In particular, some formation models, such as the flow-driven scenario, presents major problems when fields are considered (Körtgen & Banerjee 2015, Körtgen et al. 2016).
Hence, it is crucial to investigate the formation mechanism and dynamics of IRDCs to better understand the physical process that sets in star and stellar cluster formation in such objects. Furthermore, a deep understanding of the cloud dynamics is crucial to reproduce the measured levels of star formation efficiency in galaxies (Leroy et al. 2008, Ceverino & Klypin 2009).
Among the different scenarios, IRDCs have been proposed to form at the shock-compressed layer within the interface of low velocity (10 km s-1; Wu et al. 2016, 2017a, 2017b, Li et al. 2018) collisions between pre-existing, more massive molecular clouds and/or filaments. Collisions of such pre-existing molecular structures may be induced both by their natural motion across the galactic plane (Tan 2000, Tasker &
Tan 2009, Van Loo
et al. 2014, Wu
et al. 2015, Henshaw
et al. 2013, Inoue &
Fukui 2013, Jiménez-Serra
et al. 2014, Inutsuka et al. 2015, Colling et al. 2018) and by dynamical processing caused by external stellar feedback e.g., induced by the expanding shells of supernova remnants (SNRs) and/or HII regions (Fukui
et al. 2018, 2019, Cosentino
et al. 2019).
Due to the shock associated with the cloud-cloud (or filament-filament) collisions, fossil records of such interactions are expected to be found in the radial velocities, line profiles and chemistry of the molecular emission observed toward IRDCs (Tasker &
Tan 2009, Nguyen-Lu’o’ng
et al. 2013, Wu
et al. 2015, Wu et al. 2016, 2017a, 2017b, Bisbas et al. 2017). In particular, due to the relatively low velocity of the shock interaction and its extended spatial scale, molecular shock tracers, such as Silicon Monoxide (SiO), are expected to show narrow line profiles (few km s-1) and to be widespread at parsec-scales. These features are in contrast with those typically seen in molecular outflows in sites of on-going star formation activity, where the line profiles are broad (with linewidths of several tens of km s-1) and concentrated around the vicinity of the protostars (Martin-Pintado et al. 1992, Jiménez-Serra
et al. 2005, 2011, Codella &
Bachiller 1999).
The first attempt to directly detect signatures of cloud-cloud collisions as the formation mechanism of IRDCs, was reported in Jiménez-Serra
et al. (2010). These authors studied the kinematic structure and line profiles of the shock tracer SiO toward the cloud G035.3900.33. SiO is is an excellent shock tracer (Schilke et al. 1997) because it is known to be heavily depleted in quiescent regions ( 10-12; Martin-Pintado et al. 1992, Jiménez-Serra
et al. 2005) while it is dramatically enhanced in outflows (by several orders of magnitude) by the processing of dust grains in shocks (Martin-Pintado et al. 1992, Jiménez-Serra
et al. 2005, 2008, 2009) when dust grains are processed by shocks. Toward G035.3900.33, Jiménez-Serra
et al. (2010) reported the detection of a bright and broad SiO component associated with sites of ongoing star formation activity together with widespread and fainter SiO emission characterised by narrow (2 km s-1) line profiles and located toward the quiescent regions of the cloud. The authors suggested, among other possibilities, that the narrow SiO emission component may be the fossil record of a cloud-cloud collision from which the IRDC has been formed. Later studies of the kinematic structure of the cloud (Jiménez-Serra
et al. 2014, Henshaw et al. 2014) have suggested that this may be the result of the merging of several pre-existing molecular filaments at larger scales (Henshaw
et al. 2013). Such a scenario has been supported by further studies of the kinematics and chemical properties of the cloud (Bisbas
et al. 2018, Liu et al. 2018, Juvela
et al. 2018, Sokolov
et al. 2019).
In Cosentino
et al. (2018), we extended the study reported by Jiménez-Serra
et al. (2010) to the three IRDCs G028.37+00.07, G034.43+00.24 and G034.7700.55. Among these sources, we reported the presence of very narrow and widespread SiO emission (mean linewidth 1.6 km s-1) toward the IRDC G034.7700.55. This narrow SiO component is located in a region of lower extinction of the cloud and far away from its massive cores. In a follow-up study, we used high-angular resolution observations of the SiO emission toward G034.7700.55, obtained by the Atacama Large (sub)Millimetre Array (ALMA), to show that the shock tracer emission is the result of a large-scale shock interaction triggered by the collision of molecular gas pushed toward the IRDC by the nearby supernova remnant W44 (Cosentino
et al. 2019).
Studies reported in Jiménez-Serra
et al. (2010) and Cosentino
et al. (2018), highlight single-dish observations of SiO as an useful tool to test the formation mechanism and large-scale dynamics of IRDCs through cloud-cloud collisions. In this paper, we aim to extend the study of the SiO emission to six additional IRDCs: G018.8200.28, G019.27+00.07, G028.5300.25, G028.67+00.13, G038.9500.47 and G053.11+00.05. Specifically, we attempt to identify signatures of cloud-cloud collisions that may have formed the clouds themselves, initiating the process of star formation within them. In Section 2 we discuss the target selection. In Section 3 we describe the observing method and data acquisition. In Section 4 we describe procedure and assumptions adopted to perform the data analysis. In Section 5 we present the results obtained from the analysis of the SiO emission toward the sources G018.8200.28, G019.27+00.07, G028.5300.25, G028.67+00.13, G038.9500.47, G053.11+00.05. In Section 6, we discuss the obtained results in light of cloud formation theories and compare them with previous studies. In Section 7, we introduce the possibility of different types of cloud-cloud collisions and discuss their relative importance for cloud and massive star formation. Finally, in Section 8 we summarise our conclusions.
2 The IRDC Sample
The six IRDCs studied in this work, along with the sources G035.3900.33, G028.37+00.07, G034.43+00.24 and G034.7700.55, have been presented as a ten clouds sample in Butler & Tan (2009, 2012). The ten sources are part of an extended catalogue of IRDCs, identified as dark features against the diffuse mid-IR galactic background by Simon et al. (2006a). For all the clouds of the catalogue, Simon et al. (2006a) estimated the VLSR and kinematic distances from observations of the 13CO emission. Subsequently, Rathborne et al. (2006) estimated cloud masses from the dust continuum at 1.2 mm for a sub-sample of 38 IRDCs. Masses for the ten clouds have also been estimated by Kainulainen & Tan (2013) from their MIR and NIR 8 m emission, as obtained by Spitzer. The ten clouds presented in Jiménez-Serra et al. (2010), Cosentino et al. (2018) and this paper, were selected by Butler & Tan (2009) from the 38 cloud sample in Rathborne et al. (2006) for being located relatively nearby (kinematic distance 6 kpc), for being relatively massive (0.2-29 103 M☉) and/or for showing the highest levels of contrast against the diffuse Galactic background emission at 8 m. The cloud morphology varies across the sample with clouds A, D and I being more filamentary and clouds B, E and J showing more globular shapes.
3 Observations
The J21 rotational transition of SiO (=86.84696 GHz) was mapped in July 2017 toward the six IRDCs G018.8200.28, G019.27+00.07, G028.5300.25, G028.67+00.13, G038.9500.47, G053.11+00.05 (thereafter cloud A, B, D, E, I and J; Butler & Tan 2009) using the 30m single dish antenna at Instituto de Radioastronomia Millimetrica (IRAM 30m, Pico Veleta, Spain). Observations were performed in On-The-Fly (OTF) observing mode with angular separation in the direction perpendicular to the scanning direction of 6′′. Central coordinates, off positions and map sizes adopted for the six sources are listed in Table 1. For the observations, we used the FTS spectrometer set to provide a spectral resolution of 50 kHz, corresponding to a velocity resolution of 0.16 km s-1 at the SiO rest frequency. Intensities were measured in units of antenna temperature, T, and converted into main-beam brightness temperature, Tmb= T (Feff/Beff), using beam and forward efficiencies of Beff=0.81 and Feff=0.95, respectively. The final data cubes were created using the CLASS software within the GILDAS package111See http://www.iram.fr/IRAMFR/GILDAS. and have a spatial resolution of 30′′ and a pixel size of 15′′15′′. In order to achieve this we convolved the native resolution data with a Gaussian kernel of = 10′′(HPBW). The rms achieved during observations is 10 mK per 0.16 km s-1 channel but all spectra were smoothed in velocity to improve the signal-to-noise ratio of the measured line emission. This provides a final velocity resolution (i.e. channel width) of V = 0.3 km s-1.
| Cloud | Central Coordinatesa | V | db | R | Massd | Off Position | Map Size | rms | |
|---|---|---|---|---|---|---|---|---|---|
| RA(J2000) | DEC(J2000) | [ km s-1] | [kpc] | [pc] | [103 M⊙] | [′′,′′] | [′′′′] | [mK] | |
| (A) G018.8200.28 | 18:26:18.7 | -12:41:16.3 | 65.8 | 4.8 | 10.4 | 18.5 | 200,+100 | 300240 | 5 |
| (B) G019.27+00.07 | 18:25:56.1 | -12:04:47.2 | 26.2 | 2.4 | 2.7 | 2.2 | +130,+300 | 250230 | 7 |
| (D) G028.5300.25 | 18:44:17.4 | -04:00:31.4 | 87.0 | 5.7 | 16.9 | 74.3 | +200,+40 | 330360 | 4 |
| (E) G028.67+00.13 | 18:43:08.1 | -03:44.54.3 | 79.5 | 5.1 | 11.5 | 28.7 | +110,+380 | 180160 | 9 |
| (I) G038.9500.47 | 19:04:08.1 | +05:09:15.0 | 41.6 | 2.7 | 3.7 | 2.7 | 120,+190 | 180180 | 6 |
| (J) G053.11+00.05 | 19:29:16.7 | +17:54:40.0 | 22.0 | 1.8 | 0.8 | 0.2 | +190,10 | 160170 | 5 |
4 Method and Assumptions
In this paper, we aim to investigate the presence of differentiation in the linewidth and velocity distribution of the SiO emission across the different positions, toward the six IRDCs. In particular, the ultimate aim of this study is to identify the presence of narrow and widespread SiO emission across the six sources. This is similar to the study performed by Cosentino
et al. (2018) toward clouds G028.37+00.07, G034.43+00.24 and G034.7700.55 (corresponding to clouds C, F and G in the Butler & Tan 2009 sample).
In Figure 1, we show SiO spectra extracted across clouds A, B, D, I and J toward several positions of both star forming and quiescent components. Since no significant SiO emission is detected toward cloud E (see below), we do not show spectra extracted toward this source. The spectra have been extracted over a beam aperture of 30′′and the corresponding positions are indicated as red diamonds in Figure 2.
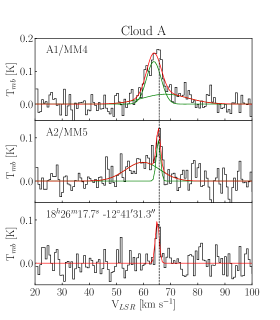
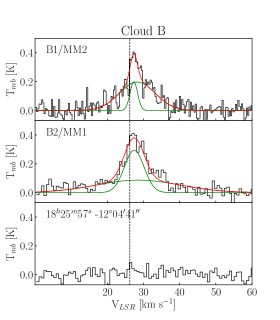
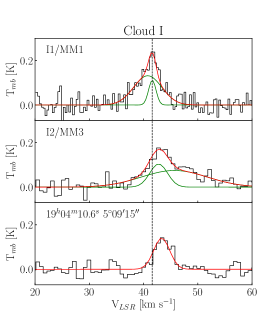
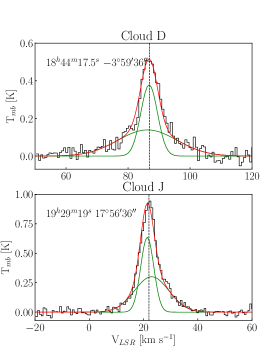
As shown in Figure 1, the line profile of the SiO emission across the six clouds shows a complex structure (red curves) i.e. with multiple velocity components (green curves)showing different linewidths and peak intensities. Motivated by the complex line profiles of the SiO emission across the IRDCs, we use the IDL tool SCOUSE222 https://github.com/jdhenshaw/SCOUSE (Henshaw et al. 2016) to perform a Gaussian deconvolution of all the spectra. SCOUSE provides a fast, robust and systematic method to perform multi-Gaussian fitting of all the spectra stored in a datacube, allowing the user to obtain information on the central velocity, peak intensity and linewidth of every single emission line above the (user-defined) detection level. In our analysis, we consider as significant all lines having intensity I3rms. Moreover for each identified Gaussian component, we also require that the area underneath the curve fulfils the following condition:
| (1) |
Where is the area of the Gaussian component and the right-hand side of the equation is the 3rms integrated over a velocity range equal to the line width of the Gaussian. and correspond to the spectral velocity resolution and the line FWHM, respectively.
In addition, we have set the tolerance parameters within SCOUSE so that linewidths computed by the code are always larger than the velocity resolution in the spectra. Moreover, we impose that the separation in centroid velocity between two adjacent Gaussian components must be 0.5Vmin, where Vmin is the narrower linewidth of the two Gaussian components. Finally, SCOUSE ensures the uniqueness of the results by applying post-fitting controls that are described in details in Section 3.1.5 of Henshaw
et al. (2016).
From the information provided by the SCOUSE output, we produce histograms showing the linewidth and velocity distributions of the SiO emission across the six IRDCs. Hence, from the obtained distributions, we investigate the presence of differentiation in the line profile features across a map. In particular, we use the velocity distributions to study the kinematic structures of the shocked gas across the clouds. Thus, we use the line width distributions to detect the presence of narrow SiO emission across the IRDCs. We note that SCOUSE provided us uncertainty on the line widths and centroid velocities of the Gaussian fitting of 0.5 km s-1 and 0.3 km s-1, respectively. This indicates that the scattered components in the linewidth and centroid distributions in Figure 3 and 6 are not artefacts due to the goodness of the fitting.
In order to disentangle between the spectrally narrow and broad SiO emission, we defined a linewidth threshold of 5 km s-1. This is consistent with the method described in Cosentino
et al. (2018), where all emission with linewidths below 5 km s-1 was defined as narrow. This is justified by the fact that the maximum linewidth observed for the dense gas tracer H13CO and HN13C emission in clouds C, F and G is 5 km s-1. From a preliminary analysis (Cosentino et al. in prep), this seems to be the case also for the H13CO and HN13C emission toward clouds A, B, D, E, I and J. Hence, toward the ten clouds of the sample, these dense gas tracers mainly probe the dense ambient gas in our sources and there is no evidence that shocks affect their linewidth (Cosentino
et al. 2018 ; Cosentino et al. in prep.). Hence, also in this work, we set a threshold of 5 km s-1 to disentangle between narrow (linewidth 5 km s-1) and broad (linewidth 5 km s-1) line profiles in the SiO emission.
Finally, in Cosentino
et al. (2018), we adopted a histogram bin-size for the velocity and line width distributions corresponding to 1/3 of the mean intensity-weighted line widths of the dense gas emission. The H13CO and HN13C mean intensity-weighted line width is 1.5 km s-1 in cloud C, F and G. Hence we used a bin size 0.5 km s-1 for all the histograms of the three clouds. This was to allow a direct comparison between the kinematic structure of the shocked gas (SiO emission) and that of the more quiescent dense gas (H13CO and HN13C emission). From a preliminary investigation, the mean intensity-weighted line widths measured for the dense gas tracers toward clouds A, B, D, E, I and J is 1.8 km s-1 (Cosentino et al. in prep.). Hence, following the method adopted in Cosentino
et al. (2018), a bin size of 0.6 km s-1 should be employed here to build the SiO line width and velocity distributions. However, in this work, we will still use the slightly smaller bin size of 0.5 km s-1, in order to allow a direct comparison with the results obtained for cloud C, F and G.
5 Results
5.1 The SiO Spatial Distribution: Looking for Widespread Emission
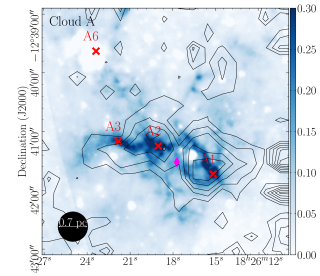
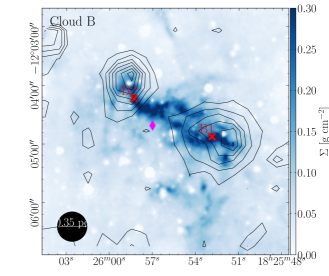
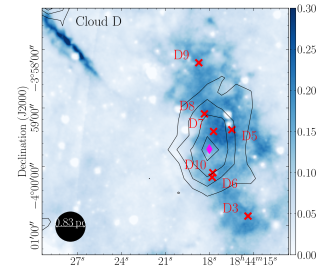
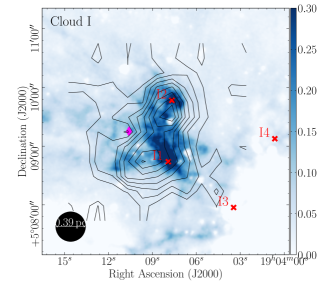
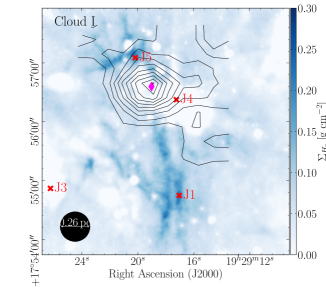
We investigate the spatial distributions of the SiO emission across the six clouds of the sample and report in Figure 2 the SiO integrated intensity maps for cloud A, B, D, E, I and J. The emission levels (black contours) are superimposed on the mass surface density maps (in blue scale) obtained by Kainulainen &
Tan (2013) and in these and all the following maps, the names and positions (black crosses; Rathborne et al. 2006, Butler &
Tan 2009, 2012) of the massive cores within the clouds are indicated.
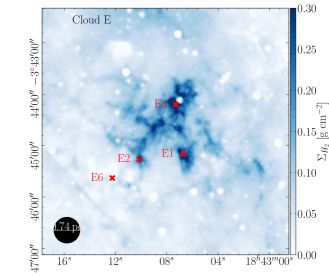
We detect very bright and extended SiO emission toward cloud A, B, D, I and J and no emission above the 3 level ( = 0.07 K km s-1) toward cloud E. The emission across cloud A (integration range 40 to 100 km s-1) and I (integration range 10 to 70 km s-1) shows similar features i.e., it is widespread across the whole filamentary structure with emission peaks in correspondence of the massive cores A1 and A2 toward cloud A and I1 and I2 toward cloud I. The shock tracer emission covers a spatial scale of 4.22.2 parsecs2 toward cloud A (d4.8 kpc; Simon et al. 2006b) and 1.31.7 parsecs2 toward cloud I (d2.7 kpc; Simon et al. 2006b). Toward cloud B (integration range 545 km s-1) the SiO is distributed among two blob-like structures spatially coincident with the two cores B1 and B2. The emission morphology is very compact, with the most extended structure covering a spatial scale of 0.30.7 parsecs2 (d2.4 kpc; Simon et al. 2006b) and no emission is detected toward quiescent regions across the cloud. Finally, toward cloud D (integration range 40120 km s-1) and J (integration range -1060 km s-1), very compact SiO emission is found at the centre of the regions crowded with massive cores. The SiO emission is extended across a spatial scale of 0.72.5 parsecs2 toward cloud D (d5.7 kpc; Simon et al. 2006b) and 0.30.8 parsecs2 toward cloud J (d1.8 kpc; Simon et al. 2006b).
5.2 The SiO Line Profile: Looking for Narrow Shock Tracer Emission
From the analysis performed with SCOUSE, we extract information on the line widths, central velocities and peak intensities of the SiO emission lines at each positions (averaging over a beam) across the cloud areas and build distributions of such quantities to study changes in the SiO line profiles across the IRDCs. For all histograms reported in the following Sections, we adopt a bin size of 0.5 km s-1, as discussed in Sec. 4 and use the y-axis to show the percentage of emission lines having a certain line width or central velocity and normalised for each cloud to the total number of positions in which SiO emission has been detected. Since no emission is detected toward cloud E, we exclude the cloud from the following analysis and only show distributions obtained for the remaining five clouds.
5.2.1 The SiO line width distributions
We now investigate variations in the SiO line widths across the five IRDCs in which shocked gas has been detected, using the SiO line width distributions obtained for clouds A, B, D, I and J (from top to bottom) as shown in Figure 3. As discussed in Section 4, we adopt a threshold of 5 km s-1to differentiate between broad and narrow SiO emission.
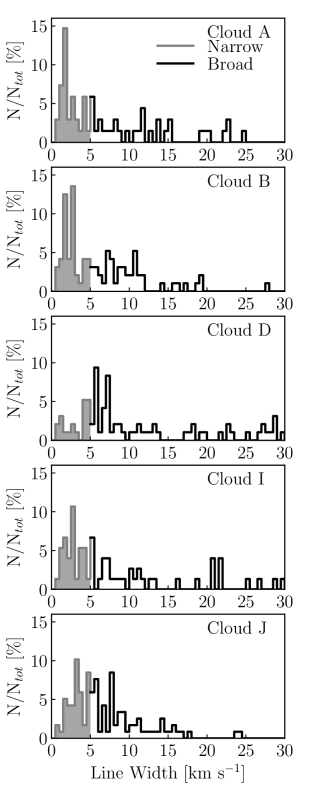
Toward the five clouds, the SiO emission shows complex line width distributions with both narrow (V 5 km s-1; grey filled histograms) and broad (V 5 km s-1; black empty histograms) line width components that coexist with different relative percentages. In clouds A and B, the two components are almost equally distributed, representing each 50% of the total SiO emission lines detected. The narrow component is clearly identified by well-defined peaks at linewidth 2 km s-1, while the broad component shows a spread distribution with line widths up to 20 to 25 km s-1. In cloud D, the distribution is dominated by the broad component that accounts for of the total detected lines, and for the narrow emission, there is no preferred peak in the narrow line width distribution. Finally, in cloud I and J, the SiO emission shows line width distributions intermediate between the case of cloud A and B and the case of cloud D. The narrow and broad emission components represent each 50% of the total emission lines, similarly to the case of clouds A and B. However, as in cloud D, no dominant peaks are present in the narrow component distribution. We report the percentage of SiO emission having line width 3 and 5 km s-1 in Table 2, along with the mean intensity-weighted line widths of the narrow (5 km s-1) and broad SiO emission components. For comparison, the mean intensity-weighted line width measured in Cosentino et al. (2018) for cloud G is 1.6 km s-1. We note that, as discussed in Section 4, all the line components fitted with SCOUSE have integrated areas above 3 times the integrated noise over the same linewidth (see Eq. 1).
| Cloud | 3 km s-1 | 5 km s-1 | V | V |
|---|---|---|---|---|
| [%] | [%] | [ km s-1] | [ km s-1] | |
| A | 36.8 | 51.5 | 2.1 | 12.0 |
| B | 39.6 | 52.1 | 2.4 | 10.7 |
| D | 10.4 | 22.9 | 3.1 | 14.5 |
| E | ||||
| I | 29.3 | 48.0 | 2.8 | 12.2 |
| J | 26.3 | 48.3 | 3.5 | 8.5 |
5.2.2 Spatial distributions of the SiO line width components
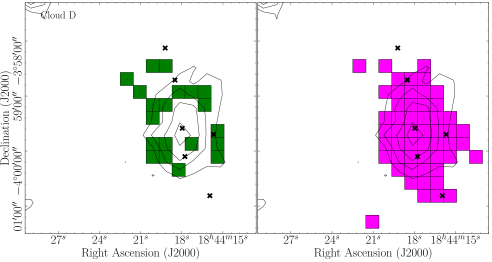
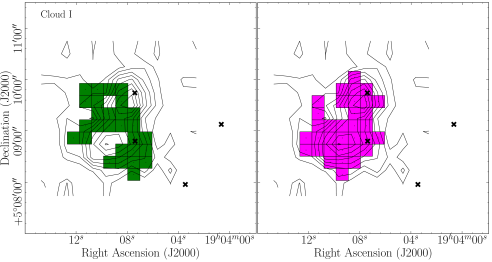
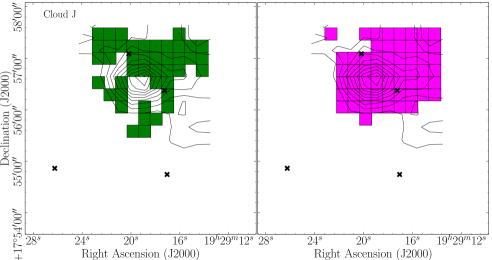
In Figures 4 and 5, we show the spatial distribution of the broad (magenta squares in right-hand panels) and narrow (green squares in left-hand panels) SiO line width components toward clouds A, B, D, I and J and compare them with the global SiO morphology (black contours as in Figure 2) across the clouds.
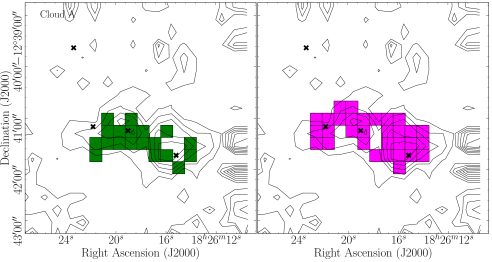
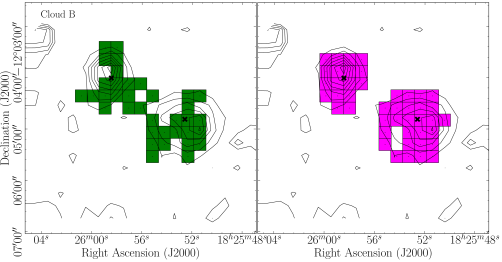
Towards cloud A, the two line width components only coexist in correspondence of the massive core positions. The broad component extends beyond the massive cores (toward the northern region of the cloud), while the narrow component is mainly located below them (toward the southern region of the cloud). The narrow SiO component has mean intensity-weighted line widths of 2 km s-1 and, as seen in Figure 1 (bottom panel in cloud A), positions of isolated narrow SiO emission can be identified.
Toward cloud I, the narrow and broad emission components show mirrored distributions with respect to the core positions. The broad emission is mainly located around the two massive cores J4 and J5 and extends from north-west to south-east while the narrow emission lies in between the two cores and extends from north-east to south-west. Similarly to cloud A, regions of spatially isolated narrow emission can be identified across the cloud (Cloud I, bottom panel in Figure 1), with line widths always in the range 3 to 4 km s-1.
Toward clouds B, D and J, the two line width components are always coexistent and the narrow emission does not appear spatially isolated from the broad component. We note that the small percentage of narrow component found in cloud D, and to some extent also in cloud J, is distributed as a shell around the broad emission.
We note that we are confident that the very broad features detected in the line width distributions of the five IRDCs are real because all fitted components show peak intensities 3rms and integrated areas 3 the integrated rms, as imposed by SCOUSE.
5.2.3 The SiO velocity distributions
We complete the study of the SiO line profile across the five clouds by investigating the SiO centroid velocity distributions for the narrow and broad line width components, separately. Figure 6 shows the centroid velocity distributions obtained for the narrow (grey filled histograms) and broad (black empty histograms) SiO emission for cloud A, B, D, I and J. For all the histograms, the bin size in the x-axis is 0.5 km s-1 (see Sec. 4). In the y-axis we plot the percentage of emission lines having centroid velocity falling within the bin and normalised to the total number of narrow (broad) emission lines. The two velocity distributions have been superimposed to directly compare their kinematics. In all panels, the central velocity of the corresponding cloud, obtained from 13CO observations, is indicated (vertical dashed lines; Rathborne et al. 2006).
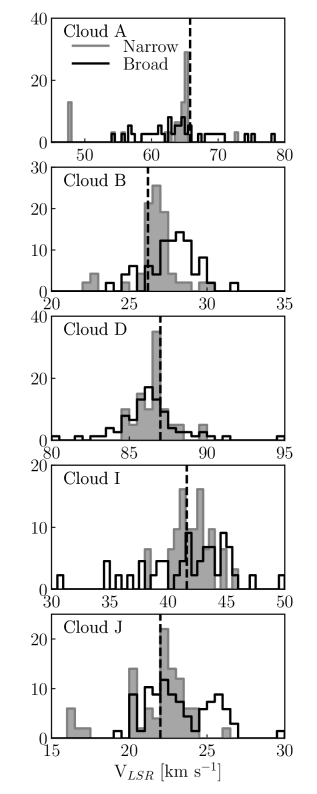
The velocity distributions obtained for clouds B and J show a narrow line width component seen as a bright structure at the central velocity of the corresponding cloud, and a blue and/or red-shifted broad emission component. Toward cloud B, the broad emission is shifted by 3 km s-1 with respect to the central velocity of the cloud. Toward cloud J, the broad emission shows two defined velocity structures, one following the velocity distribution of the narrow emission and one red-shifted by 4 km s-1. Toward cloud D, both the narrow and broad emission components show a symmetric spread in velocity of 20 km s-1. Toward clouds A and I, the narrow emission is seen as a well defined structure with velocity dispersion of 2 to 3 km s-1. The broad emission, however, does not show prominent structures and is spread across a velocity range of 10 km s-1. Toward cloud I, the broad emission seems to be slightly concentrated at red-shifted velocities although not so prominently as observed toward clouds B, D and J. Finally, the narrow emission observed toward cloud I shows two emission peaks in the velocity distribution i.e. a first peak mainly associated with the central velocity of the cloud and a second peak, red-shifted by 1 to 2 km s-1.
In Figure 1, we have shown SiO spectra extracted across clouds A, B , D, I and J toward several positions, associated with both active and quiescent regions. Toward cloud A, we have selected positions A1, A2 and [(J2000) = 18h26m17.7s (J2000) = 12∘41′31.3′′]. Toward this latter position, an isolated narrow component is clearly identified. Toward cloud B, broad SiO emission is seen toward the two core positions, B1 and B2, while no significant emission is detected toward the more quiescent region [(J2000) = 18h25m57s (J2000) = 12∘04′41′′]. Toward cloud I, we have selected the positions of the massive cores I1 and I2 and the position [(J2000) = 19h04m10.6s (J2000) = 5∘09′15′′]. Toward the latter position, the narrow SiO emission is isolated from the broad component, similarly to what is observed toward cloud A. However, it shows mean intensity-weighted line width of 3 km s-1, slightly larger than those measured in cloud A and almost a factor of two broader than those observed in cloud G (1.6 km s-1; Cosentino et al. 2018). Toward clouds D and J, due to the compact structure of the emission we have selected a single position for each cloud corresponding to the SiO emission peak i.e. [(J2000) = 18h44m17.5s (J2000) = 3∘59′36′′] toward cloud D and [(J2000) = 19h29m19s (J2000) = 17∘56′36′′] toward cloud J. Both positions show very broad line profiles with line widths 10 km s-1.
5.3 SiO Column Density
By considering the spectra extracted across the clouds and shown in Figure 1, we use the software MADCUBA (Rivilla
et al. 2016, Martín et al. 2019) to estimate the SiO total column density values for the narrow and broad components toward the selected positions.
We assume excitation temperature Tex of 10 K for the narrow component, consistent with values estimated toward cloud H from multi-line SiO analysis for the narrow component of SiO (Jiménez-Serra
et al. 2010) and from other tracers in several works (Henshaw et al. 2014, Jiménez-Serra
et al. 2014) and Tex of 50 K for the broad component as estimated for shocked gas in molecular outflows (Jiménez-Serra
et al. 2005). We also note that the excitation temperature value assumed for the narrow emission component is consistent with those obtained in Cosentino
et al. (2018) from the narrow CH3OH emission detected toward cloud G. Note that CH3OH is also a good tracer of gas recently processed by shocks (Jiménez-Serra
et al. 2005).
In Table 3, we report the N(SiO) for the broad and narrow emission, along with their ratios, toward all the selected positions across the clouds. For the narrow emission, we find N(SiO) in the range 31011 to 1.11012 cm-2 for clouds A and B; from 5.71012 cm-2 to 8.71012 cm-2 in cloud D and J; 1 to 21012 cm-2 in cloud I. For the broad component we find N(SiO) 51012 cm-2 toward the active regions of cloud A and we measure an upper limit of 21011 cm-2 toward the more quiescent region. Toward the massive cores in clouds B, D and J, the broad emission component shows N(SiO) in the range 1.41013-1.31014 cm-2. Toward cloud I, the broad emission presents N(SiO) in the range 5-81012 cm-2 toward the massive cores I1 and I2 and an upper limit of 21011 cm-2 toward the more quiescent region. Finally, considering the estimated rms in the spectra of 9 mK (see Table 1) in cloud E and line widths of 2 km s-1 and 10 km s-1, we estimate upper limits of N(SiO) 41010 cm-2 and N(SiO)1011 cm-2 for the narrow and broad emission respectively. The ratio of the total SiO column densities between the narrow and broad components is 0.4 toward active regions. Toward the quiescent regions of clouds A and I, the SiO total column density of the narrow emission component is enhanced by a factor 2 to 5 with respect to that of the broad emission.
The uncertainty on the SiO total column density values provided by MADCUBA is 10%, as inferred by the SLIM fitting tool within MADCUBA. In addition, the assumptions made for our analysis may introduce additional sources of uncertainty in the Ntot estimates. For instance, already a factor of 2 increase in Tex will increase N(SiO) by a factor of 2. This is comparable to the enhancement between the narrow and broad component observed toward the quiescent regions of clouds A and I and above those observed in the other clouds. Hence, although our analysis suggests an enhancement of the narrow component toward more quiescent regions of the clouds, it is difficult to infer, from a single-transition analysis, the significance of such an enhancement. Hence a multi-transition analysis would need to be performed to better trace the excitation state of the shocked gas and thus obtain the SiO abundance (as done in Jiménez-Serra et al. 2010).
| Cloud | Position | N(SiO)1012 cm-2 | Nnarrow/Nbroad | |
| Narrow | Broad | |||
| A | A1 | 1.0 | 5.0 | 0.2 |
| A2 | 0.3 | 5.0 | 0.06 | |
| 18h26m17.7s 12∘41′31.3′′ | 0.4 | 0.2 | 2 | |
| B | B1 | 1.1 | 14.0 | 0.08 |
| B2 | 0.9 | 130 | 0.01 | |
| 18h25m57s 12∘04′41′′ | 0.007 | 0.2 | - | |
| D | 18h44m17.5s 3∘59′36′′ | 5.7 | 18 | 0.32 |
| E | 0.04 | 0.1 | - | |
| I | I1 | 1.7 | 5.1 | 0.33 |
| I2 | 2.0 | 6.3 | 0.32 | |
| 19h04m10.6s 5∘09′15′′ | 1.0 | 0.2 | 5 | |
| J | 19h29m19s 17∘56′36′′ | 8.7 | 27.0 | 0.32 |
6 Discussion
The importance of cloud formation mechanisms and large-scale dynamics in the ignition of massive star formation in IRDCs can be tested, from an observational point of view, by analysing the kinematics and the spatial distribution of molecular emission across these sources (Jiménez-Serra
et al. 2010, Nguyen-Lu’o’ng
et al. 2013, Jiménez-Serra
et al. 2014, Duarte-Cabral
et al. 2014, Bisbas
et al. 2018). In cloud-cloud collisions the encounter of two pre-existing clouds and/or molecular filaments generates a shock that is predicted to be extended over a parsec-scales and to show velocities comparable to those observed in shear motions (10 km s-1; Li et al. 2018). The collision of such clouds or filaments can be induced either by the dynamics of the clouds orbiting the galactic plane (Tan 2000, Tasker &
Tan 2009, Henshaw
et al. 2013, Inoue &
Fukui 2013, Jiménez-Serra
et al. 2014, Wu
et al. 2015, Colling et al. 2018) or triggered by external stellar feedback that sweeps up the interstellar medium material (Inutsuka et al. 2015, Fukui
et al. 2018, 2019, Cosentino
et al. 2019). In both cases, signatures of such cloud-cloud collisions are imprinted in the kinematics of molecular tracers. Hence, by investigating the molecular gas content and its physical conditions, we can trace back the formation and processing history of the cloud. This is more challenging in sources with advanced levels of star formation activity because the cloud’s pristine environment and hence the gas kinematics have already been affected.
In the following, we will discuss the likelihood for clouds A, B, D, I and J to have experienced a cloud-cloud collision event, based on the measured properties of the narrow and broad components observed for SiO, toward these clouds. We note that the order in which the clouds are discussed does not imply any evolutionary trend. Indeed, only for cloud H an age estimate has been given on the base of deuteration levels estimates across the cloud (3 Myrs; Barnes
et al. 2018). Kong et al. (2017) investigated the presence of several deuterated species (especially N2D+) toward the massive cores within the clouds A, B, C, D, E, F and H. However, the N2D+ emission at a cloud spatial scale is currently not available and there is no evidence of a correspondence between the youth of a core and the youth of the hosting cloud. Hence, from such a study is very difficult to infer the relative evolutionary stage between the ten clouds in the sample.
By using the timescale for SiO depletion, we estimate a lower limit for the age of these clouds that is of the order of 105 years, i.e. the typical outflow lifetime. However, as mentioned above, the lifetime of these clouds are likely to be of the order of few Myrs when inferred from chemical clocks, such as the N2D+/N2H+ ratio. Due to the lack of any large scale N2D+ observations, it is currently not possible to establish the evolutionary stage of the clouds.
Among the clouds showing isolated narrow SiO emission, we speculate that cloud G (Cosentino
et al. 2018, 2019) is likely at the earliest evolutionary stage since no star formation activity is found toward this cloud. Following this argument, cloud A and I may be at an intermediate stage because they show both narrow and broad SiO emission, while clouds B, C, D, F and J are at a more evolved phase in their evolution due to the presence of only broad SiO emission and/or strong IR signatures of star formation activity toward the massive cores. However, this needs to be further investigated by studying the large scale emission from deuterated species.
6.1 The SiO emission in Cloud B, D and J
Toward the IRDCs B, D and J, the SiO narrow and broad emission components coexist everywhere. In all the three sources, the SiO emission shows compact morphology, spatially associated with massive cores previously identified within the clouds (Rathborne et al. 2006, Butler &
Tan 2009, 2012). The broad components present blue and red-shifted structures in their velocity distribution (see Figure 6) and their kinematics show the same trend in their velocity distribution as for the narrow emission components. Most of the massive cores within the clouds show features of ongoing stellar activity (Chambers et al. 2009). The cores B1 and B2 in cloud B and J1 in cloud J are associated with point sources at 24 m and/or slightly extended emission at 4.5 m (indicating the presence of H2 shock-excited gas), indicating that star formation has already been ignited and that the sources are likely driving molecular outflows (Noriega-Crespo
et al. 2004, Marston
et al. 2004). Furthermore, the cores show emission at 70m, 333https://irsa.ipac.caltech.edu/applications/Herschel/ further supporting the idea of deeply embedded protostars within the massive cores (Barnes et al. in prep). We also note that the typical spatial scales of the observed SiO emission toward clouds B and J are consistent with those expected even in massive molecular outflows (i.e sub-parsec scales Beuther et al. 2002).
Toward cloud D, the massive cores are likely hosting deeply embedded protostars, as indicated by the presence of 70 m and/or 24 m, 8 m point-like emission and "green fuzzy" emission at 4.5 m (Chambers et al. 2009). Hence, the SiO emission observed toward cloud D is likely to be associated with molecular outflows driven by protostars embedded in the active cores within the cloud.
The SiO emission peak in cloud D coincides with the dust emission peak observed at 1.2 mm by Rathborne et al. (2006) and the narrow emission component (see Figure 4) is distributed as a shell around the blob-like morphology of the broad component. In Figure 7, we show the SiO line profile obtained by averaging the emission in the positions where the narrow emission is detected (green squares in Figure 4).
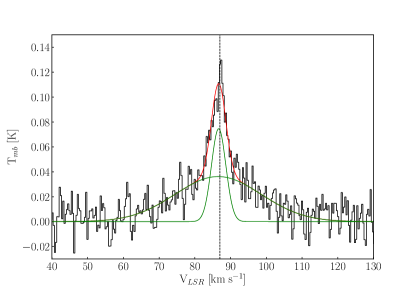
We suggest that such a shell of narrow SiO emission may be arising from the post-shocked material decelerated by the interaction between the outflows and local dense clumps. This is similar to what was suggested by Lefloch et al. (1998) as a possible origin for the narrow and bright SiO emission observed toward the molecular cloud NGC 1333. Assuming a typical molecular outflow lifetime of 105 years (Fukui et al. 1993) and terminal velocity of 10 km s-1, and given the mechanical luminosity derived from the SiO emission of 710-3 L (L=2.61031 ergs s-1), the mass required to decelerate the putative outflow toward cloud D is 0.08 M. From Figure 2, the typical mass surface density at the cloud outskirts is 0.1 g cm-2, corresponding to a mass of 2.2102 M when the same area of the outflow is considered. Hence, assuming that 100% of the outflow kinetic energy is transferred to the cloud, the low density material at the cloud edges is enough to decelerate the outflow. We note that, it is likely that only a small fraction of the outflow kinetic energy ( 20%; Arce &
Sargent 2006) will be transferred to the cloud, further supporting the proposed scenario. The narrow SiO emission toward cloud D shows centroid velocity similar to that of the ambient gas, further supporting this scenario. We note that the assumed outflow lifetime is consistent with the SiO depletion time for typical IRDC density (104 cm-3; Martin-Pintado et al. 1992).
Alternatively, SiO may be tracing the very first interaction between the MHD shocks associated with the putative molecular outflows and the surrounding clumpy material, similarly to what already proposed by Jiménez-Serra
et al. (2004) to explain the presence of narrow SiO ambient emission associated with the molecular outflows in L1448.
The angular resolution achieved in our observations (30′′, corresponding to spatial scales of 0.3-0.9 pc at distances between 2 and 6 kpc) does not allow to spatially resolve multiple outflows from which the SiO emission toward cloud D may be arising. However, the cores B1, B2, D6 and D8 are part of the massive core sample investigated by Liu et al. in a forthcoming publication (Liu et al. in prep). The high-angular resolution images of the SiO(5-4) emission obtained by ALMA and investigated by these authors show the presence of compact and broad SiO(5-4) emission. This supports the idea that the cores are hosting embedded protostars driving molecular outflows.
We conclude that the SiO emission in clouds B, D and J is associated to ongoing star formation activity toward the three clouds, with the narrow and broad SiO emission tracing gas already processed by the MHD shock waves associated with molecular outflows (Martin-Pintado et al. 1992, Codella &
Bachiller 1999, Jiménez-Serra
et al. 2005).
6.2 The non-detection in Cloud E
As presented in Section 5, no SiO emission above the 3 (=0.1 K km s-1) detection level is found toward cloud E. Consistently with our results, Sanhueza et al. (2012) also report no SiO(2-1) emission toward the three massive clumps associated with the massive cores E1, E2 and E3.
The massive cores E1 and E2 do not show neither emission at 70 m, 24 m and 8 m or green fuzzy emission at 4.5 m (Chambers et al. 2009). Toward these two positions across cloud E, Liu et al. in prep. report no SiO(5-4) emission associated with E2 and a 2 SiO(5-4) detection toward E1. The hint of emission detected toward E1 is extremely compact (1′′) and that may explain why it may have not been visible in our single-dish observations, due to a beam-dilution problem.
The massive core E3 is spatially coincident with a point-like source seen at 70 m, 24 m, 8 m and 4.5 m emission (Chambers et al. 2009), indicating that the source is likely hosting a deeply embedded protostar. The lack of SiO emission toward this core may be due either to beam dilution (30′′in this work and 38′′in Sanhueza et al. 2012) or to the fact that the source is in a stage evolved enough to not be driving molecular outflows.
Toward cloud E, no spatially widespread SiO emission is detected. This suggests two possible scenarios for the formation of the IRDC. The cloud may not be the result of a large scale shock interaction and hence alternative scenarios need to be considered as e.g., the gravitational collapse scenario (Heitsch et al. 2009, Vázquez-Semadeni et al. 2019). As a second possibility, the cloud may be the result of large scale shock interactions that may have occurred sometime in the past, so that their lifetime clearly exceeds the typical SiO freeze-out time but it is within the dynamical time scales required for the massive cores to become active. For the massive cores in cloud E, Butler &
Tan (2012) report a volume-averaged H2 number density n(H2) 3105 cm-3. For such a value of n(H2), the SiO freeze-out time is estimated to be 104 years (Martin-Pintado et al. 1992), while the free-fall time for the massive cores to collapse is estimated to be 3105 years. The results obtained toward cloud G in Cosentino
et al. (2019), seem to support this scenario. Toward the IRDC G, indeed, we do not detect massive cores or evidence of ongoing stellar activity toward the region of the shock, suggesting that the formation of massive cores might be a consequence (and therefore subsequent) to the shock interaction.
Finally, a third scenario suggests that the putative large-scale shock interaction may be recent enough but the cloud may not be dense enough to probe the shock in SiO(2-1) (critical density 1.3105 cm-3). However, the mass estimated by Kainulainen &
Tan (2013) for cloud E (2.9104 M⊙) is a factor of 2 higher than the mass the authors estimated for cloud H (1.7104 M⊙) and almost a factor of 10 higher than that estimated for cloud G (3103 M⊙). Moreover, Jiménez-Serra
et al. (2010) estimated the SiO total column density toward cloud H to be in the range 51010 to 41011 cm-3. This is comparable to the N(SiO) upper limit derived for cloud E and listed in Table 3. Hence, we suggest that due to the physical conditions of cloud E, any recent large-scale shock interaction should have been detected by its SiO emission.
6.3 The case of cloud A and I
The SiO emission detected toward clouds A and I shows a morphology and a kinematic structure different from the other sources of our sample. In fact, toward both clouds, the shock tracer morphology is extended across the whole cloud main filaments. This is opposite to what was found toward clouds B, D and J, where the SiO emission shows compact morphology around sites of ongoing star formation activity. In addition, although the SiO emission peaks are coincident with the position of the massive cores within clouds A and I, the narrow shock tracer emission is found to be partially detached both in morphology and kinematics from the broad component. This is opposite to what was observed toward the clouds of the sample with higher levels of star formation activity. In the following, we discuss possible mechanisms that could explain the observed broad and narrow SiO emission toward clouds A and I.
6.3.1 The Origin of the SiO Emission toward Cloud A
The massive cores A1 and A2 do not show evidence of associated point sources at 70 m, 24 m, 8 m nor extended emission at 4.5 m (Chambers et al. 2009). This suggests that the cores are too young to be associated with IR signatures of star formation. However, the presence of broad SiO emission detected toward the core positions suggests that the core may be driving molecular outflows. This is supported by the fact that the mean intensity-weighted line widths and velocity distributions measured toward cloud A for the broad SiO emission component are comparable to those estimated for cloud B, D and J, where star formation is ongoing. In addition to the two massive cores, we also note the presence of bright compact features seen as a saturated hole in the mass surface density map of cloud A (Kainulainen &
Tan 2013), toward the position (J2000) = 18h26m17s (J2000)= 12∘41′22′′. This structure corresponds to a very bright point-like IR source, not explicitly reported by Rathborne et al. (2006) but that may be associated with cloud A. Further investigations are needed to address the link between the cloud and such a source.
All this points toward the idea that the SiO broad emission toward cloud A may be due to stellar feedback, probably driven by the massive cores A1 and/or A2 or the source at (J2000) =18h26m17s (J2000) = 12∘41′22′′.
As shown in Figures 2, the shock tracer emission toward cloud A is very widespread, covering a spatial scale of 4.22.2 parsec2, comparable to that observed toward cloud G in Cosentino
et al. (2018) and cloud H in Jiménez-Serra
et al. (2010) and more extended than the typical spatial scales observed in massive molecular outflows (Beuther et al. 2002). For comparison, the spatial extent of the largest compact structure toward cloud B is 0.30.7 parsec2, more than a factor of two smaller than the SiO emission toward cloud A. We note that cloud A (d4.8 kpc) is located further than cloud B (d2.4 kpc) and hence the smaller SiO extent observed in cloud B is not due to distance effects.
Toward cloud A, we report the presence of narrow isolated SiO emission, extended in the southern region of the cloud (see Figure 4) and with column densities higher by a factor of 2 with respect to that of the broad emission, in this region. Such a component is similar to the narrow and widespread SiO emission detected in cloud H by Jiménez-Serra
et al. (2010). Furthermore, the mean intensity-weighted line widths of the SiO narrow emission are 2 km s-1, similar to those measured toward cloud G (1.6 km s-1; Cosentino
et al. 2018) and toward cloud H (2 km s-1; Jiménez-Serra
et al. 2010). Finally, as seen in Figure 6, the narrow SiO emission detected toward cloud A shows velocity distribution slightly blue-shifted (1 km s-1) with respect to the central velocity of the cloud. This behaviour is similar to that reported by Cosentino
et al. (2018) in cloud G.
The enhanced narrow SiO emission, widespread across the southern part of the cloud, appears kinematically and spatially independent from the broad SiO emission and may be (to some extent) the result of a large-scale shock interaction. In Figure 8, we inspect the cloud environment at large spatial scales by using Spitzer images at multiple wavelengths. From Figure 8, cloud A (magenta square) is encompassed by an arch-like structure identified as the Galactic Infrared Bubble N24 (white ellipse; Churchwell
et al. 2006, Deharveng
et al. 2010, Simpson
et al. 2012, Kerton et al. 2013, Li et al. 2019).
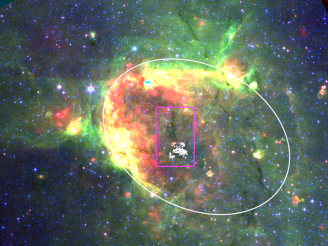
The bubble kinematic distance (4.5 0.2 kpc; Kerton et al. 2013) and central velocity (64.5 0.5 km s-1; Kerton et al. 2013) are comparable to those inferred by Simon et al. (2006a) for cloud A and reported in Table 1. Recently, Li et al. (2019) carried out a detailed multi-wavelength analysis of N24 and identified several clumps across the bubble with evidence of active on-going star formation activity. The authors analyse the kinematic structure of the low-density gas tracer 13CO (from the GRS Survey; Jackson
et al. 2006) and found an extended clump of molecular material spatially coincident with the IRDC A and with central velocity compatible with that of both the bubble and the cloud (e.g see Figure 3 in Li et al. 2019). In addition, the 13CO observations from the GRS survey (Henshaw et al. in prep.) also show the presence of a molecular gas flow approaching the cloud across the same region where narrow isolated SiO emission is found toward cloud A.
The lack of extended 8 m emission across the IRDC (Li et al. 2019) suggests that the cloud is not being heated by the stellar wind and/or strong ultraviolet radiation field associated with the bubble and conclude that the cloud is likely located either in front or behind the bubble. If this is the case, cloud A may be interacting with the shock front layer of the expanding bubble or with the flow of molecular gas observed in 13CO, swept by the expansion of the HII region into the ISM. Such a scenario is similar to what has been reported toward cloud G (Cosentino
et al. 2018, 2019).
Finally, no evidence of point like 8 m sources is found in the region of cloud A where the isolated narrow SiO emission is detected. This indicates that the narrow SiO emission is likely not due to molecular outflows driven by deeply embedded sources. Hence, we support the idea that the collision between the molecular gas associated with the cloud and this additional flow associated with the HII region is (at least partially) responsible for the observed narrow SiO emission toward cloud A.
We shall further investigate this with interferometric observations and a detailed analysis of the IR emission at multiple wavelengths toward the cloud.
6.3.2 The SiO Emission toward Cloud I
Toward the IRDC I, the core I1/MM1 is known to be driving a molecular outflow and it hosts evidence of infall motion (López-Sepulcre et al. 2010). In contrast, the core I2 has been classified as quiescent by Chambers et al. (2009). From this, it is not surprising that the bulk of the broad SiO emission component is found toward the south of cloud I, where I1 is located (see Figure 2). Hence, the broad SiO emission detected toward the IRDC I is likely associated with star formation feedback driven by the core I1.
The narrow SiO emission component detected toward cloud I shows mean intensity-weighted line widths of 3 km s-1, higher that those observed in cloud G, H and A and comparable to those reported toward clouds C, F and J. The line width distributions of the narrow SiO emission does not show very bright peaks and appear to be similar to those observed toward clouds D and J (see Figure 3). However, isolated narrow SiO emission is detected toward regions of the cloud located in between the two massive cores. In addition, as seen in Figure 2, the SiO emission toward cloud I is widespread across an area of 1.31.7 parsec2, more extended than the typical SiO emission observed in molecular outflows. Finally, the column density values measured for the narrow SiO emission toward quiescent regions are enhanced by a factor of 5 with respect to the column densities measured for the broad component. All this seems to indicate that, although on-going star formation activity has already affected the cloud environment, an additional mechanism may be partially responsible for the widespread and enhanced narrow SiO emission observed toward the cloud. Similarly to what reported in the previous Section for cloud A, in Figure 9, we investigate the large-scale environment of cloud I, by using Spitzer images at multiple wavelengths.
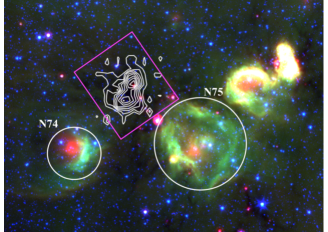
As shown in Figure 9, Cloud I lies in between two known HII regions, G38.91-0.44 (or N74) and G39.30-1.04 (or N75). The three objects show similar central velocity of 40 km s-1 and are located at a similar kinematic distance of 2.9 kpc (Du & Yang 2008). In Xu et al. (2013), evidence of a possible interaction between the cloud and the expanding bubbles of the two HII regions is presented by means of multi-wavelengths observations. The authors suggest that the expansion of the two bubbles associated with the HII regions may have compressed the cloud and triggered the ignition of star formation activity toward I1. The spatial distribution of the narrow SiO emission shown in Figure 5 shows an arch-like structure that coincides with the intersection between the projection of the two bubbles associated with the HII regions and hence seems to support the scenario proposed by Xu et al. (2013). Hence, we suggest that the interaction between the cloud and the two nearby HII regions may be (partially) driving the narrow SiO emission detected toward cloud I. As for cloud A, no evidence of point like sources in the 8 m Spitzer images is found in correspondence of the narrow isolated SiO emission. Hence, narrow SiO is not produced by embedded protostars. We suggest that the narrow isolated SiO emission detected toward cloud I is tracing the shock interaction between molecular flows pushed by the nearby HII regions. Future observations at higher angular resolution coupled with a detailed analysis of the low density gas kinematics will help to further address such a scenario.
7 Are there different types of cloud-cloud collisions?
In Cosentino
et al. (2018), Cosentino
et al. (2019) and in this work, we have reported a detailed study on the kinematics and spatial distribution of SiO emission toward a sample of nine IRDCs. Within the sample (Butler &
Tan 2009, 2012), cloud G shows evidence of an ongoing collision between the cloud and a flow of molecular gas pushed toward the IRDC by the nearby SNR W44. The interaction is observed in the form of a time-dependent MHD CJ-type shock (Cosentino
et al. 2019) and it is seen to be enhancing the gas density by a factor 10. Therefore the shock induces post-shock gas densities compatible with those required for massive star formation. In this work, we have reported the presence of widespread, narrow and isolated SiO emission toward the two IRDCs A and I that may be partially associated with the putative interaction between the clouds and nearby HII regions. In addition, Jiménez-Serra
et al. (2010) also report the presence of narrow and isolated SiO emission toward an additional source within the Butler &
Tan (2009) sample i.e. the IRDC G035.3900.33, or cloud H. The study performed by Jiménez-Serra
et al. (2010) and later works support the idea that cloud H, that is not located in the proximity of Galactic bubbles or SNRs, is indeed the result of a cloud-cloud collision event (Henshaw et al. 2014, Bisbas
et al. 2018, Barnes
et al. 2018).
Besides our sample, evidence of cloud-cloud collisions have been reported toward several sources by means of low density gas tracers (e.g., 13CO emission; Dewangan et al. 2018, Kohno
et al. 2018, Tokuda
et al. 2019, Fujita
et al. 2020), shock tracers (SiO and CCS emission; Nguyen-Lu’o’ng
et al. 2013, Nakamura
et al. 2015, Louvet
et al. 2016) and dense gas tracers emission (e.g., H13CO+; Dhabal et al. 2018). Very recently, signatures of cloud-cloud collisions triggered by external stellar feedback have also been reported by Dhanya et al. (2020) toward the S147/S153 complex.
All these results suggest that, along with cloud-cloud collisions due to the natural motion of molecular clouds across the Galactic plane, i.e. natural cloud-cloud collisions, filament collisions induced by stellar feedback may represent an efficient mechanism for triggering star formation in IRDCs. In these stellar feedback cloud-cloud collisions, stellar feedback sweeps up the surrounding molecular material and pushes it toward pre-existing nearby molecular dense structures i.e., molecular clouds, dense clumps. The collision between the pushed material and the dense structure may initiate star formation. Indeed, recent simulations have shown that even the strong clumpy ejecta from SNs can penetrate to distances up to 1 parsec into molecular clouds (Pan et al. 2012).
The presence of SiO emission associated with collisions induced by mechanical stellar feedback depends on the nature of the stellar feedback itself. Strong events such as SNRs, HII regions and strong stellar winds, carry mechanical energies of the order of 1049 ergs (Tielens 2005). For typical molecular clouds of 103 M⊙, the associated shock velocity is 30 km s-1, enough to sputter dust grains and to inject SiO into the gas phase (Jiménez-Serra
et al. 2008, Nguyen-Lu’o’ng
et al. 2013). We note that these shock velocities have been estimated by assuming that all the mechanical energy from the stellar feedback is transferred to the molecular clouds. It is likely that only part of this mechanical energy is transferred to the cloud. Moreover, in the case of SNRs and HII regions, the shock velocity maybe depends on the velocity of the expanding shell e.g., 10 km s-1 for HII regions (Tielens 2005).
Stellar feedback cloud-cloud collisions show physical structure similar to those expected in natural cloud-cloud collisions but, as suggested by the extent of the shock interaction toward cloud G ( 1 parsec), they may occur at smaller spatial scales i.e. parsec scale vs multiple parsec scale (Tan 2000, Tasker &
Tan 2009, Wu
et al. 2015, Wu et al. 2016). Hence, stellar feedback cloud-cloud collisions may be responsible for igniting star formation within the clouds and for helping to shape their filamentary structures, but it seems unlikely that they concur in the assembly of the IRDC itself and natural cloud-cloud collisions need to be further studied.
8 Conclusions
In this work, we used single-dish IRAM 30m observations to analyse the spatial distribution, kinematic structure and line profiles of the SiO emission across the six IRDCs G018.8200.28, G019.27+00.07, G028.5300.25, G028.67+00.13, G038.9500.47 and G053.11+00.05 (clouds A, B, D, E, I and J respectively) and obtained the following results:
-
i)
Of the six clouds, we only detect significant SiO emission toward clouds A, B, D, I and J. In cloud E, the shock tracer emission is below the 3 detection level toward the whole extent of the area covered in our observations.
-
ii)
Toward clouds B, D and J, the SiO emission is spatially organised in blob-like structures whose positions are coincident with those of active massive cores previously identified within the clouds. On the contrary, the SiO emission toward clouds A and I shows a widespread morphology, extended over a parsec-scale and following the filamentary structure of the clouds as seen in extinction.
-
iii)
Across the five clouds, the SiO emission shows both a narrow ( 5 km s-1) and a broad line width components each accounting for 50% of the total emission lines in clouds A, B, I and J and for nearly 80% of broad emission lines in cloud D. Toward clouds B, D, and J the broad and narrow components are coexistent and are both spatially associated with the massive cores within the clouds. This indicates a common origin of the two line width components that are likely probing gas affected by the MHD shocks associated with ongoing star formation activity.
-
iv)
Toward clouds A and I, isolated narrow SiO emission is found toward the more quiescent regions across the IRDCs. The narrow and broad line width components show very different central velocity distributions and do not present prominent wing-like structures.
-
v)
Cloud A and cloud I are found to be spatially coincident and at similar kinematic distances of the Galactic bubble N24 and the HII regions N74 and N74, respectively. Due to the spatial morphology of the narrow emission component and to its kinematic structure, we speculate that the SiO emission toward clouds A and I may be tracing the ongoing interaction between the clouds and the flows of molecular gas pushed away by the expanding bubbles. This is supported by the velocity and spatial distributions of the narrow component.
-
vi)
Alternatively, the presence of low-mass star populations, undetected in Spitzer images at multiple wavelengths, and associated with the clouds may be responsible for the narrow SiO emission across clouds A and I. Finally, projection effects may be responsible for the observed narrow SiO line profiles.
Acknowledgements
GC acknowledges support from a Chalmers Cosmic Origins postdoctoral fellowship. JCT acknowledges support from ERC project 788829 - MSTAR. ATB would like to acknowledge the funding provided from the European Union’s Horizon 2020 research and innovation programme (grant agreement No 726384). IJ-S has received partial support from the Spanish FEDER (project number ESP2017-86582-C4-1-R).
Data Availability
The data underlying this article will be shared on reasonable request to the corresponding author.
References
- Arce & Sargent (2006) Arce H. G., Sargent A. I., 2006, ApJ, 646, 1070
- Barnes et al. (2018) Barnes A. T., Henshaw J. D., Caselli P., Jiménez-Serra I., Tan J. C., Fontani F., Pon A., Ragan S., 2018, MNRAS, 475, 5268
- Battersby et al. (2010) Battersby C., Bally J., Jackson J. M., Ginsburg A., Shirley Y. L., Schlingman W., Glenn J., 2010, ApJ, 721, 222
- Benjamin et al. (2003) Benjamin R. A., et al., 2003, rm The Publications of the Astronomical Society of the Pacific , 115, 953
- Beuther et al. (2002) Beuther H., Schilke P., Menten K. M., Walmsley C. M., Sridharan T. K., Wyrowski F., 2002, in Crowther P., ed., Astronomical Society of the Pacific Conference Series Vol. 267, Hot Star Workshop III: The Earliest Phases of Massive Star Birth. p. 341 (arXiv:astro-ph/0112508)
- Bisbas et al. (2017) Bisbas T. G., Tanaka K. E. I., Tan J. C., Wu B., Nakamura F., 2017, ApJ, 850, 23
- Bisbas et al. (2018) Bisbas T. G., et al., 2018, MNRAS, 478, L54
- Butler & Tan (2009) Butler M. J., Tan J. C., 2009, ApJ, 696, 484
- Butler & Tan (2012) Butler M. J., Tan J. C., 2012, ApJ, 754, 5
- Carey et al. (2000) Carey S. J., Feldman P. A., Redman R. O., Egan M. P., MacLeod J. M., Price S. D., 2000, ApJL, 543, L157
- Carey et al. (2009) Carey S. J., et al., 2009, rm The Publications of the Astronomical Society of the Pacific , 121, 76
- Ceverino & Klypin (2009) Ceverino D., Klypin A., 2009, ApJ, 695, 292
- Chambers et al. (2009) Chambers E. T., Jackson J. M., Rathborne J. M., Simon R., 2009, ApJS, 181, 360
- Churchwell et al. (2006) Churchwell E., et al., 2006, ApJ, 649, 759
- Churchwell et al. (2009) Churchwell E., et al., 2009, rm The Publications of the Astronomical Society of the Pacific , 121, 213
- Codella & Bachiller (1999) Codella C., Bachiller R., 1999, A&A, 350, 659
- Colling et al. (2018) Colling C., Hennebelle P., Geen S., Iffrig O., Bournaud F., 2018, A&A, 620, A21
- Commerçon et al. (2011) Commerçon B., Hennebelle P., Henning T., 2011, ApJL, 742, L9
- Cosentino et al. (2018) Cosentino G., et al., 2018, MNRAS, 474, 3760
- Cosentino et al. (2019) Cosentino G., et al., 2019, ApJL, 881, L42
- Deharveng et al. (2010) Deharveng L., et al., 2010, A&A, 523, A6
- Dewangan et al. (2018) Dewangan L. K., Ojha D. K., Zinchenko I., Baug T., 2018, ApJ, 861, 19
- Dhabal et al. (2018) Dhabal A., Mundy L. G., Rizzo M. J., Storm S., Teuben P., 2018, ApJ, 853, 169
- Dhanya et al. (2020) Dhanya J. S., Dewangan L. K., Ojha D. K., Mandal S., 2020, rm The Publications of the Astronomical Society of Japan ,
- Du & Yang (2008) Du F., Yang J., 2008, ApJ, 686, 384
- Duarte-Cabral et al. (2014) Duarte-Cabral A., Bontemps S., Motte F., Gusdorf A., Csengeri T., Schneider N., Louvet F., 2014, A&A, 570, A1
- Egan et al. (1998) Egan M. P., Shipman R. F., Price S. D., Carey S. J., Clark F. O., Cohen M., 1998, ApJL, 494, L199
- Fontani et al. (2018) Fontani F., Commerçon B., Giannetti A., Beltrán M. T., Sánchez-Monge Á., Testi L., Brand J., Tan J. C., 2018, A&A, 615, A94
- Foster et al. (2014) Foster J. B., et al., 2014, ApJ, 791, 108
- Fujita et al. (2020) Fujita S., et al., 2020, rm The Publications of the Astronomical Society of Japan ,
- Fukui et al. (1993) Fukui Y., Iwata T., Mizuno A., Bally J., Lane A. P., 1993, in Levy E. H., Lunine J. I., eds, Protostars and Planets III. p. 603
- Fukui et al. (2018) Fukui Y., et al., 2018, rm The Publications of the Astronomical Society of Japan , 70, S46
- Fukui et al. (2019) Fukui Y., et al., 2019, ApJ, 886, 14
- Heitsch et al. (2009) Heitsch F., Ballesteros-Paredes J., Hartmann L., 2009, ApJ, 704, 1735
- Hennebelle et al. (2008) Hennebelle P., Banerjee R., Vázquez-Semadeni E., Klessen R. S., Audit E., 2008, A&A, 486, L43
- Henshaw et al. (2013) Henshaw J. D., Caselli P., Fontani F., Jiménez-Serra I., Tan J. C., Hernandez A. K., 2013, MNRAS, 428, 3425
- Henshaw et al. (2014) Henshaw J. D., Caselli P., Fontani F., Jiménez-Serra I., Tan J. C., 2014, MNRAS, 440, 2860
- Henshaw et al. (2016) Henshaw J. D., et al., 2016, MNRAS, 457, 2675
- Inoue & Fukui (2013) Inoue T., Fukui Y., 2013, ApJL, 774, L31
- Inutsuka et al. (2015) Inutsuka S.-i., Inoue T., Iwasaki K., Hosokawa T., 2015, A&A, 580, A49
- Jackson et al. (2006) Jackson J. M., et al., 2006, ApJS, 163, 145
- Jiménez-Serra et al. (2004) Jiménez-Serra I., Martín-Pintado J., Rodríguez-Franco A., Marcelino N., 2004, ApJL, 603, L49
- Jiménez-Serra et al. (2005) Jiménez-Serra I., Martín-Pintado J., Rodríguez-Franco A., Martín S., 2005, ApJL, 627, L121
- Jiménez-Serra et al. (2008) Jiménez-Serra I., Caselli P., Martín-Pintado J., Hartquist T. W., 2008, A&A, 482, 549
- Jiménez-Serra et al. (2009) Jiménez-Serra I., Martín-Pintado J., Caselli P., Viti S., Rodríguez-Franco A., 2009, ApJ, 695, 149
- Jiménez-Serra et al. (2010) Jiménez-Serra I., Caselli P., Tan J. C., Hernandez A. K., Fontani F., Butler M. J., van Loo S., 2010, MNRAS, 406, 187
- Jiménez-Serra et al. (2011) Jiménez-Serra I., Martín-Pintado J., Winters J. M., Rodríguez-Franco A., Caselli P., 2011, ApJ, 739, 80
- Jiménez-Serra et al. (2014) Jiménez-Serra I., Caselli P., Fontani F., Tan J. C., Henshaw J. D., Kainulainen J., Hernandez A. K., 2014, MNRAS, 439, 1996
- Juvela et al. (2018) Juvela M., et al., 2018, A&A, 620, A26
- Kainulainen & Tan (2013) Kainulainen J., Tan J. C., 2013, A&A, 549, A53
- Kerton et al. (2013) Kerton C. R., Arvidsson K., Alexander M. J., 2013, AJ, 145, 78
- Klessen & Glover (2016) Klessen R. S., Glover S. C. O., 2016, Saas-Fee Advanced Course, 43, 85
- Kohno et al. (2018) Kohno M., et al., 2018, rm The Publications of the Astronomical Society of Japan , 70, S50
- Kong et al. (2017) Kong S., Tan J. C., Caselli P., Fontani F., Liu M., Butler M. J., 2017, ApJ, 834, 193
- Körtgen & Banerjee (2015) Körtgen B., Banerjee R., 2015, MNRAS, 451, 3340
- Körtgen et al. (2016) Körtgen B., Seifried D., Banerjee R., Vázquez-Semadeni E., Zamora-Avilés M., 2016, MNRAS, 459, 3460
- Kruijssen et al. (2019) Kruijssen J. M. D., et al., 2019, rm Nature , 569, 519
- Lefloch et al. (1998) Lefloch B., Castets A., Cernicharo J., Loinard L., 1998, ApJL, 504, L109
- Leroy et al. (2008) Leroy A. K., Walter F., Brinks E., Bigiel F., de Blok W. J. G., Madore B., Thornley M. D., 2008, AJ, 136, 2782
- Li et al. (2018) Li Q., Tan J. C., Christie D., Bisbas T. G., Wu B., 2018, rm The Publications of the Astronomical Society of Japan , 70, S56
- Li et al. (2019) Li X., et al., 2019, MNRAS, 487, 1517
- Liu et al. (2018) Liu T., et al., 2018, ApJ, 859, 151
- López-Sepulcre et al. (2010) López-Sepulcre A., Cesaroni R., Walmsley C. M., 2010, A&A, 517, A66
- Louvet et al. (2016) Louvet F., et al., 2016, A&A, 595, A122
- Marston et al. (2004) Marston A. P., et al., 2004, ApJS, 154, 333
- Martin-Pintado et al. (1992) Martin-Pintado J., Bachiller R., Fuente A., 1992, A&A, 254, 315
- Martín et al. (2019) Martín S., Martín-Pintado J., Blanco-Sánchez C., Rivilla V. M., Rodríguez-Franco A., Rico-Villas F., 2019, A&A, 631, A159
- Nakamura et al. (2015) Nakamura F., et al., 2015, Cluster Formation Triggered by Filament Collisions in Serpens South. p. 239
- Nguyen Luong (2012) Nguyen Luong Q., 2012, rm The Publications of the Astronomical Society of the Pacific , 124, 650
- Nguyen-Lu’o’ng et al. (2013) Nguyen-Lu’o’ng Q., et al., 2013, ApJ, 775, 88
- Noriega-Crespo et al. (2004) Noriega-Crespo A., Carey S., Eisloffel J., Latter W., Marleau F., Morris P., Raga A., Stapelfeldt K., 2004, Emission from H2, PAHs, and Warm Dust in Proto-stellar Jets, Spitzer Proposal
- Pan et al. (2012) Pan L., Desch S. J., Scannapieco E., Timmes F. X., 2012, ApJ, 756, 102
- Perault et al. (1996) Perault M., et al., 1996, A&A, 315, L165
- Peretto & Fuller (2010) Peretto N., Fuller G. A., 2010, ApJ, 723, 555
- Pillai et al. (2006) Pillai T., Wyrowski F., Menten K. M., Krügel E., 2006, A&A, 447, 929
- Pillai et al. (2019) Pillai T., Kauffmann J., Zhang Q., Sanhueza P., Leurini S., Wang K., Sridharan T. K., König C., 2019, A&A, 622, A54
- Rathborne et al. (2006) Rathborne J. M., Jackson J. M., Simon R., 2006, ApJ, 641, 389
- Rivilla et al. (2016) Rivilla V. M., Fontani F., Beltrán M. T., Vasyunin A., Caselli P., Martín-Pintado J., Cesaroni R., 2016, ApJ, 826, 161
- Sanhueza et al. (2012) Sanhueza P., Jackson J. M., Foster J. B., Garay G., Silva A., Finn S. C., 2012, ApJ, 756, 60
- Sanhueza et al. (2017) Sanhueza P., Jackson J. M., Zhang Q., Guzmán A. E., Lu X., Stephens I. W., Wang K., Tatematsu K., 2017, ApJ, 841, 97
- Schilke et al. (1997) Schilke P., Walmsley C. M., Pineau des Forets G., Flower D. R., 1997, A&A, 321, 293
- Simon et al. (2006a) Simon R., Jackson J. M., Rathborne J. M., Chambers E. T., 2006a, ApJ, 639, 227
- Simon et al. (2006b) Simon R., Rathborne J. M., Shah R. Y., Jackson J. M., Chambers E. T., 2006b, ApJ, 653, 1325
- Simpson et al. (2012) Simpson R. J., et al., 2012, MNRAS, 424, 2442
- Sokolov et al. (2019) Sokolov V., et al., 2019, ApJ, 872, 30
- Tan (2000) Tan J. C., 2000, ApJ, 536, 173
- Tan et al. (2014) Tan J. C., Beltrán M. T., Caselli P., Fontani F., Fuente A., Krumholz M. R., McKee C. F., Stolte A., 2014, in Beuther H., Klessen R. S., Dullemond C. P., Henning T., eds, Protostars and Planets VI. p. 149 (arXiv:1402.0919), doi:10.2458/azu_uapress_9780816531240-ch007
- Tasker & Tan (2009) Tasker E. J., Tan J. C., 2009, ApJ, 700, 358
- Tielens (2005) Tielens A. G. G. M., 2005, The Physics and Chemistry of the Interstellar Medium. Cambridge University Press
- Tokuda et al. (2019) Tokuda K., et al., 2019, ApJ, 886, 15
- Van Loo et al. (2014) Van Loo S., Keto E., Zhang Q., 2014, ApJ, 789, 37
- Vázquez-Semadeni et al. (2019) Vázquez-Semadeni E., Palau A., Ballesteros-Paredes J., Gómez G. C., Zamora-Avilés M., 2019, MNRAS, 490, 3061
- Wu et al. (2015) Wu B., Van Loo S., Tan J. C., Bruderer S., 2015, ApJ, 811, 56
- Wu et al. (2016) Wu B., Tan J. C., Van Loo S., nakamura f., Bruderer S., 2016, in American Astronomical Society Meeting Abstracts. p. 319.02
- Wu et al. (2017a) Wu B., Tan J. C., Christie D., Nakamura F., Van Loo S., Collins D., 2017a, arXiv:1702.08117,
- Wu et al. (2017b) Wu B., Tan J. C., Nakamura F., Van Loo S., Christie D., Collins D., 2017b, ApJ, 835, 137
- Xu et al. (2013) Xu J.-L., Wang J.-J., Liu X.-L., 2013, A&A, 559, A113
- Yang et al. (2019) Yang Y., Wan M., Matthaeus W. H., Shi Y., Parashar T. N., Lu Q., Chen S., 2019, Physics of Plasmas, 26, 072306