A Comparison of the Pathway Tools Software with the
Reactome Software
Abstract
This document compares SRI’s Pathway Tools (PTools) software with the Reactome software. Both software systems serve the pathway bioinformatics area, including representation and analysis of metabolic pathways and signaling pathways. The comparison covers pathway bioinformatics capabilities, but does not cover other major facets of Pathway Tools that are completely absent from the Reactome software: Pathway Tools genome-informatics capabilities, regulatory informatics capabilities, and table-based analysis tools (SmartTables).
Our overall findings are as follows. (1) PTools is significantly ahead of Reactome in its basic information pages. For example, PTools pathway layout algorithms have been developed to an advanced state over several decades, whereas Reactome pathway layouts are illegible, omit important information, and are created manually and therefore cannot scale to thousands of genomes. (2) PTools is far ahead of Reactome in omics analysis. PTools includes all of the omics-analysis methods that Reactome provides, and includes multiple methods that Reactome lacks. (3) PTools contains a metabolic route search tool (searching for paths through the metabolic network), which Reactome lacks. (4) PTools is significantly ahead of Reactome in inference of metabolic pathways from genome information to create new metabolic databases. (5) PTools has an extensive complement of metabolic-modeling tools whereas Reactome has none. (6) PTools is more scalable than Reactome, handling 18,000 genomes versus 90 genomes for Reactome. (7) PTools has a larger user base than Reactome. PTools powers 17 websites versus two for Reactome. PTools has been licensed by 10,800 users (Reactome licensed user count is unknown).
1 Introduction
This document compares SRI’s Pathway Tools software [3, 4] with the Reactome software [2]. Both software systems serve the pathway bioinformatics area, including representation and analysis of metabolic pathways and signaling pathways. The comparison covers pathway bioinformatics capabilities, but does not cover other major facets of Pathway Tools that are completely absent from the Reactome software: Pathway Tools genome-informatics capabilities, regulatory informatics capabilities, and table-based analysis tools (SmartTables).
Pathway Tools (PTools) powers the BioCyc.org website and 16 other pathway websites [5]. The Reactome software powers Reactome.org and plantreactome.gramene.org.
This comparison is divided into three sections:
-
•
Comparison of pathway pages, reaction pages, and metabolite pages
-
•
Comparison of pathway-informatics analysis tools
-
•
Comparison of metabolic modeling tools
Pathway Tools has been shown to scale to 18,000 genomes (biocyc.org). Reactome has been shown to scale to 90 genomes (reactome.org).
2 Pathway, Reaction, and Metabolite Pages
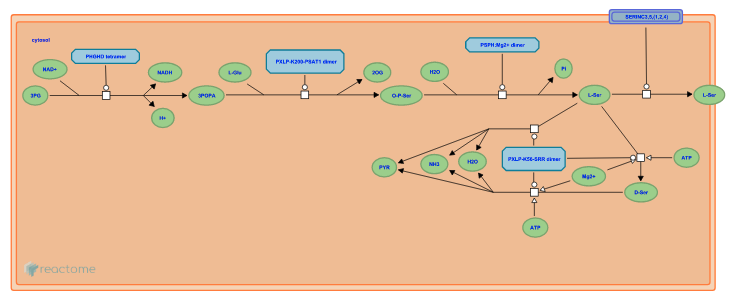
The most basic and essential aspect of a pathway database and website is the ability to legibly depict meaningful pathway diagrams. Reactome fails in this regard: pathway diagrams shown in Reactome pathway pages are not legible (i.e., metabolite names are not readable in these diagrams), even for a small pathway such as serine biosynthesis (see Figure 1 (https://reactome.org/content/detail/R-CFA-977347). Larger pathways are even harder to make out. If the user clicks on the pathway diagram in the preceding Reactome page to display the same diagram within the “pathway browser”, the diagram can then be zoomed to a magnification where the metabolite names are legible. However, the metabolite names shown are abbreviations, many of which will not be meaningful to most users. (Most likely the abbreviations are being used in an effort to make the pathway diagrams smaller.)
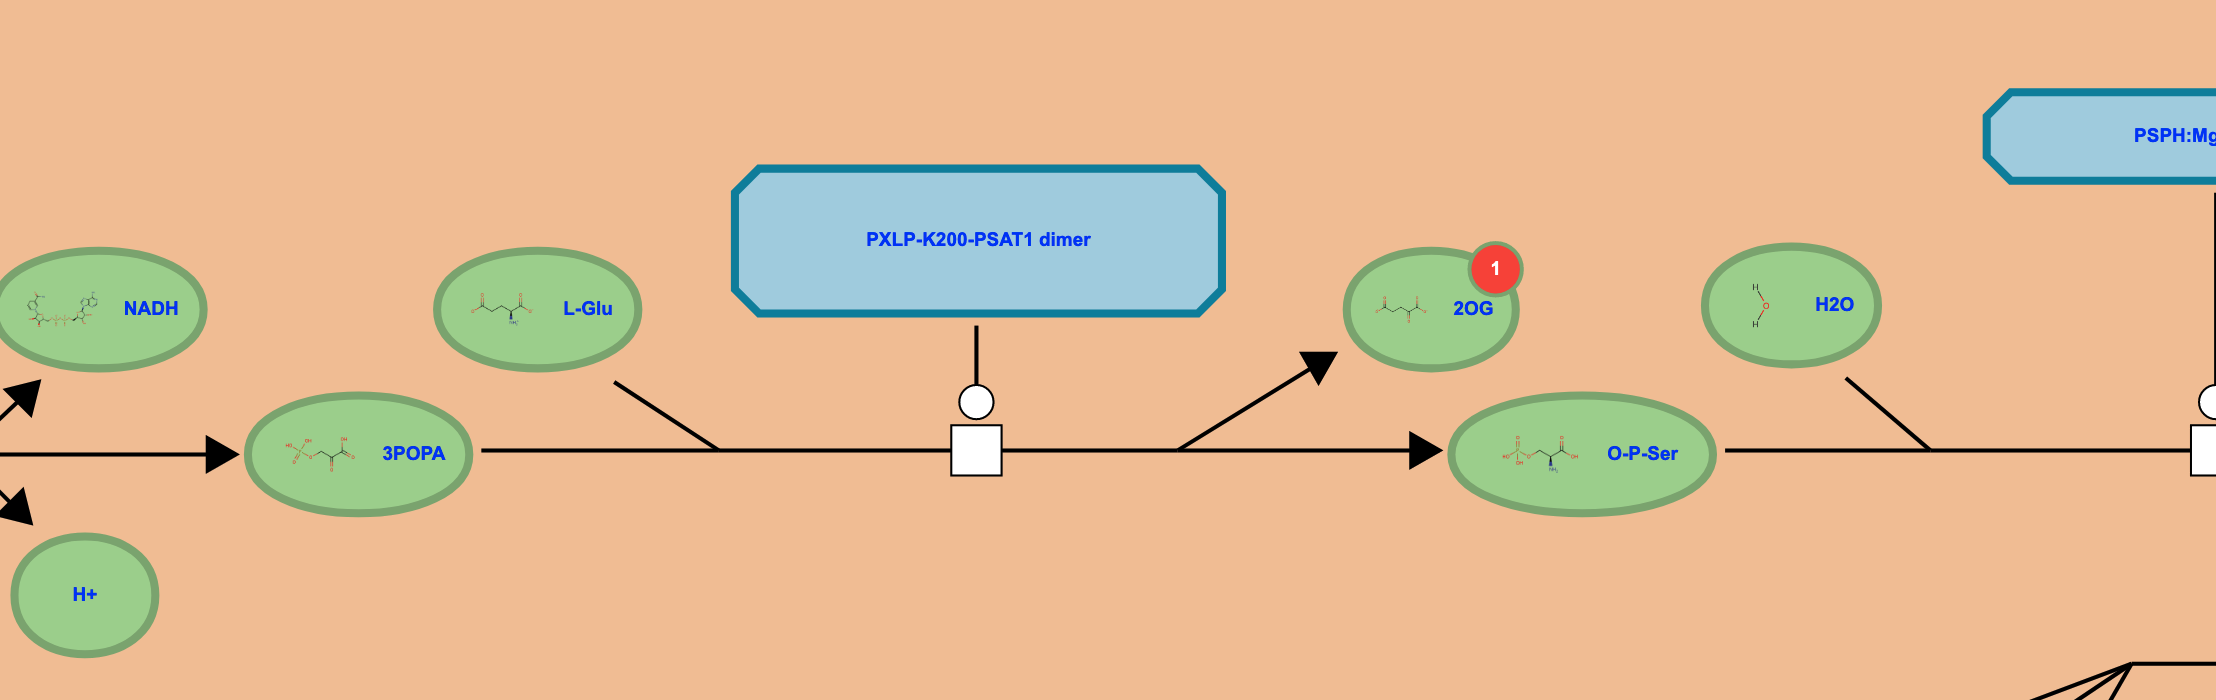
Further, Reactome pathway diagrams lack enzyme names, gene names, and EC numbers — all of which are important facets of communicating the pathway. Magnifying this diagram eventually results in depiction of metabolite chemical structures, although at this point the diagram must be zoomed so much that only one reaction from the pathway is visible, and the chemical structures are barely legible (see Figure 2).
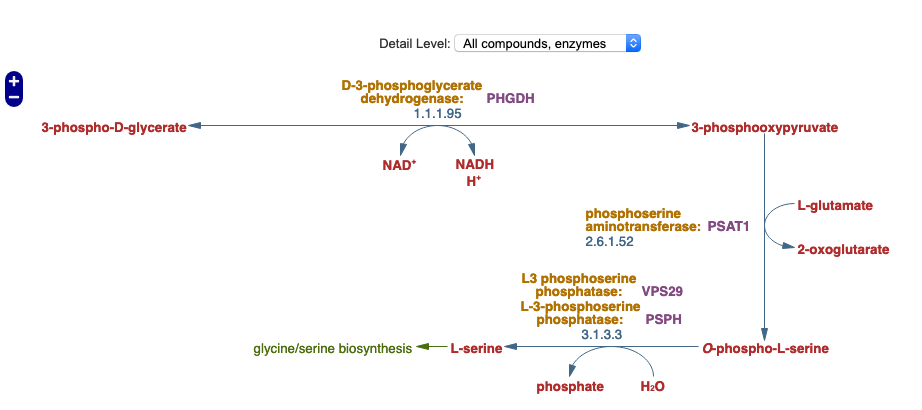
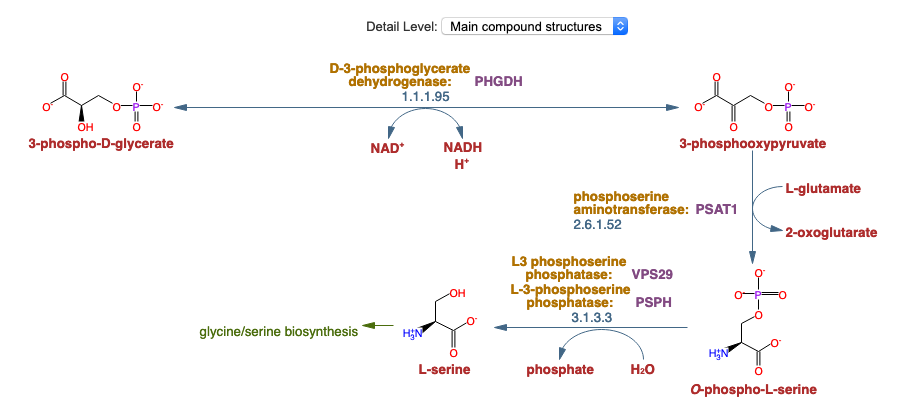
In contrast, the HumanCyc L-serine biosynthesis pathway produced by Pathway Tools (https://biocyc.org/HUMAN/NEW-IMAGE?type=PATHWAY&object=SERSYN-PWY) is easily legible both with and without chemical structures (see Figures 3 and 4), and the PTools diagram can be customized to depict any combination of gene names, enzyme names, EC numbers, and chemical structures.
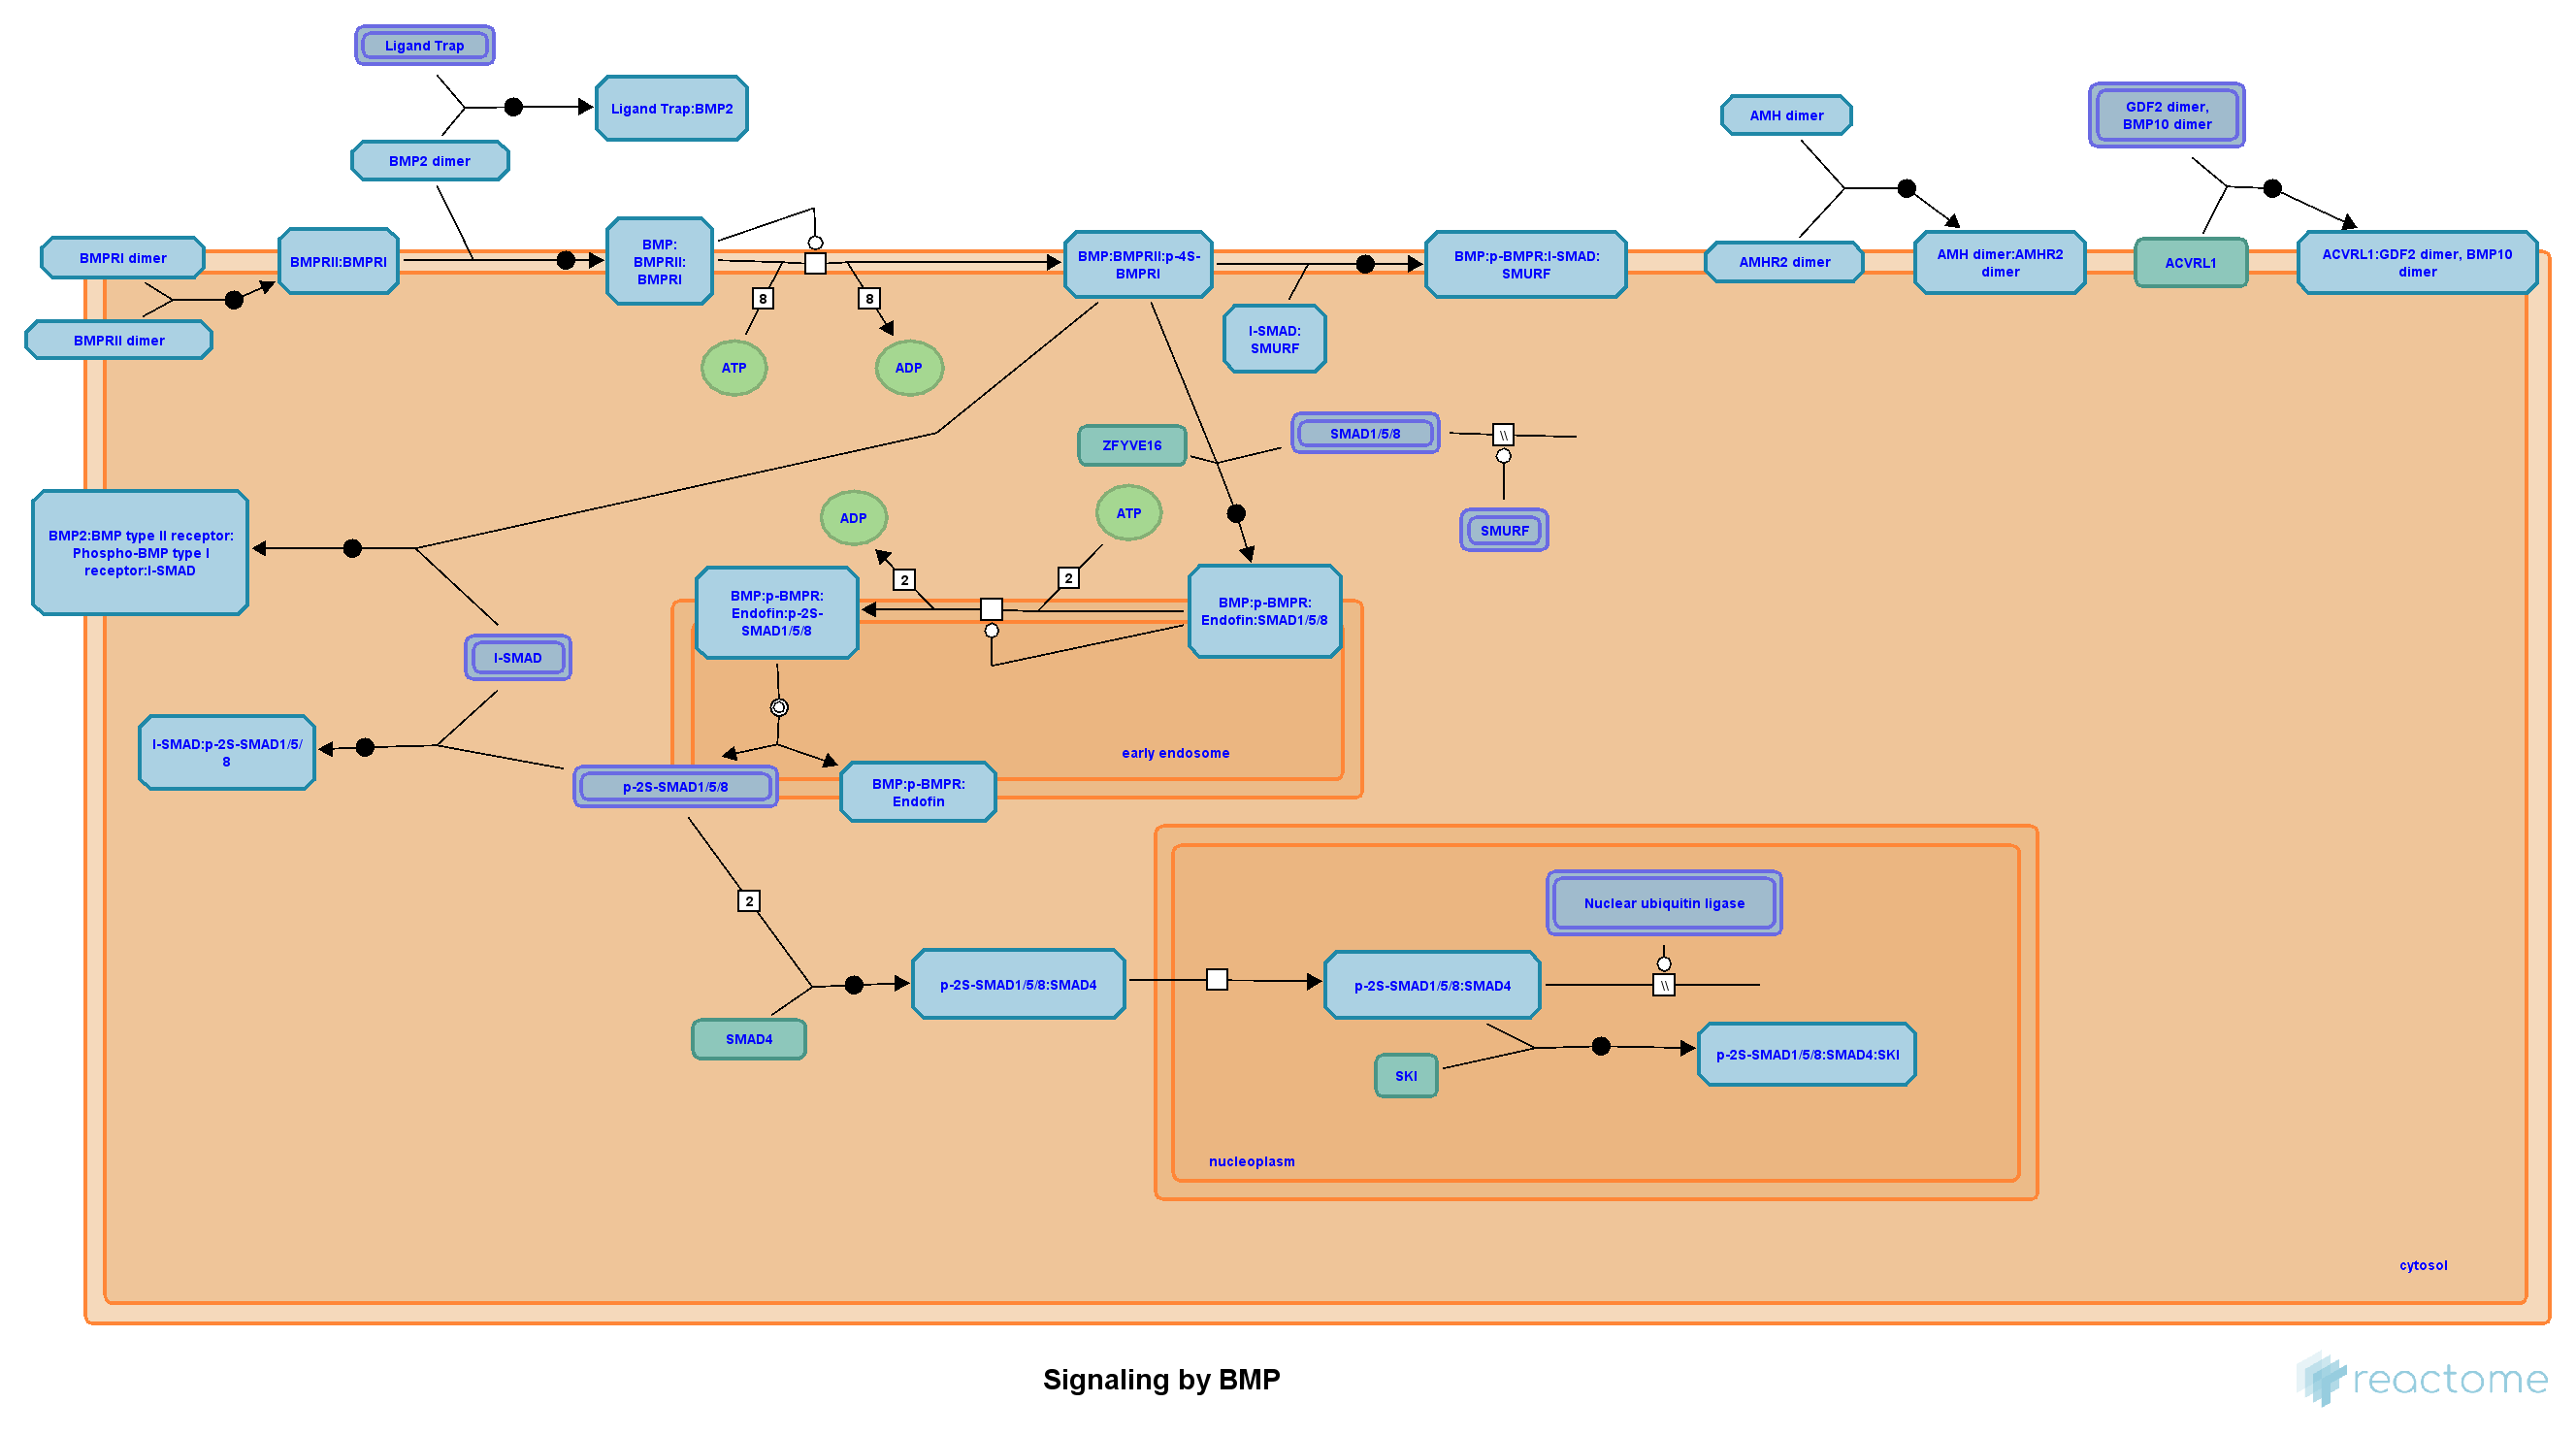
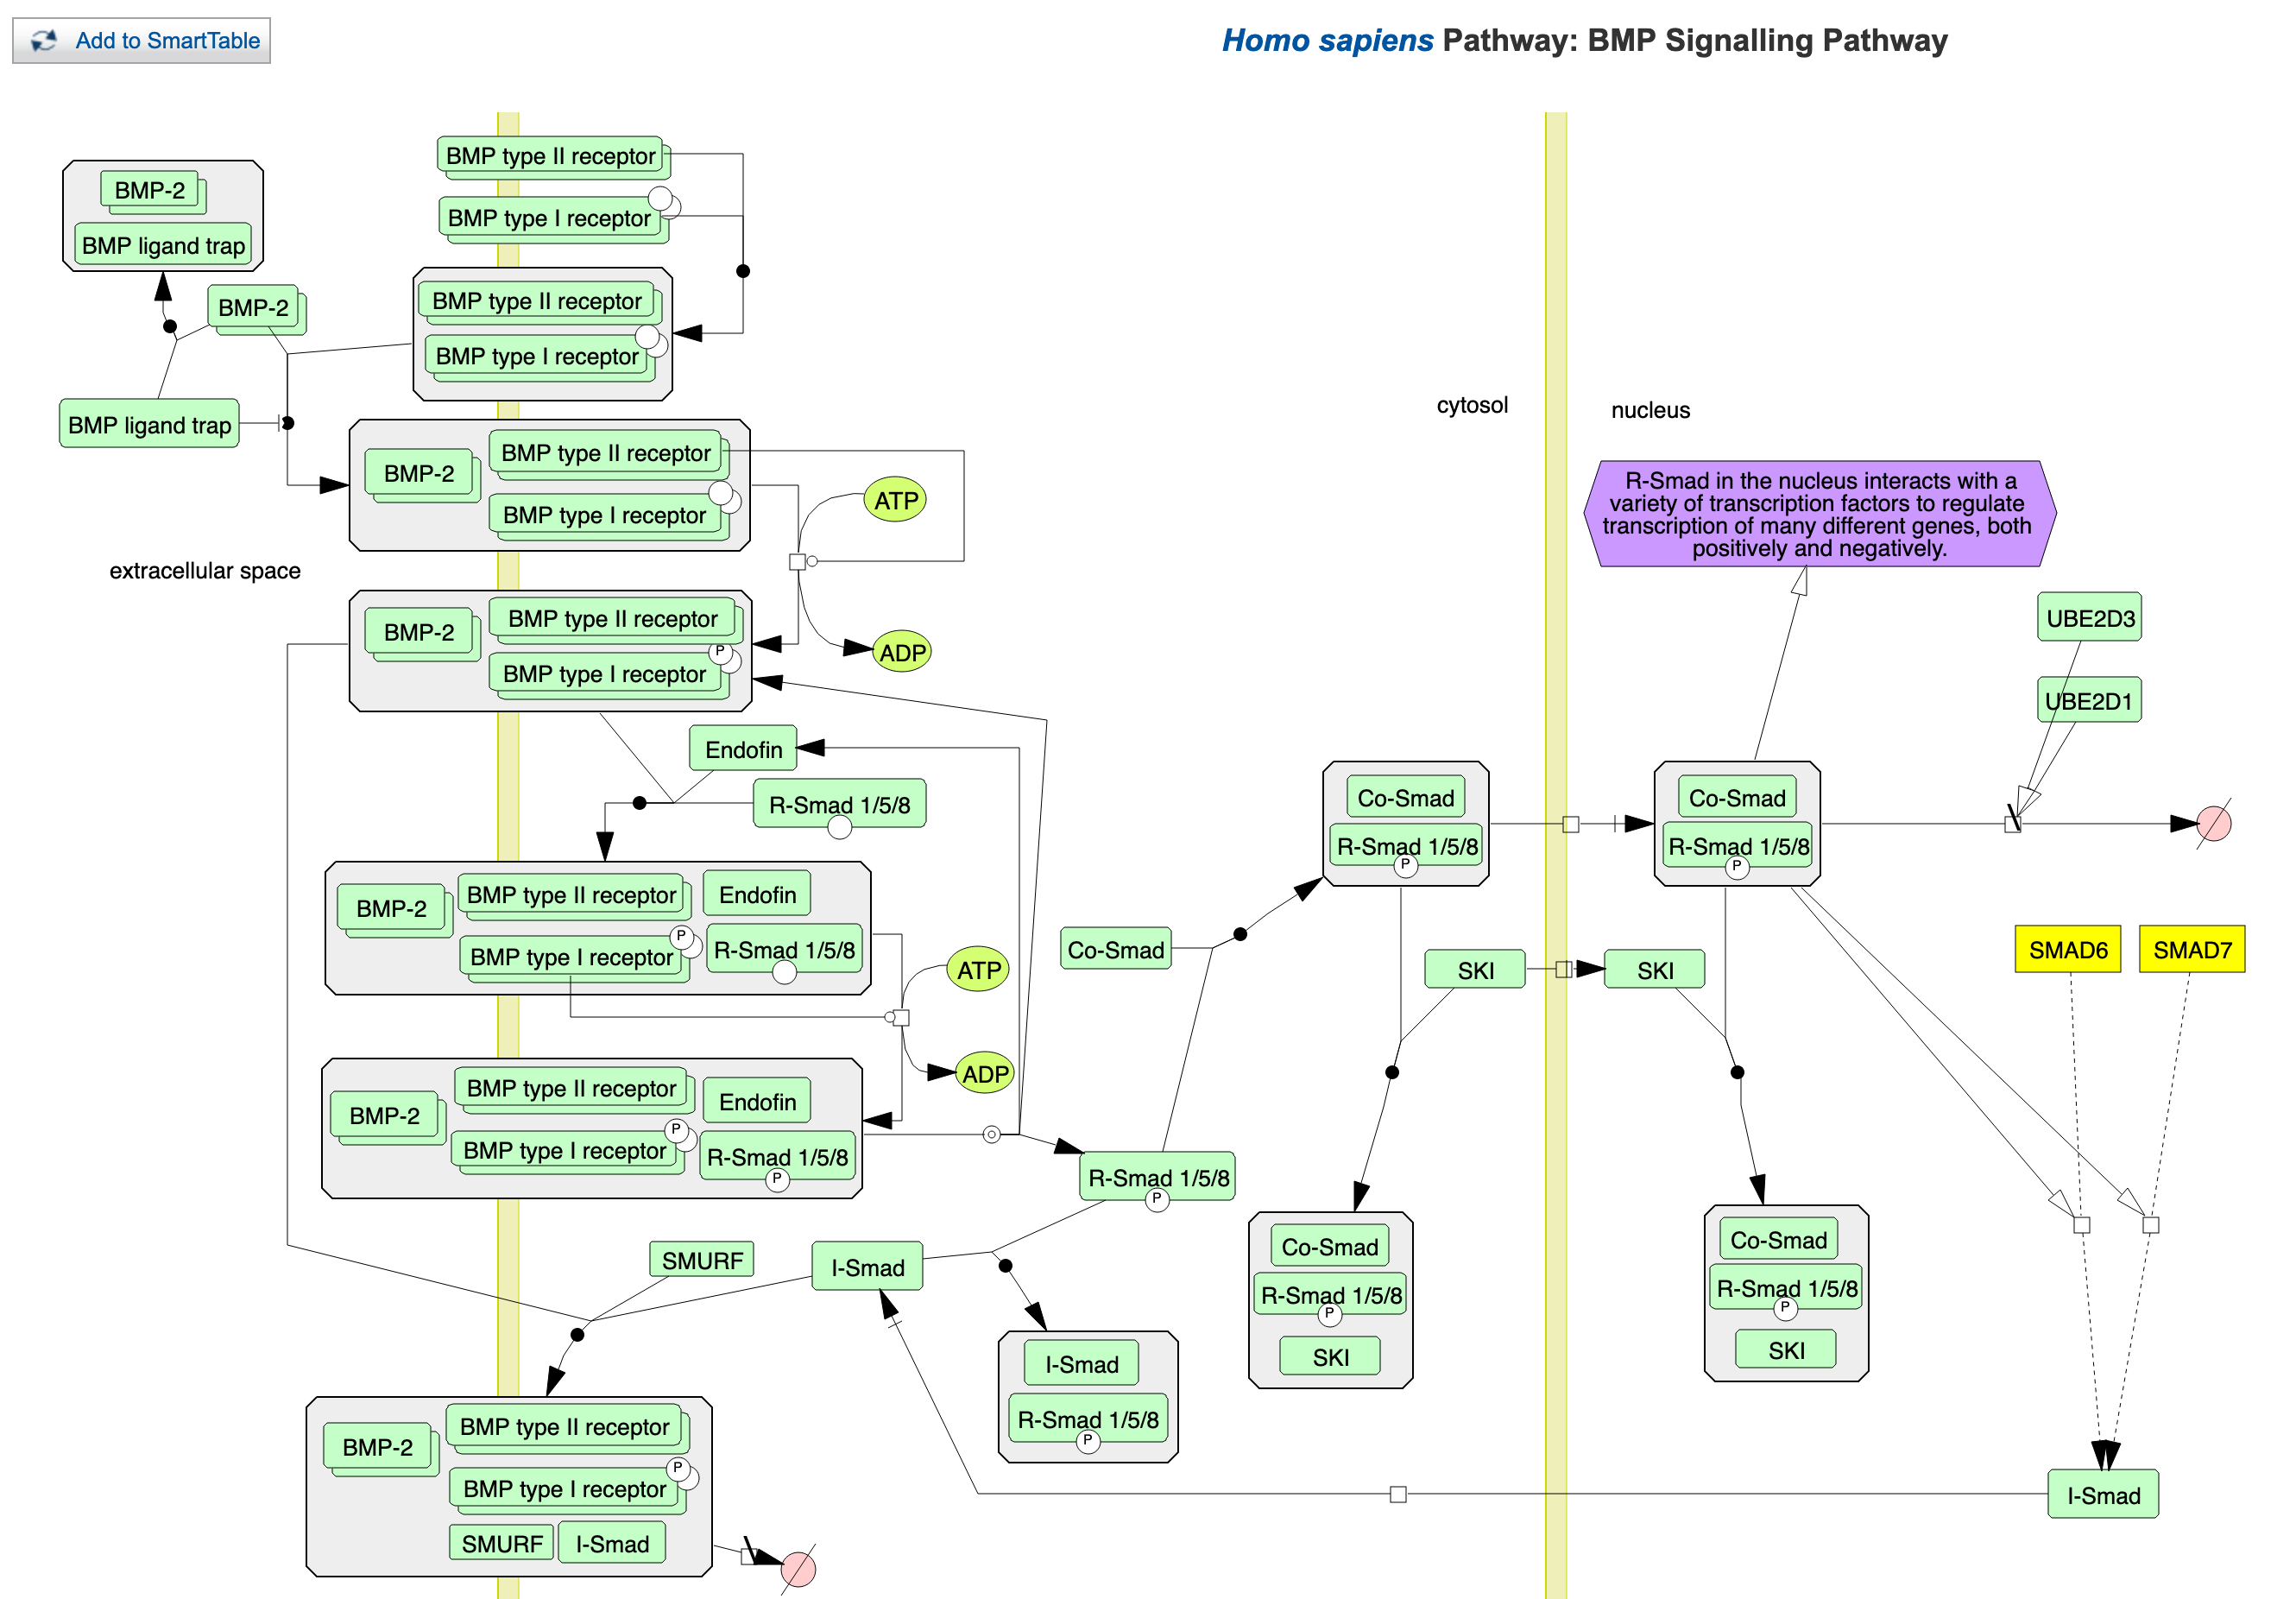
Comparisons between Reactome and HumanCyc signaling pathways are similar in terms of legibility. The Reactome pathway for BMP Signaling is illegible (https://reactome.org/content/detail/R-HSA-201451), whereas the HumanCyc pathway for BMP Signaling is easily legible (https://humancyc.org/HUMAN/NEW-IMAGE?type=PATHWAY&object=PWY66-11).
Reactome provides two full-metabolic-network diagrams. The “pathway browser” (https://reactome.org/PathwayBrowser/) shows a set of cascading circular diagrams for different pathway categories. However, the diagram essentially conveys no information other than the grouping of pathways in functional categories. In contrast, the PTools Cellular Overview diagram (https://humancyc.org/overviewsWeb/celOv.shtml?orgid=HUMAN) not only groups related pathways together, it also depicts the reactions and metabolites within a pathway at high zoom levels; the diagram also supports painting of omics data onto the pathway diagrams, with animations used to depict multiple time points. This PTools diagram can also be searched by pathway, gene, enzyme, and metabolite names. The second Reactome network diagram, the “Voronoi diagram” [2], is simply a hierarchical listing of all Reactome pathways without the pathway diagrams; it conveys essentially no information, is not searchable, and does not support navigation to individual pathway diagrams.
Tool PTools Reactome Metabolic Pathway Page YES YES – Depict Full Metabolite Names YES no – Depict Metabolite Structures YES illegible – Depict Enzyme Names YES no – Depict EC numbers YES no – Depict Compartment Information YES YES – Depict Enzyme Regulation YES YES – Depict Genetic Regulation YES YES – Automatic Pathway Layout YES no – Paint Omics Data onto Pathway YES YES Customizable Multi-Pathway Diagram YES no – Paint Omics Data onto Multi-Pathway YES no Signaling Pathway Page YES YES Metabolite Page YES no Reaction Page YES no – Reaction Atom Mappings YES no Interactive Metabolic Pathway Editor YES YES Interactive Signaling Pathway Editor YES YES Interactive Reaction Editor YES YES Interactive Metabolite Editor YES no
Table 1 assesses the capabilities of information pages for pathways, reactions, and metabolites in PTools and Reactome, as well as interactive editors associated with pathways, reactions, and metabolites.
An explanation of the rows within Table 1 is as follows.
-
•
Pathway Page: Is a metabolic-pathway information page with pathway diagram provided?
-
•
Depict Full Metabolite Names: Do pathway diagrams include meaningful metabolite names (as opposed to abbreviations such as “O-P-Ser” or “3POPA”)?
-
•
Depict Metabolite Structures: Can pathway diagrams show the chemical structures of metabolites?
-
•
Depict Enzyme Names: Do pathway diagrams include enzyme names?
-
•
Depict EC Numbers: Do pathway diagrams include EC numbers?
-
•
Depict Compartment Information: Do pathway diagrams depict cellular compartments and membranes?
-
•
Depict Enzyme Regulation: Can pathway diagrams show regulation of enzymes by metabolites, to depict information such as feedback inhibition?
-
•
Depict Genetic Regulation: Can pathway diagrams show genetic regulation of enzymes, such as by transcription factors and attenuation?
-
•
Automatic Pathway Layout: Are pathway diagrams generated automatically by the software, thereby avoiding manual drawing, and enabling scalability to thousands of organisms?
-
•
Paint Omics Data onto Pathway: Can a user visualize omics data on pathway diagrams?
-
•
Customizable Multi-Pathway Diagram: Can users interactively create diagrams consisting of multiple interacting metabolic pathways?
-
•
Paint Omics Data onto Multi-Pathway: Can a user visualize omics data on multi-pathway diagrams?
-
•
Signaling Pathway Page: Is a signaling-pathway information page with pathway diagram provided?
-
•
Metabolite Page: Does the site provide a metabolite page, showing relevant information such as synonyms, chemical structure, and reactions in which the metabolite occurs?
-
•
Reaction Page: Does the site provide a reaction page, showing relevant information such as EC numbers, reaction equation, and enzymes catalyzing the reaction?
-
•
Reaction Atom Mappings: Can the reaction equation be shown with metabolite structures that depict the trajectories of atoms from reactants to products?
-
•
Interactive Metabolic Pathway Editor: Does the software provide an editor for interactive creation and modification of metabolic pathways?
-
•
Interactive Signaling Pathway Editor: Does the software provide an editor for interactive creation and modification of signaling pathways?
-
•
Interactive Reaction Editor: Does the software provide an editor for interactive creation and modification of reactions?
-
•
Interactive Metabolite Editor: Does the software provide an editor for interactive creation and modification of metabolites?
3 Pathway Informatics Tools
Table 2 assesses a number of analysis capabilities within the two software packages.
Tool PTools Reactome Full Metabolic Network Diagram YES YES – Zoomable Metabolic Network YES YES – Paint Omics Data onto Diagram YES no – Animated Omics Data Painting YES no – Metabolic Poster YES no Metabolic Reconstruction YES YES Route Search Tool YES no Genome-Scale Reactome Comparison YES no Genome-Scale Pathway Comparison YES no Transcriptomics Enrichment Analysis YES YES Metabolomics Enrichment Analysis YES YES Metabolomics Pathway Covering Analysis YES YES
-
•
Full Metabolic Network Diagram: Can the entire metabolic reaction network of an organism be depicted and explored by an interactive graphical interface?
-
•
Zoomable Metabolic Network: Does the metabolic network browser enable real-time semantic zooming of the network?
-
•
Paint Omics Data onto Network: Can a user visualize an omics dataset (e.g., gene expression, metabolomics) on the metabolic network diagram?
-
•
Animated Omics Data Painting: Can several omics measurements be visualized as an animation on the metabolic network diagram?
-
•
Metabolic Poster: Can the portal generate a printable wall-sized poster of the organism’s metabolic network?
-
•
Metabolic Reconstruction: Starting from a functionally annotated genome, can the software infer the organism’s metabolic reaction network and pathways? Reactome apparently has an algorithm for this, but it has never been published. Further, because Reactome does not have a reference pathway database that spans all domains of life as does the MetaCyc [1] database used by PTools for metabolic reconstruction, Reactome cannot accurately predict pathways across all domains of life as can PTools.
-
•
Route Search Tool: Given a starting and an ending metabolite, can the site compute an optimal series of known reactions (routes) that converts the starting metabolite to the ending metabolite?
-
•
Transcriptomics Enrichment Analysis: Can the site compute statistical enrichment of pathways from transcriptomics data?
-
•
Metabolomics Enrichment Analysis: Can the site compute statistical enrichment of pathways from metabolomics data?
-
•
Metabolomics Pathway Covering Analysis: Can the site compute a minimal set of metabolic pathways that cover a set of metabolites from a metabolomics experiment?
4 Metabolic Modeling
Table 3 assesses metabolic-modeling capabilities within the two software packages.
Tool PTools Reactome Execute Metabolic Model YES no – Gene Knock-Out Analysis YES no – Flux-Variability Analysis YES no Model Organism Communities YES no Reaction Gap Filling YES no Chokepoint Analysis YES no Dead-End Metabolite Analysis YES no Blocked-Reaction Analysis YES no
-
•
Execute Metabolic Model: Can a user execute a steady-state metabolic flux model using the flux-balance analysis approach?
-
•
Gene Knock-Out Analysis: Can a user run flux-balance analysis (FBA) on the metabolic network by systematically disabling (knocking-out) various genes, to investigate how knock-outs perturb the network, and to predict gene essentiality?
-
•
Flux-Variability Analysis: Can a user run flux-variability analysis to compute the range of fluxes each reaction can attain?
-
•
Model Organism Communities: Does the software enable modeling of organism communities as well as single organisms?
-
•
Reaction Gap Filling: Does the software have a tool for automatically proposing reactions to add to the model to fill gaps in the metabolic network?
-
•
Chokepoint Analysis: Can the site compute chokepoint reactions (possible drug targets) in the full metabolic reaction network? A chokepoint reaction is a reaction that either uniquely consumes a specific reactant or uniquely produces a specific product in the metabolic network.
-
•
Dead-End Metabolite Analysis: Can the portal compute dead-end metabolites in the full metabolic reaction network? Dead-end metabolites are those that are either only consumed, or only produced, by the reactions within a given cellular compartment, including transport reactions.
-
•
Blocked-Reaction Analysis: Can the portal compute blocked reactions in the full metabolic reaction network? Blocked reactions cannot carry flux because of dead-end metabolites upstream or downstream of the reactions.
5 Conclusions
Our overall findings are as follows.
-
•
PTools is significantly ahead of Reactome in its basic information pages. For example, PTools pathway layout algorithms have been developed to an advanced state over several decades, whereas Reactome pathway layouts are illegible, omit important information, and are created manually and therefore cannot scale to thousands of genomes.
-
•
PTools includes a full metabolic network diagram that includes real-time semantic zooming and is far ahead of the comparable tools in Reactome.
-
•
PTools is far ahead of Reactome in omics analysis. PTools includes all of the omics-analysis methods that Reactome provides, and includes multiple methods that Reactome lacks, such as an Omics Dashboard and depiction of omics data on a zoomable metabolic map diagram.
-
•
PTools contains a metabolic route search tool (searching for paths through the metabolic network), which Reactome lacks.
-
•
PTools is significantly ahead of Reactome in inference of metabolic pathways from genome information to create new metabolic databases.
-
•
PTools has an extensive complement of metabolic-modeling tools whereas Reactome has none.
-
•
PTools is more scalable than Reactome, handling 18,000 genomes versus 90 genomes for Reactome.
-
•
PTools has a larger user base than Reactome. PTools powers 17 websites versus two for Reactome. PTools has been licensed by 10,800 users (Reactome licensed user count is unknown).
If the Reactome data were made available via PTools, the accessibility of those data would be greatly enhanced through legible pathway diagrams. Further, users could apply a wider variety of analysis tools and operations to those data, such as for omics data analysis, metabolic route searching, and metabolic modeling.
References
- [1] R. Caspi, R. Billington, , I. M. Keseler, A. Kothari, M. Krummenacker, P. E. Midford, W. K. Ong, S. Paley, P. Subhraveti, and P. D. Karp. The MetaCyc database of metabolic pathways and enzymes — a 2019 update. Nuc Acids Res, 2020. in press.
- [2] B. Jassal, L. Matthews, G. Viteri, C. Gong, P. Lorente, A. Fabregat, K. Sidiropoulos, J. Cook, M. Gillespie, R. Haw, F. Loney, B. May, M. Milacic, K. Rothfels, C. Sevilla, V. Shamovsky, S. Shorser, T. Varusai, J. Weiser, G. Wu, L. Stein, H. Hermjakob, and P. D’Eustachio. The Reactome pathway knowledgebase. Nuc Acids Res, 48(D1):D498–D503, 2020.
- [3] P. D. Karp, P.E. Midford, R. Billington, A. Kothari, , M. Krummenacker, W.K. Ong, P. Subhraveti, R. Caspi, I.M Keseler, and S. M. Paley. Pathway Tools version 23.0 update: Software for pathway/genome informatics and systems biology. Brief Bioinform, 2019. in press.
- [4] P.D. Karp, P.E. Midford, S.M. Paley, M. Krummenacker, R. Billington, A. Kothari, W.K. Ong, P. Subhraveti, I.M. Keseler, and R. Caspi. Pathway Tools version 23.0: Integrated software for pathway/genome informatics and systems biology. arXiv, pages 1–111, 2019. http://arxiv.org/abs/1510.03964v3.
- [5] Pathway Tools Based Databases and Websites. https://biocyc.org/otherpgdbs.shtml.