Bi-directional streaming of particles accelerated at the STEREO-A shock on 9th March 2008
Abstract
We present an interpretation of anisotropy and intensity of supra-thermal ions near a fast quasi-perpendicular reverse shock measured by Solar Terrestrial Relations Observatory Ahead (ST-A) on 2008 March . The measured intensity profiles of the supra-thermal particles exhibit an enhancement, or ”spike”, at the time of the shock arrival and pitch-angle anisotropies before the shock arrival are bi-modal, jointly suggesting trapping of near-scatter-free ions along magnetic field lines that intersect the shock at two locations. We run test-particle simulations with pre-existing upstream magnetostatic fluctuations advected across the shock. The measured bi-modal upstream anisotropy, the nearly field-aligned anisotropies up to minutes upstream of the shock, as well as the ”pancake-like” anisotropies up to minutes downstream of the shock are well reproduced by the simulations. These results, in agreement with earlier works, suggest a dominant role of the large-scale structure (s of supra-thermal proton gyroradii) of the magnetic field in forging the early-on particle acceleration at shocks.
keywords:
acceleration of particles – shock waves – turbulence1 Introduction
The association of energetic charged particles with interplanetary (hereafter IP) shocks is an observational and theoretical pillar of space physics and astrophysics (e.g., Treumann, 2009; Burgess et al., 2012). Diffusive shock acceleration theory (Axford et al., 1977; Bell, 1978; Blandford & Ostriker, 1978; Krymskii, 1977; Jokipii, 1982) is generally applicable only to particles at sufficiently high energy that the pitch-angle distribution (hereafter PAD) is nearly isotropic. Recent research has been vastly focusing on the origin of these so-called “seed-particles”, that include 1) Solar Wind (hereafter SW) particles accelerated directly from the thermal pool during solar energetic particle events, likely at shocks (Neergaard Parker & Zank, 2012; Neergaard Parker et al., 2014; Giacalone, 2017); 2) pre-existing quiescent population of supra-thermal particles, suggested early-on, e.g., by a He/H intensity ratio of keV ions upstream of the Earth bow shock correlated to the He/H intensity ratio in the SW in contrast with the intensity ratio in the field-aligned beams (Ipavich et al., 1984; Ipavich et al., 1988, ISEE 1), or by the intensity of keV ions upstream of IP shocks detectable only in a small fraction of the analysed sample (3 events out of 17) by Gosling et al. (1984) in ISEE 1 and ISEE 3 or other works (Desai et al., 2006b; Desai et al., 2006a; Mewaldt et al., 2007; Kahler et al., 2009; Mason et al., 2012). However, a mixture of both populations has not been observationally ruled out (Desai & Giacalone, 2016).
Multiple spacecraft (hereafter s/c) measurements at 1 AU (ACE, Wind, Lario et al., 2019) have shown in the supra-thermal energy range ( keV ions in the s/c frame) a below-background spectrum upstream of some IP shocks of various magnetic obliquity, i.e., both close to parallel and to perpendicular; only very close ( minutes) to the shock arrival a supra-thermal component emerges above the count/sec level. These observations suggest that, at least in these cases, the pre-existing suprathermal population does not play a significant role in the generation of the downstream high-energy tail of the momentum distribution. In the supra-thermal range a weak anisotropy (and low intensity) is measured within hours before the arrival of highly-oblique shocks whereas strong anisotropy is found for the low-obliquity ones, due to ions streaming nearly-aligned to the magnetic field (Lario et al., 2019). In this context an investigation of the high-obliquity shocks with a measured large anisotropy might help shed light on the supra-thermal ions dynamics.
Localised enhancements at shocks, or shock spikes, have been identified in the past decades by a number of in-situ measurements via Explorer 33-35 (Armstrong et al., 1970) and Vela 4 (Singer & Montgomery, 1971) in the supra-thermal (s, s keV) ion intensity at the shock with duration of a few tens of seconds, minutes (ACE, Lario et al., 2003). The Voyager-1 crossing of the solar termination shock (Decker et al., 2005) suggests a spike in high-energy protons ( MeV) and ions ( keV) intensities (le Roux et al., 2007; Zuo & Feng, 2013). The measured anisotropy makes spikes good candidate to improve our data-driven understanding of the role of the large scale magnetic geometry in the early-on particle acceleration.
Formerly postulated to originate from ions anisotropically reflected between Earth bow and IP shocks (Axford & Reid, 1963), spikes were first modelled by Decker (1983) for quasi-perpendicular shocks (, where is the angle between the local shock normal and the upstream unperturbed magnetic field) by using shock drift acceleration of a seed particle population. An alternative scenario of spikes originated as ions are reflected by the magnetic barrier and conserve the first adiabatic invariant applies to the quasi-perpendicular case only (Gieseler et al., 1999). Enhancements associated with need an additional source of turbulence arguably provided by the self-excited waves produced by energetic ions streaming upstream (Scholer, 1985).
Erdos & Balogh (1994) proposed that spikes are generated by magnetic trapping of particles formed by multiplecrossings of the turbulent magnetic field lines with the shock surface; a supra-thermal ion beam aligned with the upstream field would produce a single-peak PAD within the loss-cone. Erdos & Balogh (1994) showed qualitative agreement between the ISEE-3 data in the minutes preceding the IP shock on 1978 Dec and a numerically calculated double-peak PAD. Such a double peak results from a double loss cone, footprint of a bi-directional streaming along the upstream field crossing the shock surface in multiple points. A subsequent analysis of Ulysses data (Marhavilas et al., 2003) of the spike at the quasi-perpendicular () shock event 1992, DOY256, shows a clear bimodal PAD (see Fig. 4, a, b therein) and estimates the length scale of the trapping region times the supra-thermal ions gyroradius.
The present paper is devoted to the interpretation of the measured PADs and intensity of suprathermal ions in a recent STEREO/A (STA) quasi-perpendicular () reverse shock of a stream interaction region (2008, DOY 069, March , UT: 19:50); such an event was found to exhibit a bimodal PAD in the supra-thermal range (nuc keV H+ and nuc keV He+) in the minutes upstream of the shock (see Fig. 5(e,f) in Yang et al., 2020) and transiting to a single-peak shape aligned with reflected ions far upstream of the shock. A pancake-like PAD was measured downstream.
In-situ measurements of SW thermal density and magnetic field have long shown that turbulence is an inherent property of the heliospheric plasma from sub-ion scale up to the correlation length ( AU at AU, e.g., Jokipii & Coleman, 1968; Bruno & Carbone, 2005). By implementing a pre-existing magnetic turbulence frozen with the fluid and passively advected through the shock (Decker & Vlahos, 1986; Giacalone & Jokipii, 2009), test particle numerical simulations were used (Fraschetti & Giacalone, 2015) to determine the PAD of supra-thermal ions as the shock approaches the s/c. In particular, the emergence of a bi-modal PAD close to the shock from a reflected ions-dominated regime far upstream was investigated in detail.
In this letter, we use the analysis of the STA reverse shock on 2008 DOY 069 in Yang et al. (2020) to reproduce with test-particle simulations for the first time the supra-thermal protons PADs at a shock in quantitative agreement with in-situ measurements.
2 STEREO observations
The STA 2008 DOY069 (March , UT: 19:50) shock event was observed within a stream interaction region. In-situ measurements constrain the local geometry of the shock and the local magnetic field orientation. The measured shock parameters used here are111As reported in the archive http://ipshocks.fi/database: density compression across the shock , , upstream total magnetic field nT, upstream Alfvén speed kms, velocity of the shock along the shock normal in the s/c frame kms, SW speed in upstream frame kms, velocity of the shock in the upstream frame along normal kms, where follows the sign convention in the archive above and indicates the SW speed projection along the shock normal in RTN coordinates with , directed sunward for a reverse shock and the -axis is directed along the average shock motion, Alfvén Mach number , sonic Mach number . Yang et al. (2020) define three time intervals across the STA measurements ( minutes upstream of the shock, minutes upstream of and minutes downstream of the shock)222For the time-intervals and , the notation in Yang et al. (2020) is adopted hereafter, not to be confused with the plasma speeds in the shock frame, customarily labelled as and . and provide separate PADs within each interval. During the magnitude of decays (Yang et al., 2020) from the forementioned upstream value nT (measured within minutes from the shock) to the typical value at AU ( nT). Simulations of particle motion as far upstream as should account for the slow decompression of the unperturbed field therein. Here the value nT is adopted.
3 Numerical set-up
3.1 Synthesized turbulence
We carry out test-particle numerical simulations of supra-thermal protons at a fast, planar collisionless shock travelling in a plasma with an embedded turbulent magnetic field. The upstream three-dimensional magnetic field is given by , with an average component having orientation with respect to the local shock normal and a random component having a zero ensemble average (); the turbulence is synthesized as superposition of plane waves with random amplitude, phase and orientation, with amplitudes determined by an assumed power spectrum (c.f. Decker & Vlahos, 1986; Giacalone & Jokipii, 1999; Fraschetti & Giacalone, 2012). Simulations aiming at reproducing measurements of a single shock event can make use of one specific turbulence realization, rather than an ensemble average. We fit the PADs of H+ within the time intervals , , , provided that the particle intensity satisfactorily reproduces the measured shape.
For the sake of simplicity, we assume the upstream three-dimensional magnetic turbulence to be isotropic and scale-invariant, with a Kolmogorov power spectrum, in the inertial range , where , is the correlation length of the turbulence (Giacalone, 2005; Fraschetti & Giacalone, 2015), and . At smaller wavenumbers, or larger scales, in the range , where and , the power spectrum is assumed to be uniform. Such a power spectrum includes only the pre-existing SW fluctuations and not those “self-generated” by the energetic ions streaming ahead of the shock via, e.g., cyclotron-resonant streaming instability (Tademaru, 1969; Lee, 1983). In the simulations presented here, we set the unperturbed upstream magnetic field nT (see Sect. 2) and AU, so that , where is the particle gyroradius, at all particle energies considered here and the condition of resonant scattering with all turbulent wavenumbers is satisfied. The dataset for the STA 2008 DOY069 event (see Sect. 2) restricts the simulations parameter space to the power of the magnetic turbulence () relative to the power of the unperturbed field (). We have verified that a turbulence power spectrum extended to higher wavenumbers, or smaller scales, from up to does not alter significantly the bi-modal shape of the PAD, nor the particle intensity.
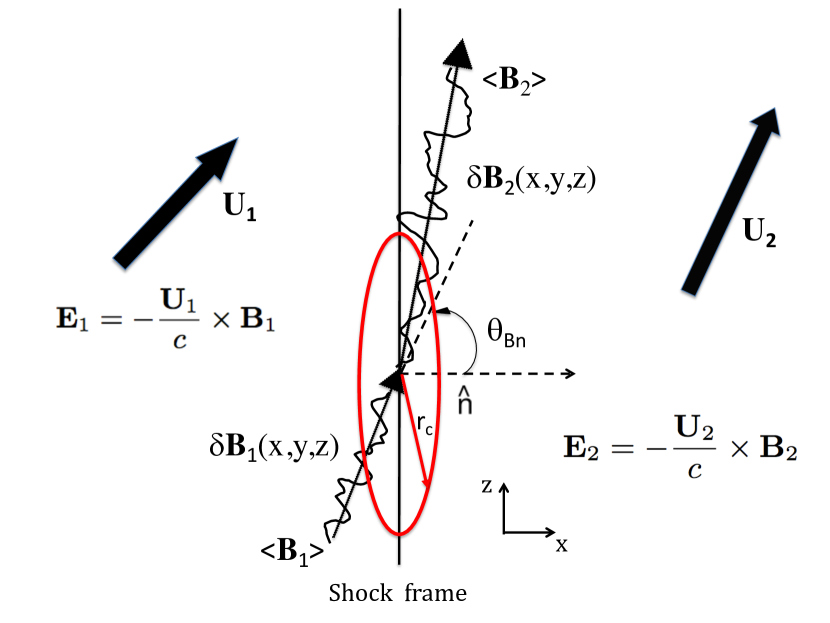
The geometrical configuration implemented in the simulations is summarized in Fig. 1. The plane marks the planar shock surface. Bulk plasma flows into the shock from to along the shock normal, along the x-axis. The components of the bulk flow velocity before and after the shock satisfy the jump conditions at an infinitely planar shock. The profile of the bulk velocity along the x-axis is taken to be discontinuous to the scale of the supra-thermal particles, much larger than the ion skin depth. The reference frame is chosen so that lies on the xz-plane and kms (see Sect. 2).
We determine the trajectory of individual particles by numerically solving the Lorentz equation in the prescribed magnetic field. Assuming that in the plasma rest frame both upstream and downstream electric field vanish (infinitely conductive), particles undergo acceleration by the motional electric field that writes in the shock frame , where and the magnetostatic field is passively advected along the flow (Giacalone & Jokipii, 2009; Fraschetti & Giacalone, 2015), where the -dependence of at a given location can be interpreted as a spatial variation as it results from the fluid advection only. Since the particles trajectories are integrated over a single turbulence realization, the phase-space distribution function in the time-intervals , , represented here is not solution of a steady-state ensemble-average transport equation, as it corresponds to a particular realization of ; the time variation of a chosen realization at a given spatial location could average out with an equal and opposite time-variation at the same location of a distinct realization of with no change for the ensemble average (see Sect. 5).
The boundary conditions are based on the approach in Giacalone (2005); Fraschetti & Giacalone (2015): the motion is tracked until either a) particles reach a pre-specified high-energy cut-off, taken to be much higher than the energy of interest in this study ( where is the injection momentum in the plasma frame), or b) particles escape by advection at a downstream boundary (), where the prescription of the return probability is implemented (Ellison et al., 1996; Giacalone, 2005; Fraschetti & Giacalone, 2015). No energy-independent free-escape boundary upstream is assumed. Ions are injected upstream on the plane , where is the initial gyroradius, at a random location in the plane within a square of side to capture the effect of the perpendicular transport due to the field line meandering that originates from scales larger than (e.g. Jokipii, 1966; Webb et al., 2009; Fraschetti & Jokipii, 2011; Laitinen & Dalla, 2017) with no ignorable coordinate (Jokipii et al., 1993; Jones et al., 1998). Particles are injected with an isotropic distribution in the local pitch-angle whose cosine is defined as , where is the particle momentum in the local plasma frame.
3.2 Effect of the finite extent of the shock on pitch-angle distributions
Within each given spatial interval along -axis and energy interval, our simulations enable binning all ions positions and that spread over an infinite area plane parallel to . However, due to the limited effective area of the detectors onboard STA, compared to the shock surface, such a simulation set-up introduces a bias in the PAD with respect to the s/c measurements: particles moving nearly along the shock surface leave the volume spanned by the detector during a given time interval faster than particles nearly aligned with the shock normal and, due to the finite extent of the shock, the former are not replenished as fast as the latter. As a result, in the quasi-perpendicular configuration of the STA 2008-069 event, the measured intensity of field-aligned particles ( or pitch-angle) is depleted compared to the intensity of those at ( pitch-angle); such an effect has to be accounted for in the data-modelling. In addition, the effective area of PLASTIC (Plasma and Suprathermal Ion Composition) instrument in the supra-thermal ions energy band ( keVnuc) is comparable with the one of SEPT (Solar Electron and Proton Telescope) instrument in the energy band keVnuc333For ions the PLASTIC geometric factor is cmsr (Table 1 in Galvin et al., 2008), for SEPT it is cmsr (Table 4 in Müller-Mellin et al., 2008).. Thus, both the PLASTIC and SEPT geometric factors, proxy for the effective collecting area of particles, are much smaller than the physical size of the detector. We account for this instrumental limitation by introducing the PLASTIC/SEPT collecting area as an additional parameter as illustrated below. We also note that PLASTIC points “nearly”-sunward whereas the SEPT “Sun” telescope points from the Sun-STA direction (along the nominal Parker spiral). Thus, the viewing angles of PLASTIC and SEPT are different.
In the numerical simulations, a collecting area as small as the effective detector area requires a very large number of test-particles due to the low density of suprathermal particles. For the sake of simplicity, we use an energy-independent effective collecting area assimilated to a circle in the plane of radius , where is a constant to be determined by the combined fit of the PADs in the three time intervals , and (see Fig. 1). The motivation for the proportionality of to is that, by definition of , the transport of particles within a distance from the detector is governed by a cascading turbulence correlated with the detector location. Scales are expected to contribute the PAD as the perpendicular transport is governed by magnetic fluctuations at such scales (field-line meandering, e.g. Jokipii, 1966; Qin et al., 2002; Minnie et al., 2009; Fraschetti & Jokipii, 2011). The PADs in Yang et al. (2020) cover a total time interval min, including min, min and min. For comparison, the scatter-free travel time of the highest PLASTIC energy particles is min . Thus, as the shock travels, particles originating from a shock region at a distance are detectable. However, particles are injected within a square of side on the plane , very close to the shock surface. Therefore, the range of to be explored spans from to . Due to the lack of further constraints, has to be determined directly by comparing simulations with data.
4 Results
We calculated PAD and intensity profiles for suprathermal protons in the PLASTIC and SEPT energy bands, respectively, for for a number of magnetic turbulence realizations in each case. Given the PLASTIC supra-thermal energy band for H+ ( keVnuc), the goldilock injection particle energy in the local plasma frame, , has to be lower than the low PLASTIC energy bound, keV, to enable all particles to undergo shock-acceleration and resonantly interact with the upstream turbulence before accessing the PLASTIC energy band. In addition, the particle injection speed (in the upstream plasma frame) has to satisfy as higher speed particles quickly isotropize downstream, as predicted by DSA. The value keV () satisfies such conditions and will be used hereafter.
Figure 2 compares the PADs during U1, U2 and D1 for distinct values of with STA data. The expected and measured underlying monotonic upstream PAD (decreasing from to ) due to reflected ions is found both during U1 and U2. The single realization of shown here remarkably reproduces the bi-modal structure in U1 (Fig. 2, left panel, red curve) peaking at and with , due to particles streaming in low-scattering regime along the magnetic field lines (Erdos & Balogh, 1994; Marhavilas et al., 2003; Fraschetti & Giacalone, 2015). The peak is smeared out in the case of (black curve), possibly due to broader range of angles between the local and the local shock normal, captured by a larger collecting area (A), that enables isotropization of the PAD at . We note that the fit of the PAD during U1 only cannot constrain due to the degeneracy introduced by the choice of a single turbulence realization: the combined fit of PADs in U2 and D1 allows one to reduce such a degeneracy with a larger degree of confidence444We note that for the STA data (Yang et al., 2020) is calculated in the SW frame, whereas the simulations use the local plasma frame; our tests show that this inertial-frame effect does not introduce an error significant to the data-fit, due to the coarse PLASTIC -resolution..
As for U2 (Fig. 2, middle panel), the bi-modal structure seen in U1 is smeared out during U2, and simulations with (green curve) well reproduce the monotonic trend; the transition from bi-modal to monotonic shape further upstream was emphasized in previous ensemble average calculations (Fraschetti & Giacalone, 2015). A major difference between the two cases and is the intensity excess for for (even higher in our runs for ) due to the increase of the detector area (Sect. 3.2). An additional difference between the cases and is the high reflected ions PAD of the latter for . A bending of as in U2 is suggested by the measured vanishing of at in U1, favouring the case ; however, is not constrained by data during U2. Finally, a bump in the case of between and stands out over an underlying monotonic shape between and . Such a bump might result again from the larger collecting area (larger ) that intersects a larger number of magnetic field lines crossing the shock with a higher chance of capturing a second stream of ions originating from a further region on the shock (U2 interval extends between and minutes upstream of the shock).
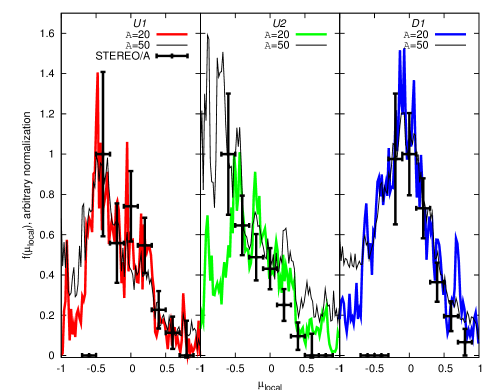
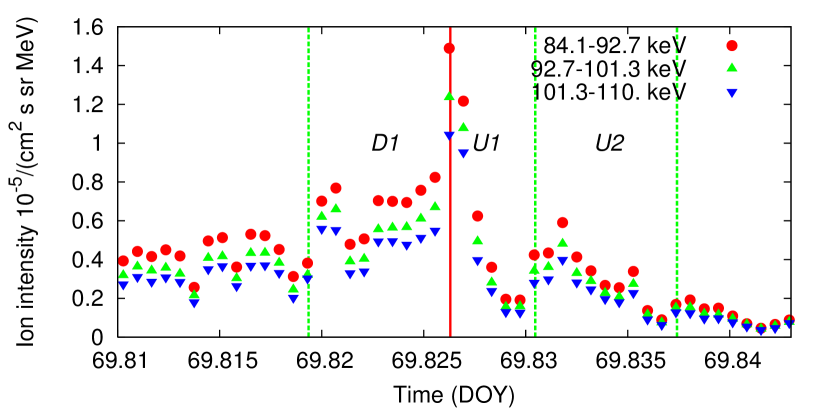
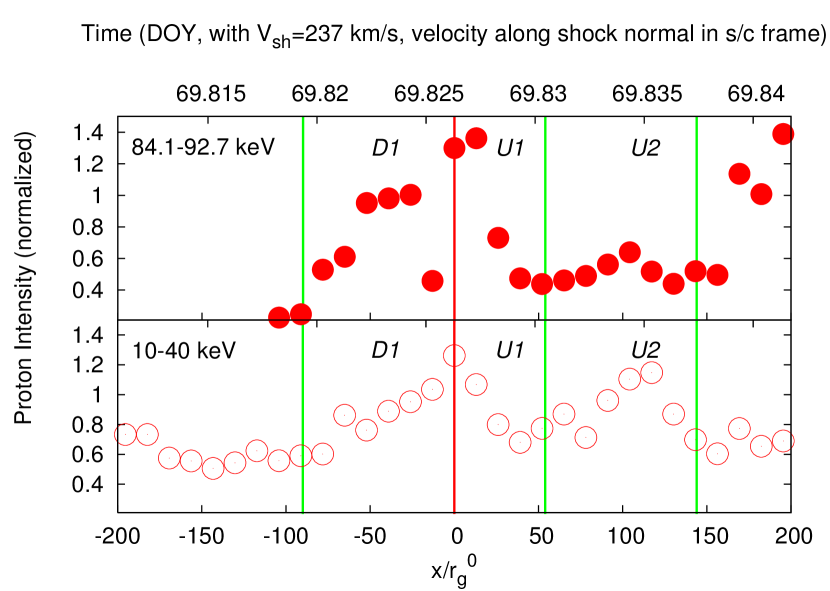
The right panel in Fig. 2 depicts the PAD during D1. The peak at results from downstream advection of particles closely moving along magnetic field lines in a quasi-scatter-free scenario (Erdos & Balogh, 1994; Fraschetti & Giacalone, 2015). A difference between the cases and emerges only for , not constrained by data. Figure 3 shows STA/SEPT particles intensity in the lowest suprathermal energy bands exhibiting an enhancement beyond compression at the shock arrival. During U2 the intensity enhancement is well past; thus, strong deviations from monotonic PAD in U2 are not to be expected. Figure 4 shows the simulated proton intensities profiles in the PLASTIC energy band keV (lower panel), and in the lowest SEPT energy band keV (upper panel), with parameters fixed by the PADs fit in Fig. 2 ( and ) and no additional fitting. An enhancement at the shock in both panels, correspondent to the spike, seems to emerge. The intensity increase in the upper panel ( keV) ahead of U2 is lacking in the observations; however, we note that the turbulence realization is chosen to reproduce PAD and intensity during U1, U2 and D1 intervals only. The intensity before or past such intervals is affected by larger scale structure of the synthesized magnetic field.
5 Discussion and Conclusion
The length scale of the upstream magnetic trap originating the local intensity enhancement and the bi-modal anisotropy of keV/nuc protons ( km in the upstream field) can be estimated as . For a scattering mean free path , the trap not only enables particles confinement, but also allows nearly scatter-free streaming along field lines that cross the shock in multiple points (the minimum value is realized in stronger turbulence, i.e., , whereas we present here the case ).
One caveat regarding our simulations is that we have used the magnetic obliquity inferred along the s/c trajectory crossing the shock over its detector area, whereas such an angle ( for the 2009 DOY 69 event) can fluctuate, both in the spatial location and in time, along the shock surface due to its inherent corrugation (Neugebauer & Giacalone, 2005; Koval & Szabo, 2010; Ebert et al., 2016); multi-s/c IP shocks measurements reported fluctuations over a scale km (ACE, Wind and Geotail, Terasawa et al., 2005) or down to km (Cluster, Kajdič et al., 2019), confirmed by hybrid simulations for kinetic ions and fluid electrons (Kajdič et al., 2019). Such a variability of does not alter our interpretation of magnetic trapping as a rippled shock surface propagating into a laminar medium has comparable confinement effects, as far as the ion scales are concerned, to a planar shock propagating into a turbulent field, as pre-existing turbulence corrugate the shock at scales much larger than electron-scales micro-instabilities and over longer time scales. Finally, the media upstream of Earth bow shock and IP shocks have been long measured to deviate from laminar structure, since Fairfield (1974), as a result not only of ions-generated waves but also of electrons-scale kinetic effect, such as energy exchange between electrons and ions mediated by large amplitude whistlers precursors (Wilson et al., 2017). Such scales needs kinetic ions-electrons particle-in-cell simulations and are therefore beyond the scope of this work.
We have neglected the electric field of the order of arising from the magnetic field fluctuations modelled as Alfvén waves propagating along the field at speed . This is justified by the fact that for the parameters used in our test-particle simulations, on both sides of the shock. Stochastic acceleration, relevant as the particles move away from the shock, is expected to have a smaller effect on the spike formation because the electric field is disordered and has therefore an average negligible effect (Fraschetti & Giacalone, 2015).
An additional set of runs includes the PADs and intensity profiles of supra-thermal particles for a phase-space distribution function that solves the time-dependent equation of transport (Giacalone, 2005); both the ensemble-averaged case and a few cases of single turbulence realization have been explored with the given turbulence power spectrum. Such cases do not provide a significantly better fit of PADs U1, U2 and D1 and are therefore not shown here.
The turbulence upstream the shock is modeled herein as a superposition of plane waves with random amplitude, phase and orientation and is described by the power spectrum via normalisation () and power law index within the inertial range (). In the past decade the interpretation of 3D large-scale magnetohydrodynamic numerical simulations and of in-situ measurements has advocated the role of current sheets, or more generally of large gradients of the magnetic field such as discontinuities, in driving turbulence (Matthaeus et al., 2015), for example, in the SW (Greco et al., 2016). Dropouts in solar energetic particles count rates suggest crossing by the s/c of particle-filled flux tubes bounded by discontinuities and adjacent to particle-voided flux tubes (Mazur et al., 2000); such dropouts can be measured if the flux tubes are magnetically connected with the solar photosphere and map its super-granulation (Giacalone et al., 2000), assuming a negligible cross-field diffusion. In an alternative scenario, if time dependence of perpendicular diffusion is included (e.g., Fraschetti & Giacalone, 2012) dropouts are consistent with observations provided that the diffusion coefficient becomes large afterward (Laitinen et al., 2013). An inspection of the 1/8 second resolution magnetic field vector components/magnitude time series of the 2008 DOY069 event (IMPACT /MAG) within minutes ahead and past the shock shows no evidence of discontinuities (large fluctuations or sharp changes of direction), although a statistical analysis following, e.g., the criteria of Burlaga (1969) on rotation of the B-field or of Tsurutani & Smith (1979) on to identify discontinuities has not been carried out. Consistently, no impulsive voids, or dropouts, in the count rate of supra-thermal particles were observed in PLASTIC or SEPT. Thus, data suggest that the turbulence in the proximity of the shock event STA 2008, DOY 069 is not dominated by current sheet structures. Acceleration of charged particles at current sheets with strong guide field (, Dmitruk et al., 2004; Zhdankin et al., 2013) or with strong turbulent fluctuations ( Isliker et al., 2017) have been numerically analysed. In the latter case, reconnecting current sheets (as coherent structures) can mix with large amplitude magnetic fluctuations and cannot be neglected in the time evolution of the turbulence. As aforementioned, data do not show significant evidence of reconnecting current sheets. Therefore, a representation of the turbulence as plane waves superposition with an upper boundary is expected to provide a realistic representation of the turbulence crossed by the STA 2008 DOY 069 shock. However, we note that, since the spacecraft probes the SW only along its trajectory, the role of current sheet in the turbulence crossed by the shock over its entire spatial extent cannot be ruled out, even in regions of the shock magnetically connected with the s/c; however, due to the lack of evidence, it is not included herein. The interplay of current sheets and shocks in the acceleration of particles has been analyzed in several recent works (Matsumoto et al., 2015; Zank et al., 2015; le Roux et al., 2016; Zhao et al., 2019): the interaction of the shocks with current sheets can generate magnetic islands thereby energizing particles. However, owing to the reasons outlined above, for the STA 2008DOY069 event current sheets are not a dominant effect in the particle acceleration.
In summary, we have carried out test-particle simulations for protons accelerated at a laminar highly-oblique shock propagating into a medium with an embedded pre-existing turbulence to explain data for the STEREO quasi-perpendicular fast reverse shock of a stream interaction region 2008, DOY 069 (March , UT: 19:50). We have shown that the main features of PADs and of intensity profiles of suprathermal protons ( keV and keV) measured within (downstream) (upstream) minutes from the shock are reproduced with excellent accuracy. The upstream bi-modal structure of PAD, due to bi-directional streaming of nearly scatter-free protons, can be hardly accounted for by shock-reflected ions scenarios, and its smearing-out further upstream, emerges clearly and consistently with earlier works (e.g., Erdos & Balogh, 1994). A systematic search of spikes at IP shocks is therefore needed to clarify whether or not PAD bi-modality is more likely to emerge at high-obliquity shocks as early models suggest (Decker, 1983) or is also found at shocks with small obliquity propagating into highly turbulent SW. The prospect of measuring with Parker Solar Probe and Solar Orbiter a larger number of weak events close to the Sun with a very steep momentum spectrum (not many high energy particles) as compared to AU will help shed light on the role of km-scale of the magnetic structure in early-on phase of the particles acceleration at shocks.
Acknowledgements
Helpful comments from the anonymous referee are acknowledged. The work of FF was supported, in part, by NASA under Grants NNX15AJ71G and 80NSSC18K1213 and by NSF under grant 1850774. JG acknowledges support from NASA’s Parker Solar Probe Mission (contract NNN06AA01C), 80NSSC18K1213 and NSF grant 1735422. FF thanks Drs. Wimmer-Schweingruber and Heber for clarifications on PLASTIC and SEPT instruments, Dr. Yang for sharing PLASTIC data and Dr. L. Jian for comments on the manuscript. Computational resources supporting this work were provided by the Hipas supercomputer cluster at the University of Arizona. The STEREO/SEPT project is supported under Grant 50 OC 1702 by the German Bundesministerium für Wirtschaft through the Deutsches Zentrum für Luft- und Raumfahrt (DLR); the STEREO/PLASTIC by NASA grant 80NSSC20K0431. We acknowledge data providers(s), J. Luhmann at UCB/SSL and CDAWeb for providing visualisation tool for the high-resolution MAG time series.
Data availability
The STEREO/SEPT data underlying this article are publicly available at http://www2.physik.uni-kiel.de/stereo/index.php?doc=data. The 1/8 seconds resolution IMPACT/MAG data are publicly available at https://cdaweb.gsfc.nasa.gov/cgi-bin/eval3.cgi. The numerical code will be shared on reasonable request to the corresponding author.
References
- Armstrong et al. (1970) Armstrong T. P., Krimigis S. M., Behannon K. W., 1970, J. Geophys. Res., 75, 5980
- Axford & Reid (1963) Axford W. I., Reid G. C., 1963, J. Geophys. Res., 68, 1793
- Axford et al. (1977) Axford W. I., Leer E., Skadron G., 1977, International Cosmic Ray Conference, 11, 132
- Bell (1978) Bell A. R., 1978, MNRAS, 182, 147
- Blandford & Ostriker (1978) Blandford R. D., Ostriker J. P., 1978, ApJ, 221, L29
- Bruno & Carbone (2005) Bruno R., Carbone V., 2005, Living Reviews in Solar Physics, 2, 4
- Burgess et al. (2012) Burgess D., Möbius E., Scholer M., 2012, Space Sci. Rev., 173, 5
- Burlaga (1969) Burlaga L. F., 1969, Sol. Phys., 7, 54
- Decker (1983) Decker R. B., 1983, J. Geophys. Res., 88, 9959
- Decker & Vlahos (1986) Decker R. B., Vlahos L., 1986, ApJ, 306, 710
- Decker et al. (2005) Decker R. B., Krimigis S. M., Roelof E. C., Hill M. E., Armstrong T. P., Gloeckler G., Hamilton D. C., Lanzerotti L. J., 2005, Science, 309, 2020
- Desai & Giacalone (2016) Desai M., Giacalone J., 2016, Living Reviews in Solar Physics, 13, 3
- Desai et al. (2006a) Desai M. I., Mason G. M., Mazur J. E., Dwyer J. R., 2006a, Space Sci. Rev., 124, 261
- Desai et al. (2006b) Desai M. I., Mason G. M., Gold R. E., Krimigis S. M., Cohen C. M. S., Mewaldt R. A., Mazur J. E., Dwyer J. R., 2006b, ApJ, 649, 470
- Dmitruk et al. (2004) Dmitruk P., Matthaeus W. H., Seenu N., 2004, ApJ, 617, 667
- Ebert et al. (2016) Ebert R. W., Dayeh M. A., Desai M. I., Jian L. K., Li G., Mason G. M., 2016, ApJ, 831, 153
- Ellison et al. (1996) Ellison D. C., Baring M. G., Jones F. C., 1996, ApJ, 473, 1029
- Erdos & Balogh (1994) Erdos G., Balogh A., 1994, ApJS, 90, 553
- Fairfield (1974) Fairfield D. H., 1974, J. Geophys. Res., 79, 1368
- Fraschetti & Giacalone (2012) Fraschetti F., Giacalone J., 2012, ApJ, 755, 114
- Fraschetti & Giacalone (2015) Fraschetti F., Giacalone J., 2015, MNRAS, 448, 3555
- Fraschetti & Jokipii (2011) Fraschetti F., Jokipii J. R., 2011, ApJ, 734, 83
- Galvin et al. (2008) Galvin A. B., et al., 2008, Space Sci. Rev., 136, 437
- Giacalone (2005) Giacalone J., 2005, ApJ, 624, 765
- Giacalone (2017) Giacalone J., 2017, ApJ, 848, 123
- Giacalone & Jokipii (1999) Giacalone J., Jokipii J. R., 1999, ApJ, 520, 204
- Giacalone & Jokipii (2009) Giacalone J., Jokipii J. R., 2009, ApJ, 701, 1865
- Giacalone et al. (2000) Giacalone J., Jokipii J. R., Mazur J. E., 2000, ApJ, 532, L75
- Gieseler et al. (1999) Gieseler U. D. J., Kirk J. G., Gallant Y. A., Achterberg A., 1999, A&A, 345, 298
- Gosling et al. (1984) Gosling J. T., Bame S. J., Feldman W. C., Paschmann G., Sckopke N., Russell C. T., 1984, J. Geophys. Res., 89, 5409
- Greco et al. (2016) Greco A., Perri S., Servidio S., Yordanova E., Veltri P., 2016, ApJ, 823, L39
- Ipavich et al. (1984) Ipavich F. M., Gosling J. T., Scholer M., 1984, J. Geophys. Res., 89, 1501
- Ipavich et al. (1988) Ipavich F. M., Gloeckler G., Hamilton D. C., Kistler L. M., Gosling J. T., 1988, Geophys. Res. Lett., 15, 1153
- Isliker et al. (2017) Isliker H., Vlahos L., Constantinescu D., 2017, Phys. Rev. Lett., 119, 045101
- Jokipii (1966) Jokipii J. R., 1966, ApJ, 146, 480
- Jokipii (1982) Jokipii J. R., 1982, ApJ, 255, 716
- Jokipii & Coleman (1968) Jokipii J. R., Coleman Jr. P. J., 1968, J. Geophys. Res., 73, 5495
- Jokipii et al. (1993) Jokipii J. R., Kota J., Giacalone J., 1993, Geophys. Res. Lett., 20, 1759
- Jones et al. (1998) Jones F. C., Jokipii J. R., Baring M. G., 1998, ApJ, 509, 238
- Kahler et al. (2009) Kahler S. W., Tylka A. J., Reames D. V., 2009, ApJ, 701, 561
- Kajdič et al. (2019) Kajdič P., Preisser L., Blanco-Cano X., Burgess D., Trotta D., 2019, ApJ, 874, L13
- Koval & Szabo (2010) Koval A., Szabo A., 2010, Journal of Geophysical Research (Space Physics), 115, A12105
- Krymskii (1977) Krymskii G. F., 1977, Akademiia Nauk SSSR Doklady, 234, 1306
- Laitinen & Dalla (2017) Laitinen T., Dalla S., 2017, ApJ, 834, 127
- Laitinen et al. (2013) Laitinen T., Dalla S., Marsh M. S., 2013, ApJ, 773, L29
- Lario et al. (2003) Lario D., Ho G. C., Decker R. B., Roelof E. C., Desai M. I., Smith C. W., 2003, in Velli M., Bruno R., Malara F., Bucci B., eds, American Institute of Physics Conference Series Vol. 679, Solar Wind Ten. pp 640–643, doi:10.1063/1.1618676
- Lario et al. (2019) Lario D., Berger L., Decker R. B., Wimmer-Schweingruber R. F., Wilson L. B. I., Giacalone J., Roelof E. C., 2019, AJ, 158, 12
- Lee (1983) Lee M. A., 1983, J. Geophys. Res., 88, 6109
- Marhavilas et al. (2003) Marhavilas P. K., Sarris E. T., Anagnostopoulos G. C., Trochoutsos P. C., 2003, Advances in Space Research, 32, 525
- Mason et al. (2012) Mason G. M., Desai M. I., Li G., 2012, ApJ, 748, L31
- Matsumoto et al. (2015) Matsumoto Y., Amano T., Kato T. N., Hoshino M., 2015, Science, 347, 974
- Matthaeus et al. (2015) Matthaeus W. H., Wan M., Servidio S., Greco A., Osman K. T., Oughton S., Dmitruk P., 2015, Philosophical Transactions of the Royal Society of London Series A, 373, 20140154
- Mazur et al. (2000) Mazur J. E., Mason G. M., Dwyer J. R., Giacalone J., Jokipii J. R., Stone E. C., 2000, ApJ, 532, L79
- Mewaldt et al. (2007) Mewaldt R. A., et al., 2007, Space Sci. Rev., 130, 207
- Minnie et al. (2009) Minnie J., Matthaeus W. H., Bieber J. W., Ruffolo D., Burger R. A., 2009, Journal of Geophysical Research (Space Physics), 114, A01102
- Müller-Mellin et al. (2008) Müller-Mellin R., et al., 2008, Space Sci. Rev., 136, 363
- Neergaard Parker & Zank (2012) Neergaard Parker L., Zank G. P., 2012, ApJ, 757, 97
- Neergaard Parker et al. (2014) Neergaard Parker L., Zank G. P., Hu Q., 2014, ApJ, 782, 52
- Neugebauer & Giacalone (2005) Neugebauer M., Giacalone J., 2005, Journal of Geophysical Research (Space Physics), 110, A12106
- Qin et al. (2002) Qin G., Matthaeus W. H., Bieber J. W., 2002, ApJ, 578, L117
- Scholer (1985) Scholer M., 1985, Washington DC American Geophysical Union Geophysical Monograph Series, 35, 287
- Singer & Montgomery (1971) Singer S., Montgomery M. D., 1971, J. Geophys. Res., 76, 6628
- Tademaru (1969) Tademaru E., 1969, ApJ, 158, 959
- Terasawa et al. (2005) Terasawa T., et al., 2005, Journal of Geophysical Research (Space Physics), 110, A09S12
- Treumann (2009) Treumann R. A., 2009, A&ARv, 17, 409
- Tsurutani & Smith (1979) Tsurutani B. T., Smith E. J., 1979, J. Geophys. Res., 84, 2773
- Webb et al. (2009) Webb G. M., Kaghashvili E. K., le Roux J. A., Shalchi A., Zank G. P., Li G., 2009, Journal of Physics A Mathematical General, 42, 235502
- Wilson et al. (2017) Wilson L. B. I., Koval A., Szabo A., Stevens M. L., Kasper J. C., Cattell C. A., Krasnoselskikh V. V., 2017, Journal of Geophysical Research (Space Physics), 122, 9115
- Yang et al. (2020) Yang L., Berger L., Wimmer-Schweingruber R. F., Wang L., Yu J., Galvin A. B., Möbius E., 2020, ApJ, 888, L22
- Zank et al. (2015) Zank G. P., et al., 2015, ApJ, 814, 137
- Zhao et al. (2019) Zhao L. L., Zank G. P., Chen Y., Hu Q., le Roux J. A., Du S., Adhikari L., 2019, ApJ, 872, 4
- Zhdankin et al. (2013) Zhdankin V., Uzdensky D. A., Perez J. C., Boldyrev S., 2013, ApJ, 771, 124
- Zuo & Feng (2013) Zuo P.-B., Feng X.-S., 2013, Chinese Physics Letters, 30, 019601
- le Roux et al. (2007) le Roux J. A., Webb G. M., Florinski V., Zank G. P., 2007, ApJ, 662, 350
- le Roux et al. (2016) le Roux J. A., Zank G. P., Webb G. M., Khabarova O. V., 2016, ApJ, 827, 47