Network Analysis of the 2016 Presidential Campaign Tweets111Presented at International Conference on Computational Social Science IC2S2, July 12-15, 2018; Northwestern University’s Kellogg School of Management, Evanston, IL, USA
Abstract
We applied complex network analysis to tweets posted by
the 2016 presidential election’s principal participants in the
USA. We identified the stages of the election campaigns and the
recurring topics addressed by the candidates. Finally, we revealed
the leader-follower relationships between the candidates. We
conclude that Secretary Hillary Clinton’s Twitter performance was
subordinate to that of Donald Trump, which may have been one factor
that led to her electoral defeat.
Keywords: complex network analysis; political science;
twitter; community detection; presidential election
Introduction
Donald Trump has been an avid user of Twitter before, throughout, and in the aftermath of the 2017 USA presidential election campaign. Secretary Hillary Clinton, the Democratic Party candidate, was active on Twitter only from the beginning to the end of the campaign. This paper aims to reconstruct the campaign’s timeline and logic using complex network analysis of the tweets posted by Hillary Clinton, Ted Cruz, John Kasich, Marco Rubio, Bernie Sanders, Jill Stein, and Donald Trump.
Dataset
| Candidate | # of Tweets | Words per Tweet | Campaign | ||
|---|---|---|---|---|---|
| Start | Length (months) | End | |||
| Trump∗∗ | 9,984 | 22.4 | Mar 2015∗ | 22 | Dec 2016∗ |
| Stein | 6,215 | 26.6 | Jul 2015 | 12 | Dec 2016∗ |
| Clinton∗∗ | 6,082 | 21.6 | Apr 2015 | 20 | Nov 2016 |
| Cruz | 4,501 | 17.6 | Mar 2015∗ | 21 | Nov 2016 |
| Sanders | 4,385 | 25.4 | Mar 2015∗ | 22 | Dec 2016∗ |
| Kasich | 3,687 | 20.8 | Mar 2015∗ | 21 | Dec 2016∗ |
| Rubio | 2,933 | 19.0 | Apr 2015 | 15 | Aug 2016 |
| Total: | 26,733 |
We analyzed 27,000 tweets posted by Donald Trump and his contenders in January 2014–December 2017, covering the three major stages of their quest for the Presidency (Table 1). The tweets are composed of 14,373 distinct, unstemmed terms (words, word combinations, and hashtags). We selected only 300 base terms that occurred in the whole corpus at least 100 times for further analysis. We grouped the tweets by months into 48 tweet corpora and converted them into a network, based on the vocabulary’s similarity. Each network node represents a monthly corpus. We connected two nodes with a weighted edge if the base terms’ frequencies in the corresponding corpora were strongly correlated (with the Pearson correlation coefficient, serving as the edge’s weight, at or above 0.6).
Network of Tweets
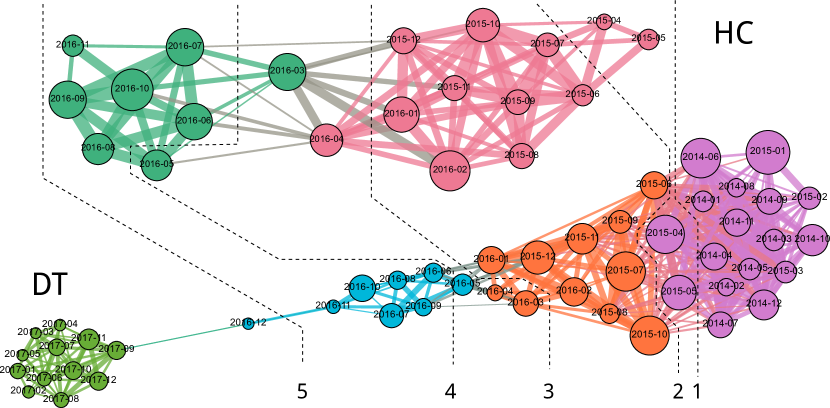
The resulting network of monthly tweet corpora (Figure 1) has an excellent community structure (with the Newman modularity [2]) that we revealed by applying the Louvain community detection algorithm [1]. We identified four distinct node clusters. The nodes in each cluster form a temporal continuum and correspond to the four campaign stages: January 2014–June 2015 (when Trump announced his intention to run); July 2015–April 2016; May 2016 (when Trump de facto won the Republican Party primary) to November 2016 (the general election); and December 2016–December 2017. We also observed that the average number of tweets per corpus decreased over time: from ca. 2,000 for the first two clusters to ca. 1,325 and ca. 870 for the next two clusters (the differences between the second and third and third and fourth clusters are statistically significant).
The resulting network is quasi-linear: 75% of the nodes are most strongly connected to the nodes representing the next or previous month, suggesting that, in general, the campaign timeline was semantically smooth. Only five nodes’ closest neighbors are more than two months apart.
In particular, we noticed the lack of correlation between December 2016 and January 2017 (when Trump officially became the POTUS). Instead, the December 2016 corpus correlates well with the corpora representing the second half of 2017 (July through October). We hypothesize that the discontinuity was caused by the unanticipated resistance from the judicial and legislative branches that Trump faced immediately after taking office, which put him in the uphill fight mode. Only in the second half of the year, especially after securing the Congress support for the tax reform, Trump realigned his tweets’ rhetorics. We will further look into more fine-grain, bi-weekly 2017 tweet corpora and their vocabulary to investigate this hypothesis.
We observed that the well-structured, quasi-linear network of monthly Trump tweet corpora matches the presidential election campaign’s calendar stages. To provide additional support to this observation, we applied the same analysis to Clinton’s (the other major participant of the campaign) tweets. Clinton’s Twitter corpus consists of ca. 6,400 tweets, 99% of which were posted between April 2015 and November 2016.
The corpus consists of two clusters: April 2015 (when Clinton announced her intention to run)–March 2016 and April 2016–November 2016 (the general election). Interestingly, the boundary between the clusters corresponds to the campaign stages, too—but those of Trump rather than Clinton. It is located in the middle of the Republican Party’s primary elections.
Topics Extraction
We hypothesize that Hillary Clinton was in the defensive position throughout the campaign and had to respond to Trump’s challenges, rather than form her agenda (at least on Twitter). To confirm our hypothesis, we look into the cross-correlations between the major presidential candidates’ tweet corpora to better understand their “leader-follower” relationship.
We automatically extracted the terms (hashtags, rare and significant words, and their bigrams and trigrams) from the tweets. We defined word eligibility based on the Corpus of Contemporary American English (COCA): a word is rare if it is not in the COCA or its frequency is less than 25. A word is significant if it occurs at least ten times, and its frequency is greater than 25. We identified 1,416 terms, such as “-john,” “2-party,” “2016,” “47246,” “ability,” “abolish,” “abolishtheirs,”, “abortion,” “absolutely,” “absurd,” …, “worried,” “worse,” “worst,” “worth,” “written,” “y’all,” “yesterday,” “youth,” “zero,” and “—hillary.”
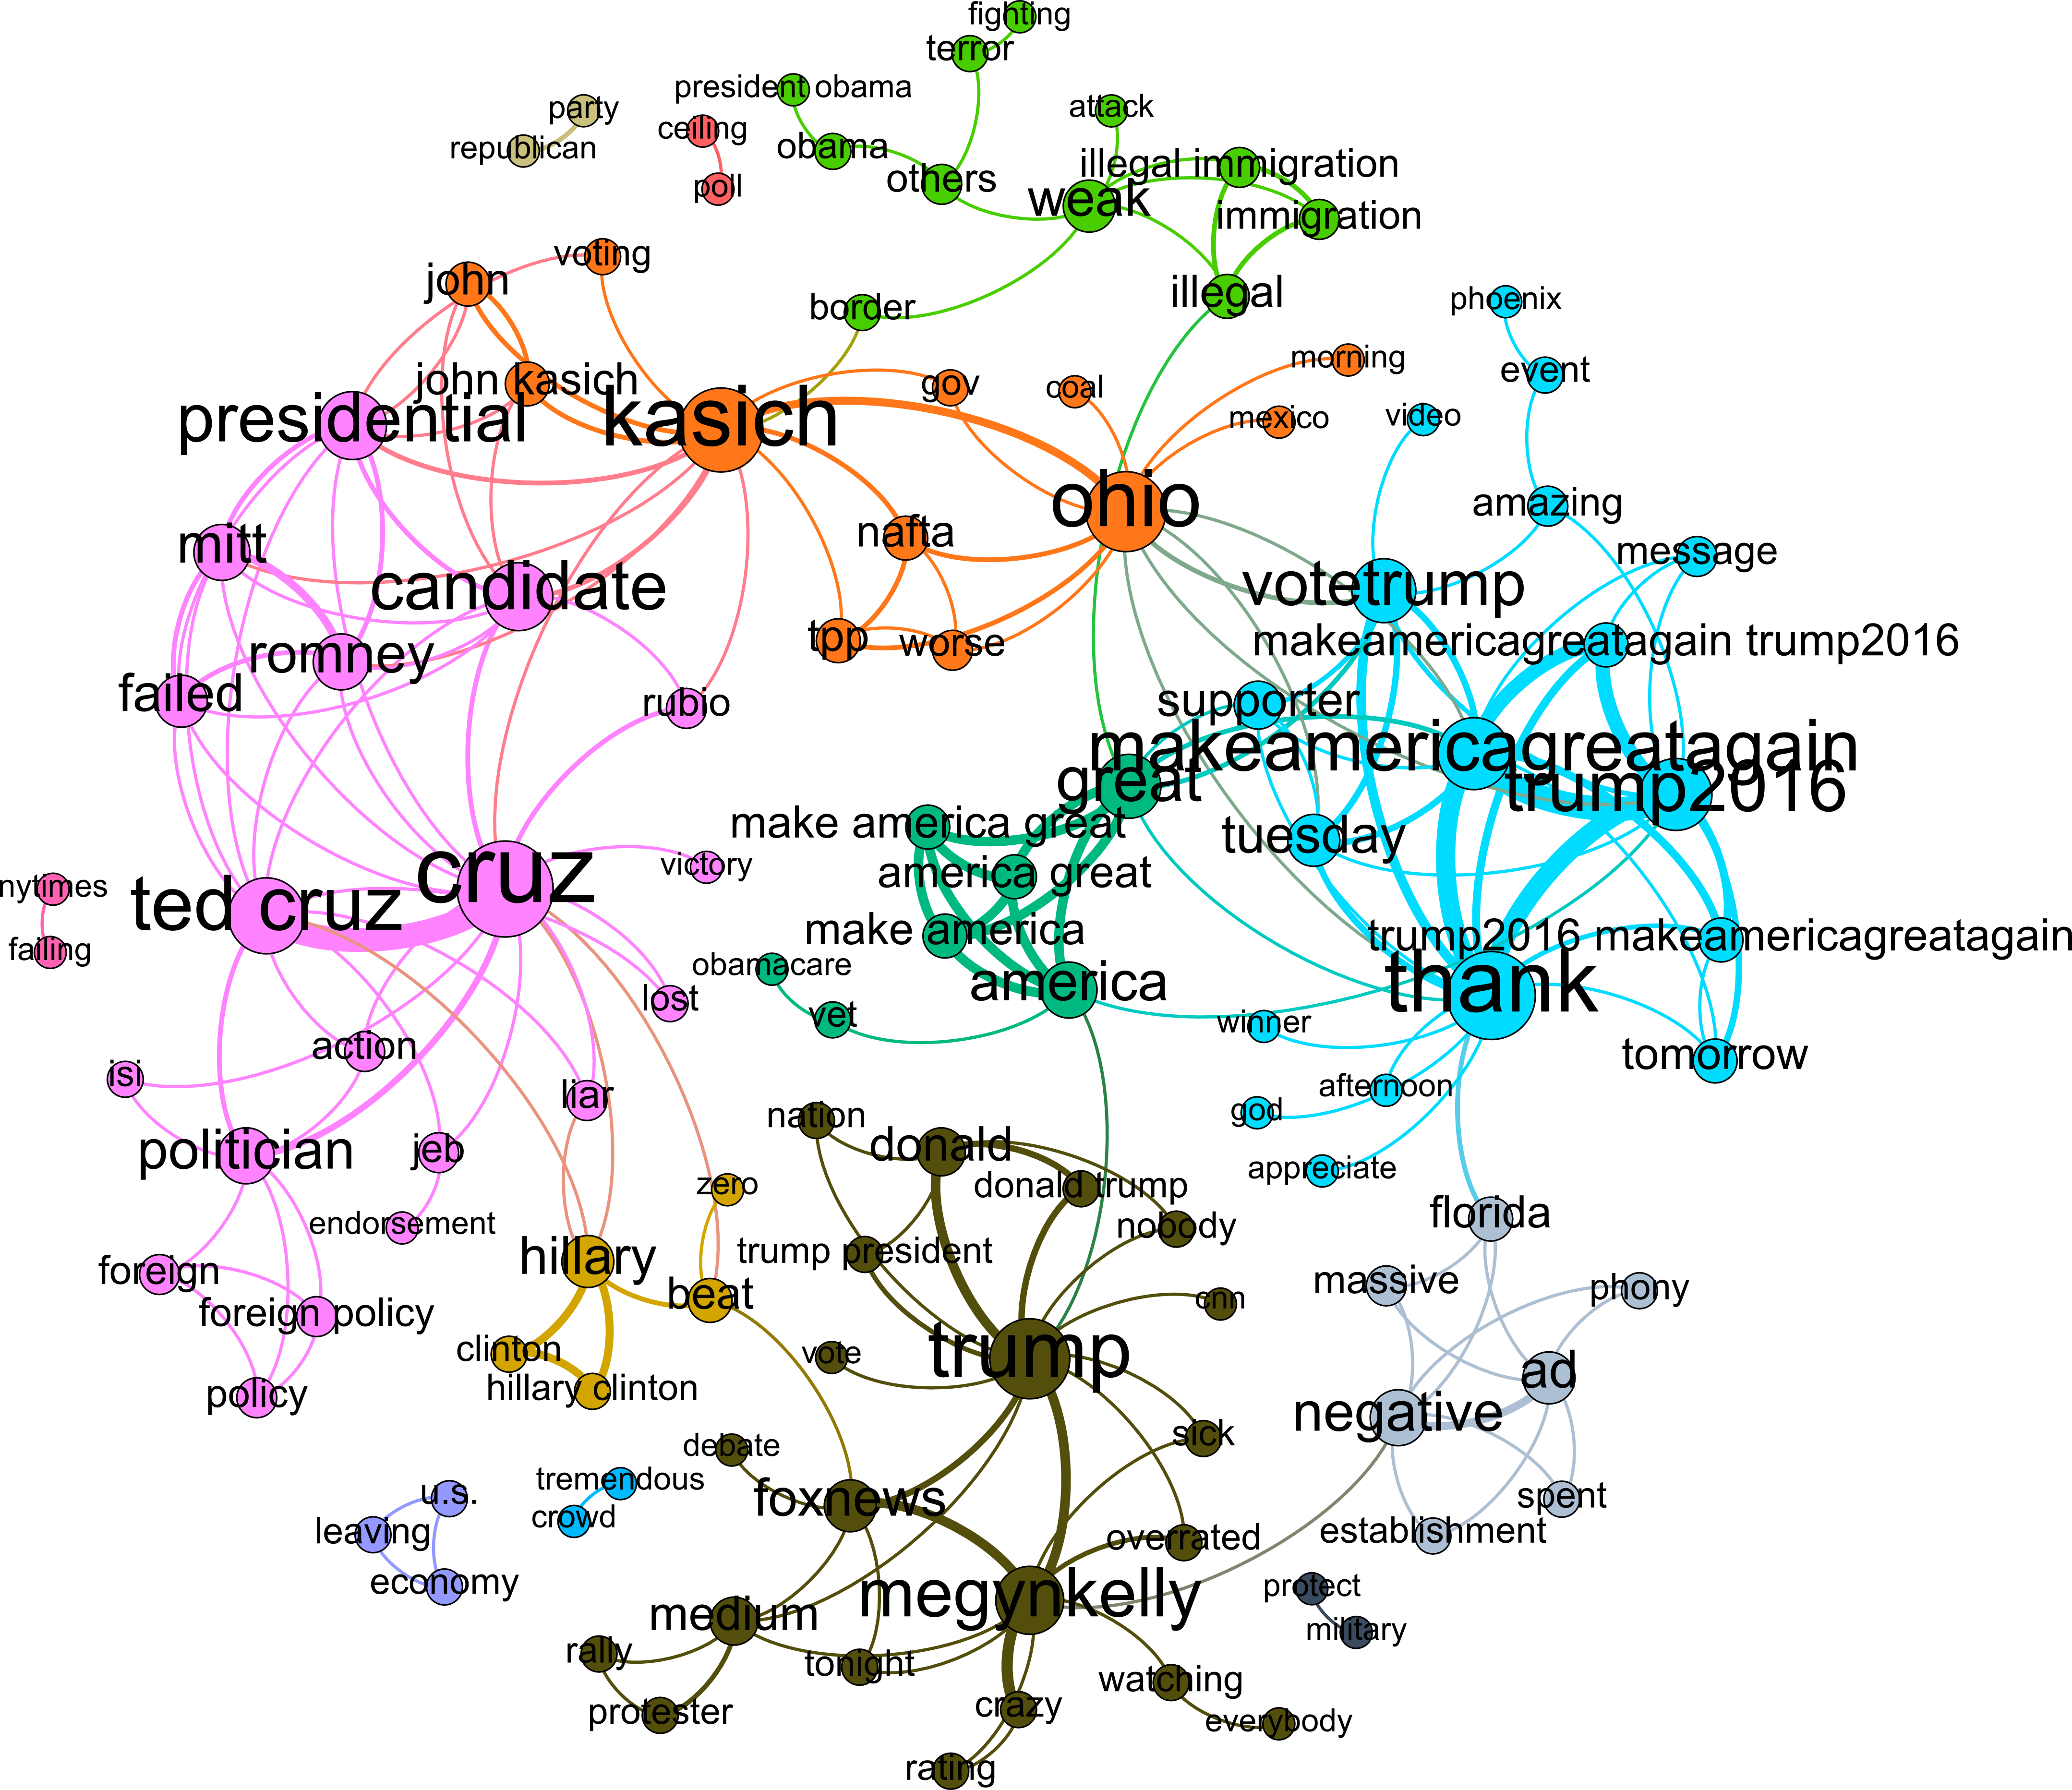
For each candidate and each biweekly subcorpus , we created 287 semantic networks of terms by treating the terms as nodes and their co-occurrence in the same tweet as edge weight. We applied the Louvain algorithm [1] to identify communities of terms addressed by each candidate over each two-week span, and ended up with 2,518 subtopics , where is the subtopic identifier. Figure 2 shows the sample semantic network for Donald Trump for the second half of March 2016. Note how he chiefly mentions Cruz and Kasich, merely notices Clinton, and ignores the other candidates.
We combined the subtopics that have a significant word overlap by constructing a weighted network of subtopics. We treat each subtopic as a node and use the Jaccard index as edge weight. We again apply the Louvain algorithm and identify seventeen recurring subtopics for all candidates and periods—the topics “as such.” Since a term may belong to more than one topic, we treat a topic as a fuzzy set. The following list shows the partial compositions of each topic in the order of decreasing frequency.
-
1.
hillary; campaign; trump; clinton; vote…
-
2.
america; great; make america; america great; make america great…
-
3.
obama; iran; immigration; president obama; terrorism…
-
4.
tonight; tune; sanders; town; town hall…
-
5.
wage; minimum; minimum wage; worker; living…
-
6.
forward; looking; looking forward; tomorrow; ticket…
-
7.
tax; policy; foreign; foreign policy; military…
-
8.
health; health care; obamacare; republican; drug…
-
9.
student; debt; student debt; economy; wall street…
-
10.
climate; climate change; fossil fuel; fuel; energy…
-
11.
failing; prayer; nytimes; thought; dishonest…
-
12.
justice; criminal; police; equality; officer…
-
13.
united; united states; citizen; america
-
14.
happy; birthday
-
15.
conservative; courageous conservative; courageous
-
16.
lesser evil; evil; lesser; greater
-
17.
god; bless.
Leadership and Followership
| Timespan | Partricipants/Leaders | Newcomers/Followers |
| 2015-08-02 | Sanders, Trump | Clinton |
| 2015-09-13 | Sanders | Rubio |
| 2015-09-27 | Sanders, Rubio | Clinton |
| 2015-10-11 | Clinton | Sanders |
| 2016-07-03 | Sanders, Stein | Clinton |
| 2016-09-11 | Sanders, Stein | Rubio |
| 2016-10-23 | Stein | Sanders, Clinton |
| 2017-01-01 | Sanders | Stein |
To track topics’ popularity, we looked at each recurring topic, each candidate, and each period, and calculated the Pearson correlation between the frequencies of the terms in the topic and in the subtopic for that span. If the correlation is high (), then the candidate consistently used the topic vocabulary over the time span. If the correlation is low (), then the candidate disregarded the topic vocabulary over the period. To track followers and leaders, we check, for each candidate, topic, and period, whether the candidate covered the topic during that period, but not during the previous period (two weeks ago). If so, then the candidate followed other candidates who had covered the same topic two weeks ago. Those candidates are the leaders. (See Table 2.)
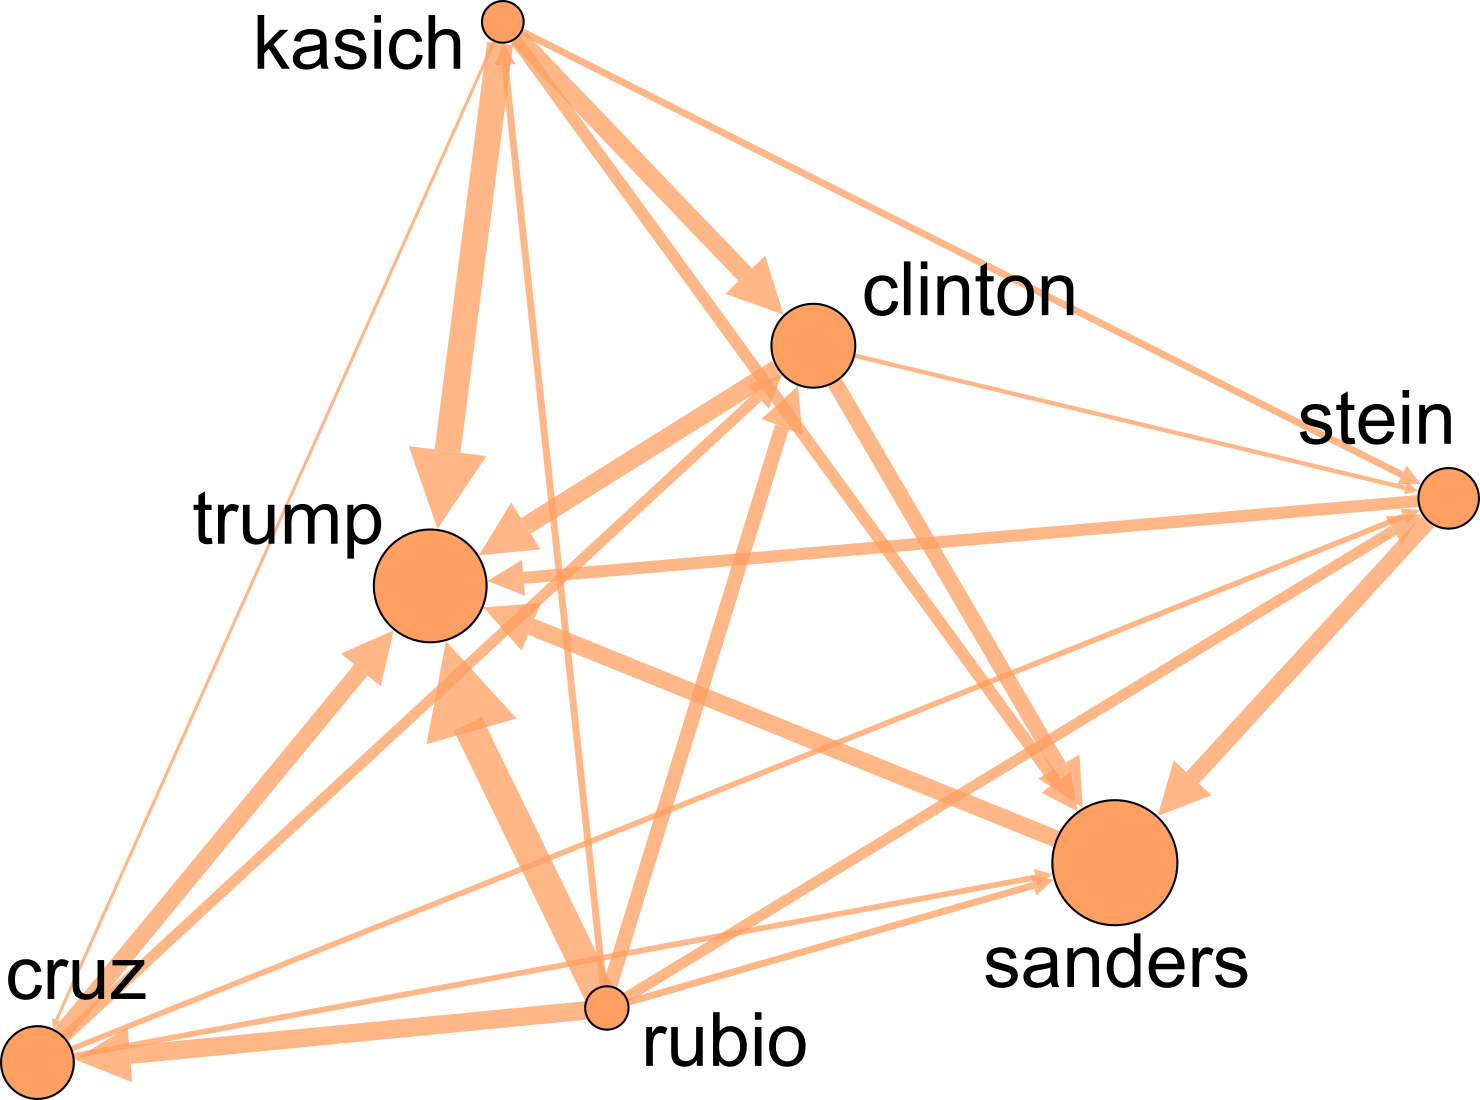
As a result, we can construct yet another weighted directed network bases on who followed whom and how many times (Figure 3). The network clearly illustrates that the most followed presidential candidate was Donald Trump. He rarely followed anyone else, unlike his principal competitors: Hillary Clinton and Bernie Sanders. The least followed candidates are John Kasich and Marco Rubio.
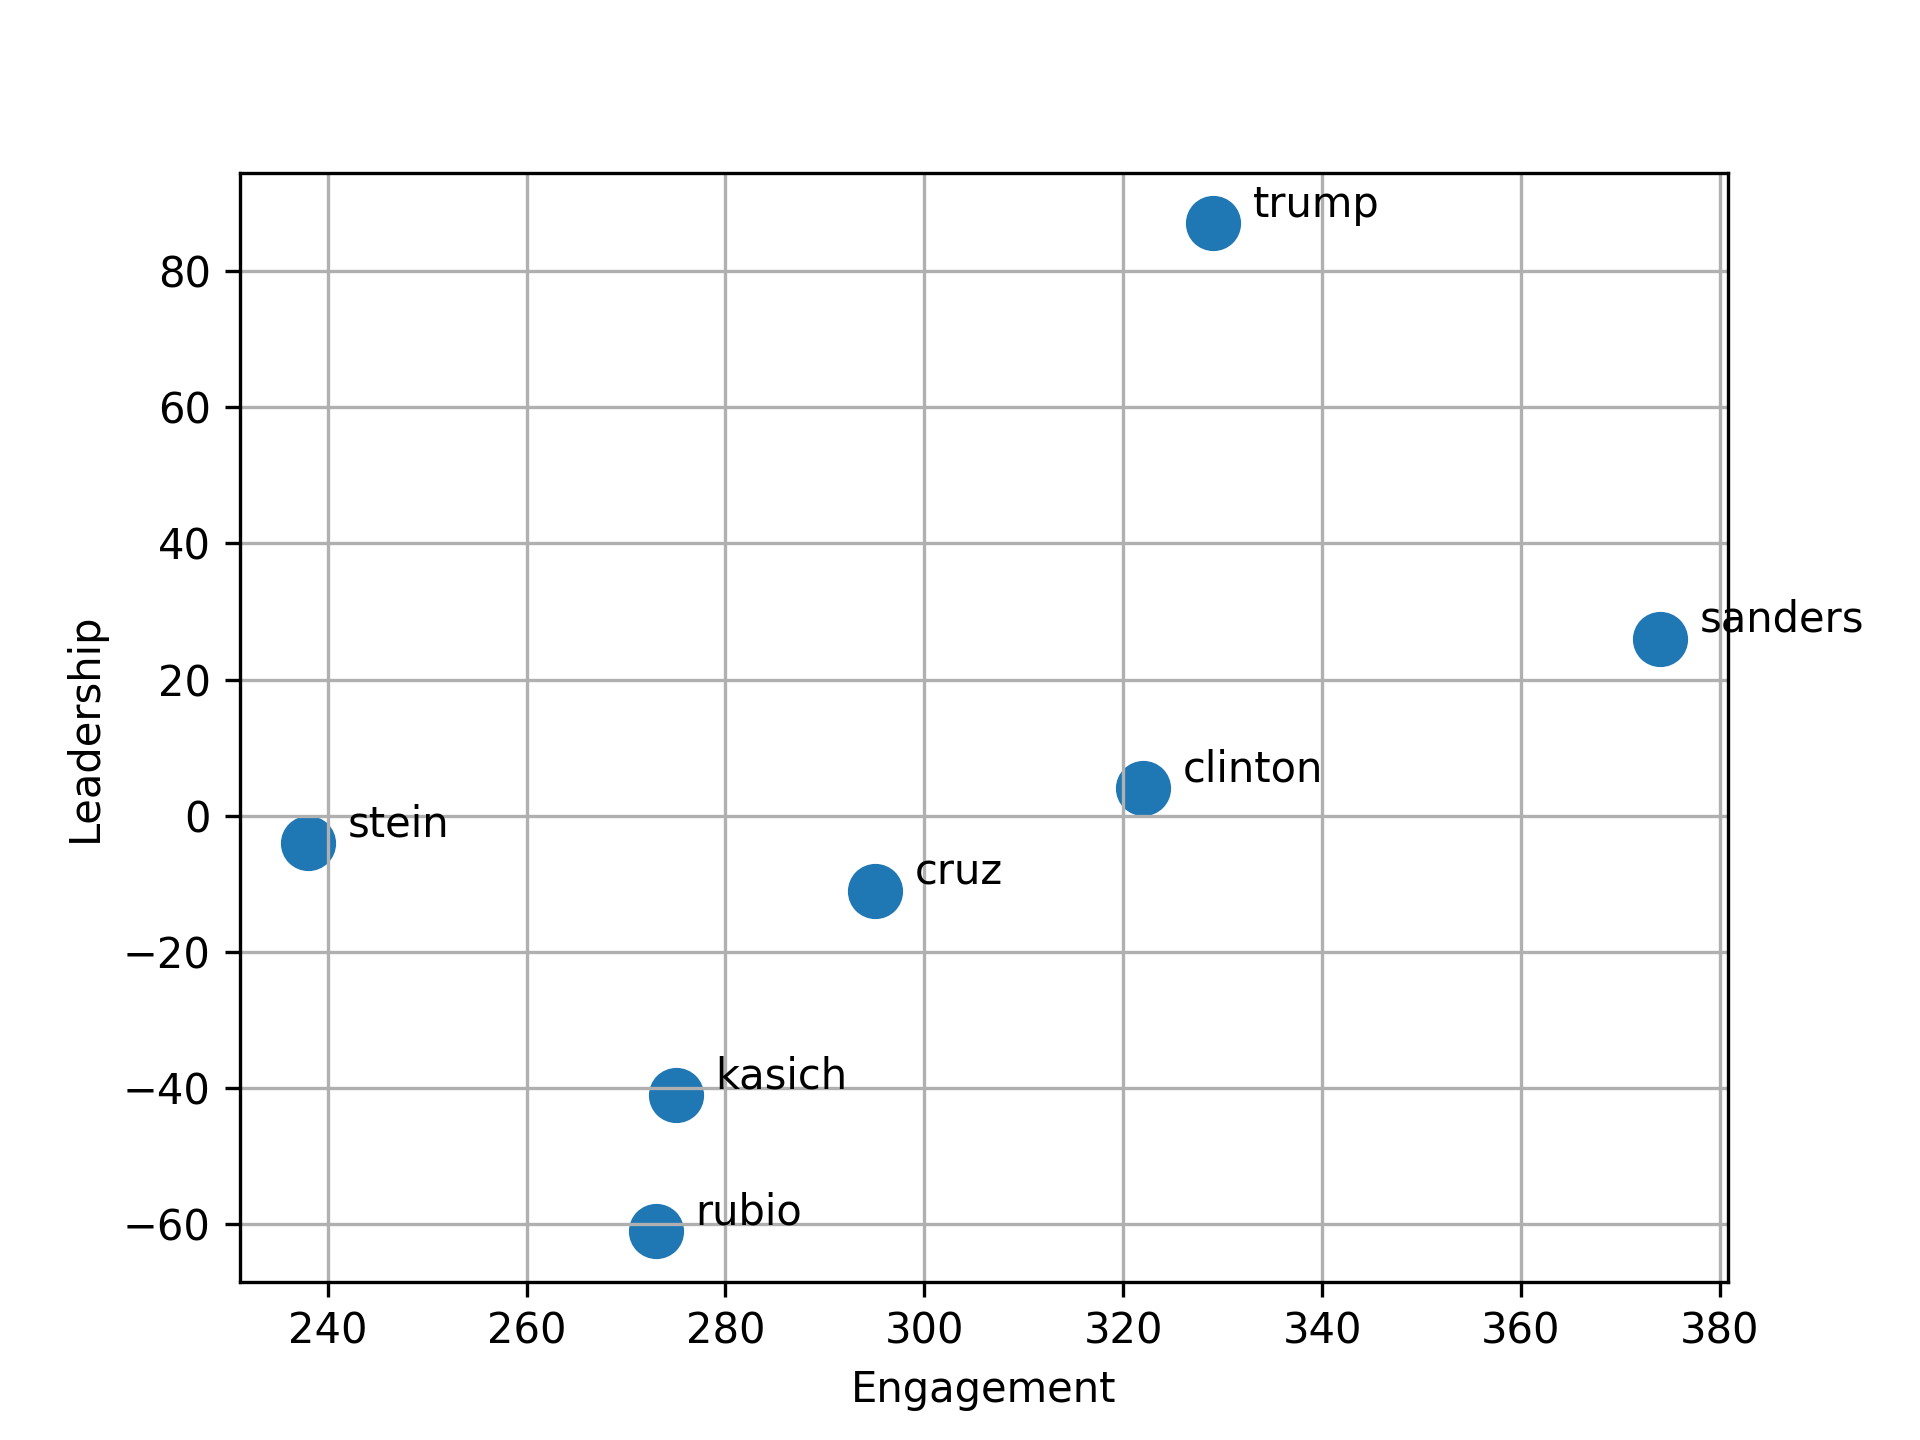
Finally, we introduce measures of engagement and leadership. We define leadership as the number of biweekly spans when a candidate is followed by other candidates, minus the number of spans when the candidate follows other candidates. Leadership can be positive or negative. Similarly, we define engagements and the total number of spans when the candidate follows or is being followed—that is, is engaged in an implicit or explicit conversation with the other candidates. The engagement is always strictly positive.
Figure 4 shows the leadership and engagement scores for each candidate. Three candidates stand apart from the pack: Donald Trump with the highest leadership score (consistent with Figure 3), Bernie Sanders with the highest level of engagement, and Jill Stein with a shallow level of engagement.
Conclusion
We applied complex network analysis to the tweets posted by the principal participants of the 2016 presidential election campaign in the USA. We revealed recurrent topics of the candidates’ tweets and the leader/follower relationships between the candidates. The number of the recurring topics owned or shared by the candidates over the campaign timeline is low: only seventeen, dealing with President Obama’s heritage, America in general, healthcare, minimum wages, taxation, student debt, etc. Trump and Sanders were the most followed candidates, while Kasich and Rubio were the least followed candidates. Simultaneously, Trump was the most followed and the second most engaged candidate, which may have partially redetermined his victory.
Acknowledgment
The author is grateful to Elena Llaudet (Suffolk University, Boston) for her helpful suggestions.
References
- [1] Blondel, V., Guillaume, J.-L., Lambiotte, R., and Lefebvre, E. Fast Unfolding of Communities in Large Networks. J. of Statistical Mechanics: Theory and Experiment, 10 (2008), 1000.
- [2] Newman, M. Modularity and community structure in networks. Proceedings of the National Academy of Sciences of the United States of America 103, 23 (2006), 8577–8696.