Modified MIT Bag Models - part II:
QCD phase diagram and hot quark stars
Abstract
In the present work we use the modified versions of the MIT bag model, on which both a vector field and a self-interacting term are introduced, to obtain hot quark matter and to investigate the QCD phase diagram. We first analyze two-flavored quark matter constrained to both the freeze-out and the liquid-gas phase transition at the hadronic phase. Later, three-flavored quark matter subject to equilibrium and charge neutrality is used to compute quark star macroscopic properties, which are confronted with recent observational massive and canonical star radius results. Finally, a comparison with QCD phase diagrams obtained from the Nambu-Jona-Lasinio model is performed.
pacs:
21.65.Qr, 12.39.KiI Introduction
One of the most important features of the quantum chromodynamics (QCD) is the asymptotic freedom, which predicts that strongly interacting matter undergoes a phase transition from hadrons (constituted of confined quarks) to deconfined quarks and gluons - the quark gluon plasma (QGP) - at some high temperature as well as high density Fukushima ; Gross . Therefore, the correlation between two external parameters arises: for a fixed temperature, what is the density (or equivalently, the baryon chemical potential), at which the phase transition occurs in equilibrium QCD?
To study the QGP as well as the hadron-quark phase transition several experiments have been proposed and performed in recent years at LHC, RICH and others Agakishiev ; Adam ; Abelev1 ; Abelev2 . Studying Au+Au and Pb+Pb collisions, Cleymans Cleymans was able to trace the chemical freeze-out line, obtained when inelastic collisions between particles cease such that the abundance ratios do not change anymore Mun . Although the chemical freeze-out is not directly related to the hadron-quark phase transition, the hadron multiplicities in central high energy nucleus-nucleus collisions are established very close to the phase boundary between hadronic and quark matter Mun2 , especially at very low baryon chemical potential, when the chemical freeze-out temperature and the critical temperature are expected to lie at the same error bar Mun2 ; Kar . Moreover, the chemical freeze-out is expected to be a pure hadronic process, therefore, its trace needs to be in the hadron phase. This feature acts as a constraint for hadron-quark phase transition modeling.
In the standard model, the tool to describe strong interacting matter is the QCD. For low chemical potential and high temperature, the lattice QCD (LQCD) can be employed yielding satisfactory results. For instance, LQCD predicts the existence of a smooth crossover around a temperature of 160 MeV at low chemical potentials, while at higher densities a first order phase transition Aoki ; Bell ; Luo is generally obtained from effective models. Furthermore, the first order phase transition must end at an unique point where a second order phase transition takes place, the critical end point (CEP), although its existence and exact location are not well-established Bazavov1 ; Bazavov2 . Another important region in the QCD phase diagram is the liquid-gas instability region related to nuclear fragmentation Finn ; Agostino ; Debora2001 . For low temperatures and chemical potential, the nucleons are confined into the nuclei Motornenko , which can be regarded as a liquid phase. As the temperature increases, the nuclei start to dissolve into a diluted interacting gas of nucleons. A critical temperature, above which only the gas phase survives, is expected Elliott . Like the chemical freeze-out, the liquid-gas phase transition is a pure hadronic process, where the contribution from the quark degrees of freedom can be neglected. Nevertheless, the region expected to undergo this phase transition can also be used as a constraint.
In this work we use the modified versions of the MIT bag model, as originally introduced in ref. Carline - on which a vector field is added in a minimal coupling scheme, as well as a self-interacting term that mimics the contribution from the quark Dirac sea Dirac - to study the QCD phase diagram and hot quark matter. We start considering symmetric two-flavored quark matter, , and check if we can fit both the freeze-out and the liquid-gas phase transition at the hadronic phase. Then, we verify if it is possible to fulfill these constraints alongside the existence of stable strange quark matter (SQM) as proposed by the Bodmer-Witten conjecture Bod ; Witten . If this is true, therefore, the nuclear matter as we know, made of protons and neutrons is only meta-stable, and the true ground state of all matter are not the baryons but three-flavored deconfined quark matter ().
The next step is to construct a QCD phase diagram for three-flavored quark matter in equilibrium and zero electrical charge using the modified versions of the MIT bag model. At , this study is important if one wants to describe quark (or strange) stars, as well as quark matter in the core of massive hybrid stars Nature2020 . In the case where the strange quark is present, there are two possibilities for the strength of its interaction with the vector field: an universal coupling, when the strength of the quark is equal to the and quarks, and one that we calculated from the group theory approach that fixes the quark coupling constant to 2/5 of the and quarks Carline . In all cases, we impose that stable three-flavored quark matter needs to reproduce massive pulsars like MSP J070+6620 Cromartie . Another important constraint is the radius of the canonical 1.4 M⊙ neutron star. A recent study using multi-messenger observations indicates that this radius is in the range of 10.4 km to 11.9 km Capano , although less restrictive constraints using X-ray telescopes have not been discarded Riley ; Miller .
However, it must be clear that although the results coming from ref. Riley ; Miller ; Capano are observational constraints, they still use some nuclear model to fit the data. Therefore the limit value of 11.9 km must be faced with care.
As will become clear in the manuscript, for reasonable values of the bag pressure parameter, the MIT bag model and its extensions are not suitable to describe quark matter at low chemical potential and high temperature, once its critical temperature is far below those (pseudo) temperatures predicted by LQCD Aoki ; Bazavov1 ; Bazavov2 , as well as the experimental line of the chemical freeze-out Cleymans . Due to these facts, inspired by an old recipe Muller ; Dey , we propose a simple parametrization for the Bag, where it increases with temperature. With this simple modification we are able to produce massive quark stars and ensure that the freeze-out and liquid-gas phase transition happen in the confined phase. At the end we study the effects of finite temperature on hot quark stars (with a fixed temperature of 40 MeV) and on the speed of the sound of the quark matter. Finite temperature is important at the early stages of a quark star and in the quark core of a massive proto-hybrid star. A recent study suggests that the presence of quark matter is linked to the behaviour of the speed of sound in massive hybrid stars Nature2020 .
It is also worth pointing out that in the limit of vanishing quark masses the QCD Lagrangian presents chiral symmetry Buballa2005 . Although at low energy scale this symmetry is dynamically broken, it is restored at high energy scales. Besides, for low temperature and high chemical potentials, the existence of a color superconducting phase is possible. Some studies indicate that the related gaps in the fermion spectrum could be of the order of 100 MeV Alford . Both features are beyond the QCD characteristics that one can study using the MIT-like models presented in this work, but for the sake of comparison, we add a section where results obtained with the Nambu–Jona-Lasinio model Nambu are shown and commented.
II Formalism
The MIT bag model considers that each baryon is composed of three non-interacting quarks inside a bag. The bag, in turn, corresponds to an infinity potential, which confines the quarks. In this simple model the quarks are free inside the bag and are forbidden to reach out. All the information about the strong force lies in the bag constant, also called the vacuum pressure. The MIT Lagrangian density reads MITL :
| (1) |
where is the quark mass running from , and , whose values are 4 MeV, 4 MeV and 95 MeV respectively smass ; is the Dirac quark field, is the constant vacuum pressure and is the Heaviside step function that is included to assure that the quarks exist only confined inside the bag.
As in ref. Carline , we introduce a quark interaction via minimal coupling described by a vector channel analogous to the meson in quantum hadrodynamics:
| (2) |
as well as the mass term and a self-interaction on the vector field:
| (3) |
where is the coupling constant of the quark with the vector field . As pointed out earlier, there are two possibilities: an universal coupling with , as well as a ratio that comes from symmetry group calculations Carline : ; is the mass of the vector field, taken to be 780 MeV, is a dimensionless parameter to modulate the self-interaction of the vector field, and for short.
Now, assuming mean field approximation (MFA) (), we obtain the eigenvalue for the energy of the quarks and the equation of motion for the field, respectively:
| (4) |
where the term was replaced by the number density for the quark.
Now, quarks are Fermions with spin 1/2, then the number density, the pressure and the energy density of the quark matter can be obtained via Fermi-Dirac distribution Greiner :
| (5) |
| (6) |
| (7) |
where = 3 is the number of colors. The Bag contribution, as well as the contribution of the vector field to the energy density and the pressure are easily obtained through the Hamiltonian:
| (8) |
and
| (9) |
with being the Fermi-Dirac distribution of the quarks (anti-quarks), given by:
| (10) |
Here, and is the effective chemical potential.
III Phase diagram and quark stars
We start by studying how the vector field as well as the self-interacting term influence the QCD phase diagram obtained with the modified MIT model for different bag pressure values. In MIT-based models the interpretation of the QCD phase diagram is simple: for low values of temperature and chemical potential we have confined quarks, indicated by a negative pressure due to the bag . This is the hadronic phase. When matter is heated, light hadrons, preferentially pions, are created thermally, which increasingly fill the space between the nucleons. Because of their finite spatial extent, the pions and other thermally produced hadrons begin to overlap with each other and with the bags of the original nucleons such that a network of zones with quarks, anti-quarks, and gluons is formed. At a certain critical temperature these zones fill the entire volume in a “percolation” transition. This new state of matter is the quark-gluon plasma (QGP) Mun . A similar picture emerges when matter is strongly compressed. In this case the nucleons overlap at a critical number density and form a cold degenerate QGP consisting mostly of quarks. Therefore, in our work the transition line between confined quark matter and QGP is indicated by . It is important to point out that, although in our MIT-based model we always treat it as a first order phase transition, at low chemical potential the LQCD predicts a smooth crossover.
Before we proceed, we introduce some definitions. As in our work and are always equal (and called only for short), we define as the ratio between and . Also, the strength of the vector channel is directly related to , so we define as this quantity:
| (11) |
 |
 |
 |
 |
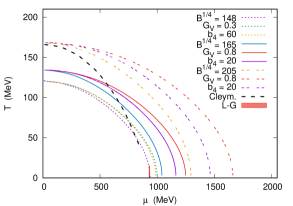
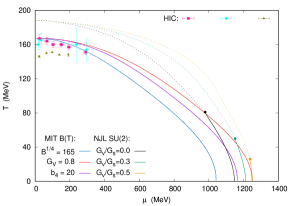
We start with two-flavored symmetric matter with to make a direct comparison with the chemical freeze-out as presented in ref. Cleymans , as well as with the liquid-gas phase transition. We use three different values for the bag parameter, = 148 MeV, 165 MeV and 205 MeV. = 148 MeV is the lowest allowed value for non-interacting bag model because even lower values would predict stable matter. A good model to simulate the hadron-quark phase transition needs to ensure that both the chemical freeze-out and the liquid-gas phase transition lie in the confined (hadronic) phase. At we also expect that the phase transition takes place at values of the chemical potential at least higher than MeV, as shown in ref. Fukushima using the Polyakov loop formalism. Also, using NJL-based models, the works of ref. Buballa2005 ; Ruster indicate that the critical chemical potential is around 1080 MeV to 1100 MeV. There is no experimental evidence of the maximum chemical potential which preserves the hadronic phase, however, a recent study points out that quark matter inside massive neutron stars is not only possible but probable Nature2020 . Using chiral bag model with B1/4 = 170 MeV, ref. Klahn3 found a critical chemical potential around 1250 MeV. For -stable matter, using relativistic density functional approach, ref. Ayriyan indicates that it should occur around MeV; for two-flavored symmetric matter we assume a maximum value of MeV as a more conservative estimate. Also, there are strong evidences that the (pseudo) critical temperature obtained from LQCD is very close to the critical temperature of chemical freeze-out Mun3 . Once these constraints are investigated, we proceed by checking whether the model is able to reproduce massive quark stars, and if the parameters are in favor or against the Bodmer-Witten conjecture of stable strange matter, i.e., the energy per baryon of strange matter must be below 930 MeV Bod ; Witten ; Carline .
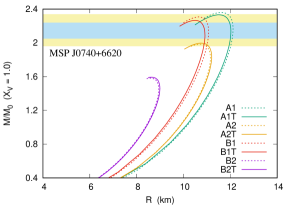
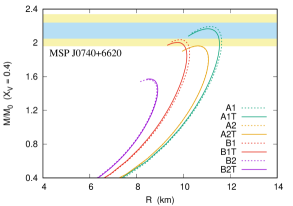
Moreover, for each bag pressure value there are also three possibilities: the original MIT bag model without any interaction, a vector channel via minimum coupling and a vector channel with minimal coupling alongside a self-interacting term to simulate the quark Dirac sea contribution. In order to reproduce massive quark stars, we use here fm2 for a bag pressure value of = 148 MeV, and . For = 165 MeV and 205 MeV, we use fm2 and . Notice that the self-interacting term depends on both, and as shown in Eq. (3). The results are presented in Fig. 1. We also use these values and construct the equation of state (EoS) of a -stable matter with zero electrical charge, namely Rhabi :
| (12) |
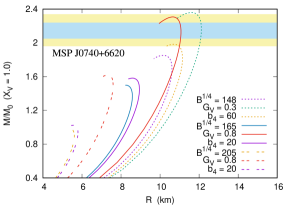
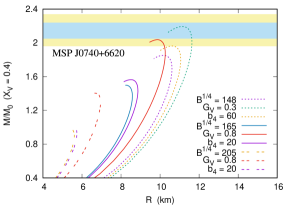
We then use the EoS at zero temperature as an input to the TOV equations TOV to produce the mass-radius diagram. The results for different values of are presented in Fig. 2, as well as the MSP J070+6620 pulsar, whose mass range is at 68 % credibility interval (light blue ) and 2.14 at 95 % credibility interval (light yellow) Cromartie . We also display in Fig. 3 the phase diagrams for three-flavored -stable matter. Although zero temperature is generally assumed for calculations of stable neutron and quark stars, higher temperatures can be important in the early stages of the proto-star. For instance, the neutron matter deconfinement occurs on a strong interaction time scale of s Benvenuto , while the chemical equilibrium happens at a weak time scale of s. On the other hand, the cooling of the newborn neutron star by neutrino diffusion takes a few seconds Lattimer . Therefore, the phase diagram for values up to MeV in neutral -stable matter is important Debora2004 . For higher temperatures the discussion is more pedagogical, once we do not expect -stable matter in this region Gupta ; Rafa2008 .
| - | two-flavored matter | three-flavored -matter | same | ||||||||||||
| B1/4 (MeV) | (fm2) | (MeV) | (MeV) | Cleymans? | L-G? | ? | () | (km) | 1.96? | ? | SQM? | ||||
| 148 | - | 0.0 | 0.0 | 121 | 938 | No | No | No | 1.85 | 10.36 | 105 | 866 | No | No | Yes |
| 165 | - | 0.0 | 0.0 | 134 | 1040 | No | Yes | No | 1.50 | 8.58 | 117 | 962 | No | No | No |
| 205 | - | 0.0 | 0.0 | 168 | 1296 | Yes | Yes | Yes | 0.98 | - | 145 | 1187 | No | No | No |
| 148 | 1.0 | 0.3 | 0.0 | 121 | 1000 | No | Yes | No | 2.36 | 11.15 | 105 | 938 | Yes | Yes | No |
| 148 | 1.0 | 0.3 | 60 | 121 | 987 | No | Yes | No | 1.99 | 10.73 | 105 | 924 | Yes | Yes | Yes |
| 165 | 1.0 | 0.8 | 0.0 | 134 | 1249 | No | Yes | Yes | 2.31 | 10.20 | 117 | 1186 | Yes | No | No |
| 165 | 1.0 | 0.8 | 20 | 134 | 1163 | No | Yes | Yes | 1.58 | 8.94 | 117 | 1091 | No | No | No |
| 205 | 1.0 | 0.8 | 0.0 | 168 | 1662 | Yes | Yes | No | 1.62 | 7.60 | 145 | 1575 | No | No | No |
| 205 | 1.0 | 0.8 | 20 | 168 | 1464 | Yes | Yes | No | 1.02 | - | 145 | 1364 | No | - | No |
| 148 | 0.4 | 0.3 | 0.0 | 121 | 1000 | No | Yes | No | 2.19 | 10.93 | 105 | 915 | Yes | Yes | Yes |
| 148 | 0.4 | 0.3 | 60 | 121 | 987 | No | Yes | No | 1.96 | 10.67 | 105 | 914 | Yes | Yes | Yes |
| 165 | 0.4 | 0.8 | 0.0 | 134 | 1249 | No | Yes | Yes | 2.04 | 9.78 | 117 | 1111 | Yes | No | No |
| 165 | 0.4 | 0.8 | 20 | 134 | 1163 | No | Yes | Yes | 1.56 | 8.86 | 117 | 1055 | No | No | No |
| 205 | 0.4 | 0.8 | 0.0 | 168 | 1662 | Yes | Yes | No | 1.41 | 6.72 | 145 | 1442 | No | No | No |
| 205 | 0.4 | 0.8 | 20 | 168 | 1464 | Yes | Yes | No | 1.00 | - | 145 | 1320 | No | - | No |
From Fig. 1 we can see that when there is no interaction term, increasing bag pressure values favor the hadron phase. The higher the value, the higher both the critical temperature and the critical chemical potential are. The vector field causes an additional repulsion, increasing the critical chemical potential. However, as shown in Eq. (4), the vector channel couples to the density and causes very little effects at low chemical potential. Indeed, the vector field does not change the critical temperature for = 0. The self-interacting term reduces the repulsion at large densities. In our previous work Carline , we have used low values of to not change the stability window, but here we relax this condition in order to study the strong coupling effects. We see that for = 148 MeV (the only value in this work with which it is possible to reproduce SQM) the critical temperature for zero chemical potential is 121 MeV. This value is way lower than the experimental results from chemical freeze-out Cleymans and the LQCD Bazavov1 ; Bazavov2 . At the low temperature limit, we see that without the vector channel, even the region related to the liquid-gas phase transition is not fully contained in the hadron phase. We overcome this issue by adding the vector field, but it is not enough to push the critical chemical potential for values larger than 1000 MeV, which is still below the minimum of 1050 MeV. For = 165 MeV, the critical temperature at zero chemical potential is 134 MeV, which is still not enough to match the LQCD and freeze-out results. Without the vector channel, the critical potential at zero temperature is 1040 MeV, but with as well as with the term, the critical chemical potential is always in the range of MeV MeV. Finally, for = 205 MeV we have both the freeze-out line and the LQCD results in agreement with our model, i.e. the lines are contained in the confined (hadronic) phase. But the vector channel pushes the critical chemical potential for values above 1400 MeV.
Although = 205 MeV seems to describe reasonably well the low chemical potential region of the QCD phase diagram, it can be seen from Fig. 2 that it results in quark stars of very low masses. Indeed, in most cases the maximum mass barely reaches 1.0. With = 148 MeV we are able to reproduce a 2.19 quark star within the SQM conjecture and a 2.36 in general. For = 165 MeV a maximum mass of 2.31 arises, a result very close to 2.36 with = 148 MeV. However, although the maximum masses are very close, there is a huge difference on the radii of the canonical stars. For = 148 MeV a radius of 11.15 km is obtained, while for = 165 MeV the radius is only 10.20 km, about 1 km smaller. The vector channel can help to differentiate the values of the bag pressure, even with similar maximum masses. The radii are very sensitive to the bag pressure value. We also see that the maximum mass is sensitive to in absence of the self interacting term. Within a strong coupling constant , the effect of is secondary. Indeed, the self-interacting term makes the results closer to the ones obtained with the non-interacting quark gas than the ones with the vector field only. Another important feature is the radius of the canonical star. We see that the only models whose radii are 10.4 km11.9 km Capano are those with bag equal to 148 MeV, which is within (or very close to) the stability window of SQM Carline . Bag pressure values that are far from the stability window produce too low radii, even if their maximum masses are compatible with the MSP J070+6620 Cromartie .
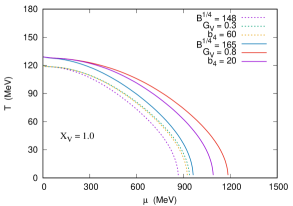
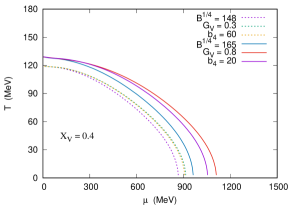
Finally, from Fig. 3 we see that the -stable matter disfavors the hadronic phase when compared with symmetric two-flavored matter at Fig. 1, as it always produces a lower value for the critical temperature (at zero chemical potential), as well as a lower value for the critical chemical potential (at zero temperature). Also, when we compare = 1.0 to = 0.4 we see that higher values of push the critical chemical potential to higher values.
The results of this section are summarized in Tab. 1, where the critical temperature and chemical potential in two and three-flavored matter are presented, the constraints discussed in the text from both freeze-out and neutron stars observations and what parametrizations give us a SQM for . We also need to notice that not all the EoS satisfy the Bodmer-Witten conjecture.
IV Temperature-dependent bag model
It is clear from the last section that we are not able to reproduce both the freeze-out critical temperature and massive quark stars. Even if we increase the value of for = 205 MeV, it pushes the critical chemical potential even further, in disagreement with the probable existence of a quark core as presented in ref. Nature2020 , and reproduces quark stars with too low radii, in disagreement with the measurements from ref. Capano . Because of these behaviors, different bag pressure values are generally used for different energy scales. When the interest lies in the low chemical potential, a bag pressure value higher than 200 MeV is employed, while for constructing quark stars, values around 150-170 MeV are generally used Rafa2011 ; Pedro . Hence, it makes it impossible to use a single bag pressure value to describe the whole energy spectrum with MIT-based models. We then propose an alternative, a temperature dependent bag model, a prescription that is not new. For instance, ref. Bhalerao uses a temperature dependent bag model derived from QCD sum rules and ref. Muller ; Dey introduce a phenomenological temperature dependence in the bag constant, which reads:
| (13) |
where is a free parameter. However, as noted in ref. Prasad , this bag model is the thermodynamic potential itself: . Another possibility is a density-dependent bag model, as proposed in ref. mallick2013 . Notice that in ref. Song , the authors introduce a bag parametrization that depends on both, temperature and chemical potential.
Here we propose a bag model similar to ref. Dey , but where the bag increases with the temperature instead of decreasing:
| (14) |
 |
 |
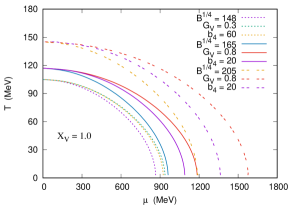
Now is adjusted to reproduce the LQCD and freeze-out (pseudo) critical temperature at zero chemical potential. Therefore = 131 MeV for = 148 MeV, and = 155 MeV for MeV. The increase of the bag pressure value at high temperature can be justified not only to reproduce the chemical freeze-out results Cleymans , but also to increase the quark surface at high temperatures. As shown in ref. surface , the surface tension above 100 MeV increases monotonically with . This model decouples the bag parameter from the thermodynamic potential, and two distinct couplings appear: the vector field only couples to the density while the bag parameter only couples to the temperature.
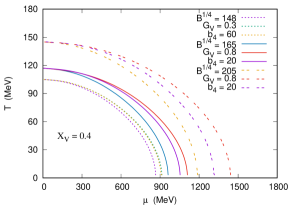
The QCD phase diagram with two-flavored matter is presented in Fig. 4. As can be seen, we obtain the critical temperature around 168 MeV for both values. However, for = 148 MeV, the freeze-out line is not entirely inside the confined (hadron) phase. Even for the upper limit of the stability window we can’t satisfy this restrain. This indicates that, for this model, we are not able to reproduce both, SQM and the QCD phase diagram. Also, as for temperatures , so that , this bag pressure value produces a low critical chemical potential. On the other hand, when we use = 165 MeV, all the freeze-out region lies within the hadronic phase, except for the non-interacting case. Also, the critical chemical potential at zero temperature lies between 1050 MeV 1400 MeV, resulting on a good description of the QCD diagram. In the same sense, as shown in Fig. 2, we are able to reproduce massive stars at approximation, in agreement of ref. Cromartie . Nevertheless, this bag pressure value is far above the stability window, even for non-interacting bag model.
In Fig. 5 we display the phase diagram for tree-flavored -stable matter for = 1.0 and = 0.4. For low temperatures Fig. 5 and Fig. 2 are similar. But at low chemical potential we have a increase of the critical temperature due to the dependence of the bag on the temperature. When compared with two-flavored symmetric matter, there is a decrease from the critical temperature at low chemical potential, as expected. All the numerical values are presented in Tab. 2. As can be seen, for MeV, with the linear vector channel, both values of are able to simultaneously give a good description of the QCD phase diagram and to reproduce massive quark stars. However these results point against the existence of SQM, as they are far from the stability window. This is reinforced by the low radii of the canonical stars, which are in disagreement with ref. Capano , indicating that canonical stars are probably hadronic neutron stars.
V Hot quark stars and the speed of sound
 |
 |
As pointed out in ref. Lattimer ; Lattimer2 , a newborn neutron star is formed in the aftermath of a successful supernova explosion as the stellar remnant becomes gravitationally decoupled from the expanding ejecta, reaching a temperature as high as 500 billion Kelvin in the core (around 50 MeV). And while it takes a dozen of seconds to cool down, deconfinement and chemical equilibrium are reached in a timescale millions and millions of times lower Benvenuto . Therefore the study of hot quark matter is important in both macroscopic properties of quark stars as well as to how the temperature affects the critical chemical potential.
Here we study how a temperature of 40 MeV affects the mass-radius relation of quark stars. Although some studies point out that an isentropic formulation is more realistic Lattimer2 ; Mal ; Debora2004 , we choose an isothermic one, as made in previous works Gupta ; Rafa2008 ; Santos2004 ; Jia ; Bordbar , which allows a direct comparison with the phase diagram presented in Fig. 2. We also use instead of B(T), as for 40 MeV the increase of the bag pressure value is always below 1 (even below 0.5 for = 165 MeV.) In Fig. 6 the mass-radius relation is presented for = 148 MeV and = 165 MeV with = 1.0 and = 0.4.
 |
 |
.
| - | two-flavored matter | three-flavored -matter | same | ||||||||||||
| B1/4 (MeV) | (fm2) | (MeV) | (MeV) | Cleymans? | L-G? | ? | () | (km) | 1.96? | ? | SQM? | ||||
| 148 | - | 0.0 | 0.0 | 168 | 938 | No | No | No | 1.85 | 10.36 | 118 | 866 | No | No | Yes |
| 165 | - | 0.0 | 0.0 | 167 | 1040 | No | Yes | No | 1.50 | 8.58 | 128 | 962 | No | No | No |
| 148 | 1.0 | 0.3 | 0.0 | 167 | 1000 | No | Yes | No | 2.36 | 11.15 | 118 | 938 | Yes | Yes | No |
| 148 | 1.0 | 0.3 | 60 | 167 | 987 | No | Yes | No | 1.99 | 10.73 | 128 | 924 | Yes | Yes | Yes |
| 165 | 1.0 | 0.8 | 0.0 | 168 | 1249 | Yes | Yes | Yes | 2.31 | 10.20 | 118 | 1186 | Yes | No | No |
| 165 | 1.0 | 0.8 | 20 | 168 | 1163 | Yes | Yes | Yes | 1.58 | 8.94 | 128 | 1091 | No | No | No |
| 148 | 0.4 | 0.3 | 0.0 | 167 | 1000 | No | Yes | No | 2.19 | 10.93 | 118 | 915 | Yes | Yes | Yes |
| 148 | 0.4 | 0.3 | 60 | 167 | 987 | No | Yes | No | 1.96 | 10.67 | 118 | 914 | Yes | Yes | Yes |
| 165 | 0.4 | 0.8 | 0.0 | 168 | 1249 | Yes | Yes | Yes | 2.04 | 9.78 | 128 | 1111 | Yes | No | No |
| 165 | 0.4 | 0.8 | 20 | 168 | 1163 | Yes | Yes | Yes | 1.56 | 8.86 | 128 | 1055 | No | No | No |
From Fig. 6 we see that = 148 MeV and = 165 MeV, have the same qualitative behavior for all , and . In a non-interacting gas (not shown in order not to saturate the figure) we have just a small increase of the maximum mass for T = 40 MeV when compared to T = 0. For a linear coupling, there is a more significant decrease of the mass instead of an increase. But when we include the vector with self-interaction we recover an increase of the mass with the temperature. The decrease of the maximum mass within a linear vector field is due to the reduction of the central density with the temperature. The main contribution of the temperature is the reduction of the critical chemical potential. In all cases studied, the critical chemical potential has a reduction around 7 - 10.
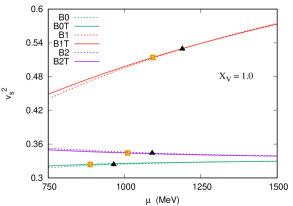
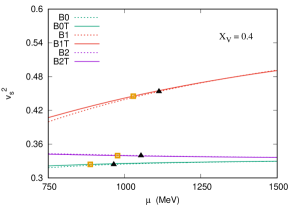
In Fig. 7 we show the square of the speed of sound, , of quark matter as a function of the chemical potential for = 165 MeV (as the speed of sound does not depend on the bag pressure value, the qualitative results are maintained),
| (15) |
As recently pointed out in ref. Nature2020 the speed of sound of the quark matter is closely related to the mass and radius of the quark core in hybrid stars. The authors found that if the conformal bound ( is not strongly violated, massive neutron stars are predicted to have sizable quark-matter cores. We plot the black triangles (for T = 0) and yellow squares (for T = 40 MeV) that represent the critical chemical potential of each model. For the linear vector field, we obtain a monotonically increase of the speed of sound with the chemical potential. Also, the model with linear vector field presents both the higher speed of sound and higher critical chemical potential. For the non-interacting bag model, as well as for the bag model with self-interacting vector field we have an almost constant speed of the sound. However the vector field displaces the speed of the sound to slightly higher values. The non-interacting bag model produces the lower speed of the sound and the lower critical potential. When we compare = 1.0 to = 0.4 we see that only with the linear vector field there is a significant change in the speed of the sound. The self-interacting field washes out the role of . The main results of this section are presented in Tab. 3.
| B1/4 (MeV) | (fm2) | (MeV) | (MeV) | M () | at | ||
|---|---|---|---|---|---|---|---|
| 148 | - | 0.0 | 0.0 | 0 | 866 | 1.85 | 0.32 |
| 148 | - | 0.0 | 0.0 | 40 | 781 | 1.86 | 0.32 |
| 165 | - | 0.0 | 0.0 | 0 | 962 | 1.50 | 0.32 |
| 165 | - | 0.0 | 0.0 | 40 | 885 | 1.52 | 0.32 |
| 148 | 1.0 | 0.3 | 0.0 | 0 | 938 | 2.36 | 0.42 |
| 148 | 1.0 | 0.3 | 0.0 | 40 | 847 | 2.33 | 0.40 |
| 148 | 1.0 | 0.3 | 60 | 0 | 924 | 1.99 | 0.35 |
| 148 | 1.0 | 0.3 | 60 | 40 | 836 | 2.00 | 0.35 |
| 165 | 1.0 | 0.8 | 0.0 | 0 | 1186 | 2.31 | 0.53 |
| 165 | 1.0 | 0.8 | 0.0 | 40 | 1096 | 2.26 | 0.51 |
| 165 | 1.0 | 0.8 | 20 | 0 | 1091 | 1.58 | 0.34 |
| 165 | 1.0 | 0.8 | 20 | 40 | 1009 | 1.59 | 0.34 |
| 148 | 0.4 | 0.3 | 0.0 | 0 | 915 | 2.19 | 0.39 |
| 148 | 0.4 | 0.3 | 0.0 | 40 | 826 | 2.16 | 0.37 |
| 148 | 0.4 | 0.3 | 60 | 0 | 914 | 1.96 | 0.34 |
| 148 | 0.4 | 0.3 | 60 | 40 | 819 | 1.98 | 0.34 |
| 165 | 0.4 | 0.8 | 0.0 | 0 | 1111 | 2.04 | 0.46 |
| 165 | 0.4 | 0.8 | 0.0 | 40 | 1249 | 2.00 | 0.45 |
| 165 | 0.4 | 0.8 | 20 | 0 | 1055 | 1.56 | 0.34 |
| 165 | 0.4 | 0.8 | 20 | 40 | 974 | 1.56 | 0.34 |
VI Comparison with the Nambu–Jona-Lasinio model
In this section we also reproduce some results obtained with the Nambu–Jona-Lasinio (NJL) model to compare with the ones we have obtained in the present work. Although the simplest versions of the NJL model does not reproduce the asymptotic freedom behavior of QCD, and thus cannot describe the quark confinement/deconfinement transition, it can be interpreted as a schematic quark model for many situations where chiral symmetry breaking/restoration is one of the most relevant features of QCD Buballa2005 .
The original version of the model Nambu can be extended by the inclusion of a vector-isoscalar interaction term, along the same lines discussed in ref. Carline and written in Eq.(2) for the MIT bag model, such that, considering two quark flavor fields , it is given by the following Lagrangian density
| (16) |
where are the quark bare masses, is the Pauli isospin matrix, and and are the coupling constants. In the mean-field level, Lagrangian (16) can be rewritten via the bosonization of the model through auxiliary fields given by the non-vanishing scalar and vector condensates, from where it is straightforward to write the grand-canonical thermodynamic potential as Buballa2005 :
| (17) |
with
| (18) |
being the displaced Fermi gas contribution, where . In this process, the constituent mass and effective chemical potential were introduced, respectively, through the self-consistent gap equations Buballa2005 :
| (19) | ||||
| (20) |
The vector condensate is identified as the number density , as in equation (5), and the scalar condensate can be evaluated applying standard techniques of thermal field theory from the dressed fermion propagator as
| (21) |
Here the isospin symmetry is assumed in the Lagrangian level, i.e., , and the situation of chemical equilibrium is considered, i.e., , with . The parameters , and are fitted to reproduce the quark condensate value, the pion mass and its decay constant. In the following, we set MeV, and MeV Buballa2005 . The parameter is usually taken as a free parameter, whith some proposed constraints suggesting values between and gv1 ; gv2 . We consider .
The effective quark mass is obtained solving the gap equations (19-20). This constituent mass is larger than the bare quark mass at lower temperatures and/or densities, generating dynamically the larger particle mass expected in this region and breaking the chiral symmetry of the model. As the temperature or the density increase, approaches the value of the current mass , thus restorating the chiral symmetry. A chiral phase transiton diagram can be drawn determining the behavior of the thermodynamic potential minima with respect to , for given chemical potentials Robson . In the low temperature regime, several effective models predict a first order chiral phase transition to occur. Results from LQCD for the low chemical potential region, however, point to a crossover transition. These two seemingly contradictory pictures suggest that the first order transition line starting at ends at a critical end point (CEP), from which it turns into a crossover NJLv_CEP . Figures 8 and 9 show that this behavior is reproduced by the NJL model. Notice that, as the contribution associated to the vectorial coupling vanishes at zero chemical potential, there is no vacuum correction consequences due to the value of the coupling constant . With the chosen parametrization, this model renders the crossover temperature at being equal to 188 MeV, which is higher than the values obtained from previously discussed MIT-type model calculations, but also from the estimations of the chemical freeze-out parameters in heavy ion collisions and expected from LQCD results, as can be seen in Figs. 8 and 9. As stated above, the NJL model produces a first order phase transition for temperatures below the CEP, where it acquires a second order phase transition point, before the crossover region. Also, increasing the vector term weakens and delays the first order phase transition of the chiral restoration, favoring the crossover transition on the majority of the QCD phase diagram high temperature-low baryonic density part.
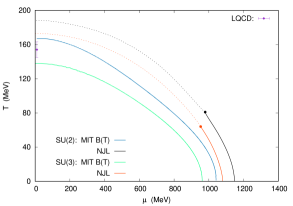
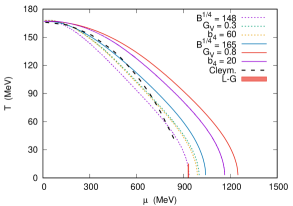
The purpose of the present section is to compare different model frameworks, and hence it is useful to display both two and three-flavored matter results obtained from the NJL-type models too. The extension of the NJL SU(2) to NJL SU(3) is not as straightforward as the inclusion of the quark in the MIT-like models. Thus, we refer the interested reader to refs. Buballa2005 . The expressions for the grand-canonical potentials, the related gap equations and the chosen parametrizations are the same as in ref. PRD85 , taking MeV, , , MeV and Mev. As extensively discussed in Muller , the strange quark is largely responsible for shaping the phase diagram of QCD since its mass controls the nature of the chiral and deconfinement transitions. In ref. Fukushima , the schematic figure of the Columbia phase diagram in 3-flavour QCD points to the importance of the strange quark mass, which also plays a decisive role on the possible existence of a quark core in collapsed stars. Hence, to consider strangeness conservation without relying on the inclusion of -stable matter, which, as discussed below, is justified only at the lower temperature range of the QCD phase transition diagram, we show the curves obtained with the same chemical potential for the three quarks, i.e., in Fig. 9, for the NJL and the MIT models. One can clearly see that within the SU(3) version of both models, the transition temperature at low chemical potential is lowered considerably in relation to the SU(2) curve and at low temperatures, the transition chemical potentials are also shifted towards lower values. Also, the effects of the vector interaction are the same as the ones just discussed for the SU(2) case, e.g. the transition point at would be also kept fixed had different values of the vector interaction been plotted, as explained above.
Analyzing this framework and the results presented in previous sections together, it is possible to argue that the phase transition in QCD can take place either in one or two different steps, depending on the parameter choice adopted for the MIT-type model. From Figures 1 and 4, we can see that both MIT models allow the deconfinement phase transition to take place around MeV in the low temperature region, at least for some sets. If this is the case considered, it suggests that both deconfinement and chiral transition occur simultaneously in the QCD phase diagram. It does happen at , e.g., when the parameters of the MIT model are taken to be = 165 MeV and fm2, while the vector coupling of the NJL is set as , at MeV. However, even in such case, the MIT and NJL transition curves diverge rapidly for finite temperatures, as the dependence of the transition temperature on the chemical potential is noticeably more intense in the MIT curves, specially for chemical potential greater than the at the CEP predicted for the NJL-type models.
The description of stellar matter cannot be done using the two-flavor formalism presented in this section, since strangeness is necessary to fulfill the Bodmer-Witten conjecture (but it is still a possibility in the framework of quark-meson models, as pointed out in ref. Chen ). Both hybrid and quark stars with vector NJL models have been described in several studies Lopes2020 ; Bla ; Lenzi ; Shao ; Tk ; Ciern ; Sandoval . It is worth noting, however, that these models do not produce stable quark matter at zero temperature and/or magnetic field njlstab , but they can certainly describe the inner matter of a hybrid star Nature2020 , which is enough to justify the application of this type of model in theoretical studies, mainly the ones involving phase transitions. Increasing the vector term stiffens the equation of state, thus sustaining larger maximum stellar masses, but the macroscopic properties of the compact star depend strongly on the remaining parameter choice. As example, models used in ref. NJLv_stars do not reach the 1.96 even for higher vector couplings ().
VII Final remarks
In this work we have extended the modified versions of the MIT bag model, recently introduced in ref. Carline , on which a vector field and a self-interacting term are added, to consider finite temperature effects and then build the QCD phase diagram. We first consider symmetric two-flavored quark matter constrained to both the freeze-out and the liquid-gas phase transition at the hadronic phase. Then, we have verified that it is difficult to reconcile these constraints with the existence of stable strange quark matter as proposed by the Bodmer-Witten conjecture Bod ; Witten .
We have next constructed the QCD phase diagram for three-flavored quark matter in equilibrium and zero electrical charge with two different possibilities for the strength of the strange quark interaction with the vector field: an universal coupling, when the strength of the quark is equal to the and quarks, and one coming from the group theory approach that fixes the quark coupling constant to 2/5 of the and quarks Carline . These conditions were then utilized to obtain EoS at zero and finite temperature and used as input for the TOV equations and to compute the sound velocity. The related mass-radius diagrams were displayed and discussed. Within different choices of parameters, massive stars can be described, but the radii of the canonical stars are generally too small, indicating that they are more likely to be hadronic stars.
Finally, we have revisited QCD phase diagrams obtained with the Nambu-Jona-Lasinio model with and without a vector interaction. Despite the fact that the nature of the transition described by the MIT-like and NJL models framework is different, we have seen that both formalisms can produce transition curves with the same overall behavior as the inclusion of the vector interaction is concerned, specially in the low temperature region.
Moreover, depending on the parameters choice for both models, the NJL chiral symmetry transition can take place at roughly the same temperatures and chemical potentials as the MIT-like model deconfinement transition, meaning that both first order phase transitions can take place at the same time.
Acknowledgments
This work is a part of the project INCT-FNA Proc. No. 464898/2014-5. D.P.M. and K.D.M. are partially supported by Conselho Nacional de Desenvolvimento Científico e Tecnológico (CNPq/Brazil) respectively under grant 301155.2017-8 and with a doctorate scholarship. C.B. acknowledges a doctorate scholarship from Coordenação de Aperfeiçoamento de Pessoal do Ensino Superior (Capes/Brazil).
References
- (1) K. Fukushima, T. Hatsuda, Rept. Prog. Phys. 74, 014001 (2011)
- (2) D. J. Gross, F. Wilczek, Phys. Rev. Lett. 30, 1343 (1973)
- (3) G. Agakishiev et al., Eur. Phys. J. A 52, 178 (2016)
- (4) J. Adam et al., Phys. Lett. B 758, 389 (2016)
- (5) B. Abelev et al., Phys. Rev. C 91, 024609 (2015)
- (6) B. Abelev et al., Phys. Rev. C 81, 024911 (2010)
- (7) J. Cleymans et al, Phys. Rev. C 73, 034905 (2006)
- (8) P. Braun-Munzinger, J. Wambach, Rev. Mod. Phys. 81, 1031 (2009)
- (9) P. Braun-Munzinger, J. Stachel, C. Wetterich, Phys. Lett. B 596, 61 (2004)
- (10) F. Karsch, E. Laermann, A. Peikert, Nucl. Phys. B 605, 579 (2001)
- (11) Y .Aoki et al., Nature 443, 675 (2006)
- (12) R. Bellwied et al., Phys. Lett. B 751, 559 (2015)
- (13) X. Luo et al., Particles 3, 278 (2020)
- (14) A. Bazavov et al., Phys. Rev. D 96, 074510 (2017)
- (15) A. Bazavov et al., Phys. Rev. D 95, 054504 (2017)
- (16) J. Finn ete al., Phys. Rev. Lett. 49, 1321 (1982)
- (17) M. Agostino et al., Nucl. Phys.A 749, 55 (2005)
- (18) D. P. Menezes and C. Providência, Phys. Rev. C 64, 044306 (2001).
- (19) A. Motornenko et al., Phys. Rev. C 101, 034904 (2020)
- (20) J. Elliott et al., Phys. Rev. D 87, 054622 (2013)
- (21) L. Lopes et al., Phys. Scr. 96, 065303 (2021)
- (22) R.J. Furnstahl , B. D. Serot, Hua-Bin Tang, Nucl. Phys. A 618, 446 (1997)
- (23) A. Bodmer, Phys. Rev. D 4, 1601 (1971)
- (24) E. Witten, Phys. Rev. D 30, 272 (1984)
- (25) E. Annala, T. Gorda, A. Kurkela, J. Nättilä and A. Vuorinen, Nature Physics 16, 907–910 (2020)
- (26) H. Cromartie et al., Nat. Astr. 4, 72 (2020)
- (27) C. Capano et al., Nat. Astron. 4, 625 (2020)
- (28) T. Riley et al., Astrophys. J. Lett. 887, L21 (2019)
- (29) M. Miller et al., Astrophys. J. Lett. 887, L24 (2019)
- (30) B. Muller, J. Rafelski, Phys. Lett. B 101, 111 (1981)
- (31) J. Dey, M. Dey, Phys. Lett. B 176, 469 (1986)
- (32) M. Buballa Phys. Rep. 407, 205 (2005)
- (33) M. Alford, K. Rajagopal, F. Wilczed Phys. Lett. B 422, 247 (1998)
- (34) Y. Nambu, G. Jona-Lasinio, Phys. Rev. 122, 345 (1961)
- (35) K. Johnson, Phys. Lett. B 78, 259 (1978)
- (36) M. Tanabashi, et al., Phys. Rev. D 98, 030001 (2018)
- (37) W. Greiner, L. Neise, and H. Stocker, Thermodynamics and Statistical Mechanics (Springer, New York, 1995).
- (38) S. Ruster et al., Phys. Rev. D 72, 034004 (2005)
- (39) T. Klahn, T. Fischer, M. Hempel, Astrophys. J. 836, 89 (2017)
- (40) A. Ayriyan et al., Phys. Rev. C 97, 045802 (2018)
- (41) A. Andronic et al., J. Phys. Conf. Ser. 779, 012012 (2017)
- (42) Rabhi et al., J.Phys. G 36, 115204 (2009)
- (43) J. R. Oppenheimer, G. M. Volkoff, Phys. Rev. 33, 374 (1939).
- (44) G. Lugones and O. G. Benvenuto, Phys. Rev. D 58, 083001 (1998).
- (45) J. Lattimer, Physics 11, 42 (2018)
- (46) D.P. Menezes and C. Providência, Phys. Rev. C 69, 045801 (2004)
- (47) V. Gupta et al., Intern. J. Mod. Phys. D 12, 583 (2003)
- (48) R. Cavagnoli, D. Menezes J. Phys. G 35, 115202 (2008)
- (49) R. Cavagnoli,C. Providencia D. Menezes Phys. Rev. C 83, 045201 (2011)
- (50) P. Cardoso et al., Eur. Phys. J A53, 191 (2017)
- (51) S. Li, R. Bhalerao, R. Bhaduri, Int. J. Mod. Phys. A 6, 501 (1991)
- (52) R. Mallick, Phys. Rev. C 87, 025804 (2013)
- (53) G. Song, W. Ewke, L. Jiarong, Phys. Rev. D 46, 3211 (1992)
- (54) N. Prasad, C. Singh, Phys. Lette. B 501, 92 (2001)
- (55) G. Lugones, A. Grunfeld, Phys. Rev. C 99, 035804 (2019)
- (56) J. Pons et al., Astrophys. J. 513, 780 (1999)
- (57) G. Malfatt et al., Phys. Rev. C 100, 015803 (2019)
- (58) A. Santos and D.P. Menezes, Phys. Rev. C 69, 045803 (2004)
- (59) Jia-J. Lu et al., Phys. Rev. C 100, 054335 (2019)
- (60) G. Bordbar, A. Poostforush1, A. Zamani1, Astrophys. 54, 2 (2011)
- (61) M. Hanauske et al., Phys. Rev. D 64, 043005 (2001)
- (62) J. Sugano et al., Phys. Rev. D 90, 037901 (2014)
- (63) R. Z. Denke and M. B. Pinto, Phys. Rev. D 88, 056008 (2013).
- (64) Pedro Costa, et al, Phys. Rev. D 92, 036012 (2015)
- (65) L. Adamczyk et al.[STAR], Phys. Rev. C 96, 044904 (2017)
- (66) A. Andronic, P. Braun-Munzinger and J. Stachel, Nucl. Phys. A 772 (2006)
- (67) V. Vovchenko et al., Phys. Lett. B 775 (2017)
- (68) Sidney S. Avancini, et al., Phys. Rev. D 85, 091901(R) (2012).
- (69) Berndt Muller, Acta Physica Polonica B 43, 761 (2012)
- (70) A. Bazavov et al., Phys. Rev. D 85, 054503 (2012)
- (71) Chen Zhang, Phys. Rev. D 101, 043003 (2020)
- (72) L. Lopes, D. Menezes, Eur. Phys. J. A 56, 122 (2020)
- (73) D. Blaschke et al., Phys. Rev. C 75, 065804 (2007)
- (74) C. Lenzi, G. Lugones Astrophys. J. 759, 57 (2012)
- (75) G. Shao, et al., Phys. Rev. D 87, 096012 (2013)
- (76) T. Klahn, T.Fischer, Astrophys. J. 810, 134 (2015)
- (77) M. Cierniak. et al,, Universe 5, 186 (2019)
- (78) R. Sandoval et al., Phys.Rev.C 93, 045812 (2016).
- (79) V. Dexheimer, J. R. Torres and D. P. Menezes, Eur. Phys. J. C 73, 2569 (2013)
- (80) D. Menezes et al., Phys. Rev. C 89, 055207 (2014)