The Blue Supergiant Progenitor of the Supernova Imposter AT 2019krl
Abstract
Extensive archival Hubble Space Telescope, Spitzer Space Telescope, and Large Binocular Telescope imaging of the recent intermediate-luminosity transient, AT 2019krl in M74, reveal a bright optical and mid-infrared progenitor star. While the optical peak of the event was missed, a peak was detected in the infrared with an absolute magnitude of mag, leading us to infer a visual-wavelength peak absolute magnitude of 13.5 to 14.5. The pre-discovery light curve indicated no outbursts over the previous 16 yr. The colors, magnitudes, and inferred temperatures of the progenitor best match a 13–14 M☉ yellow or blue supergiant (BSG), if only foreground extinction is taken into account, or a hotter and more massive star, if any additional local extinction is included. A pre-eruption spectrum of the star reveals strong H and [N ii] emission with wings extending to km s-1. The post-eruption spectrum is fairly flat and featureless with only H, Na I D, [Ca II], and the Ca II triplet in emission. As in many previous intermediate-luminosity transients, AT 2019krl shows remarkable observational similarities to luminous blue variable (LBV) giant eruptions, SN 2008S-like events, and massive-star mergers. However, the information about the pre-eruption star favors either a relatively unobscured BSG or a more extinguished LBV with M☉ likely viewed pole-on.
1 Introduction
Existing in the magnitude space between traditional supernovae (SNe) and classical novae lies a menagerie of explosive and eruptive transients with peak magnitudes in the range mag and optical spectra dominated by narrow- or intermediate-width Balmer emission lines. These “SN imposters” (Van Dyk et al., 2000; Smith et al., 2011; Kochanek et al., 2012; Van Dyk & Matheson, 2012) may arise from a variety of progenitors and have been attributed to a number of potential physical mechanisms, including instabilities near the Eddington limit (Humphreys & Davidson, 1994; Smith & Owocki, 2006; Owocki et al., 2004), instabilities in nuclear burning in late post-main-sequence evolution (Shiode & Quataert, 2014; Smith & Arnett, 2014), stellar mergers or common-envelope phases in binary star systems (Soker & Kashi, 2013; Kochanek et al., 2014; Smith et al., 2016b, 2018), or electron-capture supernovae (ecSNe; Botticella et al., 2009; Kochanek et al., 2012; Adams et al., 2016).
Originally, the handful of known SN imposters were interpreted as giant eruptions of massive stars akin to Carinae’s Great Eruption (Van Dyk et al., 2000; Goodrich et al., 1989; Filippenko et al., 1995; Humphreys et al., 1999; Smith et al., 2001). While giant eruptions are one type of outburst experienced by luminous blue variables (LBVs), they are phenomenologically different from the lower-amplitude, irregular, S-Doradus variations that are more commonly seen in LBVs (van Genderen, 2001; Clark et al., 2005; Smith et al., 2011; Smith, 2017; Weis & Bomans, 2020; Davidson, 2020).
Over the years, as more intermediate-luminosity transients have been discovered and a broader diversity was seen in their light curves, spectra, and possible progenitors, they were grouped into three broad classes of events: (1) giant eruptions of massive LBVs, (2) SN 2008S-like events (also known as intermediate-luminosity red transients, ILRTs, or intermediate-luminosity optical transients, ILOTs) that have been proposed as eruptions of heavily dust enshrouded blue supergiants or explosions of super-asymptotic-giant-branch (AGB) stars as ecSNe, and (3) luminous red novae (LRNe), which have usually been interpreted as binary mergers or common-envelope (CE) ejections in low- or intermediate-mass stars. All of these involve large amounts of episodic mass loss, and many of them share observed properties that blur the distinction between categories. For example, LBVs can experience super-Eddington eruptions which are accompanied by large amounts of mass loss (Smith & Owocki, 2006; Owocki et al., 2004), but some LBV eruptions might also be the result of stellar mergers (Smith et al., 2016b, 2018; Pastorello et al., 2019a). The most well known example of the phenomenon was the Great Eruption of Car (Smith, 2012; Smith et al., 2018). The SN 2008S-like events are characterized by a highly obscured dusty progenitor, and strong [Ca II] and Ca II near-infrared (NIR) triplet emission lines in their spectra (Prieto et al., 2008, 2009; Thompson et al., 2009), but some LBVs including Car exhibit all these properties as well (Smith et al., 2011, 2016b, 2018). The SN 2008S-like transients have been interpreted as arising either from a terminal low-luminosity SN event (Botticella et al., 2009; Kochanek et al., 2012; Adams et al., 2016) or from massive-star outbursts in a dusty cocoon (Berger et al., 2009; Bond et al., 2009; Smith et al., 2009; Humphreys et al., 2011).
With the discovery that the outburst of V1309 Sco was due to the merger of an inspiraling binary system of 1–2 M☉ (Mason et al., 2010; Tylenda et al., 2011; Pejcha, 2014), links could be made between red novae and merger events (Tylenda et al., 2011), including the more massive (3–10 M☉) proposed mergers V838 Mon (Bond et al., 2003; Sparks et al., 2008) and M31-LRN-2015 (Dong et al., 2015; MacLeod et al., 2017; Blagorodnova et al., 2020). The spectra of these events change dramatically with time, starting with narrow Balmer emission lines on top of a rather featureless blue continuum, and evolving to a cool, dusty, molecular-band-dominated spectrum. Other well-known mergers of even more massive stars include NGC 4490-OT at M☉ (Smith et al., 2016b; Pastorello et al., 2019a) and the similar transient AT 2017jfs (Pastorello et al., 2019b), M101-2015OT1 at 18 M☉ (Blagorodnova et al., 2017; Goranskij et al., 2016), and SNHunt248 with a mass possibly as large as 60 M☉ (Mauerhan et al., 2018). The light curves of these objects show prominent double or multiple peaks, with more massive progenitors linked with brighter peak magnitudes and a longer duration between peaks (Kochanek et al., 2014; Smith et al., 2016b; Pastorello et al., 2019a).
Some intermediate-luminosity transients cannot be strictly classified into one of the three groups discussed above. For instance, UGC 2773-OT exhibited [Ca II] and Ca II emission in its spectra, similar to the SN 2008S-like events, but appears to have had a luminous, blue progenitor and a slow rise to peak luminosity and a decade-long eruption akin to the Great Eruption of Car (Smith et al., 2010, 2016a; Foley et al., 2011). Moreover, Car — the quintessential LBV giant eruption — showed prominent [Ca II] emission and molecular absorption in light-echo spectra (Prieto et al., 2014; Smith et al., 2018), plus prodigious dust formation and other features that are also attributed to ILRTs. Similarly, the optical spectra of SN 2002bu evolved from the appearance of an LBV to that of a SN 2008S type, and observations over a decade after the outburst are still inconclusive about whether the event was terminal (Szczygieł et al., 2012).
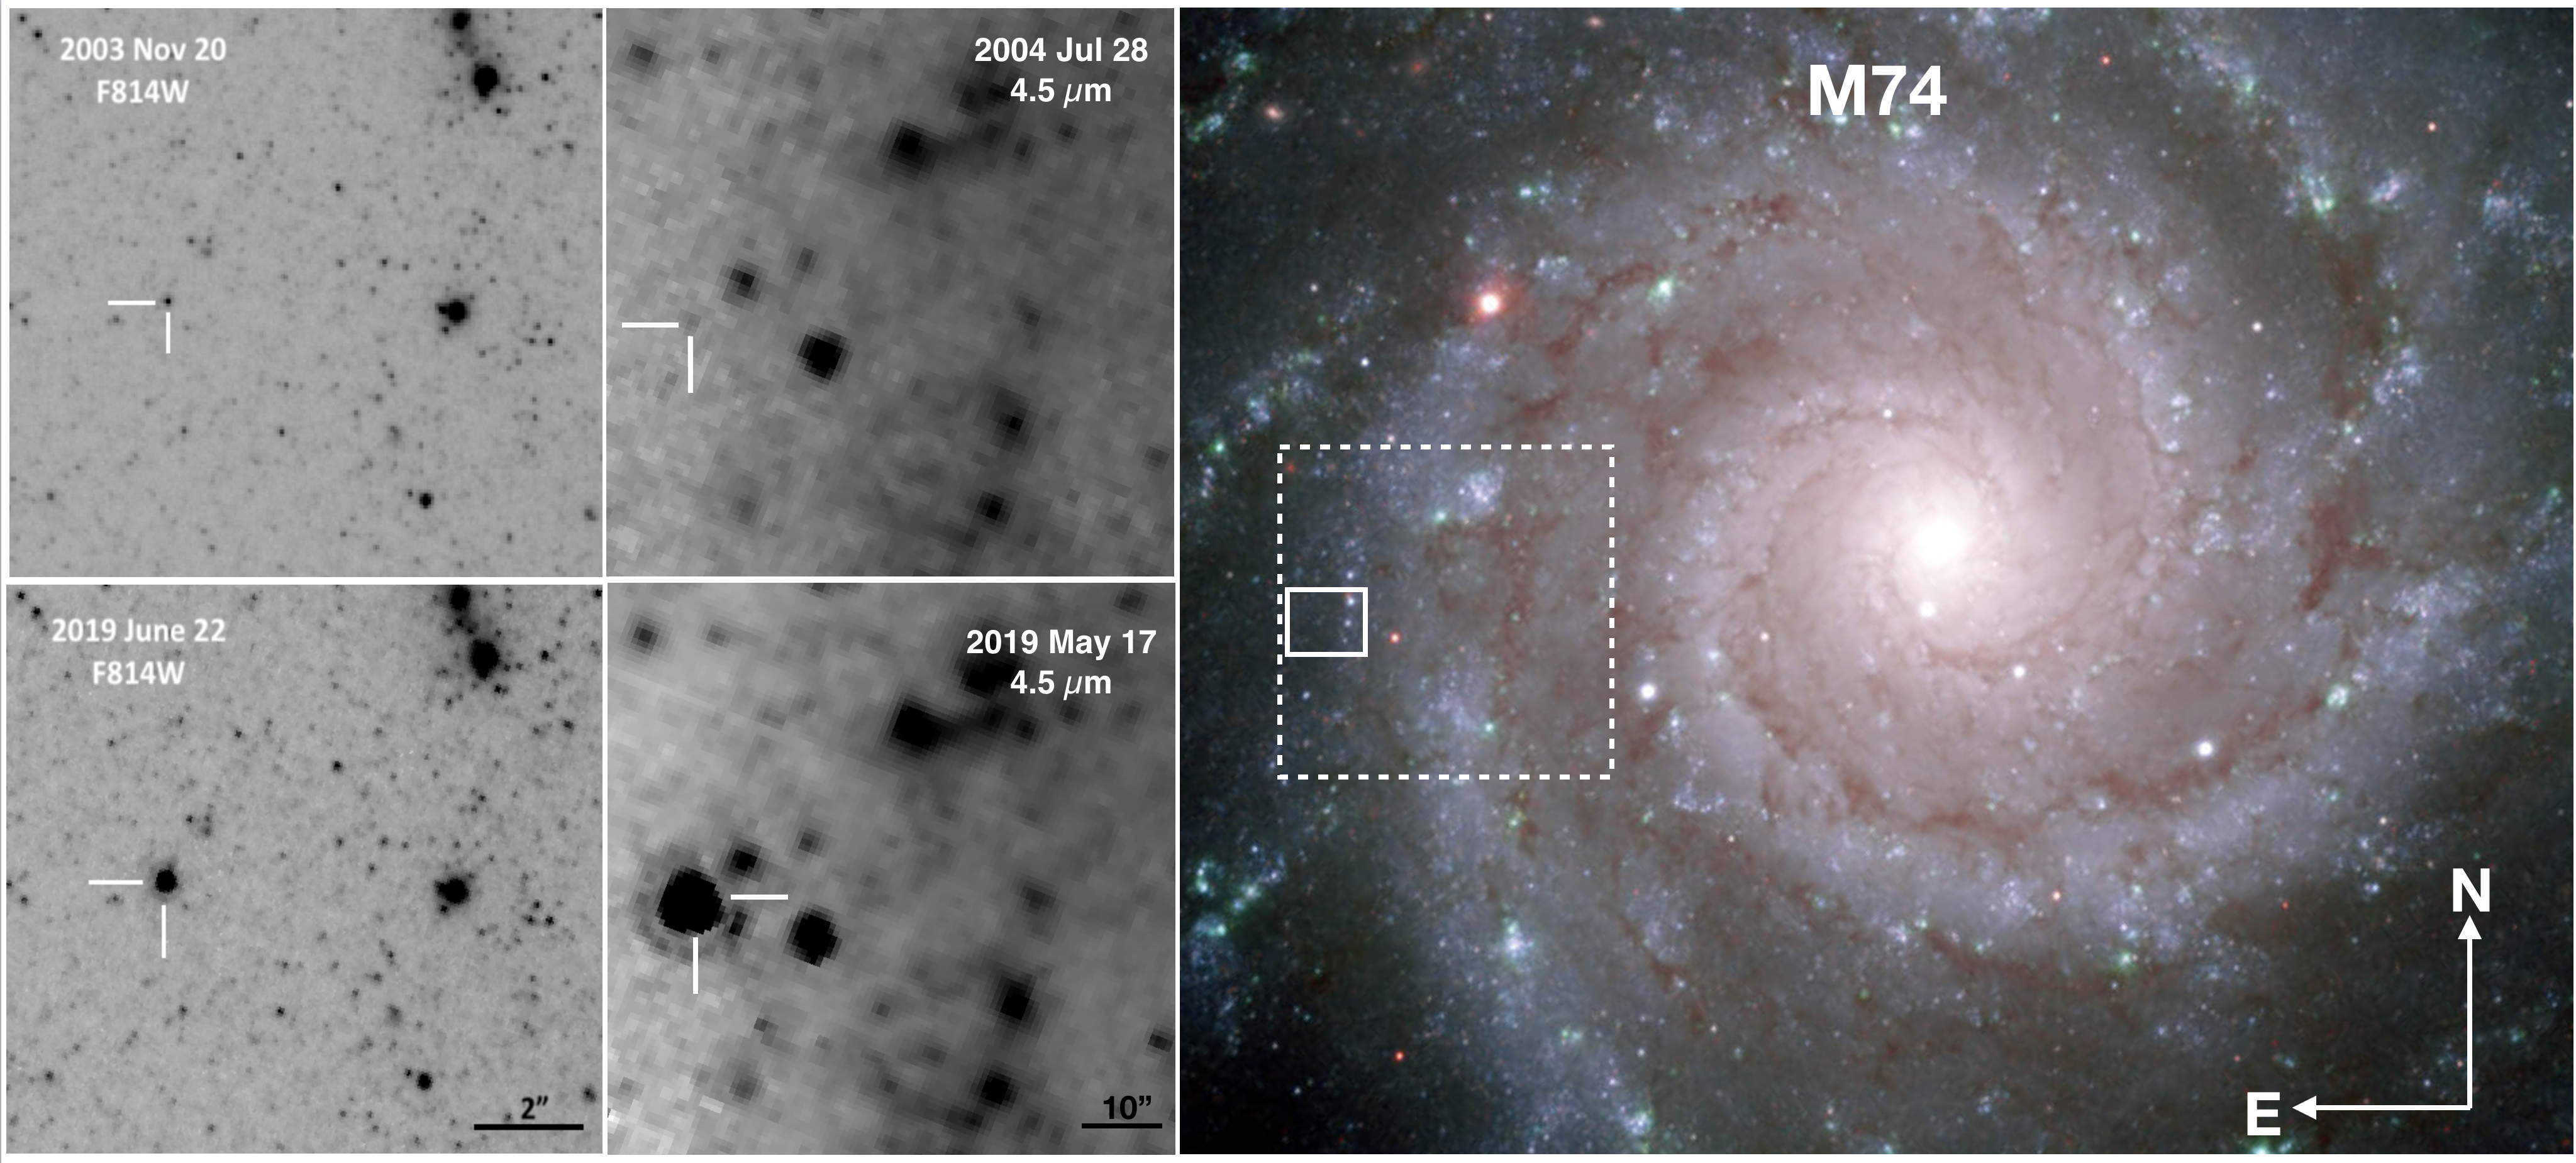
Here we present another case of an intermediate-luminosity transient that shows outburst characteristics belonging to LBV, SN 2008S-like events, and massive star mergers. In this case, however, a luminous blue progenitor is clearly detected in pre-eruption data. AT 2019krl (ZTF19abehwhj) was discovered on 2019 July 07 (Ho, 2019) by the Zwicky Transient Facility (ZTF; Bellm et al., 2019) in the nearby spiral galaxy M74 (NGC 628). It was later classified as either a Type IIn supernova or an LBV in outburst, based on an optical spectrum taken on 2019 July 8.4 that showed strong, complex H emission with a narrow (130 km s-1) and an intermediate (2000 km s-1) width component (Andrews et al., 2019). M74 has been host to the well-studied SNe 2002ap, 2003gd, and 2013ej which have resulted in a rich dataset of archival imaging in the optical and infrared. From ground-based imaging using 20 reference Gaia DR2 (Gaia Collaboration et al., 2018) stars we obtained an absolute position of AT 2019krl of (J2000) 01h36m49s.633, (J2000) . A subsequent search of the Spitzer Heritage Archive found that the object was detected in archival Spitzer Space Telescope (SST; Werner et al., 2004; Gehrz et al., 2007) images and appeared as a bright source in the last observational epoch on 2019 May 17, approximately two months prior to the optical discovery (Szalai et al., 2019). Adopting a distance modulus to M74 of = 29.95 0.03 (stat.) 0.07 (syst.) mag ( Mpc; McQuinn et al., 2017, which is consistent with the distance determined by Kreckel et al. 2017 using the planetary nebula luminosity function), the absolute magnitude of AT 2019krl in the brightest epoch from Spitzer was = 18.4. The combination of bright mid-infrared (MIR) emission, low optical brightness, and narrow Balmer emission suggested that AT 2019krl was likely one of the intermediate-luminosity transients discussed above.
We outline the observations and data reduction in Section 2, and discuss the light curve and spectroscopic evolution of the progenitor and event in Section 3. Section 4 discusses the constraints on the progenitor and explosion from the data, and Section 5 compares these with other intermediate-luminosity transient types. We end with concluding remarks in Section 6.
2 Observations
2.1 HST Photometry
The site of the transient has been imaged many times before with HST. In addition, HST/ACS observations of M74 obtained on 2019 June 22 (PI: D. Sand) serendipitously imaged AT 2019krl two weeks before the discovery report was issued (Ho, 2019). Using this post-outburst observation, we could easily isolate the progenitor star in pre-outburst archival HST images.
Pre-transient ACS/WFC data were obtained from programs GO-9796 (PI: J. Miller; 2003 November 20), GO-10402 (PI: R. Chandar; 2005 June 16), and GO-15645 (PI: D. Sand; 2019 June 22). Several epochs of WFC3/UVIS are available, including from programs GO-13364 (PI: D. Calzetti; 2013 October 17), GO-13773 (PI: R. Chandar; 2014 October 14), GO-14668 (PI: A. Filippenko; 2016 October 04), and GO-15166 (PI: A. Filippenko; 2017 December 04). Additionally, another post-explosion epoch was taken with WFC3/UVIS on 2019 November 07 (GO-15151; PI: S. Van Dyk). One epoch of WFPC2/WF3 data was also obtained from GO-10402 (PI: R. Chandar; 2005 February 16). The data were all obtained from the Mikulski Archive for Space Telescopes (MAST111https://archive.stsci.edu/) with standard pipeline calibrations applied. See Table 1. In Figure 1 we show the transient location in a pre-eruption image from 2003, and one post-eruption image from 2019. We analyzed these data with DOLPHOT222http://americano.dolphinsim.com/dolphot/ (Dolphin, 2000, 2016), after using AstroDrizzle (Hack et al., 2012) to produce drizzled image mosaics and to flag cosmic-ray hits in the individual frames. We used the recommended parameters for DOLPHOT and adopted values for the parameters FitSky=3 and RAper=8 for the photometry. We present the HST photometry on the Vega scale in Table 1.
| Date | Filter | Instrument | VegaMAGaaDOLPHOT magnitudes obtained from the HST data. |
|---|---|---|---|
| 2003-11-20 | ACS/WFC | 24.3630.012 | |
| ACS/WFC | 24.0350.016 | ||
| ACS/WFC | 23.3320.015 | ||
| 2005-02-16 | WFPC2/WF3 | 23.8480.121 | |
| 2005-06-16 | ACS/WFC | 24.2910.042 | |
| ACS/WFC | 24.1590.045 | ||
| ACS/WFC | 23.3940.026 | ||
| 2013-10-17 | WFC3/UVIS | 24.6460.115 | |
| WFC3/UVIS | 24.4140.094 | ||
| WFC3/UVIS | 23.8240.020 | ||
| 2014-10-14 | WFC3/UVIS | 23.7130.044 | |
| WFC3/UVIS | 21.0890.022 | ||
| 2016-10-04 | WFC3/UVIS | 23.6630.021 | |
| WFC3/UVIS | 22.8020.024 | ||
| 2017-12-04 | WFC3/UVIS | 23.2700.018 | |
| WFC3/UVIS | 22.5090.022 | ||
| 2019-06-22 | ACS/WFC | 19.9530.003 | |
| 2019-11-07 | WFC3/UVIS | 21.8400.025 | |
| WFC3/UVIS | 20.3490.020 |
2.2 LBT Photometry
| MJD | ||||
|---|---|---|---|---|
| mag | mag | mag | mag | |
| 54859 | – | – | 23.58 0.27 | 22.42 0.06 |
| 54862 | 23.59 0.17 | 24.16 0.14 | 23.80 0.18 | 22.46 0.01 |
| 55126 | 23.64 0.20 | 24.32 0.06 | 23.60 0.07 | 22.44 0.01 |
| 55471 | 23.46 0.08 | 24.19 0.04 | 23.65 0.05 | 22.47 0.01 |
| 55536 | 23.66 0.05 | 24.30 0.04 | 23.75 0.04 | 22.46 0.01 |
| 55825 | – | 24.37 0.12 | 23.59 0.06 | 22.39 0.02 |
| 55826 | – | 24.23 0.04 | 23.59 0.03 | 22.39 0.02 |
| 55882 | – | 24.22 0.07 | 23.62 0.06 | 22.38 0.02 |
| 55884 | – | 24.35 0.08 | 23.69 0.11 | 22.40 0.01 |
| 55889 | – | 24.28 0.07 | 23.56 0.05 | 22.40 0.02 |
| 55924 | 23.86 0.16 | 24.19 0.06 | 23.59 0.03 | 22.39 0.01 |
| 56215 | – | – | 23.44 0.13 | 22.33 0.07 |
| 56301 | 23.53 0.21 | 24.35 0.13 | 23.75 0.07 | 22.43 0.02 |
| 56592 | – | – | 23.51 0.27 | 22.40 0.03 |
| 56661 | 23.96 0.17 | 24.07 0.04 | 23.56 0.05 | 22.39 0.01 |
| 56981 | 23.78 0.09 | 24.12 0.03 | 23.46 0.03 | 22.37 0.01 |
| 56988 | – | 24.04 0.08 | 23.36 0.07 | 22.37 0.01 |
| 57071 | 23.50 0.27 | 23.99 0.12 | 23.57 0.14 | 22.40 0.03 |
| 57309 | 23.65 0.07 | 24.03 0.06 | 23.36 0.03 | 22.31 0.01 |
| 57362 | 23.77 0.16 | 24.02 0.07 | 23.34 0.06 | 22.32 0.02 |
| 57391 | – | – | – | 22.32 0.03 |
| 57690 | – | – | – | 22.31 0.02 |
| 58014 | 23.68 0.05 | 23.78 0.04 | 23.07 0.03 | 22.20 0.01 |
| 58074 | 23.36 0.12 | 23.86 0.04 | 23.04 0.02 | 22.21 0.01 |
| 58076 | 23.57 0.16 | 23.90 0.05 | 23.10 0.08 | 22.22 0.02 |
| 58127 | 23.60 0.11 | 23.77 0.04 | 23.02 0.03 | 22.18 0.01 |
| 58375 | 23.50 0.06 | 23.66 0.02 | 22.87 0.03 | 22.04 0.01 |
| 58423 | – | – | – | 22.11 0.03 |
| 58837 | 22.93 0.10 | 22.95 0.02 | 21.59 0.01 | 20.96 0.01 |
Observations of M74, including the position of AT 2019krl, were obtained as part of the Large Binocular Telescope (LBT) Search for Failed Supernovae (Kochanek et al., 2008). As part of this survey, UBVR images of M74 were obtained between 2008 and 2019 using the Large Binocular Cameras (LBC; Giallongo et al., 2008) on the LBT. The data reduction and image processing are described by Gerke et al. (2015) and Adams et al. (2017). In summary, the best images are combined to make a reference image, and the individual epochs are analyzed using the ISIS image-subtraction package (Alard & Lupton, 1998; Alard, 2000). The difference imaging provides a light curve of the variable flux that is unaffected by crowding. The mean flux of the source in the reference image is subject to the effects of crowding and is less well-determined.
The data are calibrated using stars in the Sloan Digital Sky Survey (SDSS; Ahn et al., 2012) and transformed to UBV Vega magnitudes using the conversions reported by Jordi et al. (2006). These calibrations are accurate to 0.1 mag or better. The uncertainties in the transient light curve are estimated using the variance of light curves extracted from nearby source-free regions, as these empirical uncertainties will include any systematic contributions to the uncertainties beyond simple Poisson errors. The LBT photometry is listed in Table 2.
2.3 Spitzer Photometry
| MJD | [3.6] Diff. Flux | Error | [4.5] Diff. Flux | Error | [3.6] | Error | [4.5] | Error |
|---|---|---|---|---|---|---|---|---|
| (Jy) | (Jy) | (Jy) | (Jy) | (mag) | (mag) | (mag) | (mag) | |
| 53211.82 | ||||||||
| 53385.98 | ||||||||
| 53960.85 | ||||||||
| 54328.12 | ||||||||
| 54491.19 | ||||||||
| 56734.98 | ||||||||
| 56936.57 | ||||||||
| 56970.14 | ||||||||
| 57312.98 | ||||||||
| 57320.53 | ||||||||
| 57334.24 | ||||||||
| 57474.90 | ||||||||
| 57482.44 | ||||||||
| 57503.57 | ||||||||
| 57680.70 | ||||||||
| 57695.05 | ||||||||
| 57855.38 | ||||||||
| 58054.61 | ||||||||
| 58242.87 | ||||||||
| 58427.87 | ||||||||
| 58459.75 | ||||||||
| 58594.60 | ||||||||
| 58620.24 | ||||||||
| 58811.34 |
There have been many observations of M74 in the 3.6 and 4.5 m imaging channels ([3.6] and [4.5]) of the Infrared Array Camera (IRAC; Fazio et al., 2004) on-board Spitzer since 2004 as part of several observing programs (PID 159, PI: R. Kennicutt; PID 3248, PI: W. P. Meikle; PID 30494, PI: B. Sugerman; PID 40010, PI: M. Meixner), including extensive coverage since 2014 by the SPitzer InfraRed Intensive Transients Survey (SPIRITS; PIDs 10136, 11063, 13053, 14089; PI: M. Kasliwal) through the end of 2019. Pre-discovery photometry was presented by Szalai et al. (2019) up until the infrared (IR) peak of the transient on 2019 May 17, including the upper limits of the nondetections at 5.8 m and 8.0 m of 5 Jy and 15 Jy, respectively.
As part of SPIRITS, the post-basic calibrated data (PBCD) level images were downloaded from the Spitzer Heritage Archive333https://sha.ipac.caltech.edu/applications/Spitzer/SHA/ and Spitzer Early Release Data Service444http://ssc.spitzer.caltech.edu/warmmission/sus/mlist/archive/2015/msg007.txt and processed through an automated image-subtraction pipeline (for details, see Kasliwal et al., 2017). For reference images, we used the images taken on 2004 July 28 for the Spitzer Infrared Nearby Galaxies Survey (SINGS; Kennicutt et al., 2003). We performed aperture photometry on the difference images using a 4 mosaicked-pixel () aperture and background annulus from 4–12 pixels (–). The extracted flux is multiplied by the aperture corrections of 1.215 for [3.6] and 1.233 for [4.5] as described in the IRAC Instrument Handbook555http://irsa.ipac.caltech.edu/data/SPITZER/docs/irac/iracinstrumenthandbook/. To estimate the photometric uncertainties, we performed photometry with the same parameters as above in a grid of apertures spanning a box with spacing centered at the location of the transient, excluding the central aperture. We adopt a robust estimate of the root-mean-square (rms) uncertainty in the distribution of flux measurements for the aperture grid ( percentile]) as representative of the 1 uncertainties in our photometry.
In the 2004 reference images used for subtraction, a possible quiescent counterpart is visible at both [3.6] and [4.5]. Our aperture photometry gives low-significance measurements of and Jy, consistent with 2005 January 15 measurements by Szalai et al. (2019). Given the limited spatial resolution of Spitzer/IRAC and the complicated background emission, it is not possible to rule out that the emission at the site is due to confusion with nearby, unrelated sources. Thus, we infer 3 limits on the IR flux of the precursor in 2004 of and Jy. We adopt our difference imaging measurements throughout the rest of this work with the caveat that they may underestimate the true source flux. We convert our flux measurements to Vega-system magnitudes using the zero-magnitude fluxes presented for each IRAC channel in the IRAC Instrument Handbook and list our photometry in Table 3.
2.4 Spectroscopy
Multiple long-slit optical spectra were taken of AT 2019krl with various telescopes/instruments between July and November 2019. These include one epoch with Binospec (Fabricant et al., 2019) on the 6.5 m MMT telescope, one epoch with the Kast double spectrograph (Miller Stone 1993) mounted on the Shane 3 m telescope at Lick observatory, one epoch with the Goodman spectrograph (Clemens et al., 2004) on the 4.1 m SOAR telescope, one epoch taken with the DEep Imaging Multi-Object Spectrograph (Faber et al., 2003, DEIMOS) on the 10 m Keck-II telescope at Maunakea, and a final epoch with the Multi-Object Double Spectrographs (Pogge et al., 2010, MODS) on the twin 8.4 m LBT at Mount Graham International Observatory. These spectra were reduced using standard techniques, including bias subtraction, flat fielding, cosmic ray rejection, local sky subtraction, and extraction of one-dimensional spectra. The MMT data were reduced using the Binospec pipeline (Kansky et al., 2019). Most observations had the slit aligned along the parallactic angle to minimize differential light losses (Filippenko, 1982). Flux calibration was done with standard-star observations taken on the same night at similar airmass.
A pre-outburst spectrum is serendipitously available from observations using the Very Large Telescope/Multi Unit Spectroscopic Explorer (VLT/MUSE) spectrograph (Bacon et al., 2010) as part of the PHANGS666Physics at High Angular resolution in Nearby GalaxieS; http://www.phangs.org-MUSE survey (E. Emsellem et al., in prep.). This optical integral field unit provides a field of view with 02 pixels and a typical spectral resolution of Å over the nominal wavelength range, covering 4800–9300 Å. Observations of M74 (Kreckel et al., 2018, 2019) were taken on 2018 November 13 and targeted the source position in three rotations, alternating with two sky pointings, for a total on-source integration time of 50 min. Data reduction is carried out using a pipeline wrapping around the MUSE data reduction pipeline (Weilbacher et al., 2020) and developed by the PHANGS team.777https://github.com/emsellem/pymusepipe A log of the spectroscopic observations is given in Table 4.
3 Analysis
3.1 Metallicity
Using the adopted distance of 9.77 Mpc (McQuinn et al., 2017), AT 2019krl is located roughly 5.4 kpc from the center of M74. Assuming the oxygen abundance gradient in M74 is 12 + log[O/H]= dex kpc-1 (Berg et al., 2015) we derive 12 + log[O/H] = , a value consistent with the solar oxygen abundance of (Asplund et al., 2009). Therefore, we assume the metallicity at the location of AT 2019krl is approximately solar.
3.2 Extinction
The equivalent width (EW) of the Na I D 5889, 5896 absorption feature is often used following the prescription of Poznanski et al. (2012) to estimate the extinction of an extragalactic transient, although Phillips et al. (2013) have cautioned against using this relation to obtain extinction estimates. Unfortunately, the Na I D lines in AT 2019krl are seen only in emission (Figure 3), likely from a contribution from the surrounding circumstellar medium (CSM). For core-collapse SNe the observed color, for example, can be used to estimate the extinction, since the intrinsic colors of such SNe are relatively well defined (e.g., Drout et al., 2011; Stritzinger et al., 2018, although see de Jaeger et al. 2018). Since outbursts such as AT 2019krl are not well understood, this is also not a viable option.
However, we can instead attempt to constrain the reddening of AT 2019krl from the nearby stellar population. Using a technique similar to that outlined by Kreckel et al. (2013), we use penalized pixel-fitting (Cappellari & Emsellem, 2004; Cappellari, 2017) to determine the linear combination of Bruzual & Charlot (2003) simple stellar population templates that best fits an integrated 100 pc wide annular integrated spectrum. This fit requires a third order multiplicative polynomial, which agrees well in shape with a Calzetti et al. (2000) attenuation law. From this comparison we obtain a value of = 0.12 mag, after including the Milky Way line-of-sight reddening toward M74 of = 0.062 mag (Schlafly & Finkbeiner, 2011). This is only a lower limit, as circumstellar extinction around the transient may be much higher, but likely provides us with a reasonable estimate of total foreground extinction which we will use throughout the rest of the paper.
3.3 Light Curve and Color Evolution
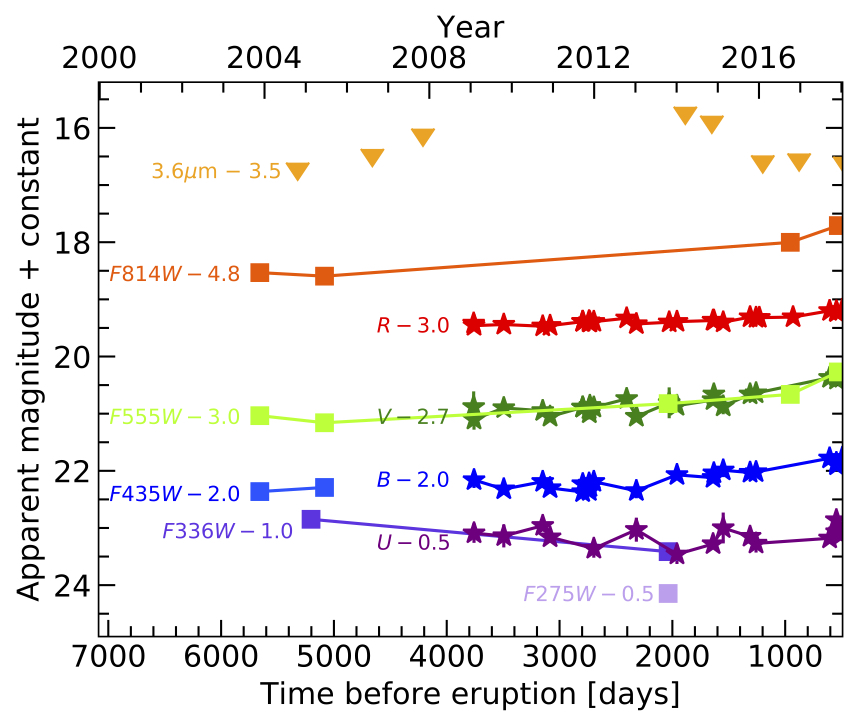
The optical light curves, shifted for ease of viewing, are shown in Figure 2, with the photometry listed in Tables 1, 2, and 3. The absolute magnitudes of the progenitor at the first epoch in 2003 are roughly 6.0 mag, 6.3 mag, and 6.8 mag corrected for = 0.12 mag. In 2013 the progenitor is somewhat brighter with 5.9 mag, 6.1 mag, and 6.5 mag. From our HST photometry taken in 2017, we see that 7.0 mag, or almost a magnitude brighter than in 2003, and that between 2017 September and 2018 September it brightens by another 0.1–0.2 mag. The LBT data, which begin in 2009, show a fairly flat evolution up until late 2017, eliminating any other major eruptions in the decade previous.
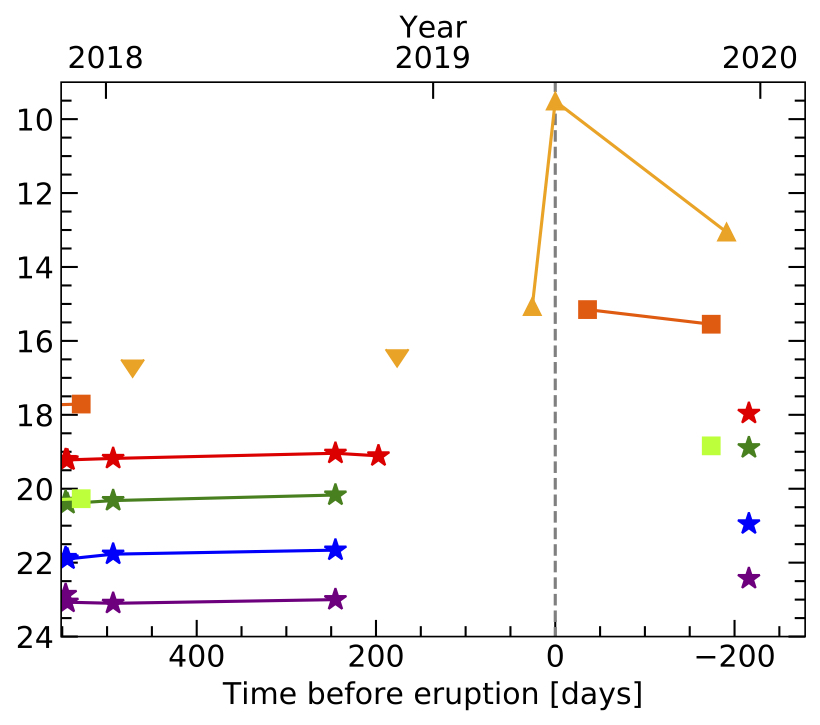
The 3.6 m magnitudes are also shown in Figure 2. Only upper limits are obtained for the majority of the early evolution, but similar to the optical data, the 3.6 m and 4.5 m data do not seem to indicate any major outbursts between 2004 and 2018. There is a noticeable increase from 2018 December to 2019 April as the 4.5 m luminosity increases from 11.9 to 13.0 mag. Finally, on 2019 May 17 we obtain our highest luminosities of 17.5 mag, and 18.4 mag. From these Spitzer data, we can constrain the peak of the outburst to be between 2019 April 21 and May 17. The peak was not observed in the optical data owing to Sun constraints.
We only obtained a handful of observations after discovery. The photometry from the ACS/ image taken on 2019 June 22 reveals a luminosity of 10.2 mag, which then falls to 9.9 mag by 2019 November 07. Similarly, and have dropped to 13.9 and 15.2 mag, respectively, by 2019 November, corresponding to a decrease of roughly 0.02 mag day-1.

As shown in Figure 5, the source steadily becomes redder, with a larger change in the color of the bluer bands. The color evolves from roughly 0.6 to 0.1 mag, the from 0.4 to 0.8 mag, and the HST color remains fairly flat at mag. After the eruption the HST and colors both jump to roughly 1.4 mag, while gets redder by only 0.1 mag. This indicates that the post-eruption object was much redder than the pre-eruption progenitor. We will discuss how the light curve and color evolution can be used to infer progenitor and explosion properties in Section 4 below.
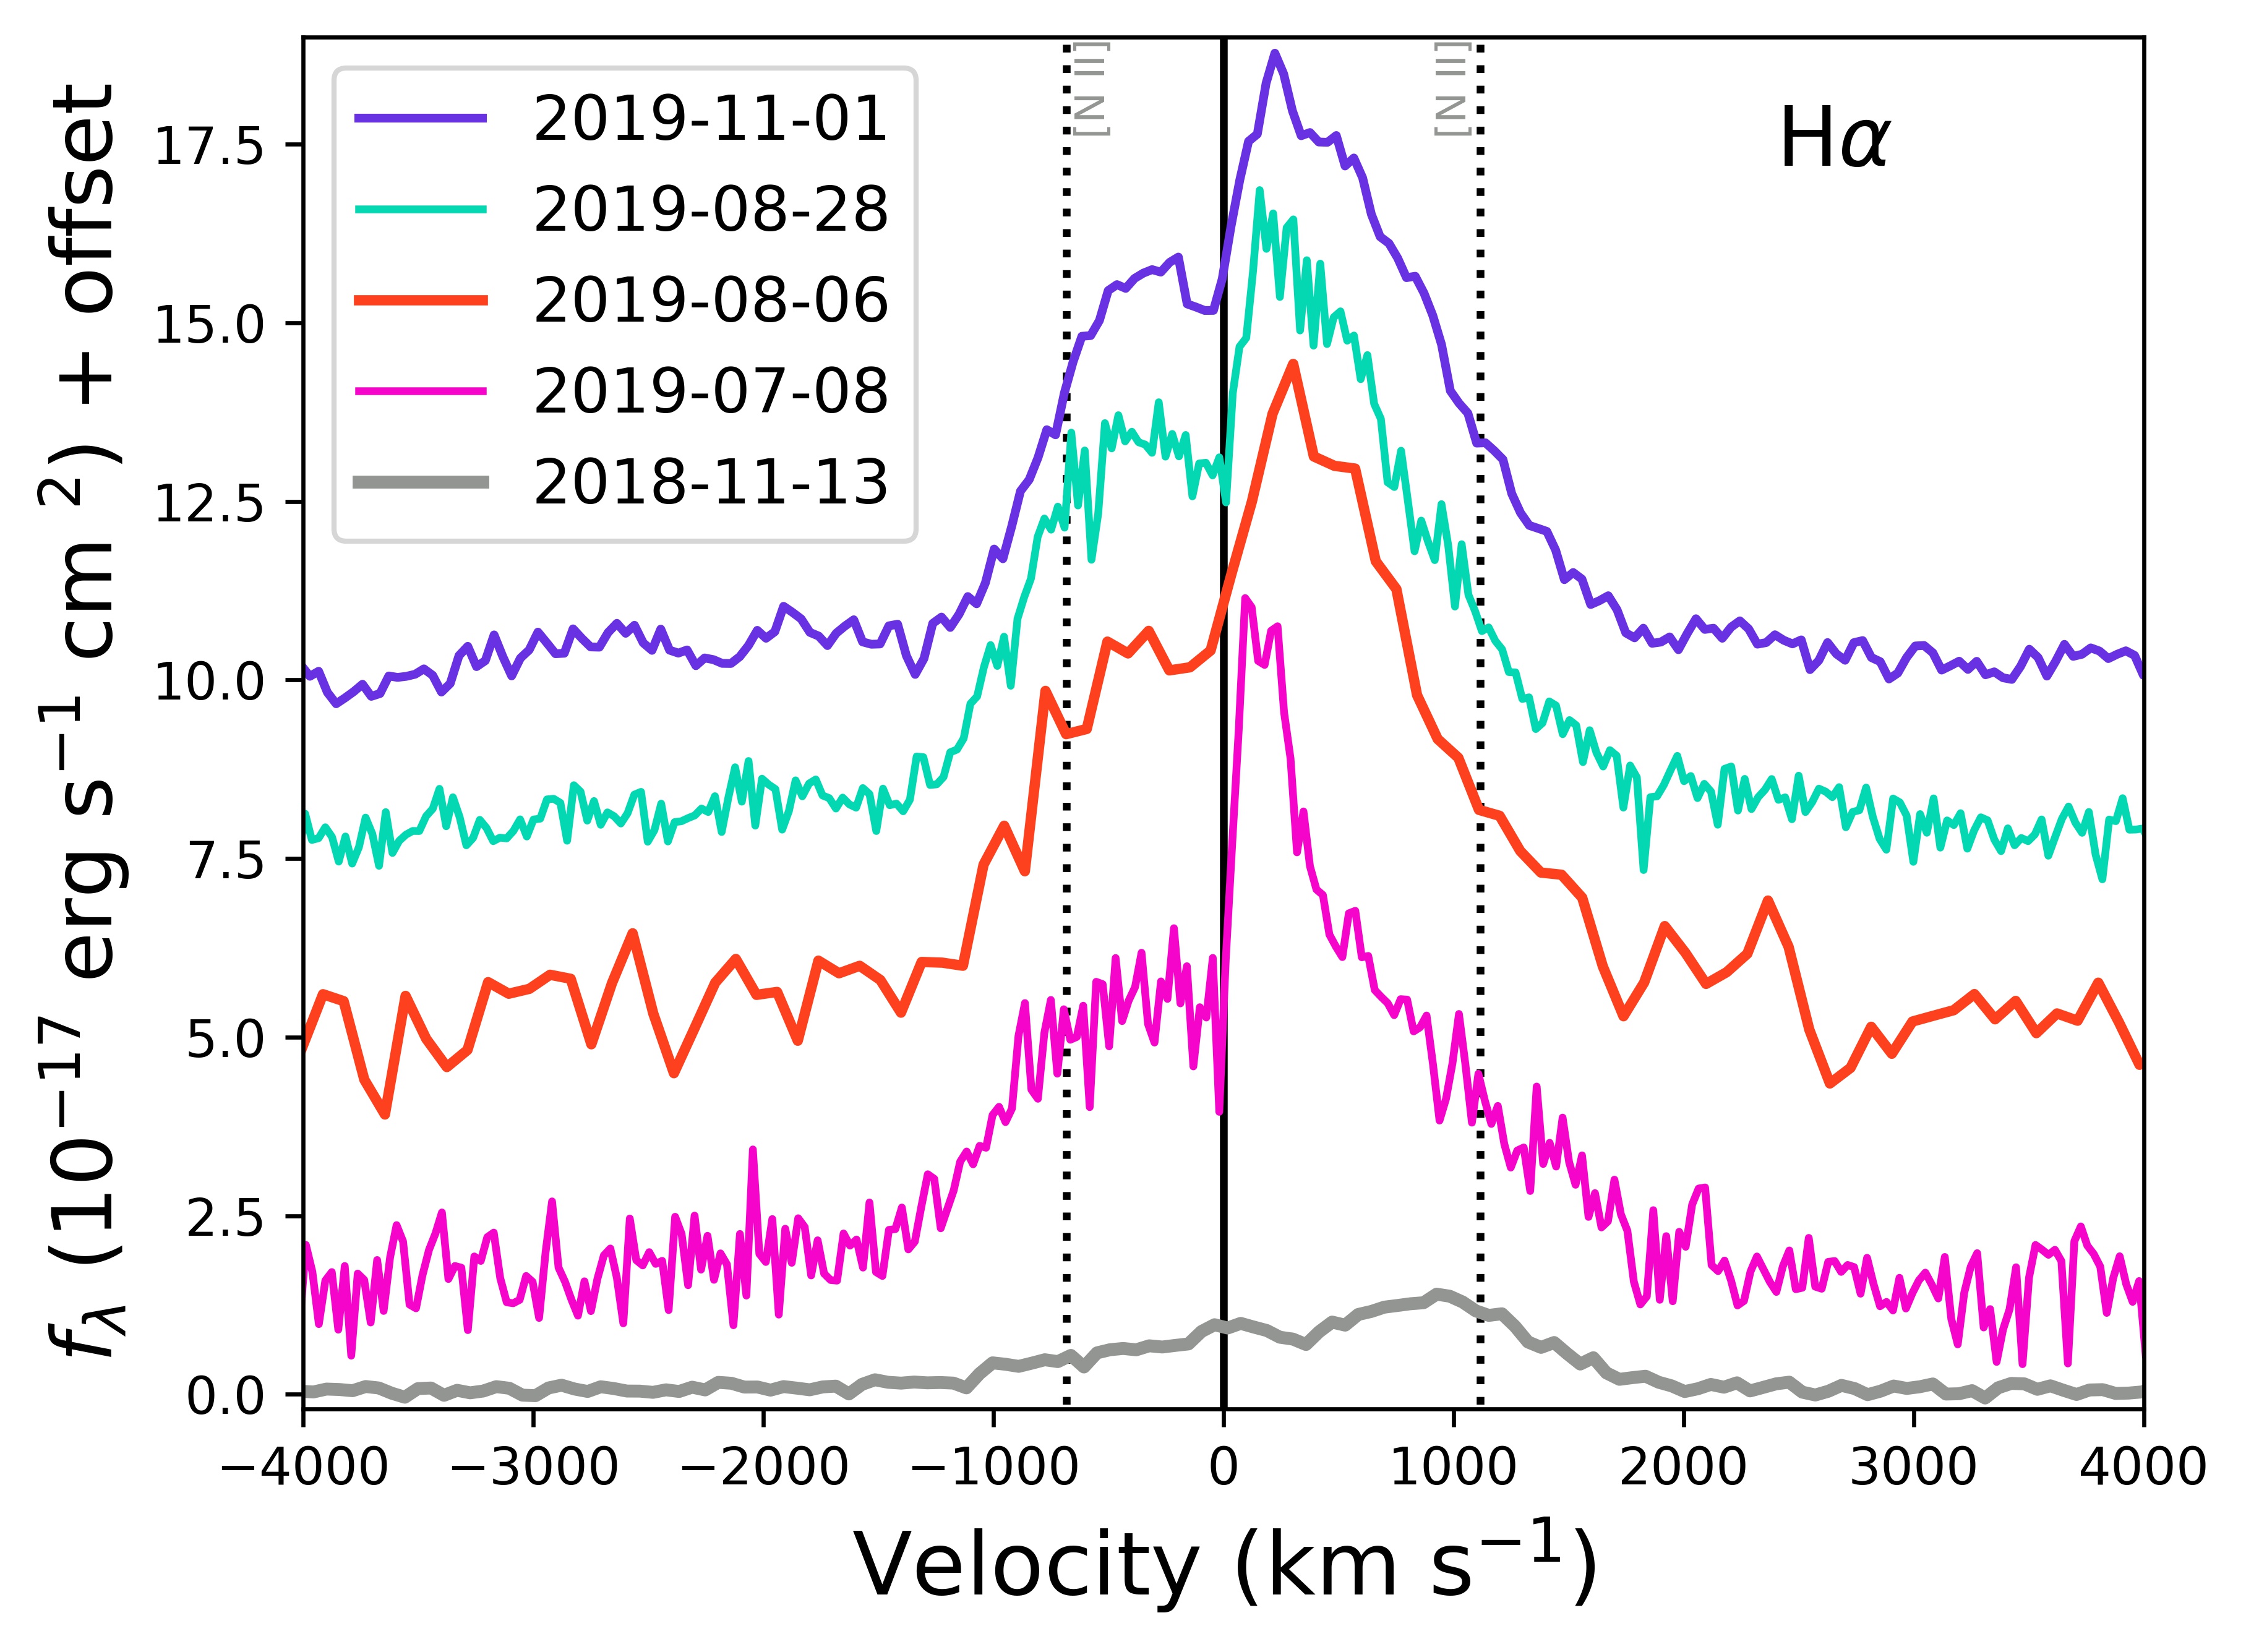
3.4 Spectroscopic Evolution
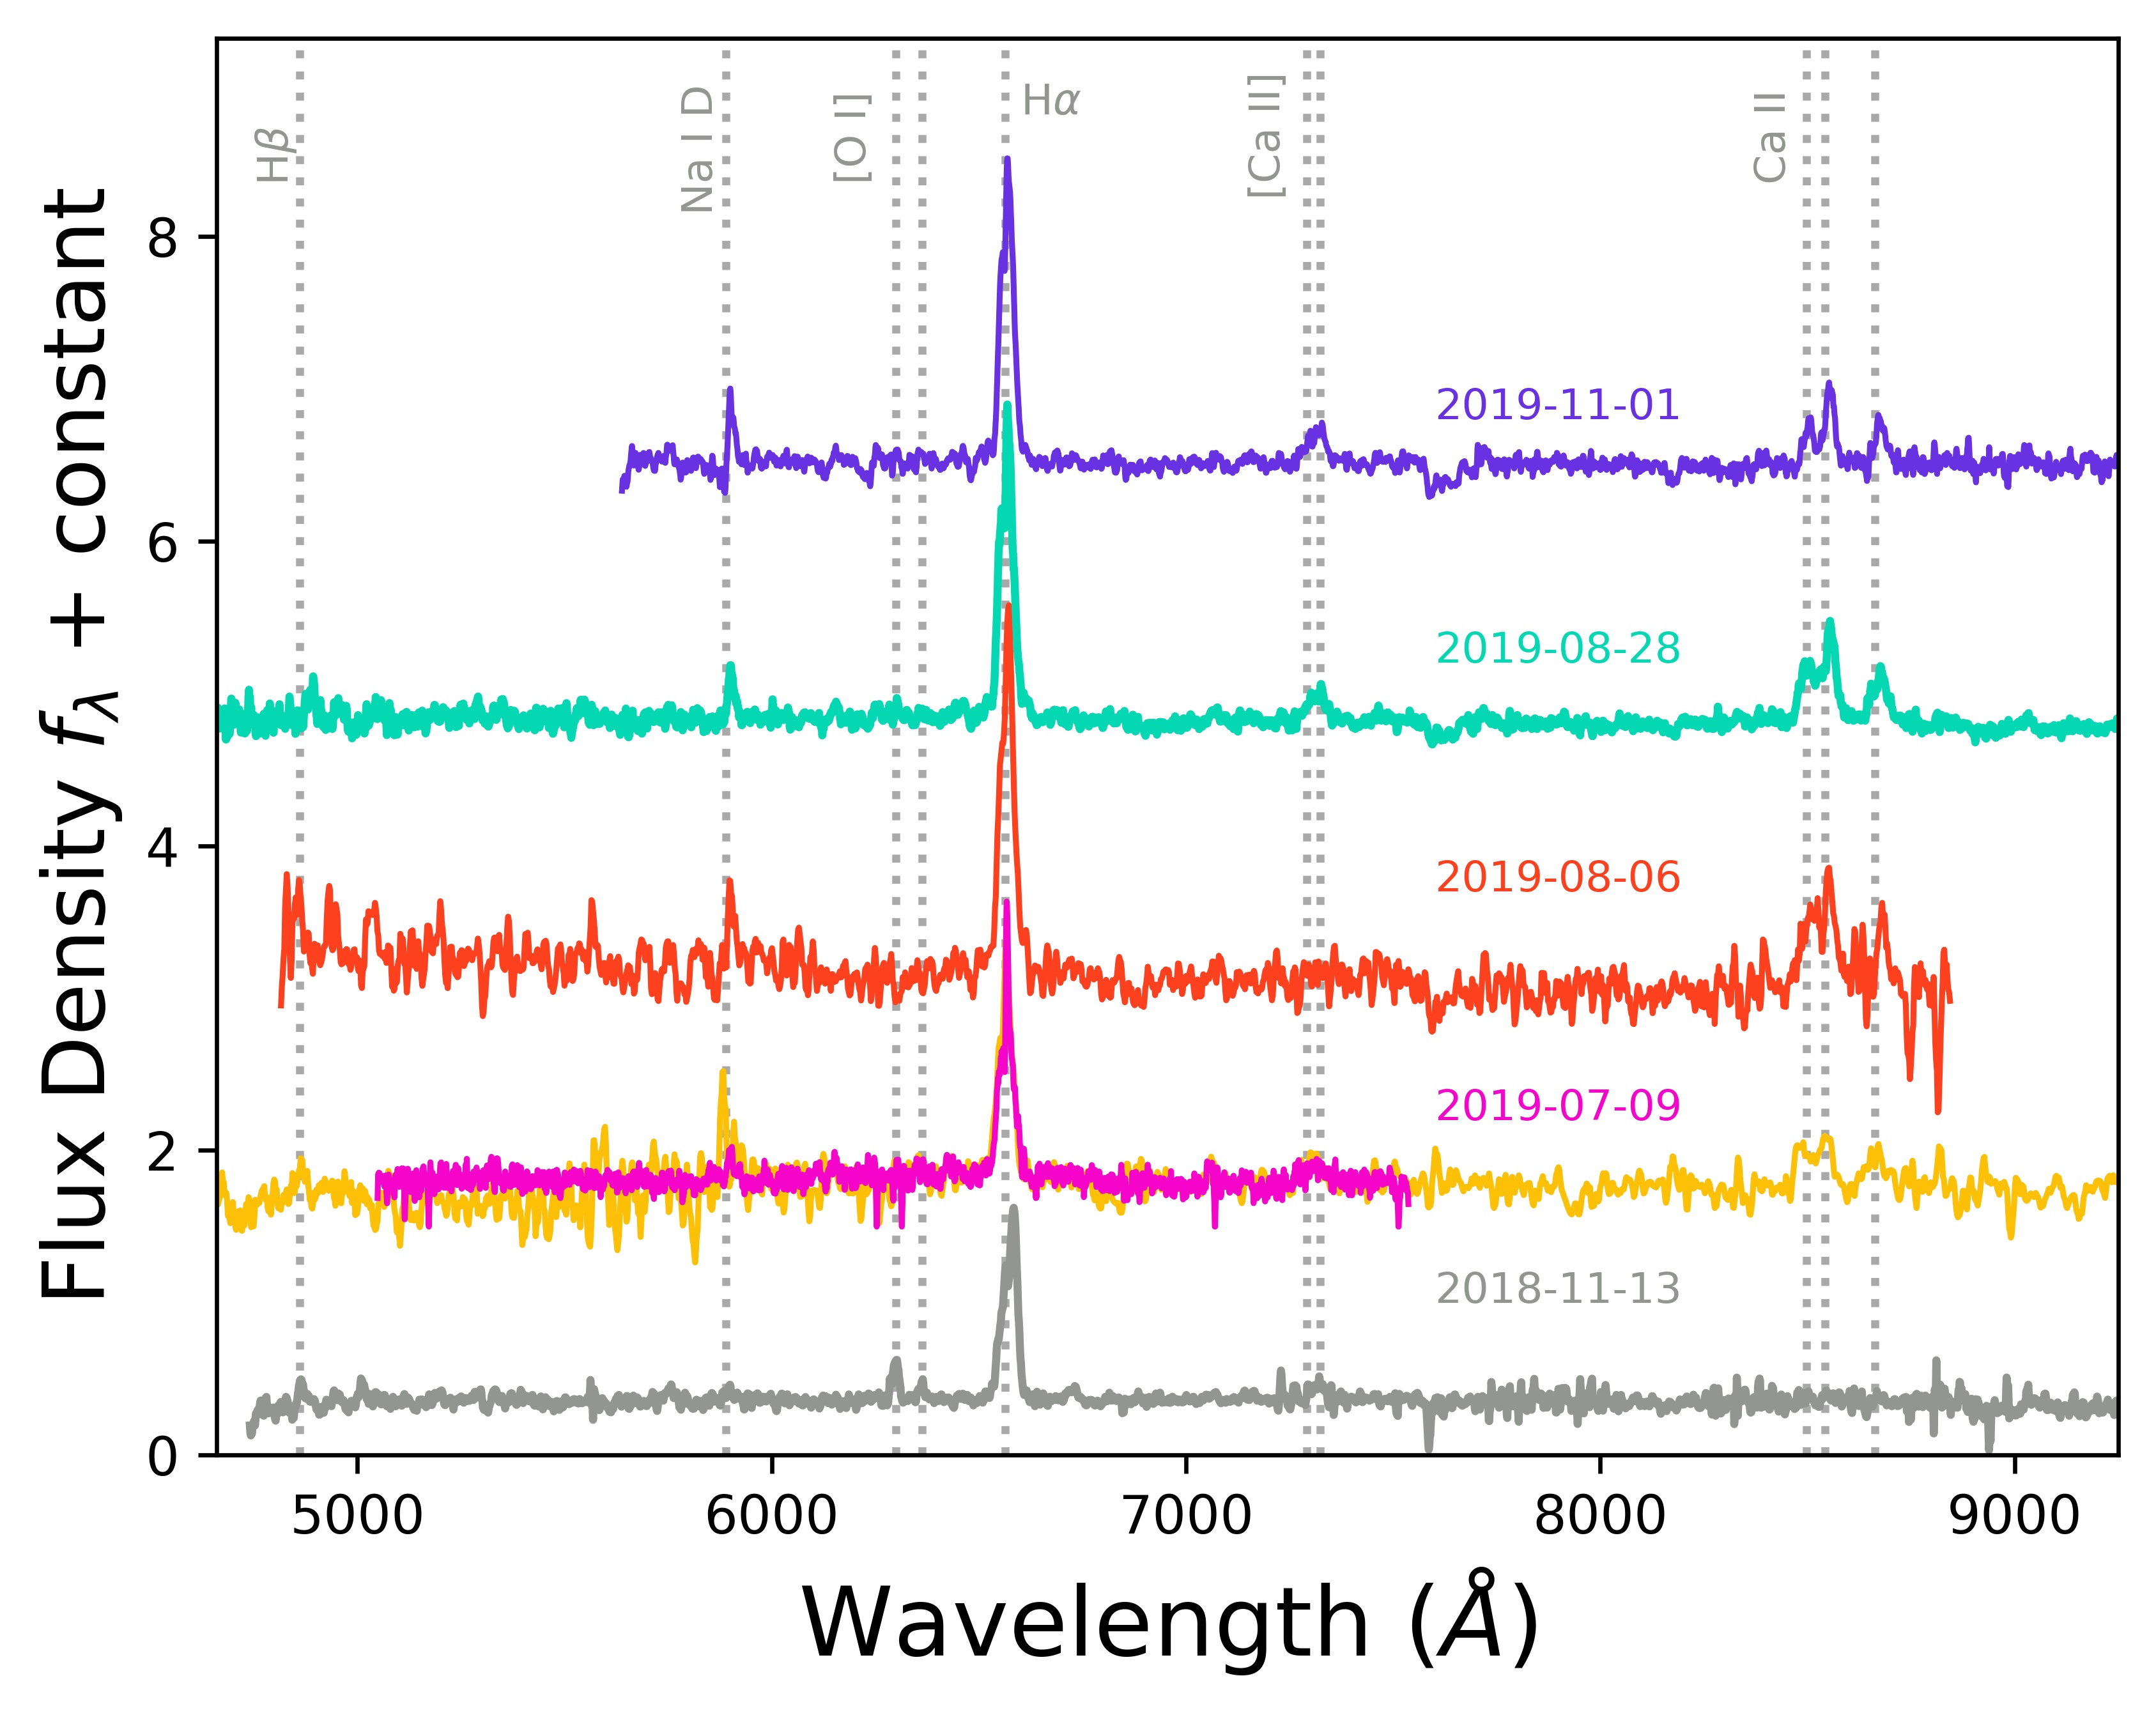
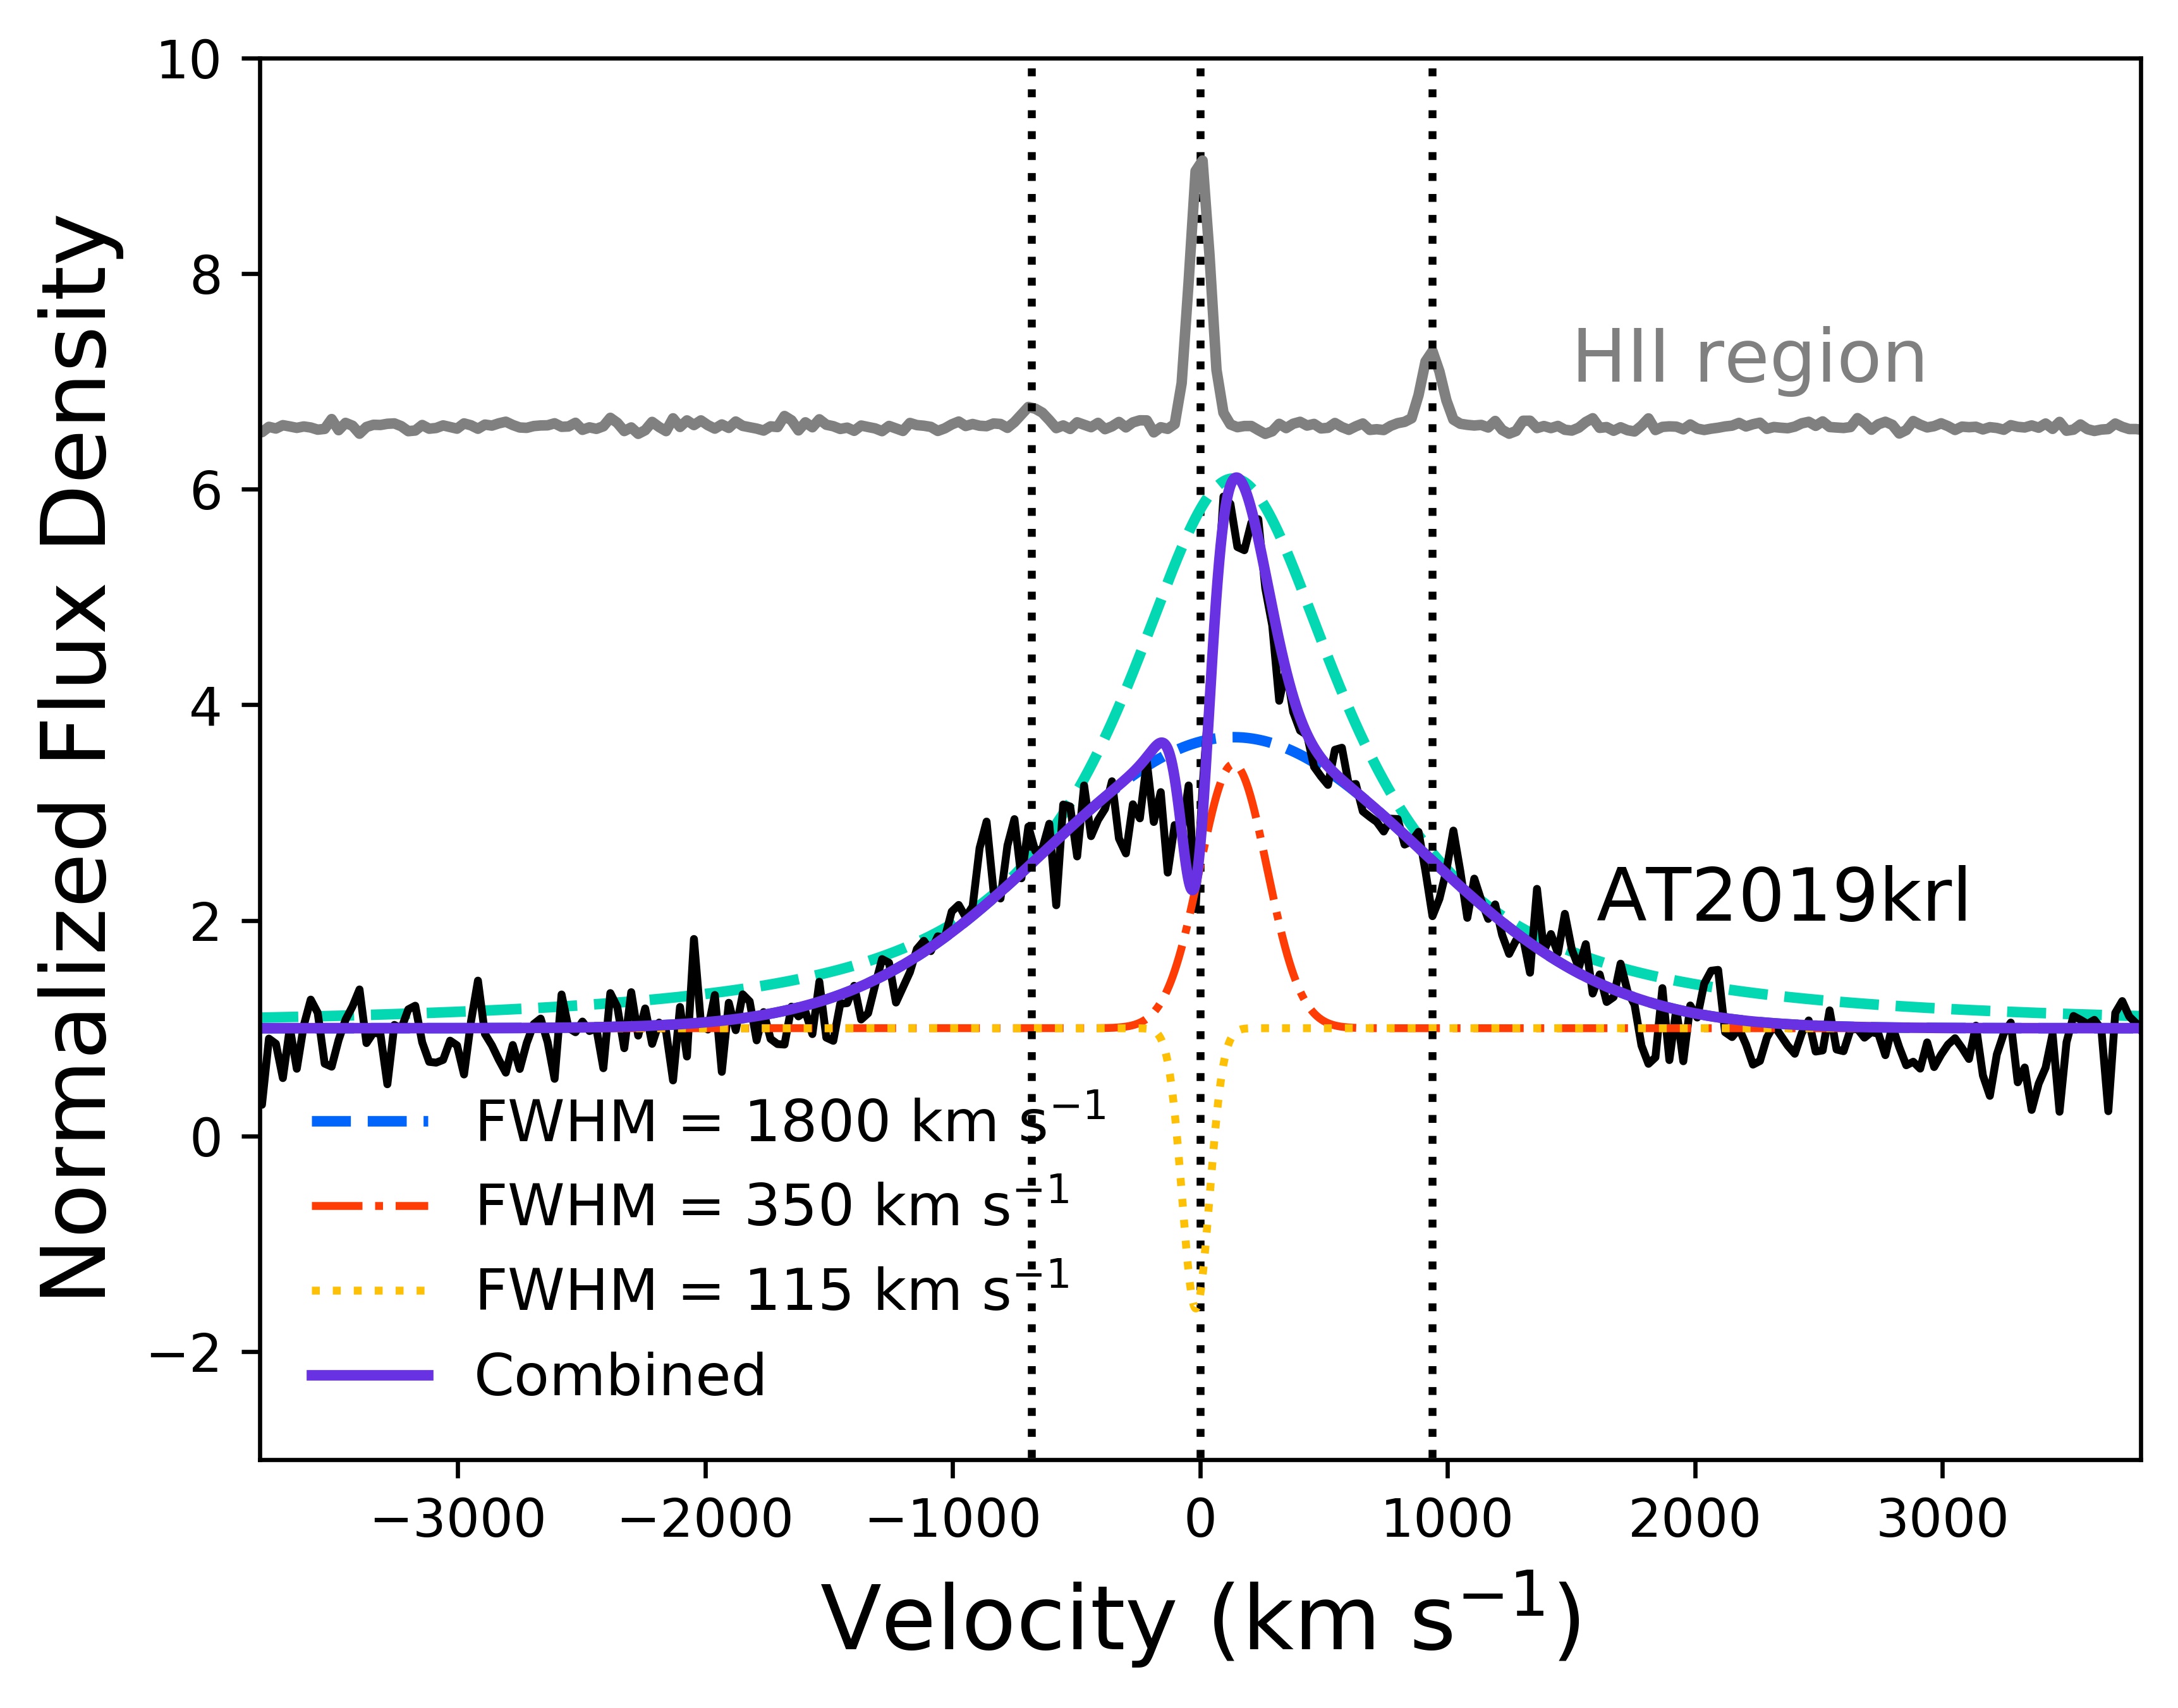
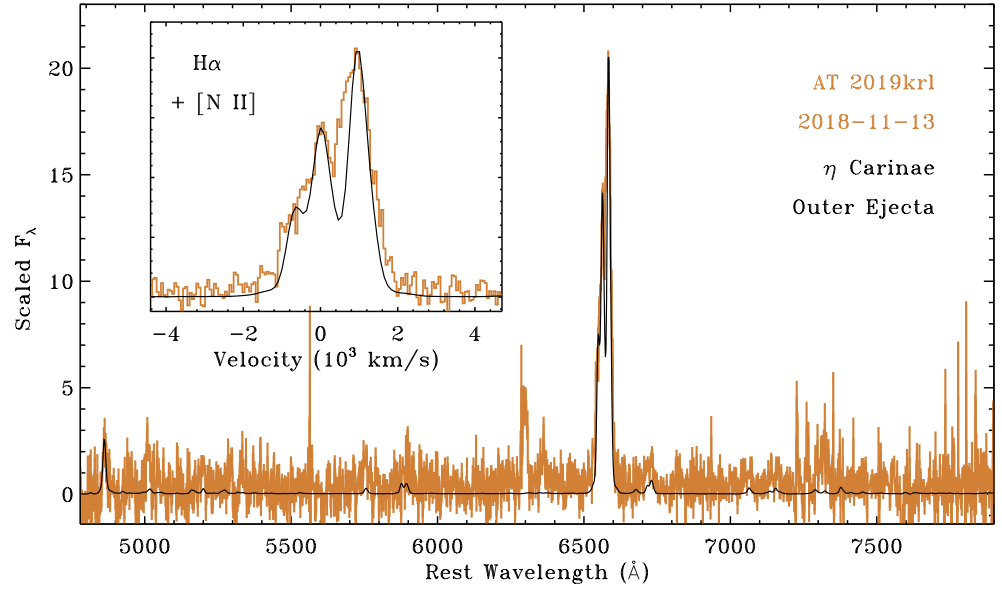
The spectroscopic evolution of AT 2019krl, including a progenitor spectrum from months prior to eruption, are shown in Figure 3 and listed in Table 4. To confirm the rest velocities of the components which appear redshifted with respect to the zero velocity of the galaxy, we have also plotted the profile of a nearby H II region in Figure 4. This exercise shows that there is a true velocity offset between the H II region and the peak of H emission, and that we are fully resolving the narrow H component in AT 2019krl, which is much broader than the H II region lines.
All spectra exhibit prominent H emission, but are otherwise almost featureless. As Figure 4 shows, the H emission line in all epochs appears to be multipeaked, with an absorption feature near km s-1 as measured from our earliest spectrum on 2019 July 08 from the MMT. This spectrum can be reproduced by a combination of a broad Gaussian with full width at half-maximum intensity (FWHM) = 2000 km s-1 and a narrow Gaussian with FWHM = 350 km s-1, both in emission and centered at +135 km s-1, combined with a narrow Gaussian in absorption centered at km s-1 and with FWHM = 115 km s-1. The absorption feature is unresolved, so the model line-width is only an upper limit for the true FWHM of the absorption line. This P Cygni absorption persists over the next few months, and as we show in Figure 6, the absorption minimum and width are almost identical between the July MMT spectrum (dashed gray line) and the November LBT spectrum (red solid line). This indicates that the faster material from the eruption is still expanding into slower-moving CSM.
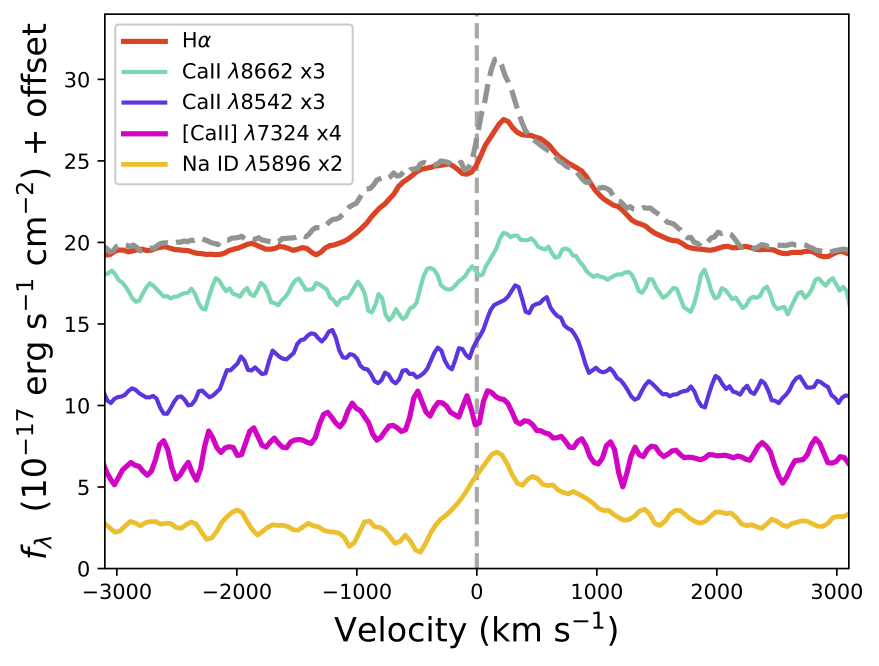
The strong Ca II NIR triplet, which is not present in the progenitor, as well as Na I D 5890, 5896 and very weak [Ca II], are all seen in emission in the post-eruption spectra. A comparison of the prominent emission lines from our last epoch on 2019 November 01 is shown in Figure 6, where some lines have been multiplied by a constant indicated in the legend for ease of viewing. While the red side of Ca II NIR and H are qualitatively similar, both lack an extended red shoulder that is seen in the other lines. The absorption in the Ca II lines at km s-1, which is offset by –900 km s-1 from the peak of the line, may indicate multiple locations for the various line emissions. This could be explained with an eruption in a dense, equatorial CSM, where the ejecta could expand much faster at the poles, yet slower in the plane of the disk where the [Ca II] emission would arise. A similar trend of faster H and Ca II and slower [Ca II] was seen in the post-eruption spectra of UGC 2773-OT which may also have a bipolar nebula (Smith et al., 2016a).
| Date | MJD | Telescope | R | Exp. |
|---|---|---|---|---|
| +Instrument | / | (s) | ||
| 2018-11-13 | 58435.41 | VLT+MUSE | 2600 | 3000 |
| 2019-07-08 | 58672.46 | MMT+Binospec | 3100 | 1800 |
| 2019-07-09 | 58673.95 | Lick Shane+Kast | 770 | 3600 |
| 2019-08-06 | 58701.35 | SOAR+Goodman | 1100 | 1800 |
| 2019-08-28 | 58723.56 | Keck+DEIMOS | 1875 | 1200 |
| 2019-11-01 | 58788.19 | LBT+MODS | 2000 | 900 |
4 Results
4.1 Constraints on the Progenitor
The HST and LBT data, along with the MUSE spectrum of the progenitor of AT 2019krl, allow us to thoroughly investigate the properties of the star that gave rise to this transient. Without a reliable value for the local extinction, our conservative choice of 0.12 mag will only provide lower limits to the mass and temperature of the progenitor, but will allow us to rule out certain classes of stars.
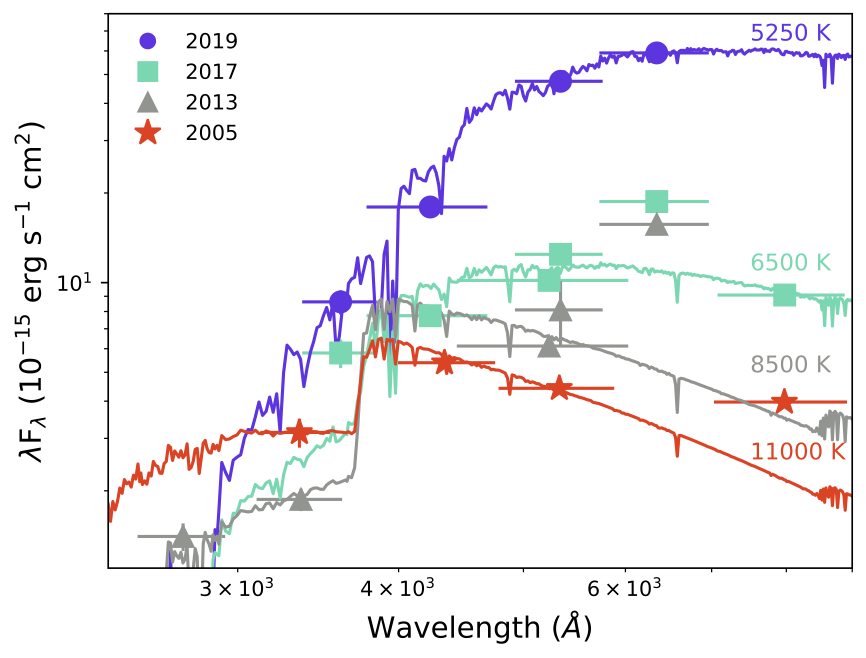
In Figure 7 we show the optical spectral energy distributions (SEDs) of the progenitor from photometry in 2005 (HST only), 2013 (HST and LBT), and 2017 (HST and LBT). These epochs were chosen owing to the availability of the ultraviolet (UV) and -band data, which provide the tightest constraints on the masses and temperatures of massive stars. We have attempted to fit the data with ATLAS synthetic spectra of stars of solar metallicity and log() = 2.0 (Castelli & Kurucz, 2003). From all three epochs we can immediately rule out a cool progenitor, such as a red supergiant (RSG) or an AGB star, as even the minimum fit temperature of 6500 K is too high for those types of stars. The P Cygni absorption feature seen in the MMT spectrum is offset by km s-1 from the peak of H traces the outflow wind velocity of the star, is also faster than typical RSG winds that have average wind velocities of 10–20 km s-1 (Mauron & Josselin, 2011; Goldman et al., 2017; Beasor & Davies, 2018). Moreover, RSGs and AGB stars do not exhibit strong H emission.
The 2005 epoch can be best fit by an 11,000 K star with log(/L☉) = 4.4, although there is excess emission in the band that cannot be fit with just a single stellar model. In the subsequent two epochs the progenitor appears to cool and become more luminous with time, dropping to = 6500 K with a higher luminosity of log(/L☉) = 4.6 by 2017. This is, of course, a lower limit, since any additional extinction (host or circumstellar) would raise both the temperature and luminosity. For instance, acceptable fits could be made to the 2005 data with a 17,000 K model and mag. Note that we have not attempted to fit the -band data in 2013 and 2017, as this filter contains the bright H emission seen in the progenitor spectrum.
For comparison, yellow supergiants (YSGs) have 7500 K 4800 K and log(/L☉) , with LBVs and blue supergiants (BSGs) exhibiting significantly warmer temperatures. LBVs in their cool outburst states typically have temperatures around 6000–10,000 K. The SED fits therefore indicate that the progenitor star was either a rather hot YSG, a quite cool BSG, or an LBV-like star in a cool phase. The color evolution (shown in Fig. 5) is too blue for an RSG, and is more consistent with a BSG or YSG.
In Figure 8 we compare the 2005 and 2013 HST data to the MESA Isochrones Stellar Tracks (Choi et al., 2016; Dotter, 2016, MIST888http://waps.cfa.harvard.edu/MIST/) to help constrain the progenitor masses. For each epoch we have determined the best-fit mass for three possible extinction values, with the lowest value of = 0.4 mag corresponding to that used throughout this paper. The colors indicate the main sequence (MS, red), supergiant branch (SGB, teal), and helium core burning (HeCB, yellow) phases, and the solid, dotted, and dashed lines show the various mass tracks. In both 2005 and 2013 we find a lower limit to the progenitor mass of 13.5 M☉; however, the data with the largest amount of extinction applied yield a progenitor mass of 58 M☉ in 2005 and only 29.5 M☉ in 2013.
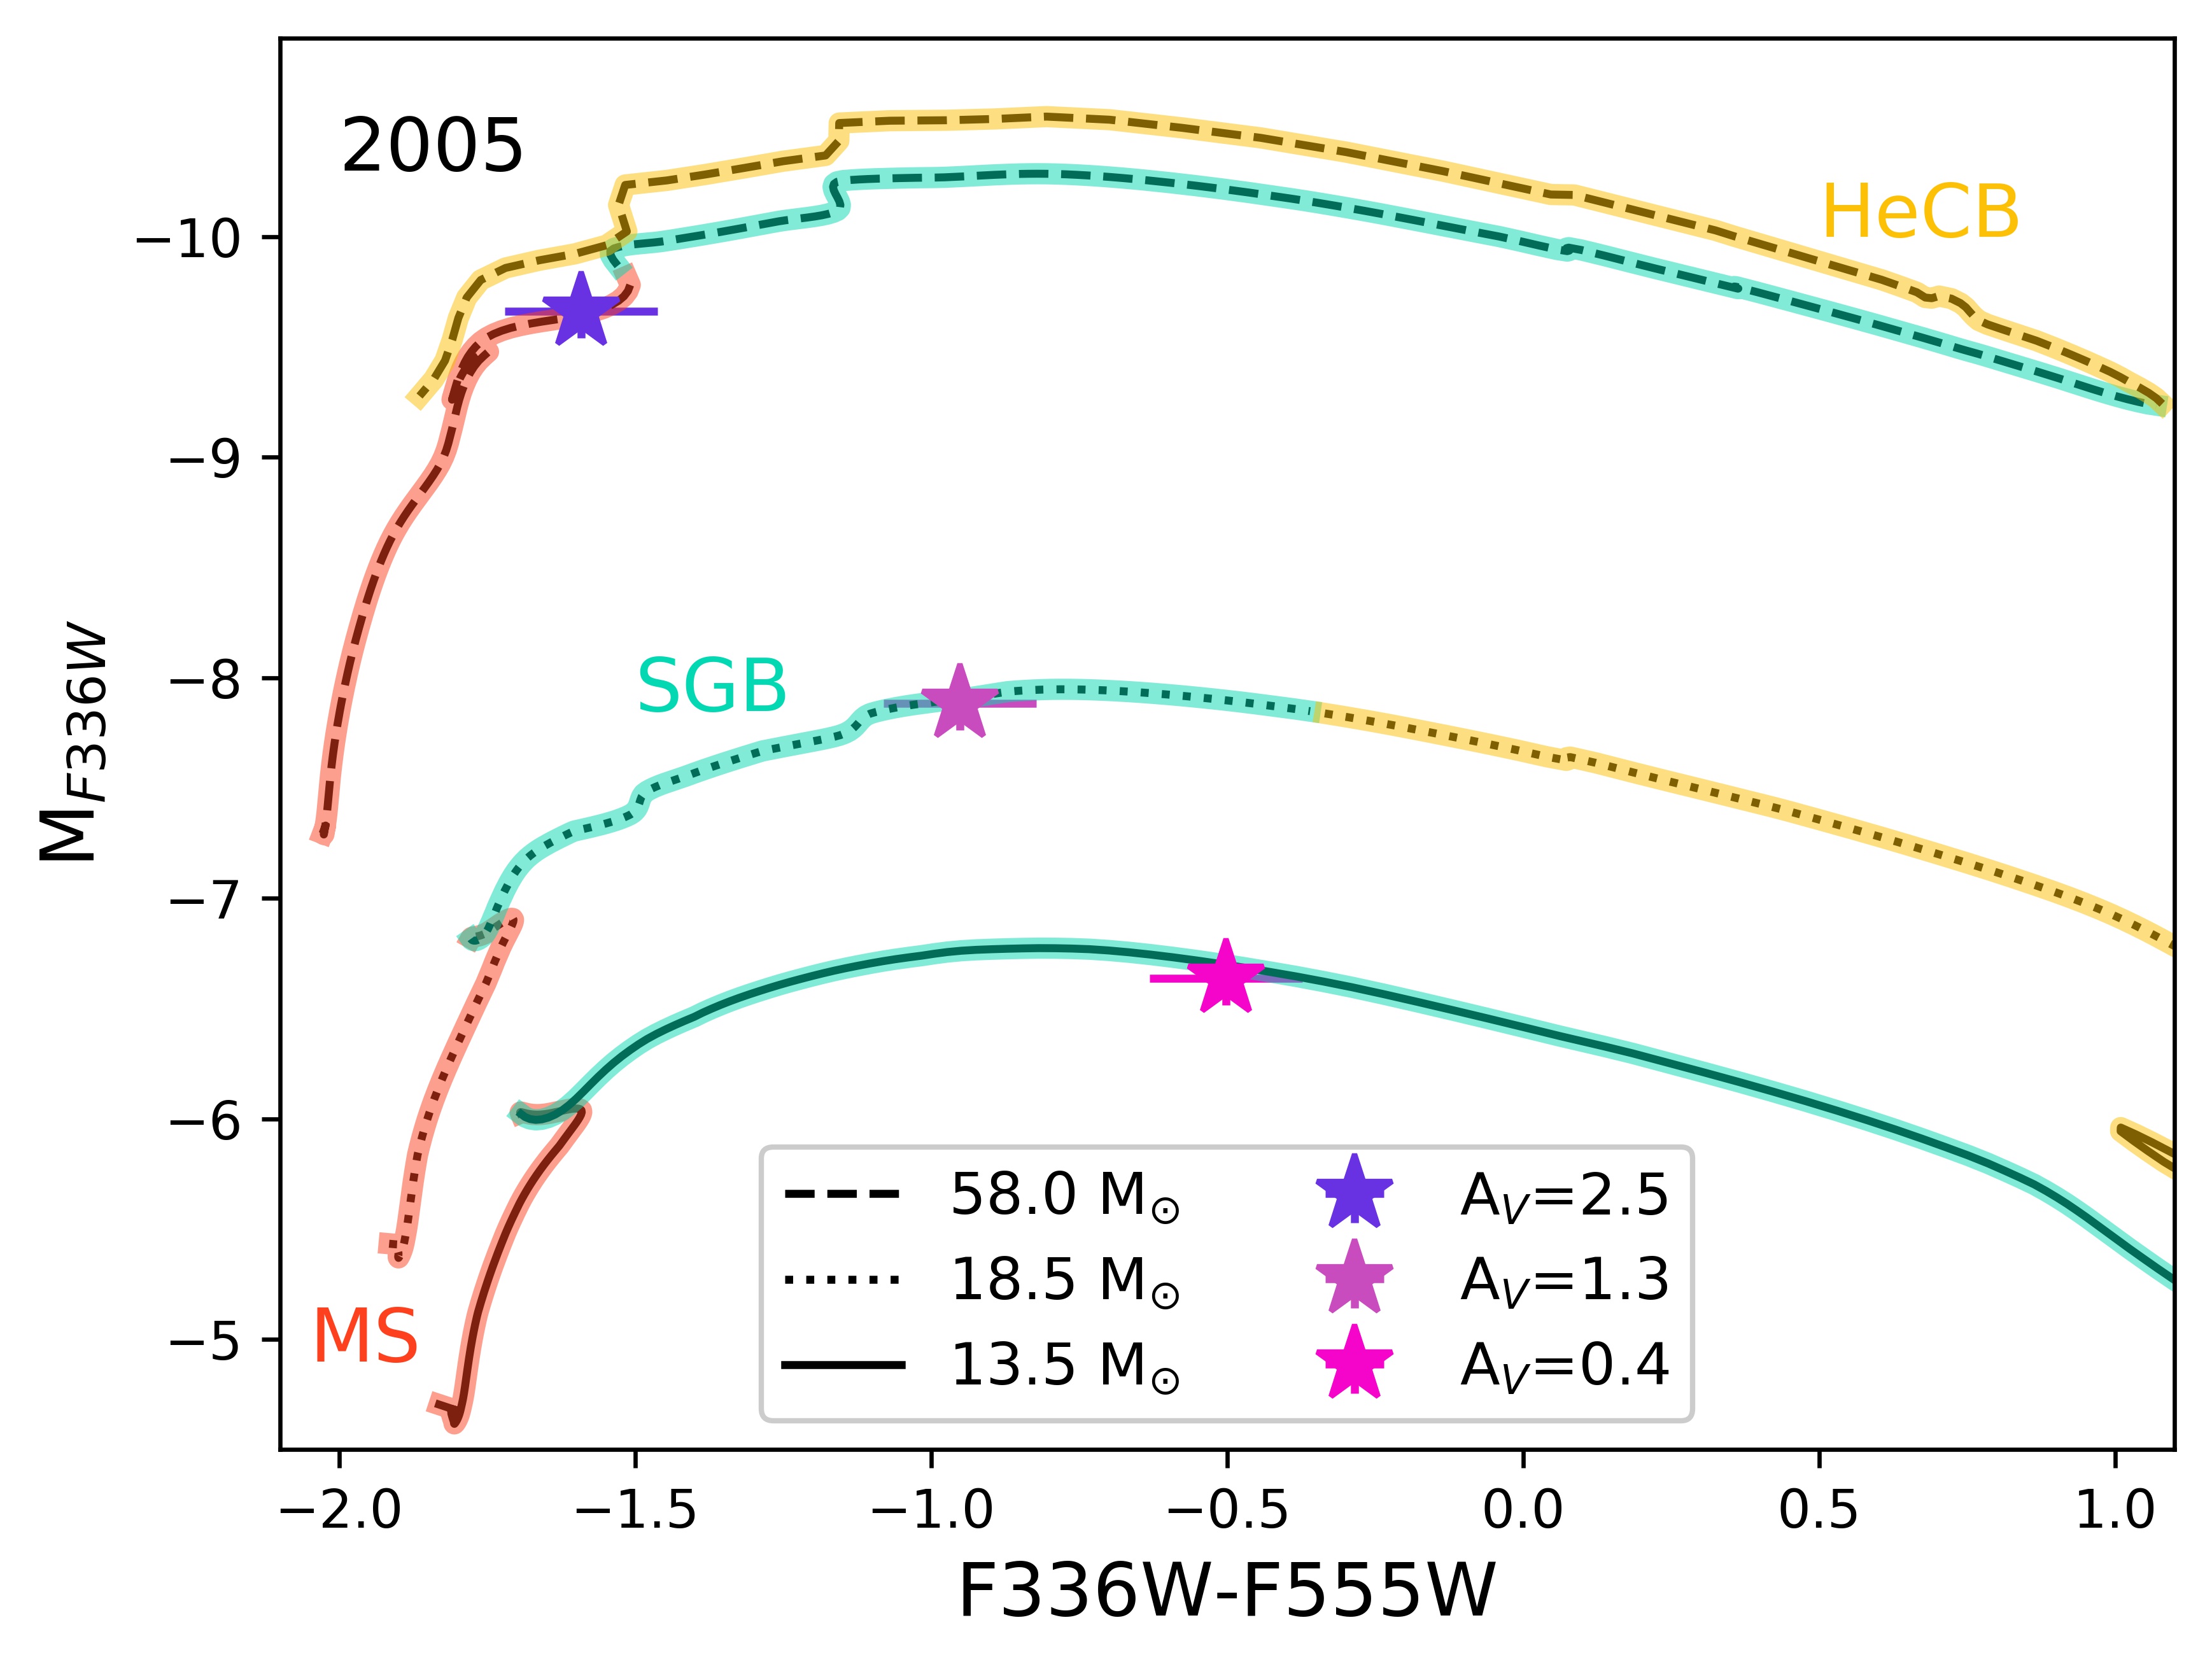
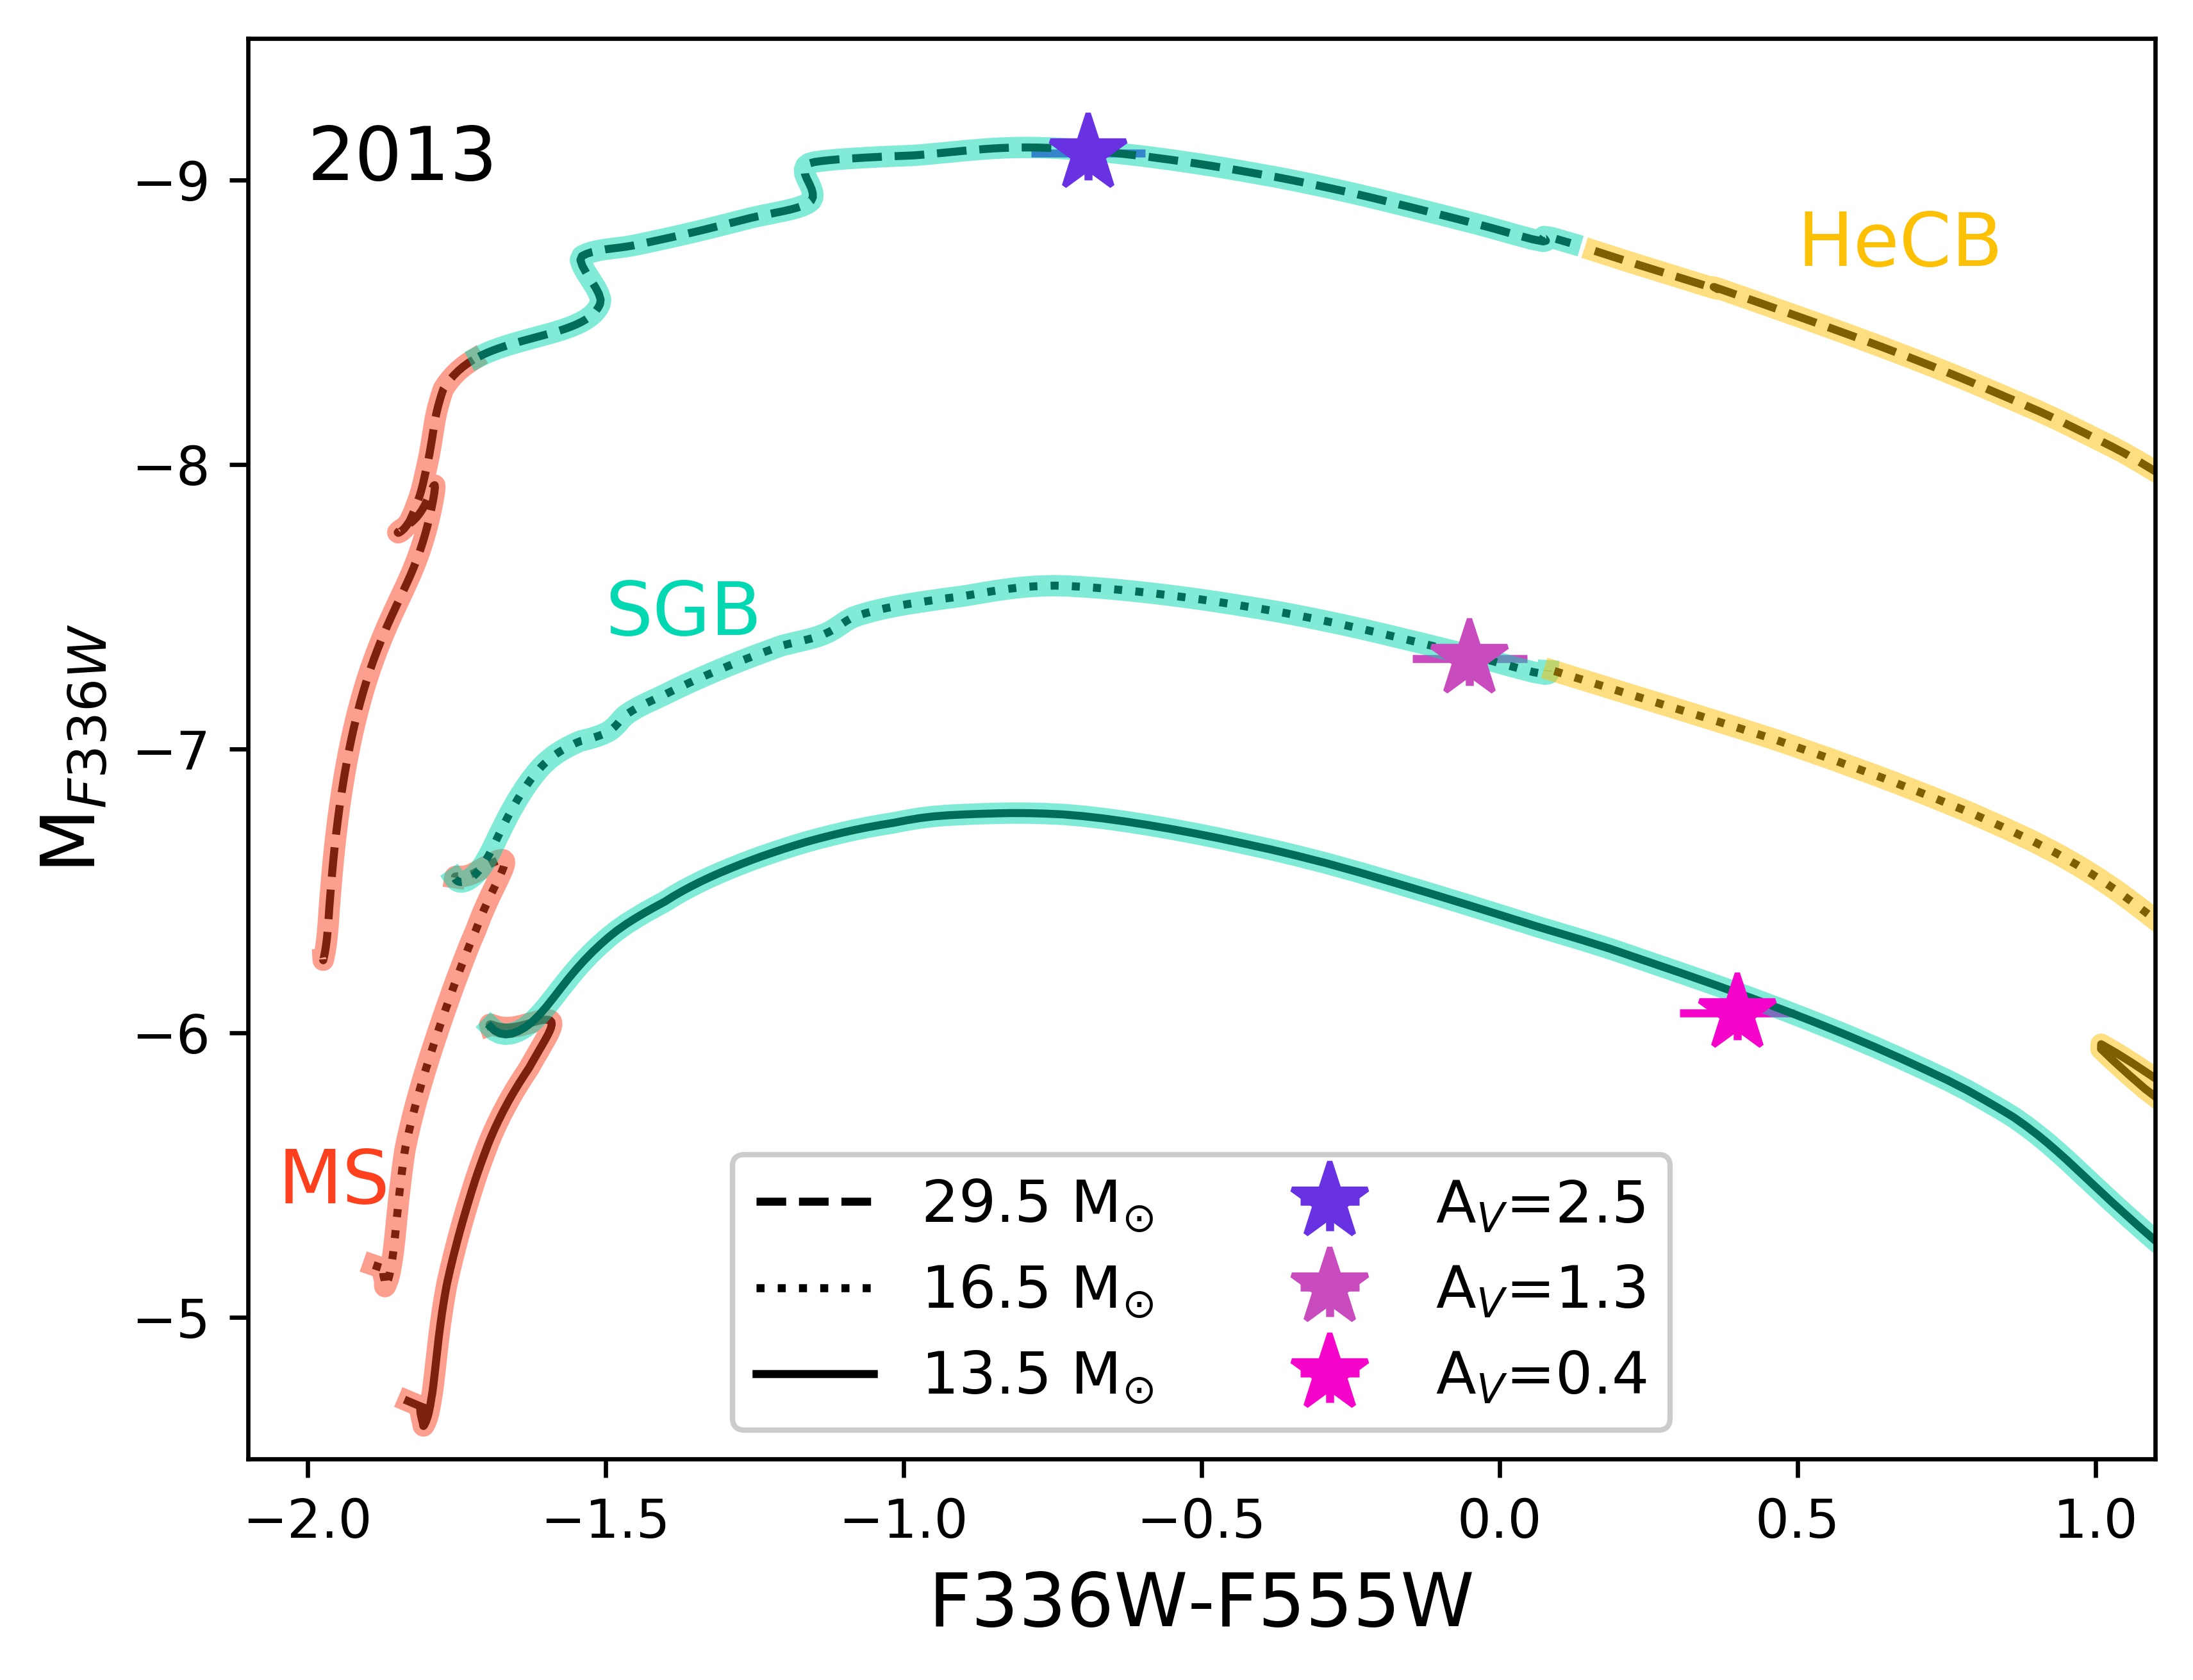
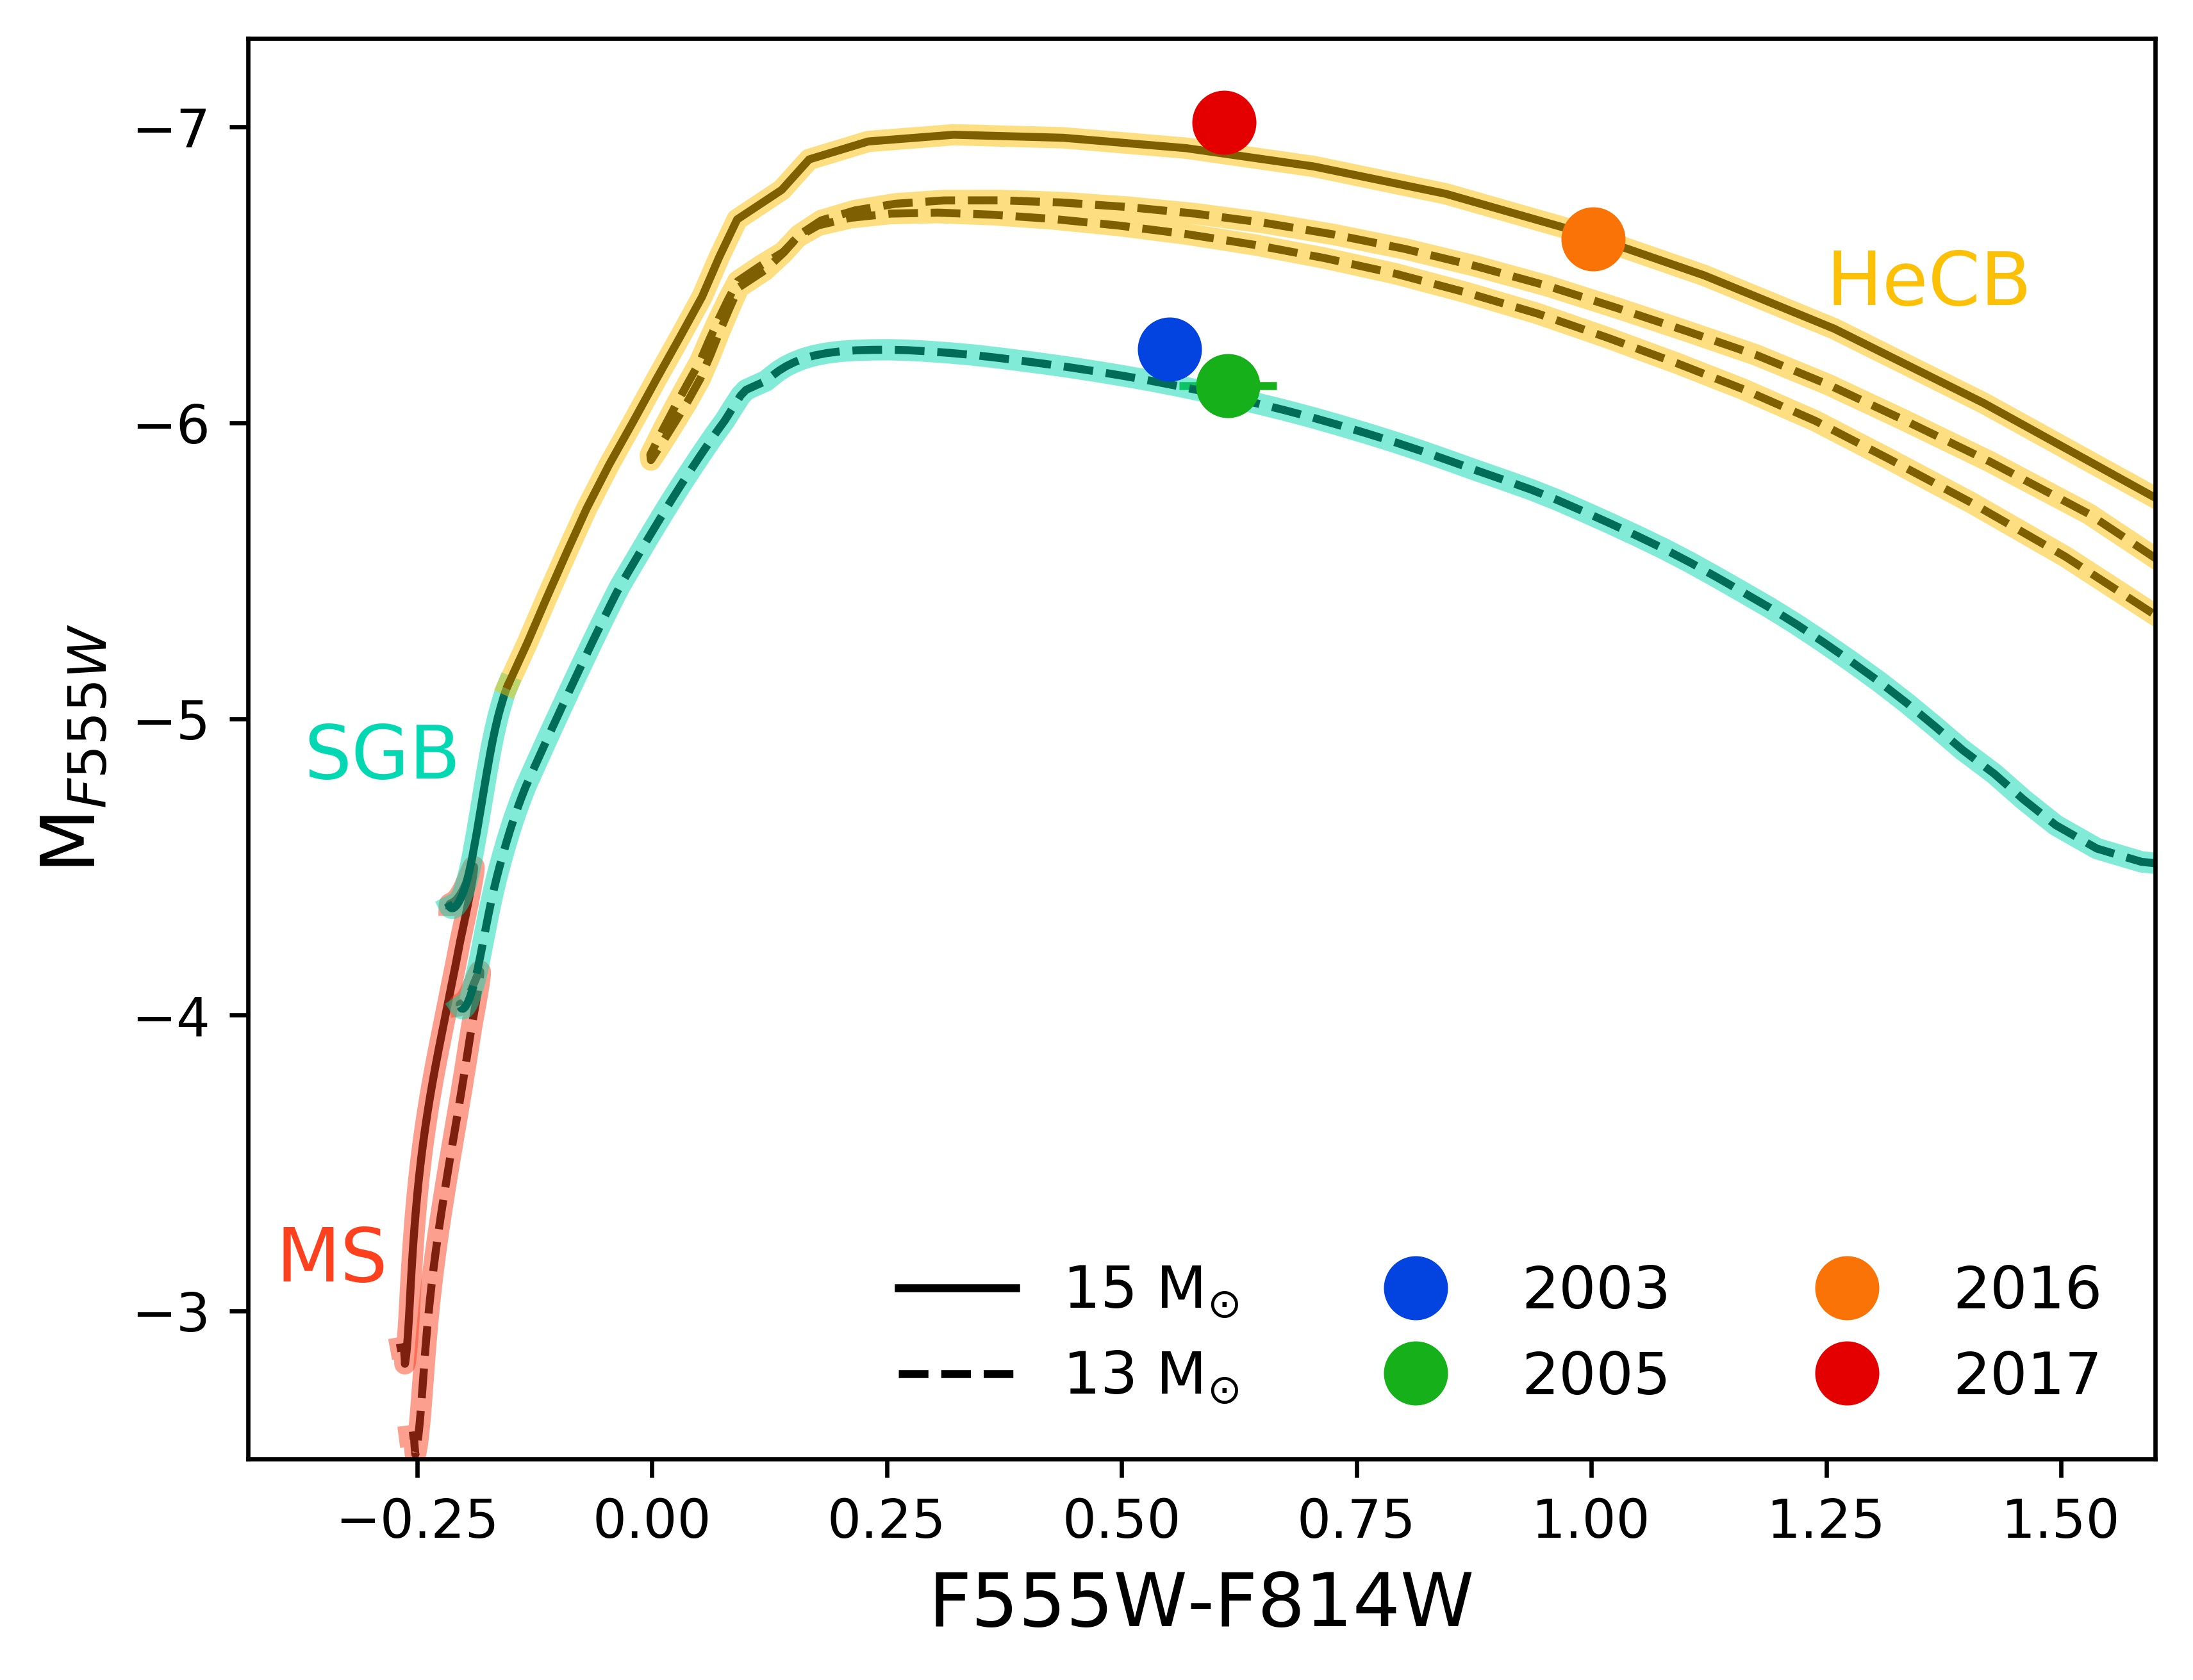
To illustrate how the progenitor mass estimate changes depending on the epoch, we show the evolution of the source in and in Figure 9. Similar to the SED fits, there is a trend to redder colors with time. This translates to shifts in progenitor mass estimates from around 13 M☉ to 15 M☉, but also a shift in the inferred evolutionary stage from SGB to HeCB. This, of course, is not real evolution, as the change to helium core burning takes significantly more time than a mere 15 yr. Instead, it illustrates how changes in the stellar structure due to instability before an eruption can mimic observed evolutionary changes; values for the inferred mass or luminosity from any single epoch of such a transient should therefore be regarded with caution.
We can also use the stellar population of the local environment surrounding AT 2019krl to put some constraints on the progenitor. Color-magnitude diagrams assembled from the 2003 HST data, assuming mag and shown in Figure 11, reveal no stars brighter than = –4 mag and = –6 mag within 50 pc of the progenitor star, and none brighter than = –5 mag within 100 pc. This nominally suggests a lack of stars more massive than 8 M☉ surrounding AT 2019krl, and that the progenitor of AT 2019krl is overluminous for the age that would be inferred from the surrounding stars. One way to create this scenario is through a binary rejuvenation in a blue-straggler star (Smith & Tombleson, 2015).
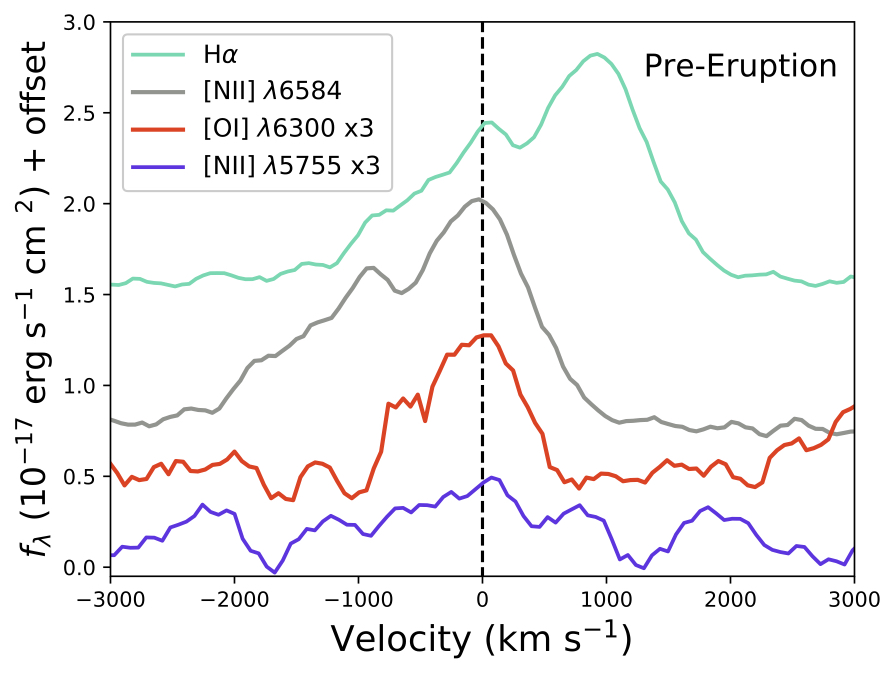
Finally, the progenitor spectrum provides clues about the physical state of the star prior to eruption. The spectrum is dominated by broad H with wings extending to roughly 2000 km s-1 (Fig. 3). Strong [N II] 6584 emission is present as well, much stronger than the H emission. Unlike the narrow emission lines of nearby H II regions that have FWHM at the resolution limit of the spectrum of km s-1, the [N II] 5755, 6584 and [O I] 6300, 6363 lines have much broader FWHM as shown in Figure 10 and listed in Table 5. This may point to emission of N-rich CSM, commonly seen around massive stars, although the excitation of the [N II] emission is uncertain and may be complicated by a mix of shock excitation and photoionization. In particular, shock excitation cannot be ignored as the broad line width is much faster than typical BSG or cool supergiant wind speeds.
The high [N II]/H intensity ratio and the width of almost km s-1 are reminiscent of the Outer Ejecta of Car (Smith & Morse, 2004). In Figure 10 we show the pre-explosion progenitor spectrum of AT 2019krl compared to that of the S Ridge in the outer ejecta of Car from Smith & Morse (2004), which has been scaled to the [N II] 6584 line strength of AT 2019krl. There are striking similarities between the two spectra. In the case of Car, the high [N II]/H ratio arises in very N-rich CSM ejected several hundred years prior to the main eruption, with expansion speeds faster than the bulk outflow in the main eruption or the present-day wind (Kiminki et al., 2016). In these ejecta around Car, the emission is powered by shock excitation as very fast ejecta overtake the CSM (Smith, 2008; Smith & Morse, 2004) and these N-rich ejecta are seen alongside a bright soft X-ray shell (Seward et al., 2001). There may also be photoionization from O-type stars in its surroundings, but the central star does not photoionize these ejecta, because they reside outside thick layers of CSM with neutral atomic gas, molecular gas, and dust (Smith & Morse, 2019).
It is plausible that the same mechanisms responsible for the N-rich emission seen in Car are at play in AT 2019krl, although the data are far less constraining for AT 2019krl. Regardless of excitation and chemical abundance, the strong, broad [N II] emission does point to prior episodes of mass loss with speeds faster than the progenitor’s wind, and that the current eruption is plowing into material lost in a previous eruption. Any previous eruption would have had to happen prior to 2003 or it would have been detected in our light-curve data. Therefore, we can estimate a lower limit of a radius of the nebula surrounding AT 2019krl to be 1100 km s-1 16 yr, or cm.
Photoionization may still contribute to the [N II] emission in AT 2019krl, although as we discuss below, the lack of nearby O-type stars combined with the fast [N II] may make this scenario less likely. It is also possible that other lines of ionized N may be present, but are lost in the noise of the spectrum, and the [N II] emission strength may be unrelated to the progenitor star’s temperature. The higher-excitation lines seen in the spectrum of Car’s ejecta that clearly require shock excitation are below the noise level in our progenitor spectrum of AT 2019krl.
Another class of stars that could possibly show this level of H flux are sgB[e] stars, which are easily confused with LBVs in quiescence, since they can appear spectroscopically similar, and have similar temperatures and luminosities. The sgB[e] stars generally show [O I] emission (Aret et al., 2016) which is not seen in the post-eruption spectra of AT 2019krl, although it is present in the pre-eruption spectrum with a simlar width to the [N II] lines (Fig. 10). If the [O I] and [N II] emission are due to the B[e] phenomenon, their high velocities ( km s-1) are puzzling, since velocities in sgB[e] stars are generally on the order of 200–300 km s-1, with higher velocities confined to the electron-scattering wings in H, if present (Clark et al., 2013; Aret et al., 2016; Torres et al., 2018, for example).
4.2 Post-Eruption Analysis
The light-curve peak was unfortunately missed in the optical. However, we can use the change in magnitude in the Spitzer MIR fluxes to estimate an approximate peak magnitude in the optical light curve bands. The 4.5 m data increased by 6.75 mag between 2018 November and the peak in 2019 May. If we assume a similar change in the -band luminosity from 2018 November, then the peak would be 14.6 mag. If instead we assume that the color difference between and other bands remains the same at peak outburst as in late 2017, we can estimate the maximum absolute brightness of 14.3 mag, 13.8 mag, and 13.5 mag on 2019 May 17. This is well within the distribution of peak visual-wavelength absolute magnitudes for other SN impostors and/or giant LBV eruptions (Smith et al., 2011).
Comparison of the H evolution (Figure 3) also shows very little change in the H line profile from our first spectrum, days after eruption, to the last epoch on 180 days. Additionally, the presence of weak [Ca II] yet relatively strong Ca II emission may provide some insight into the circumstellar environment of AT 2019krl. We can use the ratio of these lines to estimate the electron densities using the prescription of Humphreys et al. (2013). From the 2019 November spectrum we obtain an estimate of cm-3. This of course assumes that the emission lines are coming from the same region, which may not be accurate, since the two sets of lines exhibit different temporal evolution and different line profiles. In SN 2008S (Prieto et al., 2008; Smith et al., 2009) and UGC 2773-OT (Smith et al., 2010), these forbidden emission lines were linked to vaporizing dust in the CSM during the outburst. The same may have occurred in AT 2019krl, as dust grains that formed around the progenitor may have evaporated during the sudden luminosity increase of the eruption (Kochanek, 2011).


5 Discussion
Even though the optical peak of the outburst was missed because AT 2019krl was behind the Sun, the extensive data on the pre-eruption star provides new and important clues into the progenitor. The observational properties overlap significantly with other transients, and below we discuss how AT 2019krl is like and unlike various transient event classes.
5.1 Comparison to LBV eruptions
While LBVs can experience low-amplitude, irregular, S-Doradus variations, where the peak of the luminosity is thought to shift from the UV to the optical and the star brightens 1–2 mag, they can also go through a rare form of eruptive mass loss referred to as giant eruptions. Many of the so-called “SN imposters” have been interpreted as these giant eruptions of LBVs, similar to the historical eruption of P Cygni or the Great Eruption of Car (Van Dyk et al., 2000; Smith et al., 2011). During these eruptions the luminosity of the star increases while the temperature usually drops. The eruptive phase of an LBV can last for years, as in the cases of Car (Smith & Frew, 2011) and UGC 2773-OT (Smith et al., 2016a, Figure 12). Additionally, quiescent or eruptive LBV winds can lie in the 100–600 km s-1 range, similar to the resolved narrow H component seen in AT 2019krl. The overall appearance of the spectrum in AT 2019krl — including the [Ca II] and Ca II lines, along with the comparable H profiles and line strengths, the inferred temperature, the dusty CSM, and the IR excess — are all consistent with known LBV giant eruptions.
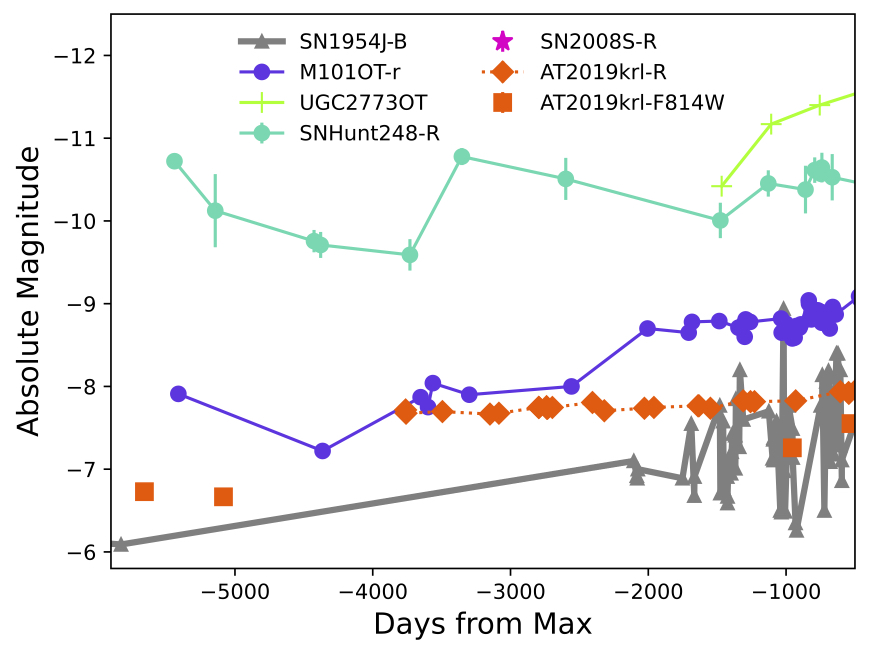
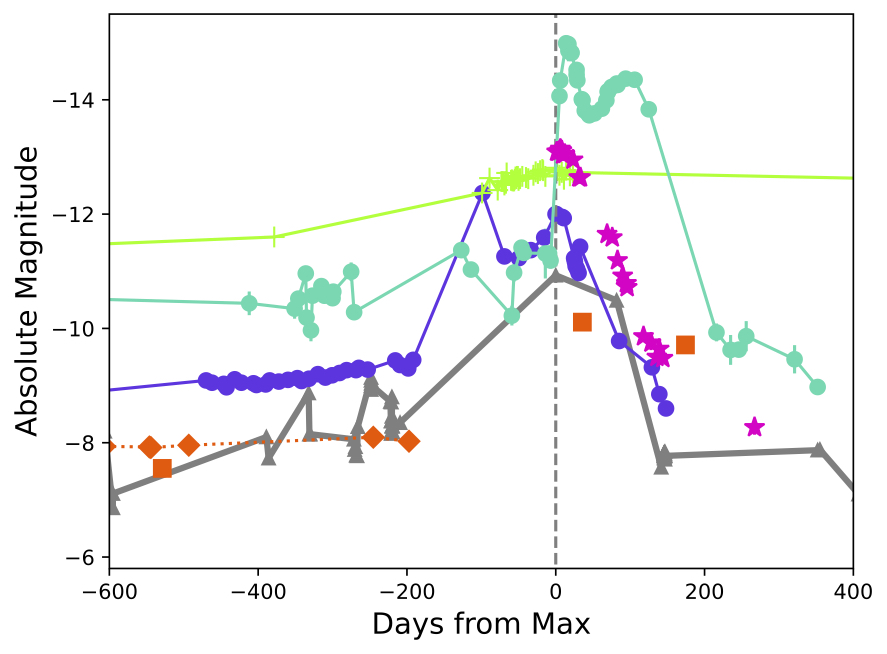
In Figure 12 we show the -band light curve of SN 1954J (Tammann & Sandage, 1968), thought to be the eruption of a luminous (8.0 mag) and massive ( 25 M☉) LBV (Van Dyk et al., 2005). The light curves appear similar, except for the small amplitude variability seen in SN 1954J, which is on a fast enough timescale to have been missed by the cadence of the progenitor data for AT 2019krl. We also show the unfiltered light curve of UGC 2773-OT in Figure 12. Unlike AT 2019krl, UGC 2773-OT had a much more gradual rise to brightness, but both events exhibit a slow decline in luminosity post-peak. Estimates for the mass of UGC 2773-OT are 20 M☉ (or greater if larger extinction is adopted), which is similar to that of AT 2019krl (Smith et al., 2010; Foley et al., 2011), and both have inferred dusty, asymmetric CSM.
Although the masses and luminosities estimated above for AT 2019krl, using the modest extinction of mag, are significantly lower than those traditionally associated with LBVs (Smith et al., 2011), only an additional 1–1.5 mag of extinction could easily push AT 2019krl’s progenitor to higher masses, as shown in Figure 8. Moreover, recent studies with revised distances have shown that Milky Way LBVs extend to lower initial masses and luminosities than previously thought (Smith et al., 2019). The brightness of the eruption and the slow evolution afterward, combined with the color and mass of the progenitor, provide strong evidence for the possible LBV-like nature of AT 2019krl.
5.2 Comparison to SN 2008S-Type Events
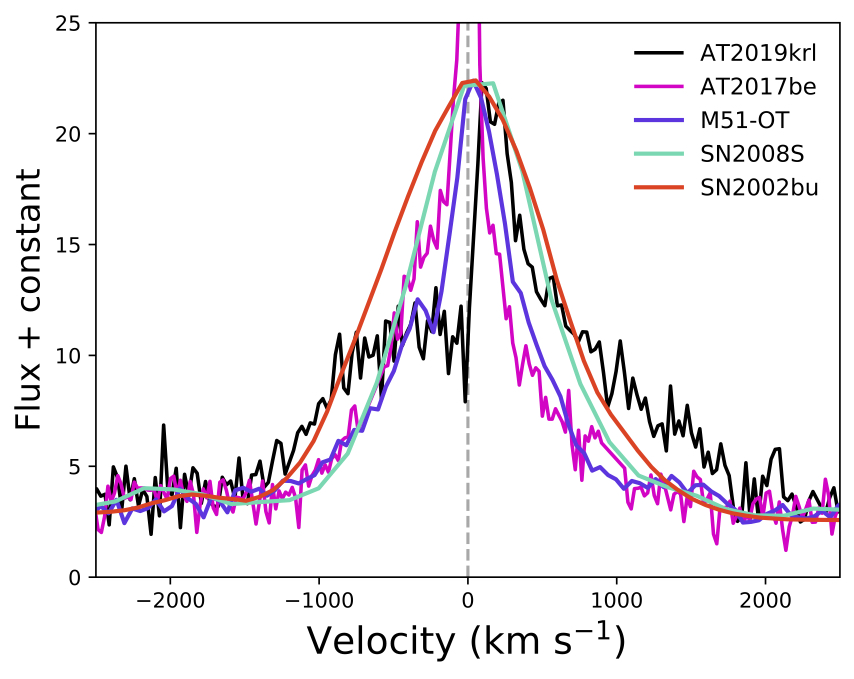
One class of transients with progenitors that are very bright in the IR are the SN 2008S-like events. Well-studied members of this class include the namesake SN 2008S (Prieto et al., 2008; Botticella et al., 2009; Smith et al., 2009), NGC 300 OT2008-1 (Berger et al., 2009; Bond et al., 2009; Humphreys et al., 2011; Thompson et al., 2009; Kochanek et al., 2012), SN 2002bu (Smith et al., 2011; Szczygieł et al., 2012), PTF10fqs (Kasliwal et al., 2011), AT2017be (Cai et al., 2018), and M51 OT2019-1 (Jencson et al., 2019; Williams et al., 2020).
The SN 2008S-type transients show strong Balmer, Ca II NIR triplet, and [Ca II] emission in their spectra, with outflow velocities on the order of 500–1000 km s-1, similar to many LBV great eruptions. In Figure 13 we show the H emission at 70 days post-peak for a sample of SN 2008S-like events. All exhibit fairly smooth profiles with wings extending to km s-1; however, for AT 2019krl the emission line is broader and multipeaked. While AT 2019krl shows strong H and the Ca II NIR triplet, the [Ca II] emission is quite weak and appears months after peak. This is unlike SN 2008S-like events which have strong, prompt [Ca II] emission.
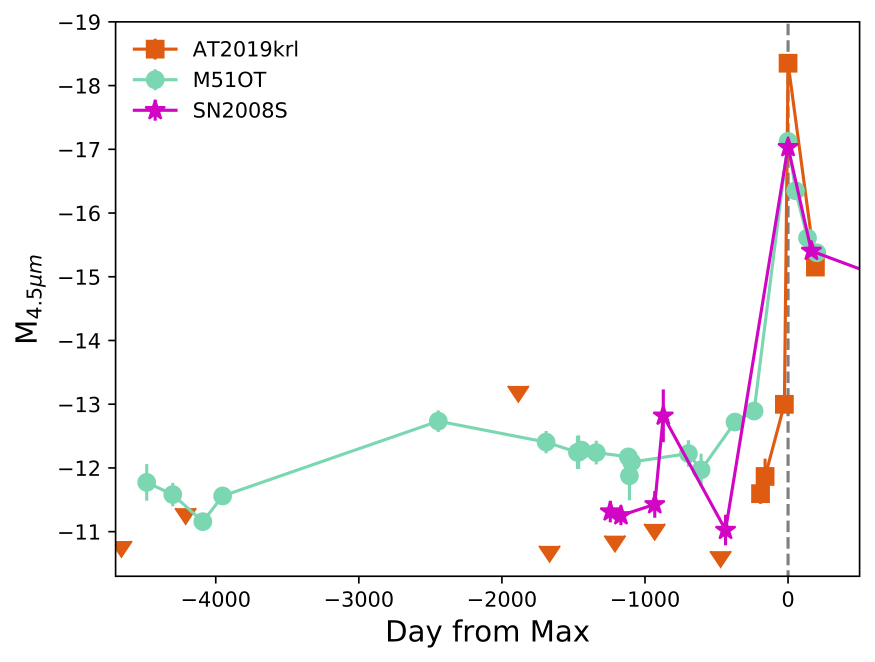
The photometric evolution is also dissimilar between the SN 2008S-type events and AT 2019krl, as shown in Figures 12 and 13. In particular, AT 2019krl is at least 1.5 mag brighter in the 4.5 m band at peak, and while we are unsure of its brightness in the band at peak, we do know that it fades quite slowly and is brighter than SN 2008S by day 200. Furthermore, the late-time evolution of SN 2008S-type events seems to fade well below the luminosity of the progenitor, particularly in the IR (Adams et al., 2016). This of course is expected for terminal events. We do not currently have the post-eruption observation to tell if this is the case for AT 2019krl, so continued observations are needed.
This class of transients has been associated with highly dust-obscured progenitors that only appear in the MIR (Prieto et al., 2008; Thompson et al., 2009), and often show signatures of dust in the months following eruption, either surviving or newly formed (Prieto et al., 2009). Of course, if the dusty CSM has a nonspherical geometry, then the amount of dust obscuration for the progenitor may vary widely depending on viewing angle (Smith et al., 2009, 2011; Soker, 2020). An asymmetric CSM around NGC 300-OT was proposed based on optical spectropolarimetry (Patat et al., 2010) and NIR spectroscopy (Ohsawa et al., 2010). If the same is true for AT 2019krl, and the dust is confined to a torus around the progenitor star which we happen to view pole-on, it could appear bright in both the optical and IR.
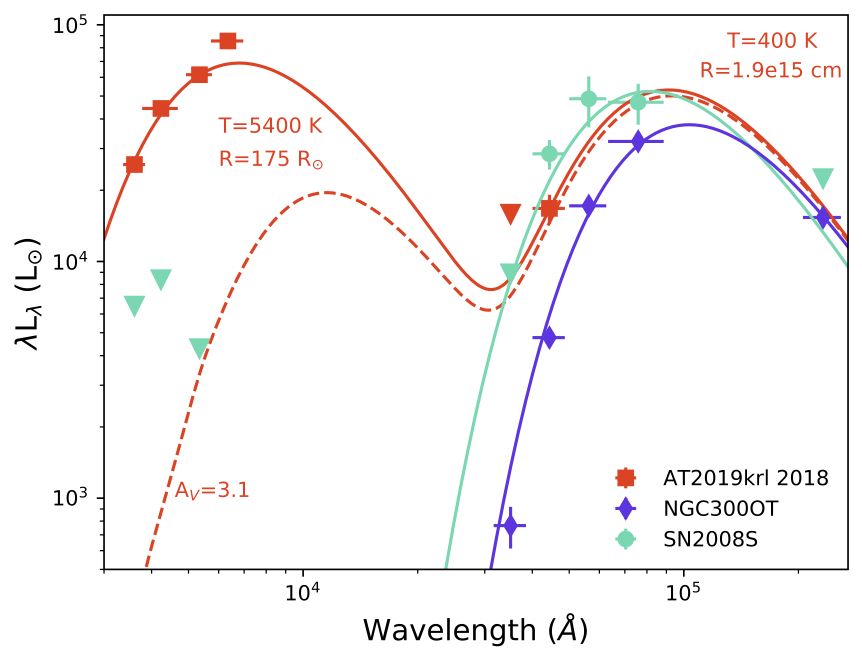
In Figure 14 we compare the optical and MIR SEDs for the progenitor of AT 2019krl to the progenitor of SN 20008S and NGC 300-OT. The detection of the optical component only yielded upper limits for SN 2008S and NGC 300-OT, while in every epoch of the AT 2019krl progenitor, we have significant detections. The much closer NGC 300-OT had clear progenitor detections in all of the IRAC bands, while SN 2008S and AT 2019krl had only an upper limit estimated from the 3.6 m images. The 2018 Spitzer data for AT 2019krl are from the post-cryogenic mission only, so there is no way to determine the brightness in the 5.8 m and 8.0 m bands, but we have attempted to fit an MIR component with a blackbody temperature of 400 K, between the two temperature values of SN 2008S (Prieto et al., 2008; Thompson et al., 2009, 440K) and NGC 300-OT (Berger et al., 2009, 338K). As we mention above, upper limits were measured for 5.8 m and 8.0 m during the cryogenic mission, but the increase in the MIR luminosity of AT 2019krl by 2018 suggests that it would have been detected in these longer wavelength bands.
| Line | EW | Flux | FWHM | FWHM |
|---|---|---|---|---|
| Å | Å | 10-17 erg s-1 cm2 | Å | km s-1 |
| 5755 | 28 9 | 2.0 0.3 | 19 3 | 970 50 |
| 6300 | 72 10 | 4.6 0.3 | 15 1 | 770 50 |
| 6548 | 194 20 | 14.2 0.8 | 25 1 | 1180 100 |
| 6563 | 46 13 | 3.4 0.7 | 8 1 | 350 30 |
| 6584 | 397 35 | 29.0 1.0 | 22 1 | 1000 100 |
NGC 300-OT was also detected in the 24 m MIPS band, while only an upper limit could be derived for SN 2008S. It is more ambiguous in the case of AT 2019krl, since a detection was made at the location of the progenitor in the MIPS 24 m data in 2005, but the mitigating factors of pixel size and the distance of M74 make it difficult to determine if the flux originates from the transient, as opposed to distant surrounding material associated with star formation. If the 24 m flux comes from AT 2019krl, then it suggests a second region of cooler dust much further out than the warmer dust mapped by the 3.6 m and 4.5 m fluxes. Given the uncertain origin of the 24 m flux and the fact that IRAC data at other MIR wavelengths gave only upper limits, we cannot provide good constraints on a unique fit for this cool component.
After the discovery of SN 2008S and NGC 300-OT, Thompson et al. (2009) suggested that they constitute a new class of transients that may be caused by ecSNe, an explanation also suggested by Botticella et al. (2009). The explosion of a super-AGB (sAGB) star as an ecSN has an expected kinetic energy of erg, and progenitors are thought to be in the initial mass range 8–10 M☉. The exact mass range is still debated, and may be very narrow (Doherty et al., 2015). The progenitor photometry for AT 2019krl points to the equivalent of a single star initially more massive than 13 M☉. Even with no extinction correction, it was much hotter and likely less dust-enshrouded than an sAGB star. This clearly rules out an ecSN from a sAGB star for the case of AT 2019krl. Additionally, sAGB stars pulsate with large variability ( mag) in their light curves, particularly in the IR (Thompson et al., 2009). These variations are not seen in the progenitor of AT 2019krl (Figure 13), at least to brightness levels that would be above the detection limit of the available Spitzer observations.
Plausible alternative progenitor scenarios to this class of events are the outburst of a heavily obscured LBV (Smith et al., 2009, 2011), or other dust enshrouded massive star in a binary system (Berger et al., 2009; Bond et al., 2009; Smith et al., 2011). SN 2008S had an estimated total extinction of mag at peak (Prieto et al., 2008) and M51-OT a total reddening 0.9 (Jencson et al., 2019), which for translates to mag. If we assume a total mag for AT 2019krl, then the best fit implies a stellar mass as high as 58 M☉ from the 2005 HST data, or 29.5 M☉ from the 2013 HST data, as we show in Figure 8999Please note that these mass estimates are made with respect to evolutionary models of single stars that do not include eruptive events and should be interpreted with caution. We therefore do not expect that these accurately reflect the true initial mass of AT 2019krl or its actual evolutionary state, and it should not be surprising that observations at different epochs during an eruption may yield different mass estimates. These are only meant to illustrate the equivalent mass of a single star that might have the same luminosity.. Even with lower amounts of extinction, 1.5 2.0 mag, AT 2019krl would have a value safely within the expected masses of LBVs (Smith et al., 2004, 2019).
5.3 Comparison to Mergers
Often referred to as red novae or LRNe, low-mass or intermediate-mass merger candidates can span a wide range of peak magnitudes and progenitor masses, yet may show a similar set of observational signatures (Kochanek et al., 2014; Pastorello et al., 2019a). Merger candidates typically exhibit an initial peak in their optical light curve, followed by a secondary peak at some later date. Early-time spectra exhibit a blue continuum with narrow (100–300 km s-1) Balmer emission which fades with time as the spectra redden and cool, until finally molecular absorption lines appear and dominate the spectra a few months after maximum brightness.
In Figure 12 we compare the light curve of AT 2019krl to those of the massive star merger candidates M101-OT (Blagorodnova et al., 2017) and SNHunt248 (Kankare et al., 2015; Mauerhan et al., 2015, 2018). It is still unclear what mechanism is responsible for the multiple light-curve peaks; however, options include a common envelope (CE) ejection for the first peak and a second peak created during the final binary merger, or the first peak being caused by the adiabatic cooling of a CE event, while the second is from CSM interaction with the mass loss during inspiral (Metzger & Pejcha, 2017). In the second scenario, viewing angle can easily change the observational signatures of the mergers. Soker (2020) estimates an up to 2 mag difference in brightness between equatorial observers and those viewing from the polar direction.
It is possible that AT 2019krl had a double-peaked light curve missed by our sparse post-eruption observations. If so, the overall shape of the light curve fits those of merger candidates, with an absolute luminosity of the progenitor and the outburst being consistent with the class. In particular, the color and temperature of AT 2019krl is quite similar to that of M101 OT2015-1, which was likely a YSG with = 7000 K (Blagorodnova et al., 2017). The progenitor mass and luminosity was quite a bit higher (18 M☉ and log(/L☉) = 4.9) for the M101 transient, but by adopting a moderately larger extinction, AT 2019krl could have a similar mass (Figure 8). Of course, additional luminosity may come from the inspiral itself; therefore, the mass of the progenitor would be overestimated. The outflow speed implied from the P Cygni absorption of 155 km s-1 in the H emission is consistent with mass-loss speeds from the outer Lagrange point in stellar mergers (Pejcha et al., 2016), and is similar to the 150–200 km s-1 P Cygni absorption seen in the light echoes of Carinae, which has been attributed to an outflow caused by the inspiral phase before a merger (Smith et al., 2018).
One glaring discrepancy between AT 2019krl and merger candidates arises in the spectroscopic evolution. The H emission is present and strong at all times in AT 2019krl, while in merger candidates it often fades after peak and may reemerge at late times. LRNe also lack the Ca II NIR and [Ca II] emission that we see in AT 2019krl. Most notably, the molecular bands that form in merger spectra after days are not seen in AT 2019krl. The lack of molecular lines is not unexpected, as our last photometric observation in 2019 December shows a transient with a temperature of at least 5250 K, still too warm for the creation of molecular lines.
A complication is that, in principle, mergers can occur across a wide range of initial masses, and mergers in more massive stars might not look the same as lower-mass mergers. Moreover, some individual LBV giant eruptions, including the prototypical case of Car, have been proposed as massive-star merger events (Smith et al., 2018), and mergers and mass gainers have been invoked to explain evolutionary considerations for LBVs more generally (Justham et al., 2014; Smith & Tombleson, 2015; Aghakhanloo et al., 2017). Therefore, the distinction between LBVs and low-mass merger events, such as V1309 Sco and LRNe, might arise simply from a continuum of different initial masses (Smith et al., 2016b), rather than distinctly different mechanisms.
6 Conclusions
AT 2019krl clearly had a luminous and blue progenitor with no previous outbursts detected in the archival HST and LBT images during the 16 yr before the event. Observationally, it is consistent with known examples of giant LBV eruptions and SN 2008S-like objects with strong H, [Ca II], and Ca II NIR triplet emission and an estimated peak absolute magnitude between and , yet it does not match a single class exactly.
The estimated mass of the directly-detected progenitor without any local extinction places the star in a mass regime of at least 13 M☉. This is a lower limit because a modest increase in the adopted extinction correction could easily move the progenitor to higher masses. Importantly, this moderately massive BSG progenitor is detected, despite the fact that the surrounding stellar population seems to indicate an older age and lower turnoff mass of only 8 M⊙.
We propose a scenario wherein AT 2019krl was the eruption of a BSG in a dense disk or toroidal CSM that was observed nearly pole-on. A pole-on view of an object in a dusty torus is needed to simultaneously account for the presence of a strong IR excess and a seemingly contradictory lack of line-of-sight extinction. This scenario could arise from binary interaction and a high-mass merger that resembled a giant LBV outburst.
Combined with what appears to be a fairly low-extinction environment, AT 2019krl may provide a link between SN 2008S-like transients and those occurring from unobscured progenitors, since similar observational properties of transient events seem to be occurring from very different progenitor types. Deep UV-to-NIR late-time observations with very large ground-based telescopes, HST, or JWST will allow us to determine if indeed we have a hot luminous star cloaked in a massive dust shell created during the eruption, and if there is both a terminal and nonterminal eruption scenario that can create a very similar transient event.
References
- Adams et al. (2017) Adams, S. M., Kochanek, C. S., Gerke, J. R., & Stanek, K. Z. 2017, MNRAS, 469, 1445
- Adams et al. (2016) Adams, S. M., Kochanek, C. S., Prieto, J. L., et al. 2016, MNRAS, 460, 1645
- Aghakhanloo et al. (2017) Aghakhanloo, M., Murphy, J. W., Smith, N., & Hložek, R. 2017, MNRAS, 472, 591
- Ahn et al. (2012) Ahn, C. P., Alexandroff, R., Allende Prieto, C., et al. 2012, ApJS, 203, 21
- Alard (2000) Alard, C. 2000, A&AS, 144, 363
- Alard & Lupton (1998) Alard, C., & Lupton, R. H. 1998, ApJ, 503, 325
- Anand et al. (2018) Anand, G. S., Rizzi, L., & Tully, R. B. 2018, AJ, 156, 105
- Andrews et al. (2019) Andrews, J., Sand, D., Smith, N., et al. 2019, The Astronomer’s Telegram, 12913, 1
- Aret et al. (2016) Aret, A., Kraus, M., & Šlechta, M. 2016, MNRAS, 456, 1424
- Asplund et al. (2009) Asplund, M., Grevesse, N., Sauval, A. J., & Scott, P. 2009, ARA&A, 47, 481
- Astropy Collaboration et al. (2013) Astropy Collaboration, Robitaille, T. P., Tollerud, E. J., et al. 2013, A&A, 558, A33
- Bacon et al. (2010) Bacon, R., Accardo, M., Adjali, L., et al. 2010, in Society of Photo-Optical Instrumentation Engineers (SPIE) Conference Series, Vol. 7735, Ground-based and Airborne Instrumentation for Astronomy III, 773508
- Beasor & Davies (2018) Beasor, E. R., & Davies, B. 2018, MNRAS, 475, 55
- Bellm et al. (2019) Bellm, E. C., Kulkarni, S. R., Graham, M. J., et al. 2019, PASP, 131, 018002
- Berg et al. (2015) Berg, D. A., Skillman, E. D., Croxall, K. V., et al. 2015, ApJ, 806, 16
- Berger et al. (2009) Berger, E., Soderberg, A. M., Chevalier, R. A., et al. 2009, ApJ, 699, 1850
- Blagorodnova et al. (2017) Blagorodnova, N., Kotak, R., Polshaw, J., et al. 2017, ApJ, 834, 107
- Blagorodnova et al. (2020) Blagorodnova, N., Karambelkar, V., Adams, S. M., et al. 2020, MNRAS, 496, 5503
- Bond et al. (2009) Bond, H. E., Bedin, L. R., Bonanos, A. Z., et al. 2009, ApJ, 695, L154
- Bond et al. (2003) Bond, H. E., Henden, A., Levay, Z. G., et al. 2003, Nature, 422, 405
- Botticella et al. (2009) Botticella, M. T., Pastorello, A., Smartt, S. J., et al. 2009, MNRAS, 398, 1041
- Bruzual & Charlot (2003) Bruzual, G., & Charlot, S. 2003, MNRAS, 344, 1000
- Cai et al. (2018) Cai, Y. Z., Pastorello, A., Fraser, M., et al. 2018, MNRAS, 480, 3424
- Calzetti et al. (2000) Calzetti, D., Armus, L., Bohlin, R. C., et al. 2000, ApJ, 533, 682
- Cappellari (2017) Cappellari, M. 2017, MNRAS, 466, 798
- Cappellari & Emsellem (2004) Cappellari, M., & Emsellem, E. 2004, PASP, 116, 138
- Castelli & Kurucz (2003) Castelli, F., & Kurucz, R. L. 2003, in IAU Symposium, Vol. 210, Modelling of Stellar Atmospheres, ed. N. Piskunov, W. W. Weiss, & D. F. Gray, A20
- Choi et al. (2016) Choi, J., Dotter, A., Conroy, C., et al. 2016, ApJ, 823, 102
- Clark et al. (2005) Clark, J. S., Larionov, V. M., & Arkharov, A. 2005, A&A, 435, 239
- Clark et al. (2013) Clark, J. S., Ritchie, B. W., & Negueruela, I. 2013, A&A, 560, A11
- Clemens et al. (2004) Clemens, J. C., Crain, J. A., & Anderson, R. 2004, in Society of Photo-Optical Instrumentation Engineers (SPIE) Conference Series, Vol. 5492, Ground-based Instrumentation for Astronomy, ed. A. F. M. Moorwood & M. Iye, 331–340
- Davidson (2020) Davidson, K. 2020, Galaxies, 8, 10
- de Jaeger et al. (2018) de Jaeger, T., Anderson, J. P., Galbany, L., et al. 2018, MNRAS, 476, 4592
- Doherty et al. (2015) Doherty, C. L., Gil-Pons, P., Siess, L., Lattanzio, J. C., & Lau, H. H. B. 2015, MNRAS, 446, 2599
- Dolphin (2016) Dolphin, A. 2016, DOLPHOT: Stellar photometry, , , ascl:1608.013
- Dolphin (2000) Dolphin, A. E. 2000, PASP, 112, 1383
- Dong et al. (2015) Dong, S., Kochanek, C. S., Adams, S., & Prieto, J. L. 2015, The Astronomer’s Telegram, 7173, 1
- Dotter (2016) Dotter, A. 2016, ApJS, 222, 8
- Drout et al. (2011) Drout, M. R., Soderberg, A. M., Gal-Yam, A., et al. 2011, ApJ, 741, 97
- Faber et al. (2003) Faber, S. M., Phillips, A. C., Kibrick, R. I., et al. 2003, in Society of Photo-Optical Instrumentation Engineers (SPIE) Conference Series, Vol. 4841, Instrument Design and Performance for Optical/Infrared Ground-based Telescopes, ed. M. Iye & A. F. M. Moorwood, 1657–1669
- Fabricant et al. (2019) Fabricant, D., Fata, R., Epps, H., et al. 2019, PASP, 131, 075004
- Fazio et al. (2004) Fazio, G. G., Hora, J. L., Allen, L. E., et al. 2004, ApJS, 154, 10
- Filippenko (1982) Filippenko, A. V. 1982, PASP, 94, 715
- Filippenko et al. (1995) Filippenko, A. V., Barth, A. J., Bower, G. C., et al. 1995, AJ, 110, 2261
- Foley et al. (2011) Foley, R. J., Berger, E., Fox, O., et al. 2011, ApJ, 732, 32
- Gaia Collaboration et al. (2018) Gaia Collaboration, Brown, A. G. A., Vallenari, A., et al. 2018, A&A, 616, A1
- Gehrz et al. (2007) Gehrz, R. D., Roellig, T. L., Werner, M. W., et al. 2007, Review of Scientific Instruments, 78, 011302
- Gerke et al. (2015) Gerke, J. R., Kochanek, C. S., & Stanek, K. Z. 2015, MNRAS, 450, 3289
- Giallongo et al. (2008) Giallongo, E., Ragazzoni, R., Grazian, A., et al. 2008, A&A, 482, 349
- Goldman et al. (2017) Goldman, S. R., van Loon, J. T., Zijlstra, A. A., et al. 2017, MNRAS, 465, 403
- Goodrich et al. (1989) Goodrich, R. W., Stringfellow, G. S., Penrod, G. D., & Filippenko, A. V. 1989, ApJ, 342, 908
- Goranskij et al. (2016) Goranskij, V. P., Barsukova, E. A., Spiridonova, O. I., et al. 2016, Astrophysical Bulletin, 71, 82
- Hack et al. (2012) Hack, W. J., Dencheva, N., Fruchter, A. S., et al. 2012, in American Astronomical Society Meeting Abstracts, Vol. 220, American Astronomical Society Meeting Abstracts #220, 135.15
- Ho (2019) Ho, A. 2019, Transient Name Server Discovery Report, 2019-1165, 1
- Humphreys et al. (2011) Humphreys, R. M., Bond, H. E., Bedin, L. R., et al. 2011, ApJ, 743, 118
- Humphreys & Davidson (1994) Humphreys, R. M., & Davidson, K. 1994, PASP, 106, 1025
- Humphreys et al. (2013) Humphreys, R. M., Davidson, K., Grammer, S., et al. 2013, ApJ, 773, 46
- Humphreys et al. (1999) Humphreys, R. M., Davidson, K., & Smith, N. 1999, PASP, 111, 1124
- Jencson et al. (2019) Jencson, J. E., Adams, S. M., Bond, H. E., et al. 2019, ApJ, 880, L20
- Jordi et al. (2006) Jordi, K., Grebel, E. K., & Ammon, K. 2006, A&A, 460, 339
- Justham et al. (2014) Justham, S., Podsiadlowski, P., & Vink, J. S. 2014, ApJ, 796, 121
- Kankare et al. (2015) Kankare, E., Kotak, R., Pastorello, A., et al. 2015, A&A, 581, L4
- Kansky et al. (2019) Kansky, J., Chilingarian, I., Fabricant, D., et al. 2019, PASP, 131, 075005
- Kasliwal et al. (2011) Kasliwal, M. M., Kulkarni, S. R., Arcavi, I., et al. 2011, ApJ, 730, 134
- Kasliwal et al. (2017) Kasliwal, M. M., Bally, J., Masci, F., et al. 2017, ApJ, 839, 88
- Kennicutt et al. (2003) Kennicutt, Robert C., J., Armus, L., Bendo, G., et al. 2003, PASP, 115, 928
- Kiminki et al. (2016) Kiminki, M. M., Reiter, M., & Smith, N. 2016, MNRAS, 463, 845
- Kochanek (2011) Kochanek, C. S. 2011, ApJ, 743, 73
- Kochanek et al. (2014) Kochanek, C. S., Adams, S. M., & Belczynski, K. 2014, MNRAS, 443, 1319
- Kochanek et al. (2008) Kochanek, C. S., Beacom, J. F., Kistler, M. D., et al. 2008, ApJ, 684, 1336
- Kochanek et al. (2012) Kochanek, C. S., Szczygieł, D. M., & Stanek, K. Z. 2012, ApJ, 758, 142
- Kreckel et al. (2017) Kreckel, K., Groves, B., Bigiel, F., et al. 2017, ApJ, 834, 174
- Kreckel et al. (2013) Kreckel, K., Groves, B., Schinnerer, E., et al. 2013, ApJ, 771, 62
- Kreckel et al. (2018) Kreckel, K., Faesi, C., Kruijssen, J. M. D., et al. 2018, ApJ, 863, L21
- Kreckel et al. (2019) Kreckel, K., Ho, I. T., Blanc, G. A., et al. 2019, ApJ, 887, 80
- MacLeod et al. (2017) MacLeod, M., Macias, P., Ramirez-Ruiz, E., et al. 2017, ApJ, 835, 282
- Mason et al. (2010) Mason, E., Diaz, M., Williams, R. E., Preston, G., & Bensby, T. 2010, A&A, 516, A108
- Mauerhan et al. (2018) Mauerhan, J. C., Van Dyk, S. D., Johansson, J., et al. 2018, MNRAS, 473, 3765
- Mauerhan et al. (2015) Mauerhan, J. C., Van Dyk, S. D., Graham, M. L., et al. 2015, MNRAS, 447, 1922
- Mauron & Josselin (2011) Mauron, N., & Josselin, E. 2011, A&A, 526, A156
- McQuinn et al. (2017) McQuinn, K. B. W., Skillman, E. D., Dolphin, A. E., Berg, D., & Kennicutt, R. 2017, AJ, 154, 51
- Metzger & Pejcha (2017) Metzger, B. D., & Pejcha, O. 2017, MNRAS, 471, 3200
- Ohsawa et al. (2010) Ohsawa, R., Sakon, I., Onaka, T., et al. 2010, ApJ, 718, 1456
- Owocki et al. (2004) Owocki, S. P., Gayley, K. G., & Shaviv, N. J. 2004, ApJ, 616, 525
- Pastorello et al. (2019a) Pastorello, A., Mason, E., Taubenberger, S., et al. 2019a, A&A, 630, A75
- Pastorello et al. (2019b) Pastorello, A., Chen, T. W., Cai, Y. Z., et al. 2019b, A&A, 625, L8
- Patat et al. (2010) Patat, F., Maund, J. R., Benetti, S., et al. 2010, A&A, 510, A108
- Pejcha (2014) Pejcha, O. 2014, ApJ, 788, 22
- Pejcha et al. (2016) Pejcha, O., Metzger, B. D., & Tomida, K. 2016, MNRAS, 461, 2527
- Phillips et al. (2013) Phillips, M. M., Simon, J. D., Morrell, N., et al. 2013, ApJ, 779, 38
- Pogge et al. (2010) Pogge, R. W., Atwood, B., Brewer, D. F., et al. 2010, in Society of Photo-Optical Instrumentation Engineers (SPIE) Conference Series, Vol. 7735, Ground-based and Airborne Instrumentation for Astronomy III, 77350A
- Poznanski et al. (2012) Poznanski, D., Prochaska, J. X., & Bloom, J. S. 2012, MNRAS, 426, 1465
- Prieto et al. (2009) Prieto, J. L., Sellgren, K., Thompson, T. A., & Kochanek, C. S. 2009, ApJ, 705, 1425
- Prieto et al. (2008) Prieto, J. L., Kistler, M. D., Thompson, T. A., et al. 2008, ApJ, 681, L9
- Prieto et al. (2014) Prieto, J. L., Rest, A., Bianco, F. B., et al. 2014, ApJ, 787, L8
- Schady et al. (2019) Schady, P., Eldridge, J. J., Anderson, J., et al. 2019, MNRAS, 490, 4515
- Schlafly & Finkbeiner (2011) Schlafly, E. F., & Finkbeiner, D. P. 2011, ApJ, 737, 103
- Seward et al. (2001) Seward, F. D., Butt, Y. M., Karovska, M., et al. 2001, ApJ, 553, 832
- Shiode & Quataert (2014) Shiode, J. H., & Quataert, E. 2014, ApJ, 780, 96
- Smith (2008) Smith, N. 2008, Nature, 455, 201
- Smith (2012) —. 2012, Astrophysics and Space Science Library, Vol. 384, All Things Homunculus, ed. K. Davidson & R. M. Humphreys, 145
- Smith (2017) —. 2017, Philosophical Transactions of the Royal Society of London Series A, 375, 20160268
- Smith et al. (2019) Smith, N., Aghakhanloo, M., Murphy, J. W., et al. 2019, MNRAS, 488, 1760
- Smith et al. (2016a) Smith, N., Andrews, J. E., Mauerhan, J. C., et al. 2016a, MNRAS, 455, 3546
- Smith & Arnett (2014) Smith, N., & Arnett, W. D. 2014, ApJ, 785, 82
- Smith & Frew (2011) Smith, N., & Frew, D. J. 2011, MNRAS, 415, 2009
- Smith et al. (2001) Smith, N., Humphreys, R. M., & Gehrz, R. D. 2001, PASP, 113, 692
- Smith et al. (2011) Smith, N., Li, W., Silverman, J. M., Ganeshalingam, M., & Filippenko, A. V. 2011, MNRAS, 415, 773
- Smith & Morse (2004) Smith, N., & Morse, J. A. 2004, ApJ, 605, 854
- Smith & Morse (2019) —. 2019, MNRAS, 489, 268
- Smith & Owocki (2006) Smith, N., & Owocki, S. P. 2006, ApJ, 645, L45
- Smith & Tombleson (2015) Smith, N., & Tombleson, R. 2015, MNRAS, 447, 598
- Smith et al. (2004) Smith, N., Vink, J. S., & de Koter, A. 2004, ApJ, 615, 475
- Smith et al. (2009) Smith, N., Ganeshalingam, M., Chornock, R., et al. 2009, ApJ, 697, L49
- Smith et al. (2010) Smith, N., Miller, A., Li, W., et al. 2010, AJ, 139, 1451
- Smith et al. (2016b) Smith, N., Andrews, J. E., Van Dyk, S. D., et al. 2016b, MNRAS, 458, 950
- Smith et al. (2018) Smith, N., Andrews, J. E., Rest, A., et al. 2018, MNRAS, 480, 1466
- Soker (2020) Soker, N. 2020, arXiv e-prints, arXiv:2010.14490
- Soker & Kashi (2013) Soker, N., & Kashi, A. 2013, ApJ, 764, L6
- Sparks et al. (2008) Sparks, W. B., Bond, H. E., Cracraft, M., et al. 2008, AJ, 135, 605
- Stanway & Eldridge (2018) Stanway, E. R., & Eldridge, J. J. 2018, MNRAS, 479, 75
- Stritzinger et al. (2018) Stritzinger, M. D., Taddia, F., Burns, C. R., et al. 2018, A&A, 609, A135
- Szalai et al. (2019) Szalai, T., Fox, O. D., Marston, T., et al. 2019, The Astronomer’s Telegram, 12934, 1
- Szczygieł et al. (2012) Szczygieł, D. M., Kochanek, C. S., & Dai, X. 2012, ApJ, 760, 20
- Tammann & Sandage (1968) Tammann, G. A., & Sandage, A. 1968, ApJ, 151, 825
- Thompson et al. (2009) Thompson, T. A., Prieto, J. L., Stanek, K. Z., et al. 2009, ApJ, 705, 1364
- Torres et al. (2018) Torres, A. F., Cidale, L. S., Kraus, M., et al. 2018, A&A, 612, A113
- Tylenda et al. (2011) Tylenda, R., Hajduk, M., Kamiński, T., et al. 2011, A&A, 528, A114
- Van Dyk et al. (2005) Van Dyk, S. D., Filippenko, A. V., Chornock, R., Li, W., & Challis, P. M. 2005, PASP, 117, 553
- Van Dyk & Matheson (2012) Van Dyk, S. D., & Matheson, T. 2012, Astrophysics and Space Science Library, Vol. 384, The Supernova Impostors, ed. K. Davidson & R. M. Humphreys, 249
- Van Dyk et al. (2000) Van Dyk, S. D., Peng, C. Y., King, J. Y., et al. 2000, PASP, 112, 1532
- van Genderen (2001) van Genderen, A. M. 2001, A&A, 366, 508
- Weilbacher et al. (2020) Weilbacher, P. M., Palsa, R., Streicher, O., et al. 2020, A&A, 641, A28
- Weis & Bomans (2020) Weis, K., & Bomans, D. J. 2020, Galaxies, 8, 20
- Werner et al. (2004) Werner, M. W., Roellig, T. L., Low, F. J., et al. 2004, ApJS, 154, 1
- Williams et al. (2018) Williams, B. F., Hillis, T. J., Murphy, J. W., et al. 2018, ApJ, 860, 39
- Williams et al. (2020) Williams, S. C., Jones, D., Pessev, P., et al. 2020, A&A, 637, A20