Exotic Image Formation in Strong Gravitational Lensing by Clusters of Galaxies. I: Cross-Section
Abstract
In a recent paper we have discussed the higher order singularities in gravitational lensing. We have shown that a singularity map, comprising of -lines and unstable (point) singularities ( and ), is a compact representation of high magnification regions corresponding to a given lens model for all possible source redshifts. It marks all the optimal locations for deep surveys in the lens plane. Here we present singularity maps for ten different clusters lenses selected from the Hubble Frontier fields (HFF) and the Reionization Lensing Cluster Survey (RELICS) surveys. We have identified regions in the lens plane with a high magnification for sources up to redshift ten. To determine the dependence of unstable (point) singularities on lens mass model reconstruction techniques, we compared singularity maps corresponding to the different mass models (provided by various groups in the HFF survey) for each cluster lens. We find that the non-parametric (free-form) method of lens mass reconstruction yields the least number of point singularities. In contrast, mass models reconstructed by various groups using a parametric approach have a significantly larger number of point singularities. We also estimate the number of galaxies lying near these unstable (point) singularities, which can be observed with the James Webb Space Telescope (JWST). We find that we expect to get at least one hyperbolic umbilic and one swallowtail image formation for a source at for every five clusters with JWST. These numbers are much higher than earlier estimates.
keywords:
gravitational lensing: strong – galaxies: clusters: individual (Abell 370, Abell 2744, Abell S1063, MACS J0416.1-2403, MACS J1149.5+2223, MACS J0159.8-0849, MACS J0308.9+2645, PLCK G171.9-40.7, PLCK G287.0+32.9, SPT-CLJ0615-5746)1 Introduction
Galaxy clusters with strong gravitational lensing are a very powerful tool to study the physics of the Universe (Blandford & Narayan, 1992). The large magnification factor in cluster lenses allows us to observe distant sources (which otherwise would have remained unobserved) and helps us understand the evolution of galaxies in the universe (Jullo, et al., 2010; Kneib & Natarajan, 2011; Atek, et al., 2018). On the other hand, the strongly lensed background objects help us to constrain the mass distribution within these cluster lenses, hence, helping us to understand different processes going on inside these galaxy clusters (Puchwein, et al., 2005; Bergamini, et al., 2019). After the discovery of the first cluster lens system (Soucail, et al., 1988), extensive work has been done dealing with both theoretical and observational aspects of cluster lensing. On the theoretical side, different methods have been developed to reconstruct the cluster mass distribution using the strongly lensed background sources (Broadhurst, et al., 2005; Diego, et al., 2005; Jullo, et al., 2007; Liesenborgs, et al., 2007; Coe, et al., 2008), and detailed studies have been done to use cluster lenses to probe the Universe (Bartelmann, et al., 1998; Meneghetti, et al., 2013; Boldrin, et al., 2016). Several surveys have been carried out to increase the number of known strong lens systems in order to improve the quality of theoretical findings (CASTLES: Muñoz, et al. (1998), CLASS: Chae (2003), CLASH: Postman, et al. (2012), HFF: Lotz, et al. (2017), RELICS: Coe, et al. (2019)).
Almost all clusters behave as gravitational lenses. However, not every source lying behind a cluster is magnified by a large factor. Only sources lying near the caustics in the source plane are highly magnified. The factor by which a source is magnified also depends on the source size: smaller the source, higher the magnification factor (Kelly, et al., 2018). For a given lens system, the caustic structure in the source plane is sensitive to the source redshift. As a result, the area in the source plane that is highly magnified, changes as one varies the source redshift. Unlike galaxies, clusters are very complex structures due to the presence of numerous substructures. A galaxy can be modeled by using a single elliptical profile, whereas the modeling of cluster lenses needs to take into account the presence of various substructures like individual galaxies or groups of galaxies. This can also be seen in the evolution of caustic structure in the source plane with redshift. The evolution of caustics with redshift mainly includes the formation and destruction of cusps, the exchange of cusps between radial and tangential caustics, in such a way that the total number of cusps in the source plane always remains even. Curves corresponding to caustics in the lens plane are known as critical curves. Highly magnified images of a strongly lensed source are formed in close vicinity of these critical curves. These high magnification regions produced by cluster lenses can help us to observe galaxies at very high redshifts () including the first galaxies. Such highly magnified systems have already been encountered in different lensing surveys (Bradley, et al., 2008; Coe, et al., 2013; Watson, et al., 2015). At present, the number of such systems is small as lensed galaxies are very faint, and the number density of galaxies at these high redshifts is small. However, the number of such strong lens systems is expected to increase by more than an order of magnitude with the upcoming facilities like EUCLID: (Laureijs, 2009), JWST: (Gardner, et al., 2006), LSST: (Ivezić, et al., 2019), WFIRST: (Akeson, et al., 2019).
In our current work, we locate the highly magnified regions in the lens plane, for all source redshifts, for ten different cluster lens systems from the Hubble Frontier Fields Survey (HFF) and the Reionization Lensing Cluster Survey (RELICS). The algorithm to do this has been discussed briefly in Bagla (2001) and presented in detail in Meena & Bagla (2020) (hereafter paper I). As discussed in paper I, a singularity map consisting of -lines and unstable (point) singularities is ideal for our study. These point singularities (swallowtail, hyperbolic umbilic, elliptic umbilic) are formed only for some specific source redshifts and specific source positions in the source plane. Apart from that, every point singularity comes with a characteristic image formation. -lines correspond to cusp in the source plane and these are present over a wide range of source redshifts. As cusps are stable singularities, these are continuous lines instead of points in the singularity map, with points corresponding to different source redshifts. The image formation corresponding to structures (-lines and point singularities) in singularity maps (for the appropriate source redshift) shows three or more highly magnified images lying near each other in a small region of the lens plane in the vicinity of the singularity. The singularity maps corresponding to cluster lenses not only point out the highly magnified regions in the lens plane but are also sensitive to the lens mass reconstruction techniques. Here we also compare different mass models corresponding to each cluster lens. These mass models are reconstructed using different (parametric and non-parametric) methods. The comparison has been done to see how sensitive the -line structure and the total number of point singularities is to the cluster mass reconstruction method as different approaches use different sets of underlying assumptions.
Apart from locating the highly magnified regions in the lens plane and looking at the effect of mass reconstruction methods on the singularity map, the other important point that has been discussed (Orban de Xivry & Marshall, 2009) is to estimate the expected number of source galaxies lying near the point singularities. This allows us to estimate the probability of observing these characteristic image formations in the upcoming large scale surveys. In order to do so, we require the distribution of galaxies as a function of redshift. This can be determined from the galaxy luminosity function (GLF) and the Schechter function (Schechter, 1976) is widely used to parametrize it. Various studies using different surveys have been carried out to determine the rest frame GLF as a function of the redshift in different wavelength bands (UV:Ono, et al. (2018); Bowler, et al. (2020); Moutard, et al. (2020), IR: Cirasuolo, et al. (2007, 2010); Mortlock, et al. (2017)). Different groups have estimated the number of galaxies that may be observed with JWST considering different models of galaxy formation and evolution (Cowley, et al., 2018; Williams, et al., 2018; Yung, et al., 2019). Following Cowley, et al. (2018), we estimate the number of exotic images that may be observed with JWST in one of the NIRCam bands.
This paper is organized as follows. In §2, we briefly review the basics of the stable and unstable (point) singularities in gravitational lensing. The cluster lenses used in the present analysis are enumerated in §3. The results are presented in §4. The construction of singularity maps for different cluster lenses is discussed in §4.1. Discussion of stability of singularity maps is presented in §4.2. In §4.3, we estimate the number of strongly lensed galaxy sources with characteristic image formations near these point singularities, that can be observed with the JWST. In §4.4 we discuss the possibility of constraining the source redshift using point singularities. Summary and conclusions are presented in §5. We also discuss the future work in this section. The cosmological parameters used in this work to calculate the various quantities are:
| HFF Clusters | ||||
|---|---|---|---|---|
| Keeton | Sharon | Williams | Zitrin | |
| Abell 370 (A370) | v4() | v4() | v4() | v1() |
| Abell 2744 (A2744) | v4() | v4() | v4() | v3() |
| Abell S1063 (AS1063) | v4() | v4() | v4() | v1() |
| MACS J0416.1-2403 (MACS0416) | v4() | v4() | v4() | v3() |
| MACS J1149.5+2223 (MACS1149) | v4() | v4() | v4() | |
| RELICS Clusters | ||||
| Zitrin | ||||
| MACS J0159.8-0849 (MACS0159) | v1() | |||
| MACS J0308.9+2645 (MACS0308) | v1() | |||
| PLCK G171.9-40.7 (PLCKG171 | v1() | |||
| PLCK G287.0+32.9 (PLCKG287) | v1() | |||
| SPT-CLJ0615-5746 (SPT0615) | v1() | |||
2 Singularities in gravitational lensing
We briefly review different kinds of singularities that occur in gravitational lensing in order to set up notions and notations. For a detailed discussion, please see paper I, and for a pedagogic discussion, you may see Schneider et. al. (1992).
The magnification factor of an image formed at in lens (image) plane is given by:
| (1) |
where and and () are the eigenvalues of the deformation tensor, (a symmetric matrix made of second order partial derivatives of the lens potential) and and are the angular diameter distances between lens and source, and observer and source, respectively. The points in the lens plane where the magnification factor goes to infinity are the singular points of the lens mapping. These points form smooth closed curves known as critical curves in the lens plane. The corresponding curves in the source plane are known as caustics. The caustics are also closed curves, though not necessarily smooth: these are made up of smooth segments with cusps. The smooth parts of caustics are called folds.
As discussed in the paper I, there are two different kinds of singularities in gravitational lensing: stable and unstable. Fold and cusp fall into the stable category as they are present for all possible source redshifts if the lens is critical. The set of points corresponding to cusps in the lens plane form lines known as -lines. On the other hand, each of the unstable singularities (also known as point singularities) only exist for specific source redshifts for a given lens system. All the point singularities are located on the -lines. One can classify different point singularities using eigenvalues and eigenvectors of the deformation tensor. These different point singularities, along with the -lines, constitute a singularity map for a given lens model. In lens plane, -lines locate the points where the gradient of the deformation tensor eigenvalue is orthogonal to the corresponding eigenvector, i.e., . There are two -lines, one corresponding to and the other corresponding to eigenvalue of the deformation tensor. In the source plane, these two -lines correspond to the cusps on tangential and radial caustics, respectively.
The point singularities not only satisfy the -line condition but also satisfy additional criteria depending on the type of the singularity. For example, the swallowtail singularities indicate the points where eigenvector of the deformation tensor is tangent to the corresponding -line. The corresponding characteristic image formation is a tangentially or radially elongated arc made of four images (please see paper I for details). On the other hand, the hyperbolic and elliptic umbilics denote the point where -lines corresponding to the different eigenvalues meet with each other. At hyperbolic umbilic, two -lines (one corresponding to and one corresponding to eigenvalue) meet with each other, whereas at elliptic umbilic six -lines (three corresponding to and three corresponding to eigenvalue) meet with each other. The characteristic image formation for hyperbolic umbilic is a ring shaped (not Einstein ring) structure made of four images. Whereas elliptic umbilic gives Y-shaped seven image configuration with six radially elongated images with respect to the seventh central image (please see paper I for details). As we know that -lines trace the location of cusps in the source plane, these point singularities represent the creation of an extra pair of cusps or an exchange of cusps between tangential and radial caustics in the source plane. These point singularities depend on the second and higher-order derivatives of the lens potential, hence, they are very sensitive to the lens potential. It is noteworthy that to date, we have only observed one characteristic image formation near hyperbolic umbilic (Limousin, et al., 2008; Orban de Xivry & Marshall, 2009), a handful of image formations near swallowtail singularity (Abdelsalam, Saha & Williams, 1998; Suyu & Halkola, 2010) and (to the best of our knowledge) no image formation near elliptic umbilics.
A singularity map is a compact representation of a given lens model, and as discussed above, by locating -lines and the point singularities, it finds all the high magnification regions in the lens plane. These -lines are the obvious targets for the deep-surveys for the given lens. In the following sections, we will construct singularity maps for different cluster lenses and look at the effects of the various mass reconstruction methods on the singularity map for a given lens.
3 Cluster lenses
In this section, we briefly discuss the cluster lenses used to construct and study the singularity maps. Preliminary analysis in this direction consisting of ideal lens models and one real cluster lens, Abell 697, has been presented in paper I. In the present analysis, we selected ten clusters for a detailed study of their singularity maps. Five out of these ten clusters were chosen from the Hubble Frontier Fields (HFF) survey (Lotz, et al., 2017) 111https://archive.stsci.edu/prepds/frontier/ and the other five were chosen from the Reionization Lensing Cluster Survey (RELICS) (Coe, et al., 2019) 222https://archive.stsci.edu/prepds/relics/. The cluster lenses used in current study are described in Table 1. The table provides relevant details, e.g,, the resolution and the version of the mass models corresponding to various groups of modelers.
The HFF program targets a total of six massive merging clusters to study the distant, faint sources and the cluster dynamics (please see Lotz, et al. (2017) for further details). Our analysis requires a model for the gravitational lenses. Mass reconstruction of the clusters has been attempted by multiple groups (Diego, et al., 2005; Merten, et al., 2011; Jauzac, et al., 2014; Johnson, et al., 2014; McCully, et al., 2014; Grillo, et al., 2015; Ishigaki et al., 2015; Hoag, et al., 2016; Caminha, et al., 2017; Kawamata, et al., 2018) using different approaches. The data from the observations is finite, one cannot model these cluster lenses with arbitrary precision and resolution. Different groups use different methods to reconstruct the cluster lens mass distribution; for example, some groups use parametric modeling (including the light distribution of cluster galaxies, some preferred profile for the mass of cluster substructures) whereas some other groups use the non-parametric approach which does not rely on any assumption. Some groups also use hybrid methods which take inputs from both parametric and non-parametric approaches (please see Priewe, et al. (2017); Meneghetti, et al. (2017) for a comparison of different modeling techniques). In our work, for five different HFF clusters, we used best-fit lens mass models provided by four different teams: Keeton, Sharon (Jullo, et al., 2007; Johnson, et al., 2014), Williams (Liesenborgs, et al., 2007) and Zitrin (Zitrin, et al., 2009, 2013) (in the case of Zitrin group, we used mass models reconstructed using NFW profile, i.e., zitrinnfw) to construct the singularity maps for an HFF cluster. We chose the central region of every cluster for our analysis, as these regions are responsible for the strong lensing. The size of the central part which we chose depends on the resolution of the lens model. In our analysis, we decided to use square regions with a side of . For low-resolution cluster lens models, the choice of a large area introduces noise, and this affects the reliability of that particular singularity map as the noise can introduce spurious singularities. For the HFF cluster lenses, the central (ra, dec) values of the Sharon group are considered as standard values whenever we compare different singularity map for an HFF cluster. This is for ensuring uniformity and the choice does not arise from any preference for one set of models. As can be seen from Table 1, one of the HFF clusters, MACSJ0717.5+3745, is not part of our current analysis as the corresponding singularity maps consist of a large number of spurious point singularities (please see section 4.1 for a discussion about noise in the singularity maps and its effects).
RELICS consists of a total of cluster lenses (please see section 2 in Coe, et al. (2019)). For RELICS cluster lenses, at present, the mass modeling is done by three different groups using the Lenstool (Cerny et al., 2018; Paterno-Mahler et al., 2018; Mahler et al., 2019), the LTM method (Acebron et al., 2018, 2019, 2020; Cibirka et al., 2018), and the Glafic tool (Okabe et al., 2020). The Glafic mass models have a resolution of , whereas most of the Lenstool mass models have a resolution between to . Therefore, for RELICS clusters, due to the low resolution, we cannot use the Glafic or the Lenstool mass models and cannot perform a comparison between different mass model reconstruction techniques (please see section 4.1 and 4.2 for further details about the effect of mass model resolution). The Zitrin group mass models have a resolution of but consist of a large number of spurious point singularities. The reason for the high number of spurious point singularities can be the that the higher-order derivatives of the lens potential are not well constrained at this resolution: note that all the other maps of these clusters use a coarser resolution. Hence, in our current study, we only use one mass model for five different RELICS clusters to construct the singularity maps (see Table 1). The best-fit lens mass models considered here for RELICS clusters are parametric in nature and constructed by the Zitrin group using the light-traces-mass (LTM) method with Gaussian smoothing (zitrinltmgauss). A more detailed comparison may become possible in future with the availability of deep, high resolution images and construction of corresponding lens models.
4 Results
Construction of singularity maps helps us in identifying the high magnification regions in the lens plane of a given cluster lens, which are obvious targets for the deep surveys. The high sensitivity of -lines and point singularities to the lens potential encouraged us to compare the singularity maps corresponding to the different mass models for a cluster lens, which are constructed using different techniques. Such a comparison provides us information about the effects of the reconstruction methods and the presence of substructures in a cluster lens on the singularity map. Future observations of characteristic image formation around point singularities may help distinguish between different models based on present observations. In this section, we present results of our study of the construction of singularity maps for the HFF and RELICS clusters, followed by a comparison of different mass models for a cluster lens (§4.1). In §4.2, we study the stability of these singularity maps against the mass model resolution and determined the optimal resolution to construct the singularity map for a given lens. In §4.3, we estimate the number of source galaxies lying near the point singularities and the possibility of observing the corresponding characteristic image formation in upcoming all-sky surveys followed by the constraints on the source redshift using the point singularities in §4.4.
4.1 Singularity Maps
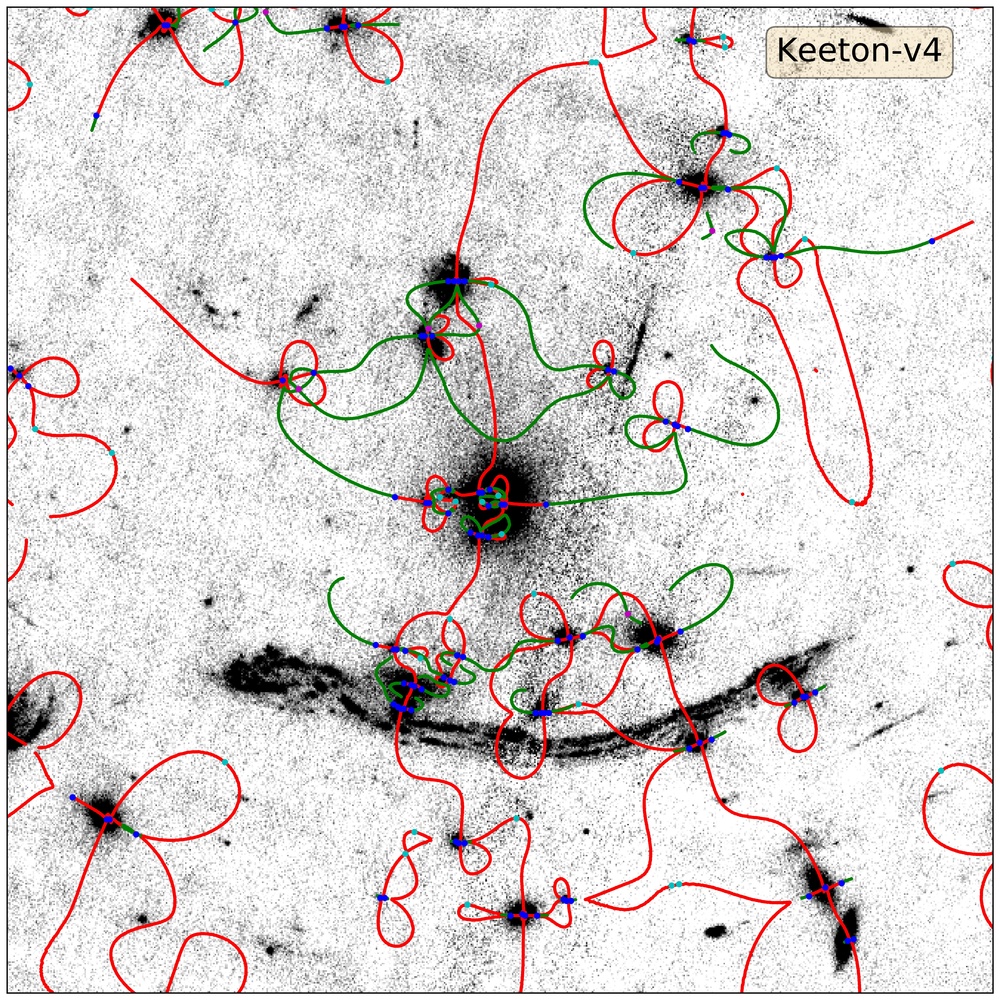
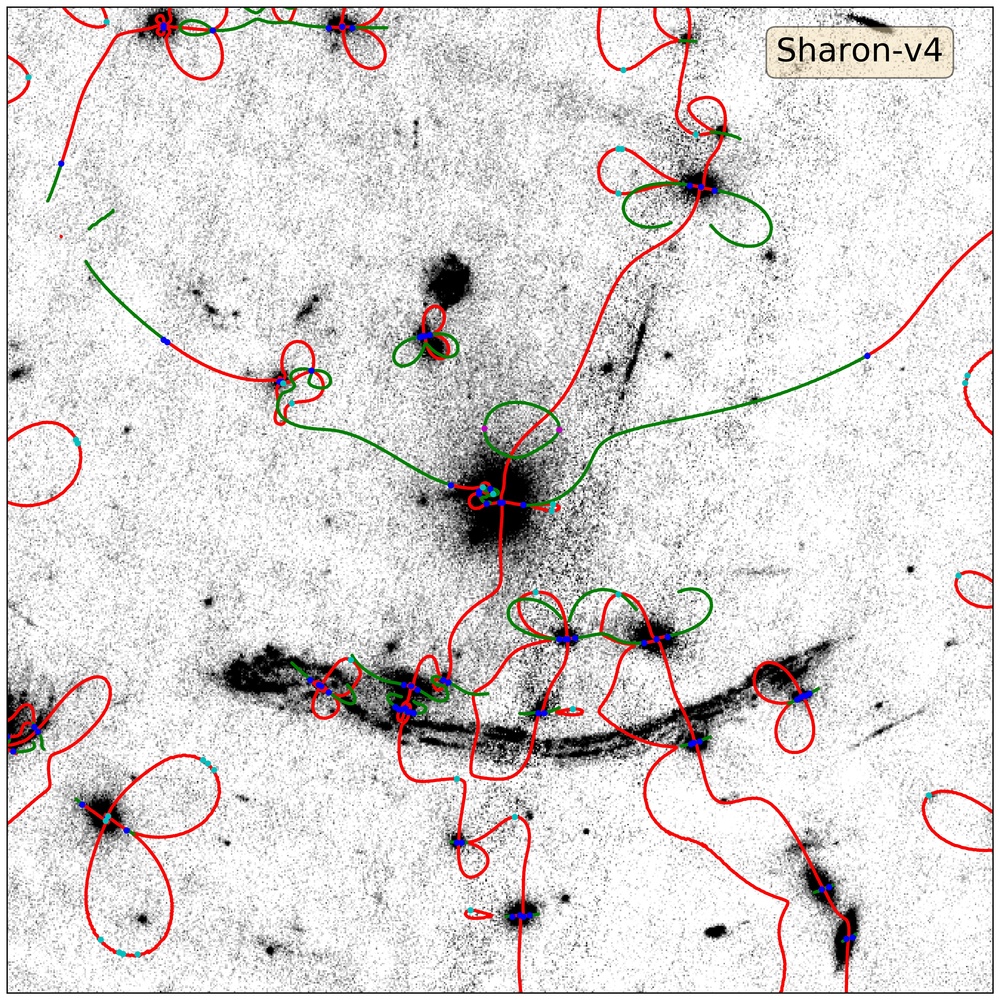
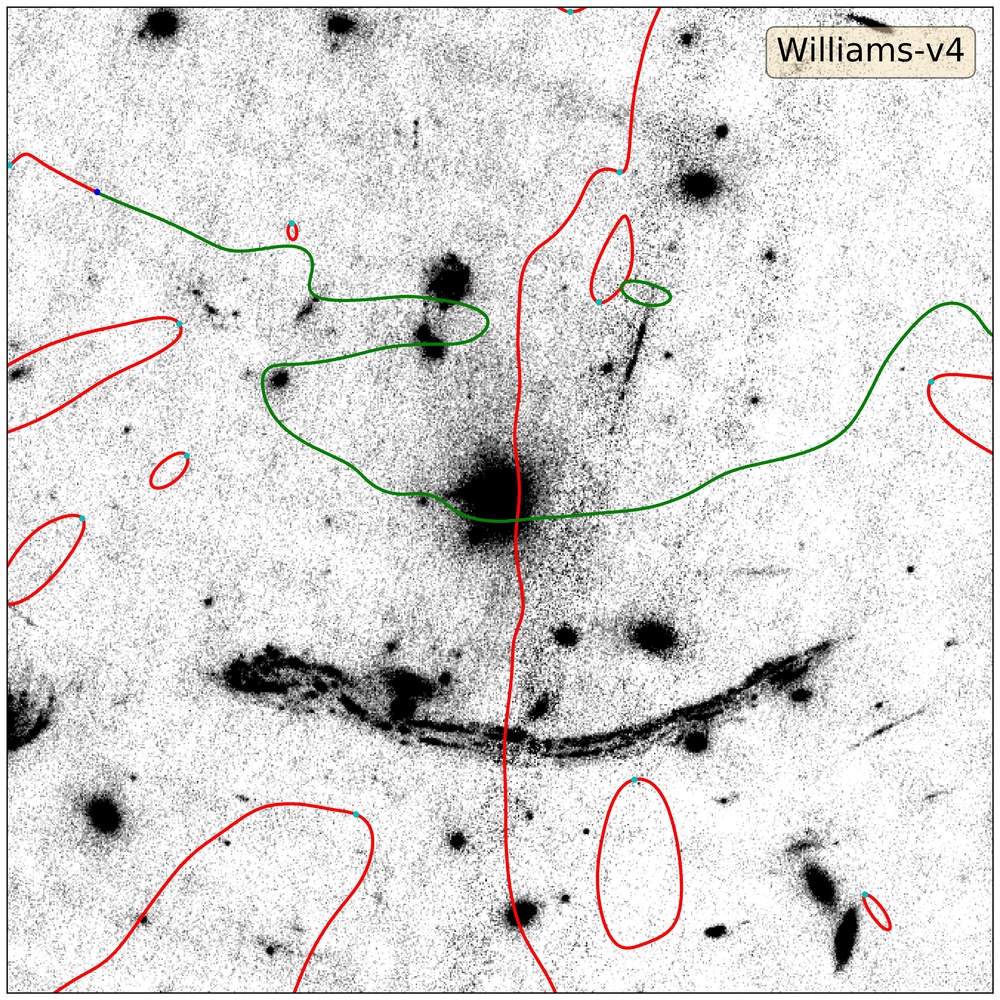
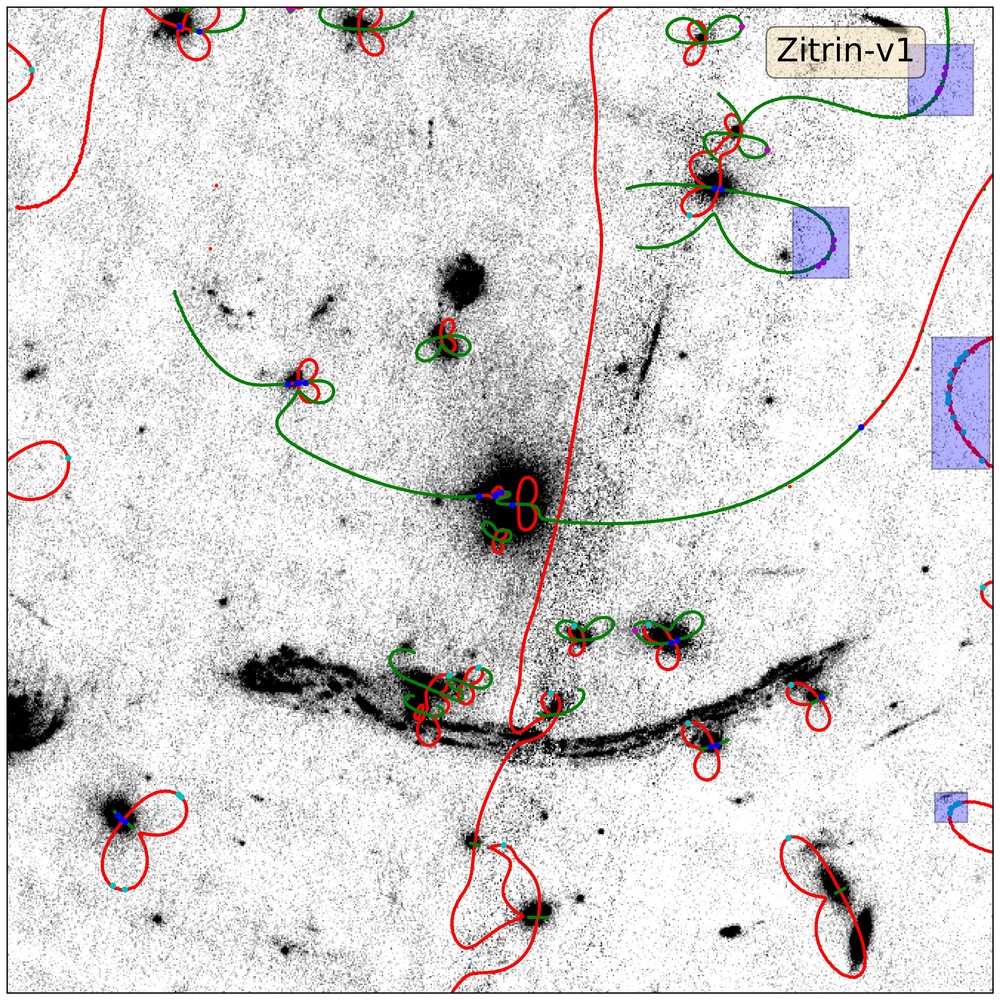
We use the algorithm discussed in paper I to construct the singularity maps for different lens models throughout this work. In order to keep it concise, we only present singularity maps corresponding to one cluster lens (A370) in this article. The rest of the singularity maps are available online (along with all the plots shown here) as supplementary material. Figure 1, represents the singularity maps for A370 corresponding to four different mass models (please see Table 1). In every panel, the red and green line are the -lines corresponding to the and eigenvalues of the deformation tensor, respectively. The blue points show the hyperbolic and elliptic umbilics. The cyan and magenta colored points represent the swallowtail singularities corresponding to the and eigenvalues, respectively. In each panel, the background is the cluster image in the F435W band. Every map in Figure 1 is a central square region of the cluster with center coordinates (in degrees) . The source redshift () in the range between the lens redshift and is used here. Singularities in this range are shown in these plots. Hence, the -lines trace the location of cusps for sources up to a redshift of ten.
As one can see from Figure 1, different singularity maps show differences in the -line structures and the number of point singularities. However, one can still identify an overall -line structure similar to an elliptical lens in every panel, which represents the entire cluster as an elliptical gravitational lens (please see paper I for singularity map corresponding to an elliptical lens). These differences arise mainly due to the fact that different groups use different mass reconstruction methods, and the number of substructures used by different teams is also different, which is evident from Figure 1. For example, mass models from Keeton, Sharon, and Zitrin groups are reconstructed using the parametric approach, which takes into account different properties of the cluster substructures as input and finds the best-fit parameters. On the other hand, the non-parametric reconstruction by Williams group uses no information regarding the cluster substructures as an input. Hence, the singularity map corresponding to the Williams group shows the simplest -line structure and least number of point singularities as their reconstruction method does not give significant weightage to the presence of cluster substructures. It is possible that substructure in their models is suppressed to some extent due to averaging over a large number of realizations in their approach. This is also evident from the fact that the best-fit mass model corresponding to the Williams group does not give a five-image configuration for a source at the giant arc’s redshift () in A370. This can also be seen from the corresponding singularity map as there is no swallowtail from the center to the giant arc, which can give rise to a five-image geometry. On the other hand, all parametric mass models have swallowtails near the giant arc in the lens plane, which gives rise to five-image geometry. Looking at the singularity maps corresponding to parametric mass models, one can see that different small scale structures introduce extra -lines and point singularities in the singularity maps.
As mentioned above, due to the finite amount of observational data, one cannot achieve arbitrary high resolution during cluster lens mass reconstruction. The finite resolution of lens models also introduces a few problems in singularity maps. The first problem is the noise in the singularity map, which can be seen in the bottom right panel of Figure 1. The low resolution directly affects the shape of the -lines, and it introduces spurious swallowtails point singularities as our algorithm first identifies the -lines and uses these to locate swallowtail singularities. To eliminate the effect of the noise, we do not include these spurious point singularities in our further calculations. We mark these spurious point singularities utilizing the fact that in the absence of noise, the -lines are smooth lines, which can be seen in every panel of Figure 1 and 2. However, as the noise increases, points near the -lines in the lens plane also contribute to the -lines and affect the local shape of the -lines. This, by definition, influences the number of swallowtails in the singularity map. We manually inspect every singularity map and mark such regions. The other problem that has been introduced due to finite resolution are the missing point singularities. Sometimes when the distance between two similar kinds of point singularities is less than the grid size, our method is resolution limited and it does not find these as two different point singularities. Instead, it only assigns one point singularity into that pixel. This mainly happens in the case of hyperbolic umbilics as pair of hyperbolic umbilic forms at the position of substructures in the singularity map. However, this does not affect the overall cross-section of hyperbolic umbilics significantly, as the number of such missed out points is tiny, and most of these points get critical at very low redshifts. Hence, the contribution of these (left out) points in the cross-section is negligible.
The finite resolution of the mass models also affects the size of the singularity map. Hence, we are only able to construct singularity maps for the central region of the lens. As one goes away from the central region, the length of -lines, and the total number of point singularities increases. However, the number of spurious structures introduced by noise also increases. As a result, the number of point singularities that one can see in Figure 1, should be considered as the lower limit of the total number of point singularities that one cluster lens has to offer.
4.2 Stability of Singularity Maps
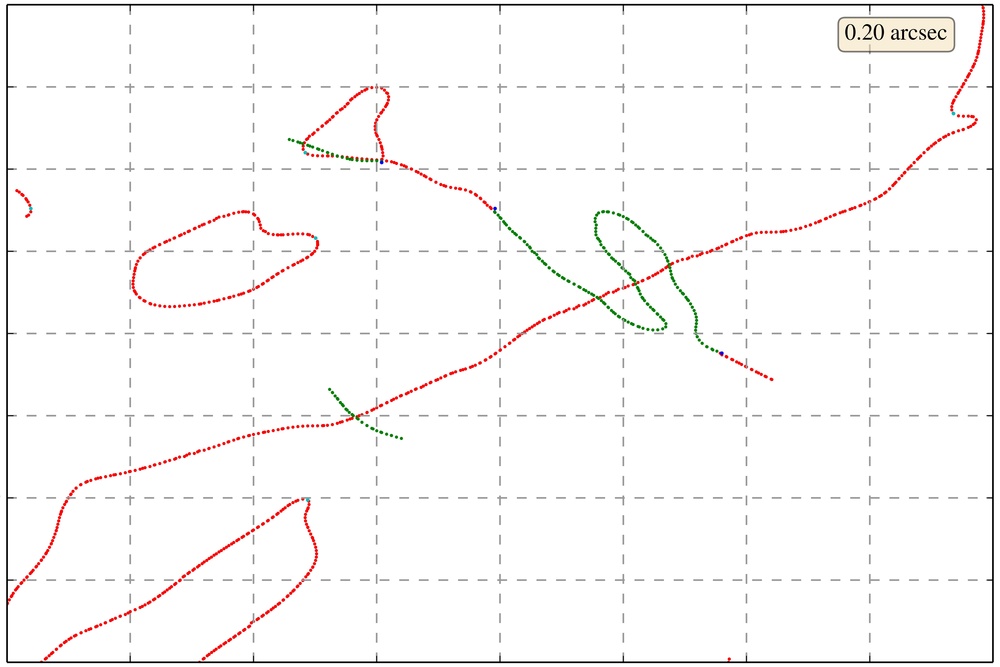
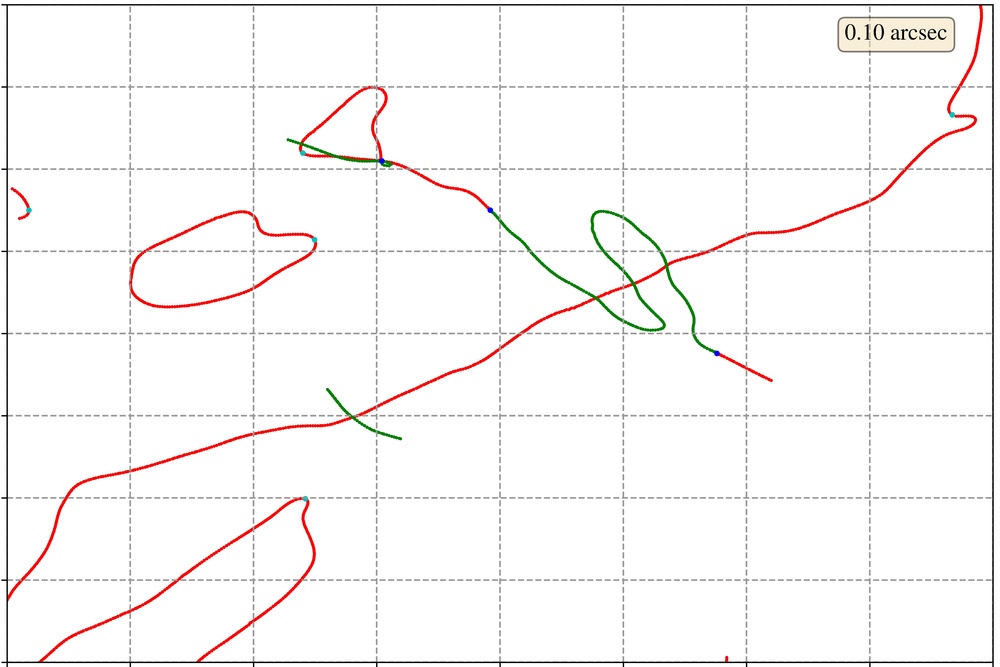
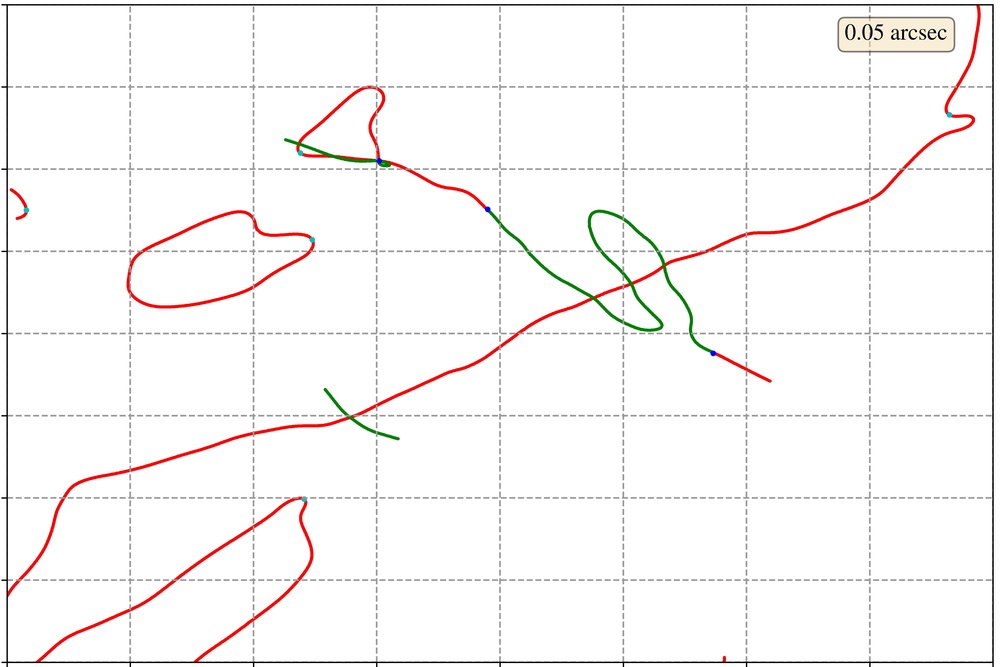
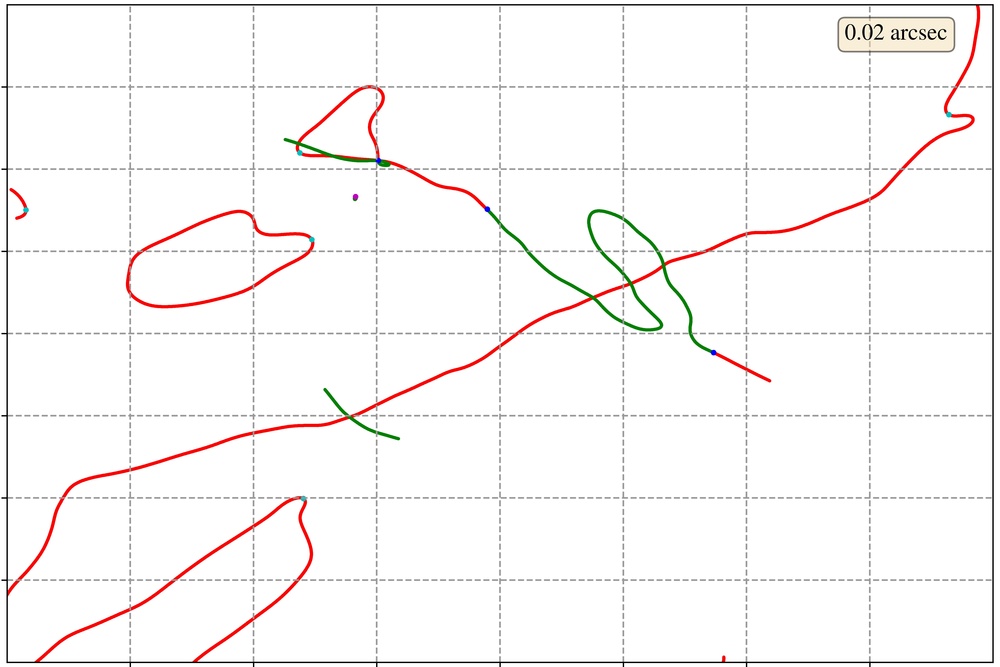
One can deal with the above mentioned difficulties (noise and the left out point singularities) by increasing the resolution of the mass models. However, an increment in resolution can be computationally expensive. Apart from being computationally expensive, the other point that one needs to take into account is the stability of the singularity maps. We know that the structures in a singularity map depend on the lens potential and its higher-order derivatives in a non-linear fashion. Hence, the question arises, whether the increase in resolution can introduce new structures in a singularity map? Or do we reach convergence at some stage? Addressing this question also helps us to find out the optimal resolution for the construction of singularity maps. To answer this question, we constructed singularity maps corresponding to mass models provided by the Williams group for the HFF clusters with four different resolution values, and . 333The publicly available Williams group data files have a resolution of . However, using data files provided by Prof. Liliya Williams, we can (in principle) resolve their mass models with an arbitrary resolution, as their mass models are superposition of a large number of projected Plummer density profiles.
Figure 2, shows the singularity map for MACS1149 with four different resolution values, and . It is apparent that increasing the resolution of the mass models helps us to better resolve the structures in the singularity maps. It does not introduce any new significant structures apart from the bottom right panel (resolution ), where one extra loop of -line corresponding to -eigenvalue along with a swallowtail makes an appearance. This is the case, at least in the case of non-parametric modeling. This is because there is no structure smaller than the resolution in Figure 2. However, in the case of parametric models, some structures are very small even at a resolution of and one can miss these structures at a resolution of or . This is also evident from the fact that in parametric models, even at a resolution of , some hyperbolic umbilics are missed. Hence, the optimal resolution to construct singularity maps, in the case of both parametric and non-parametric modeling, should be of the order of . This can be further confirmed in the case of parametric models by making singularity maps with different resolutions (as we have done in Figure 2) for non-parametric models. For non-parametric mass models, somewhat low-resolution singularity maps can also do the job. However, in the case of parametric modeling, one should construct mass models with a resolution of at least for construction of singularity maps. In general, the resolution of mass models should be better than or at least equal to the resolution of observations used to arrive at the map for completeness.
4.3 Cross-Section
Singularity maps can be used to study the variety of characteristic image formation near point singularities. This then becomes a template for searching different image types in observations. We expect the upcoming surveys to yield a number of systems, and a quantitative prediction requires calculation of cross-section for each type of singularity.
Once we draw the singularity maps for different mass models, the next task is to determine the number of characteristic image formations near different kinds of unstable singularities which can be observed in surveys with different upcoming facilities. In order to make the estimate, we identify the range in redshift around the critical redshift for each point singularity. We wish to choose the range such that the image formation can be identified as characteristic of the given type of singularity. As discussed in the paper I and mentioned above, image formation for different point singularities evolves differently with redshift. Hence, the redshift interval in which one can observe the characteristic image formation will also be different for different point singularities. Source redshift comes in the equation via distance ratio, . Therefore we determine the corresponding distance ratio interval, and use it to deduce the appropriate redshift interval.
In the case of hyperbolic umbilic, one can observe the characteristic image formation at redshifts significantly smaller and larger than the critical redshift, and we choose , where is the distance ratio at the critical redshift. The choice of in this way also automatically takes into account the fact that at small source redshifts, the caustics in the source plane evolve more rapidly compared to the high redshifts. Hence, the distance ratio interval, , for a point singularity is small for smaller source redshifts. As we go towards higher source redshifts, the size of the distance ratio interval increases. For swallowtail, one can only observe the characteristic image formation beyond the critical redshift. So, in the case of swallowtail singularity, the distance ratio interval modifies to , and the is taken to be equal to of the distance ratio at the critical redshift. For elliptic umbilic, the seven image Y-shaped image formation can only be observed up to the critical redshift. Hence, for elliptic umbilic, the distance ratio interval modifies to , and the is equal to of the distance ratio at the critical redshift as elliptic umbilics are highly sensitive to the redshift evolution.
Once we determine the redshift interval corresponding to the different point singularities, we proceed to estimate the area in the source plane around the caustics in which the source must lie to produce characteristic image formation. As we know, the magnification factor for extended sources is smaller than a point source (Diego, 2019). Hence, if a compact source such as a star lies near the caustics in the source plane, then we get an observation of the characteristic image formation. However, such sources are very rare in cluster lensing (Kelly, et al., 2018), and mostly we observe a galaxy as a source. We are mainly considering galaxies as potential sources. We consider a circular area in the source plane near the caustic structure corresponding to the point singularities with a radius of kpc.
The above-chosen values of the distance ratio interval for different point singularities and source plane area near point singularities cannot be calculated mathematically. Hence, we manually estimate these numbers by observing a large number of lens systems (from galaxy to cluster scales) near point singularities and inspecting the corresponding image formations. One should keep in mind that these numbers directly affect the calculated cross-section of point singularities and should be chosen very carefully. Apart from that, as discussed in section 4.1 and 4.2, the finite resolution of the mass maps introduces the spurious point singularities, directly affecting the corresponding point singularity cross-section. As one can see in supplementary material, the number of such spurious point singularities is relatively high for RELICS clusters compared to the HFF clusters. Hence, we do not calculate the point singularity cross-section for the RELICS clusters in our current work and restrict ourselves to the HFF clusters for point singularity cross-section estimation.
The remaining information that we need is the surface density of the observed galaxies as a function of redshift. However, the surface density of observed galaxies is sensitive to the underlying models of galaxy formation and evolution as well as the waveband and limiting magnitude. We consider a recent study by Cowley, et al. (2018) (heareafter C18) for JWST. In C18, a part of the work was to estimate the number of galaxies observed in different bands of JWST, considering an exposure time seconds (please see C18 for a detailed description). The useful quantity for our analysis, the surface density of observed galaxies, is shown in Figures 9 and 10 of C18. Here, for simplicity, we only consider one NIRCam filter, F200W, for our analysis.
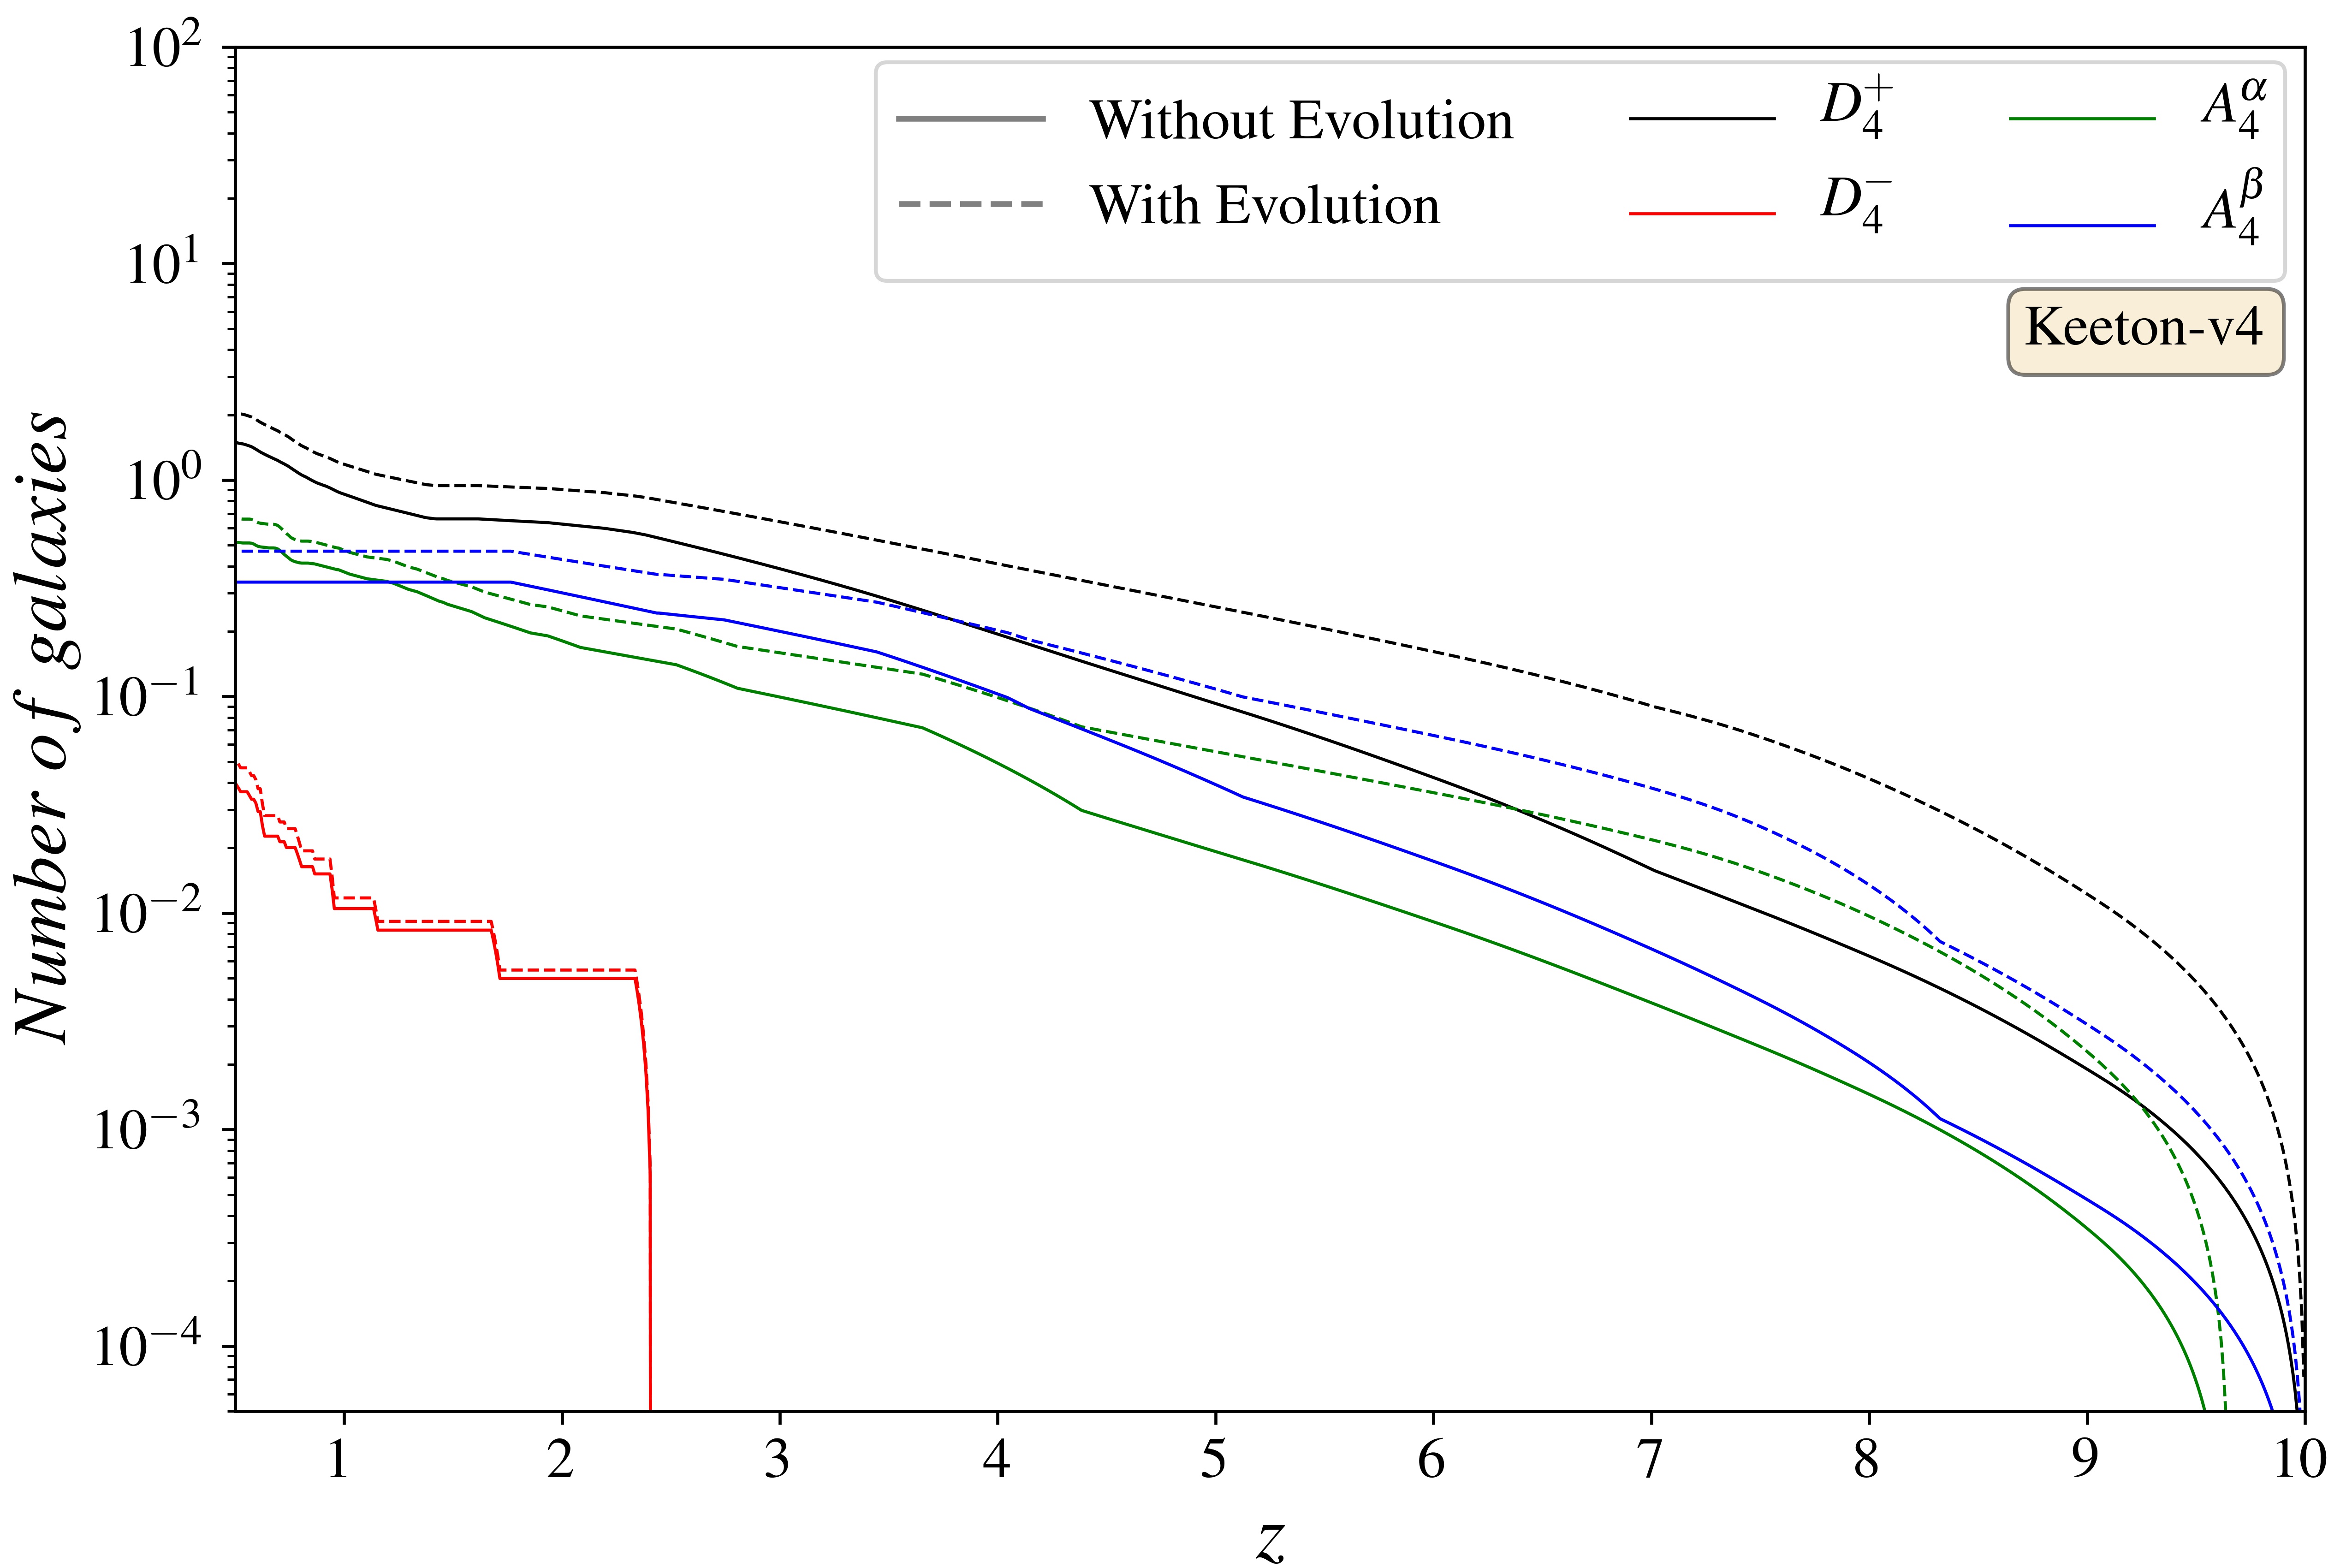
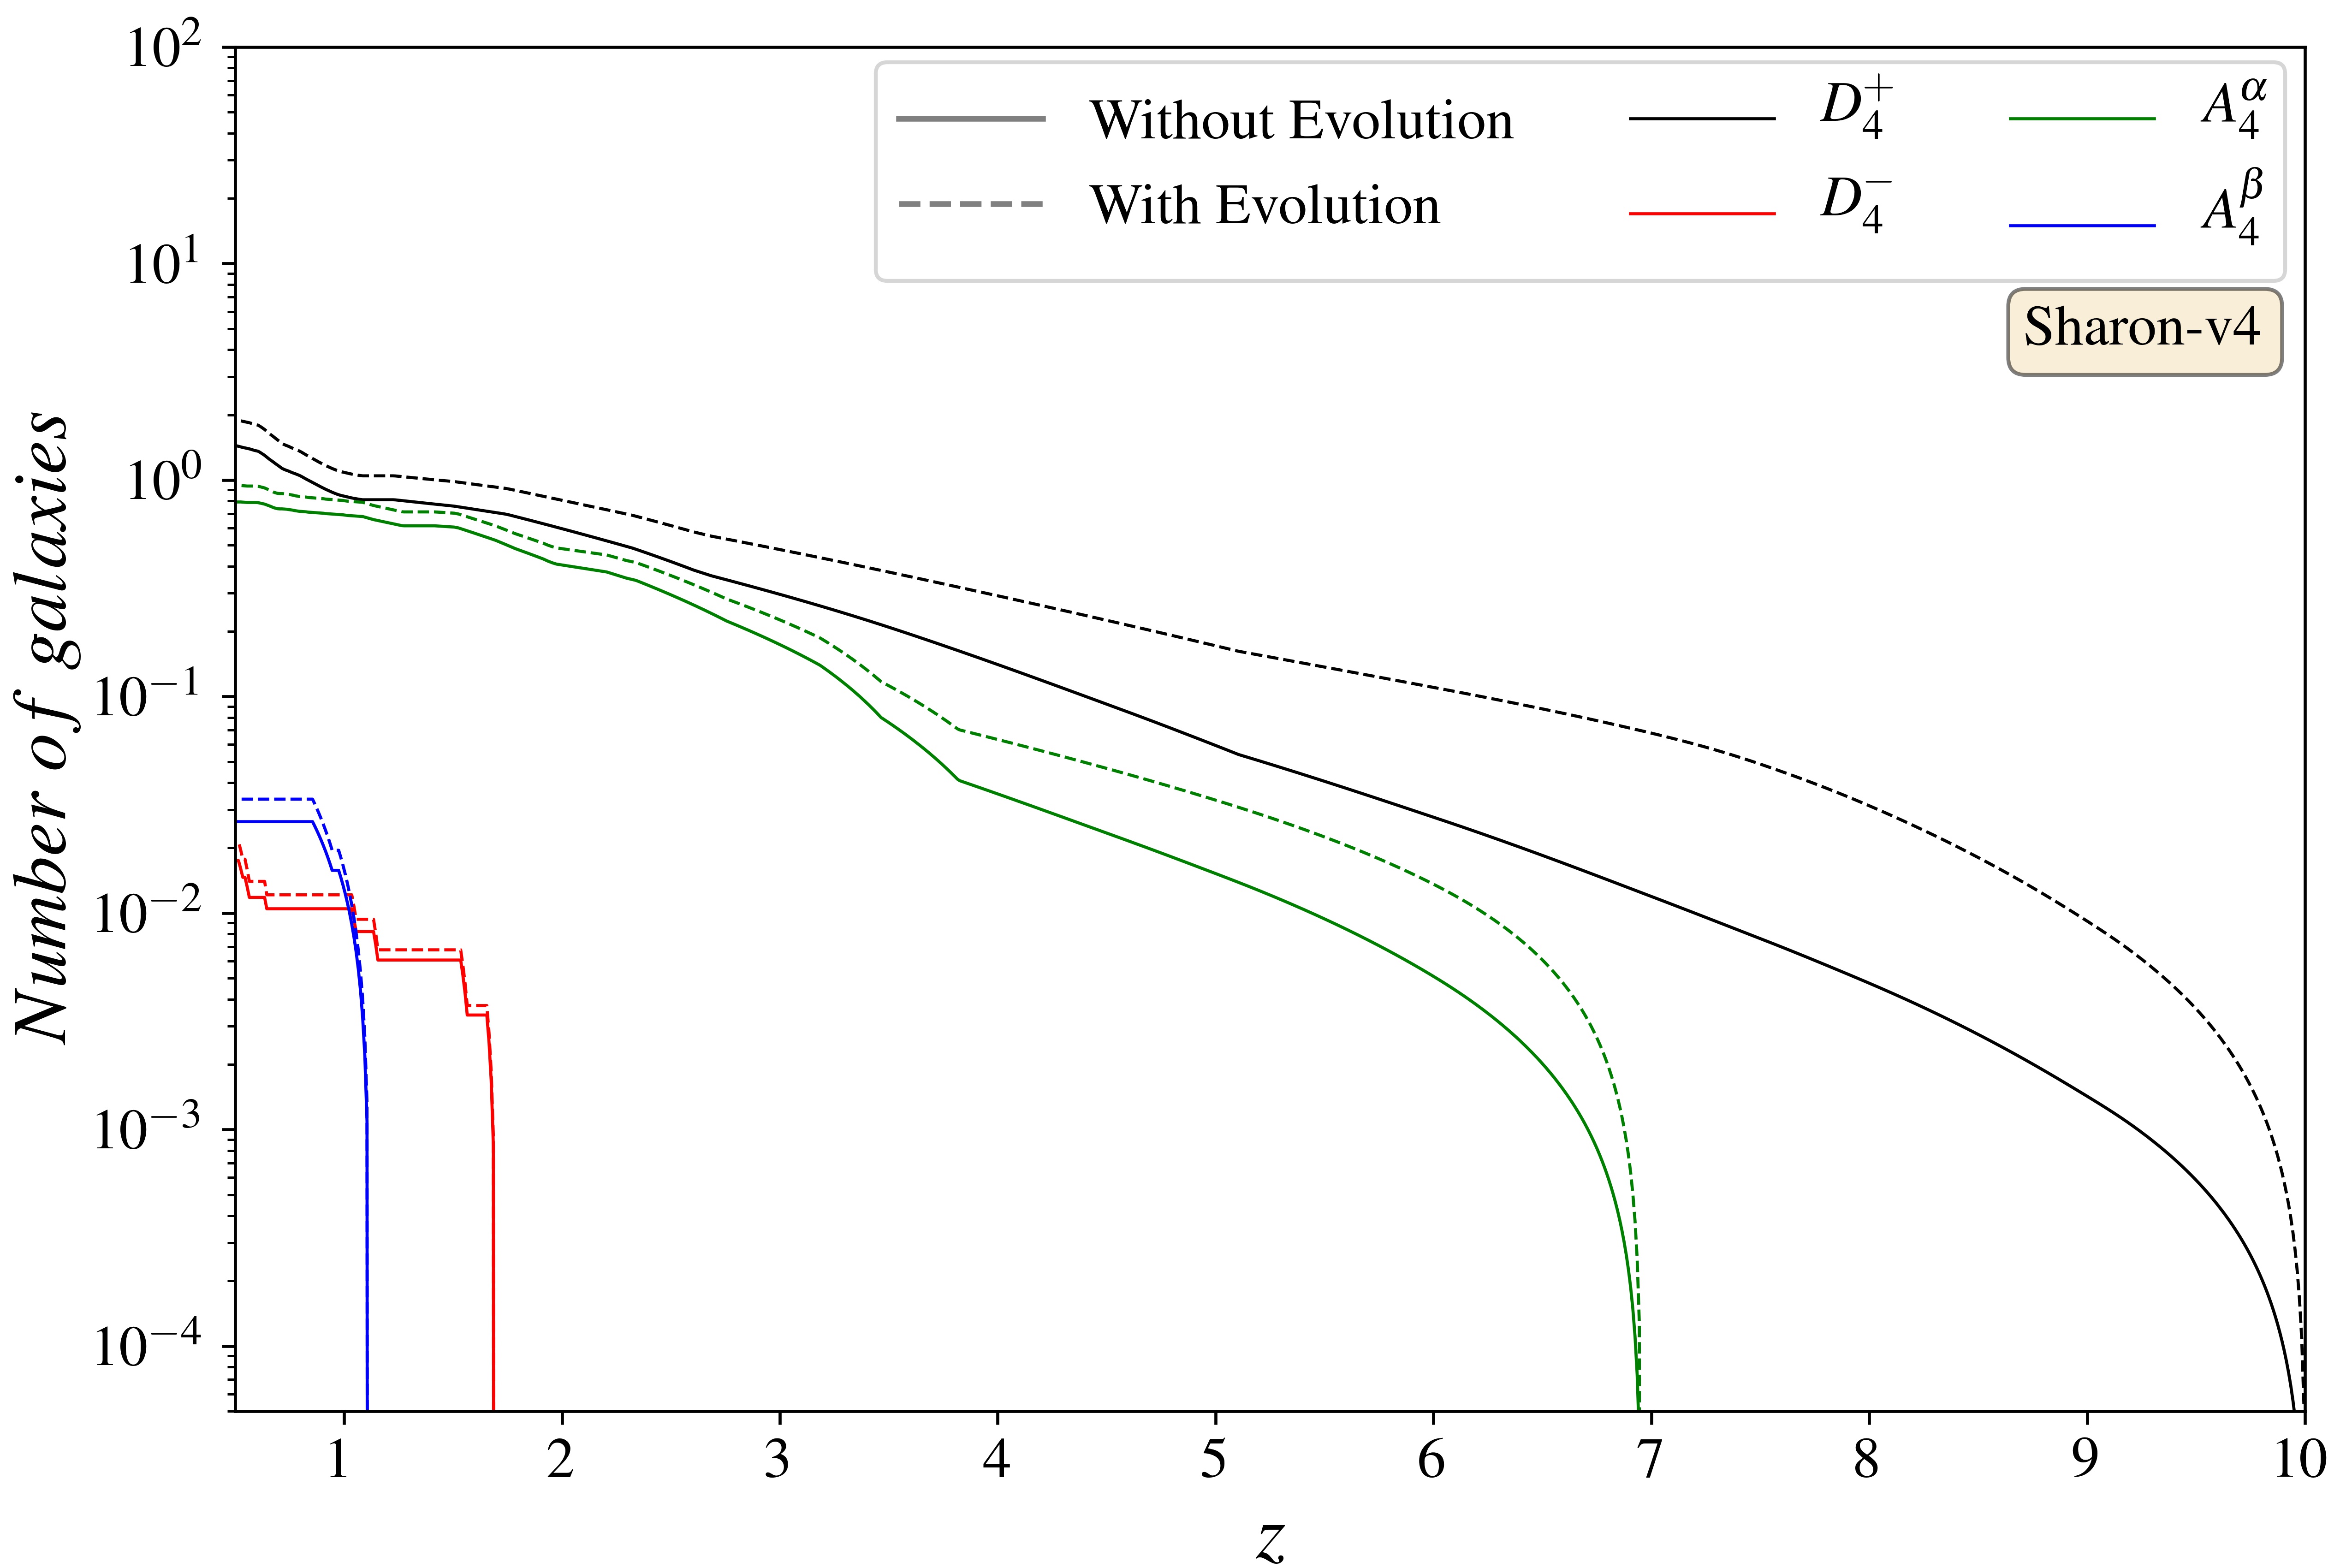
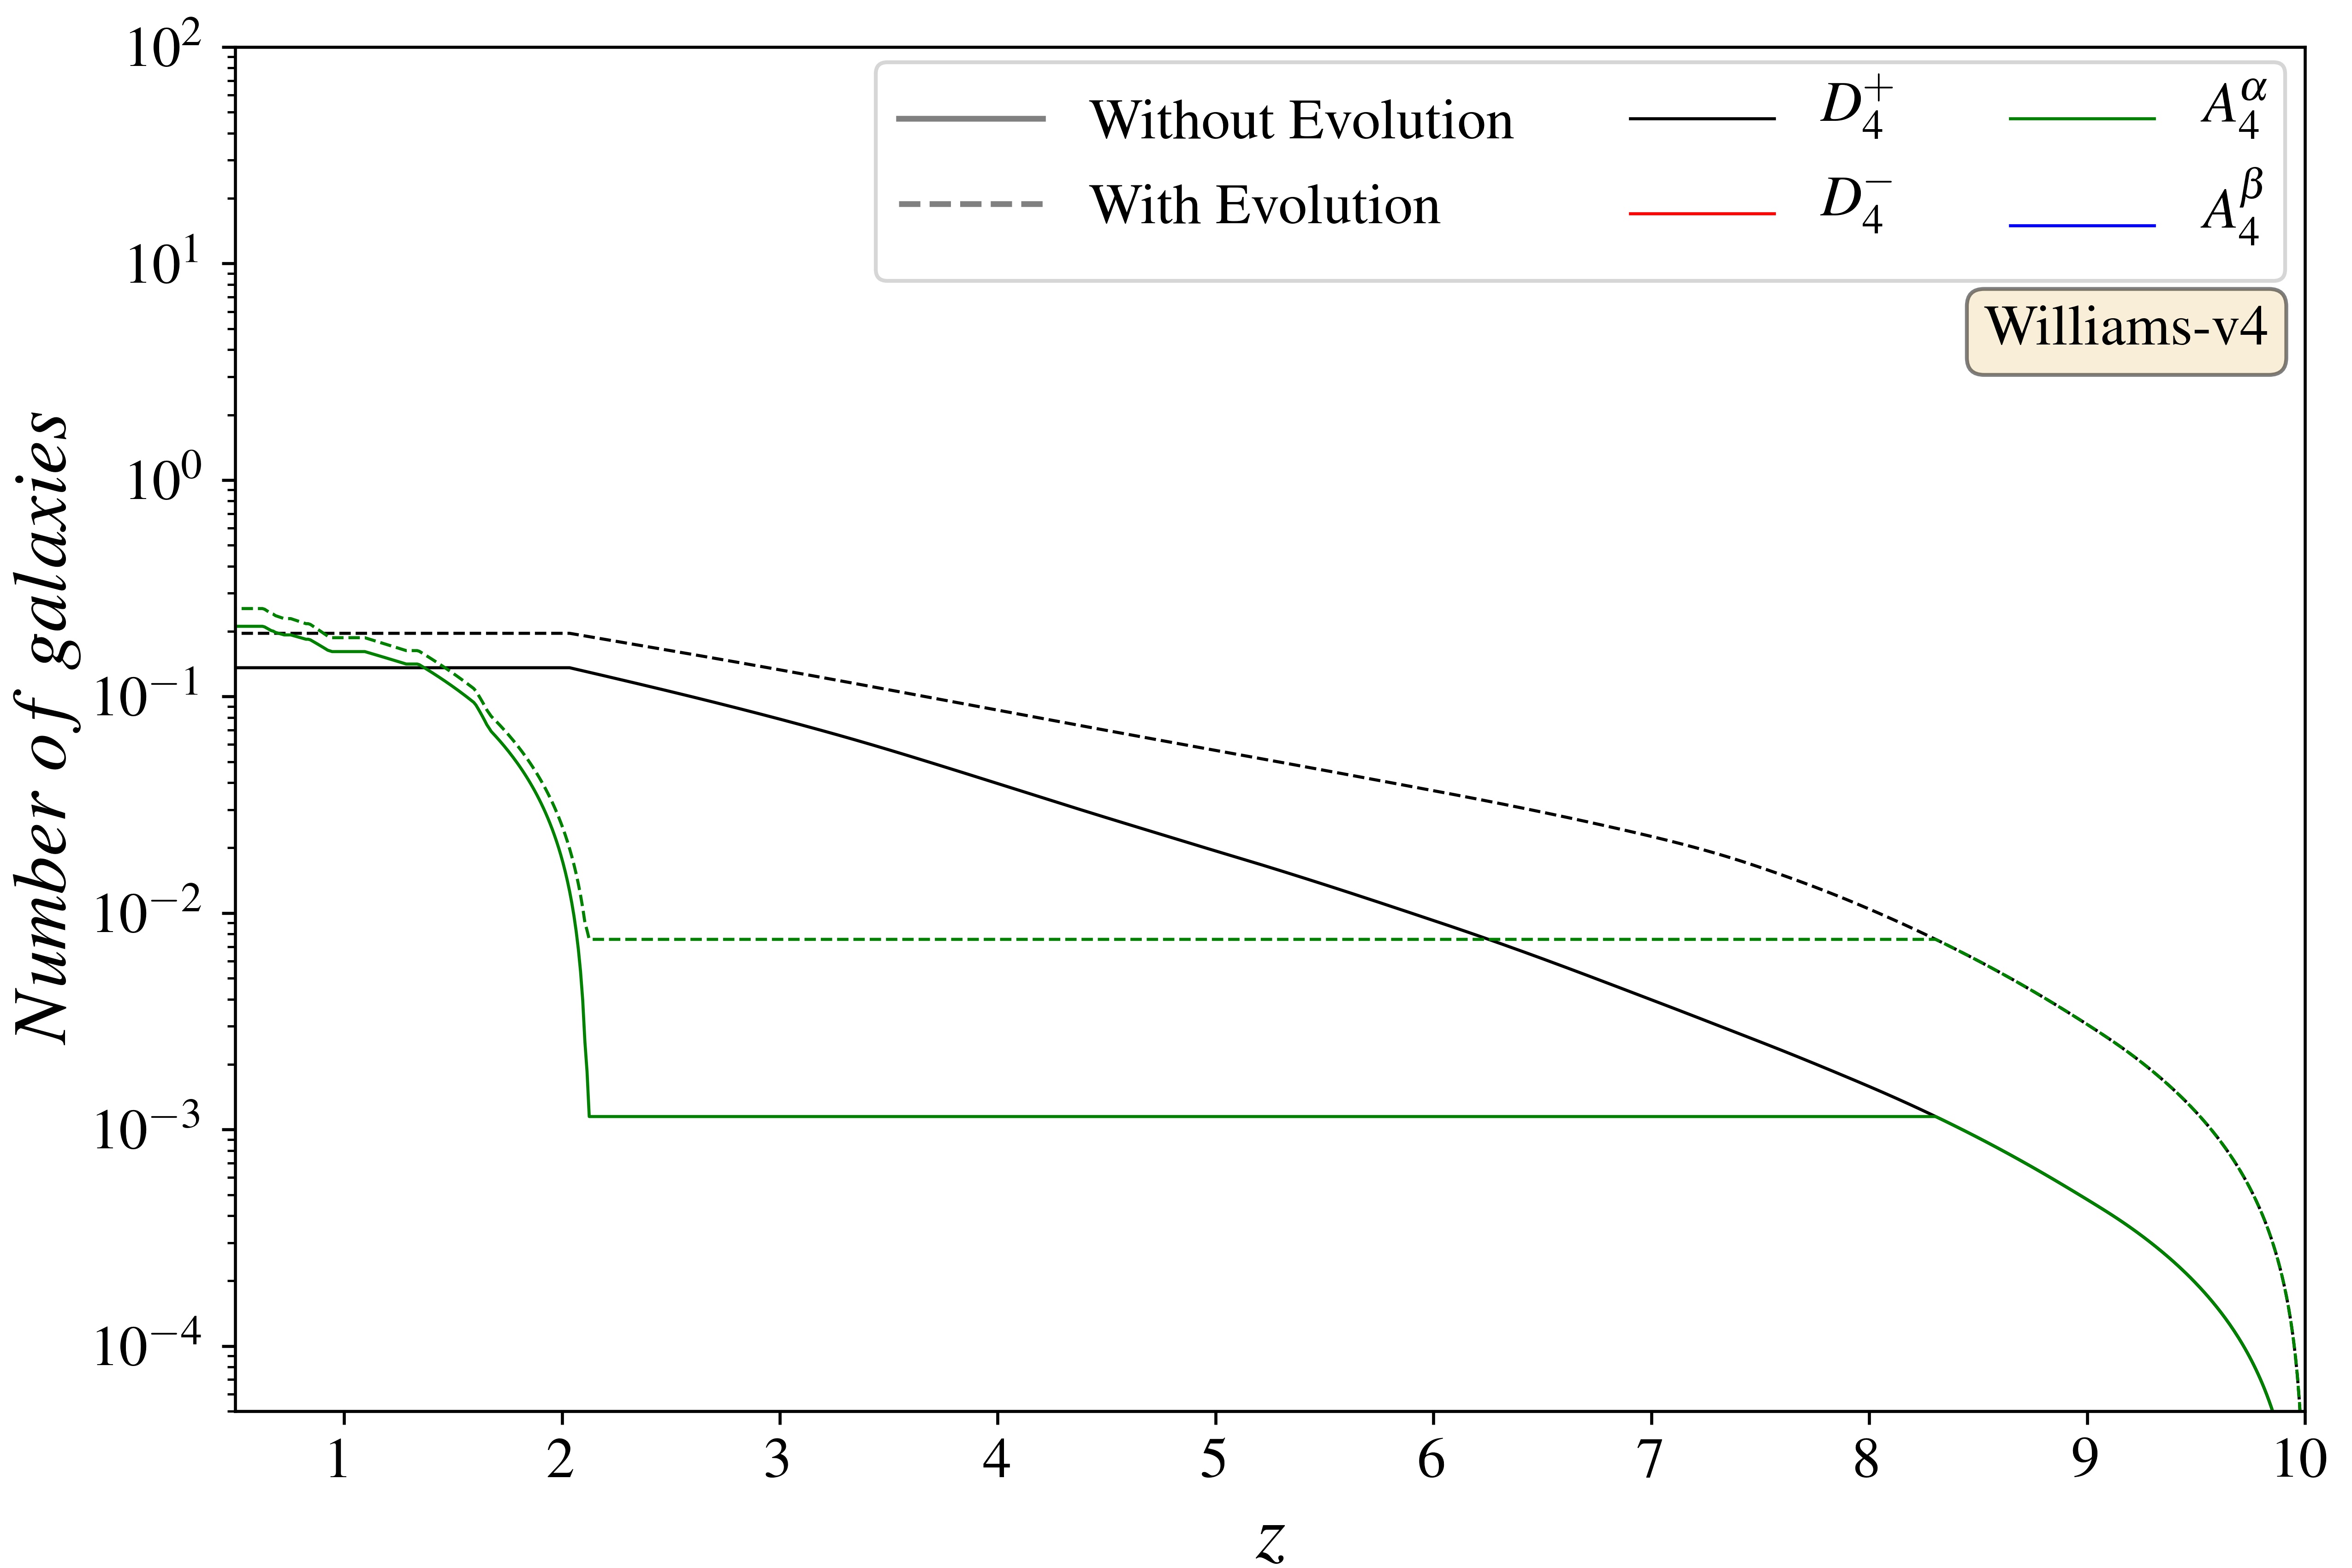
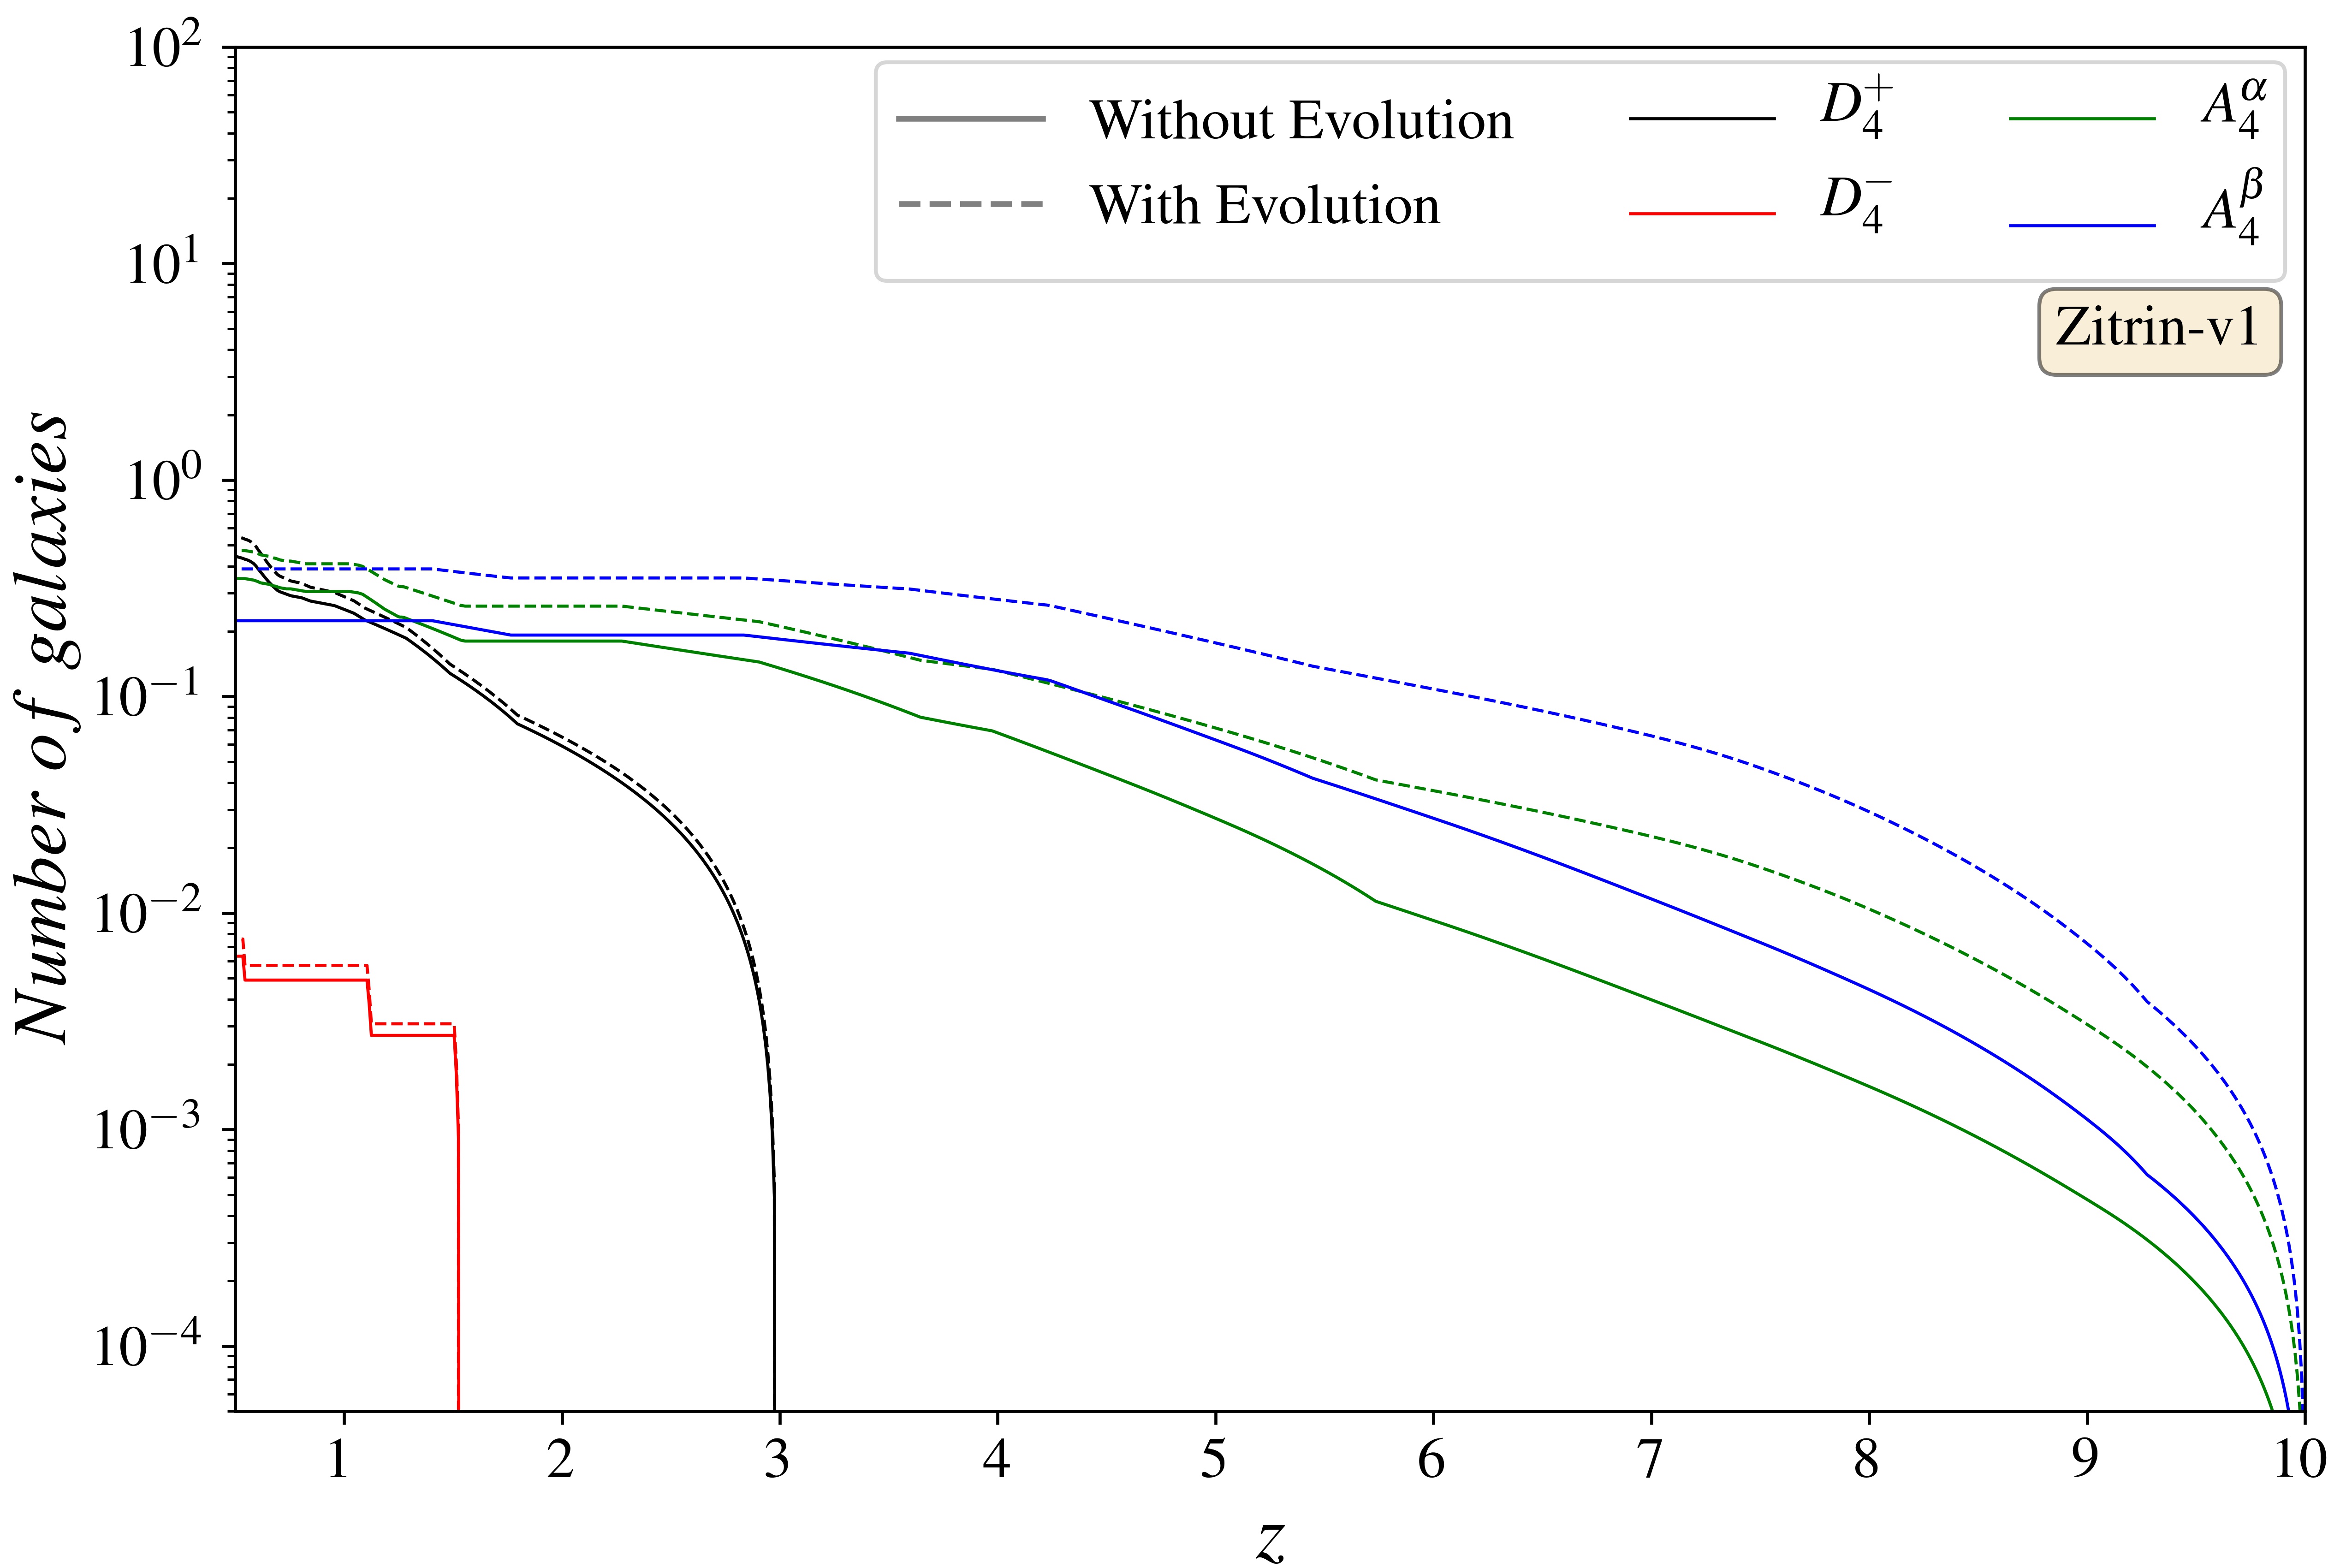
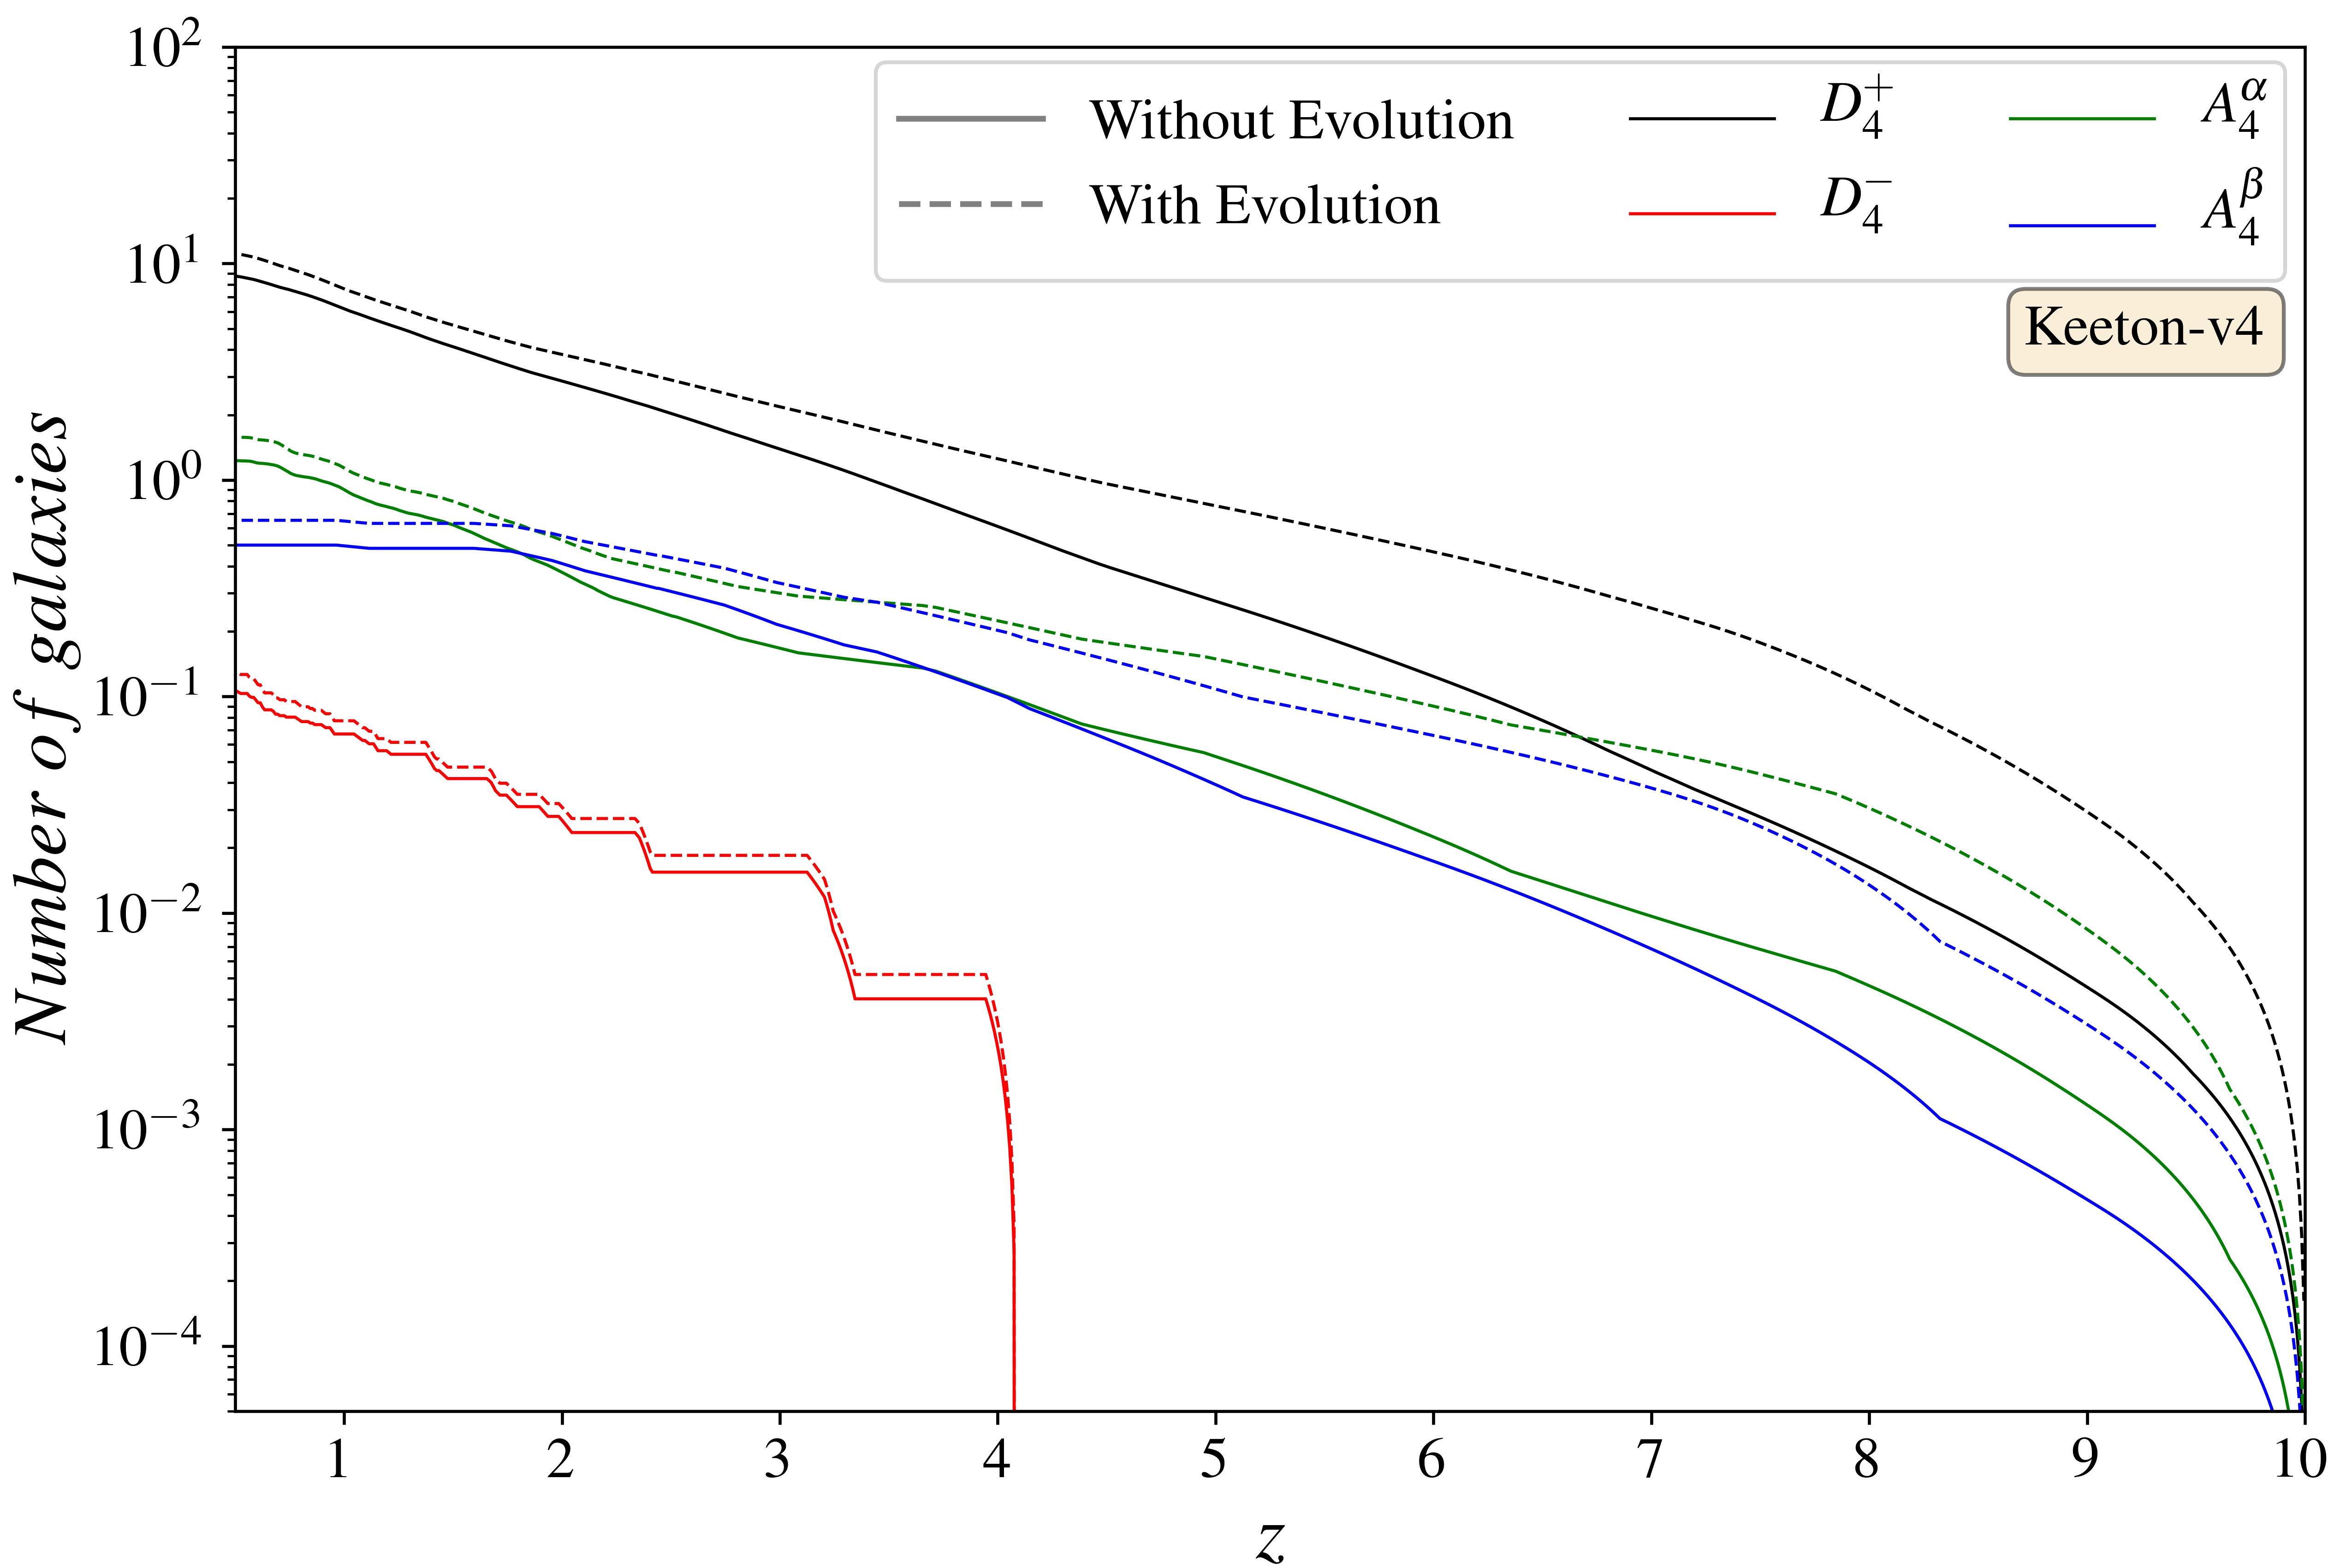
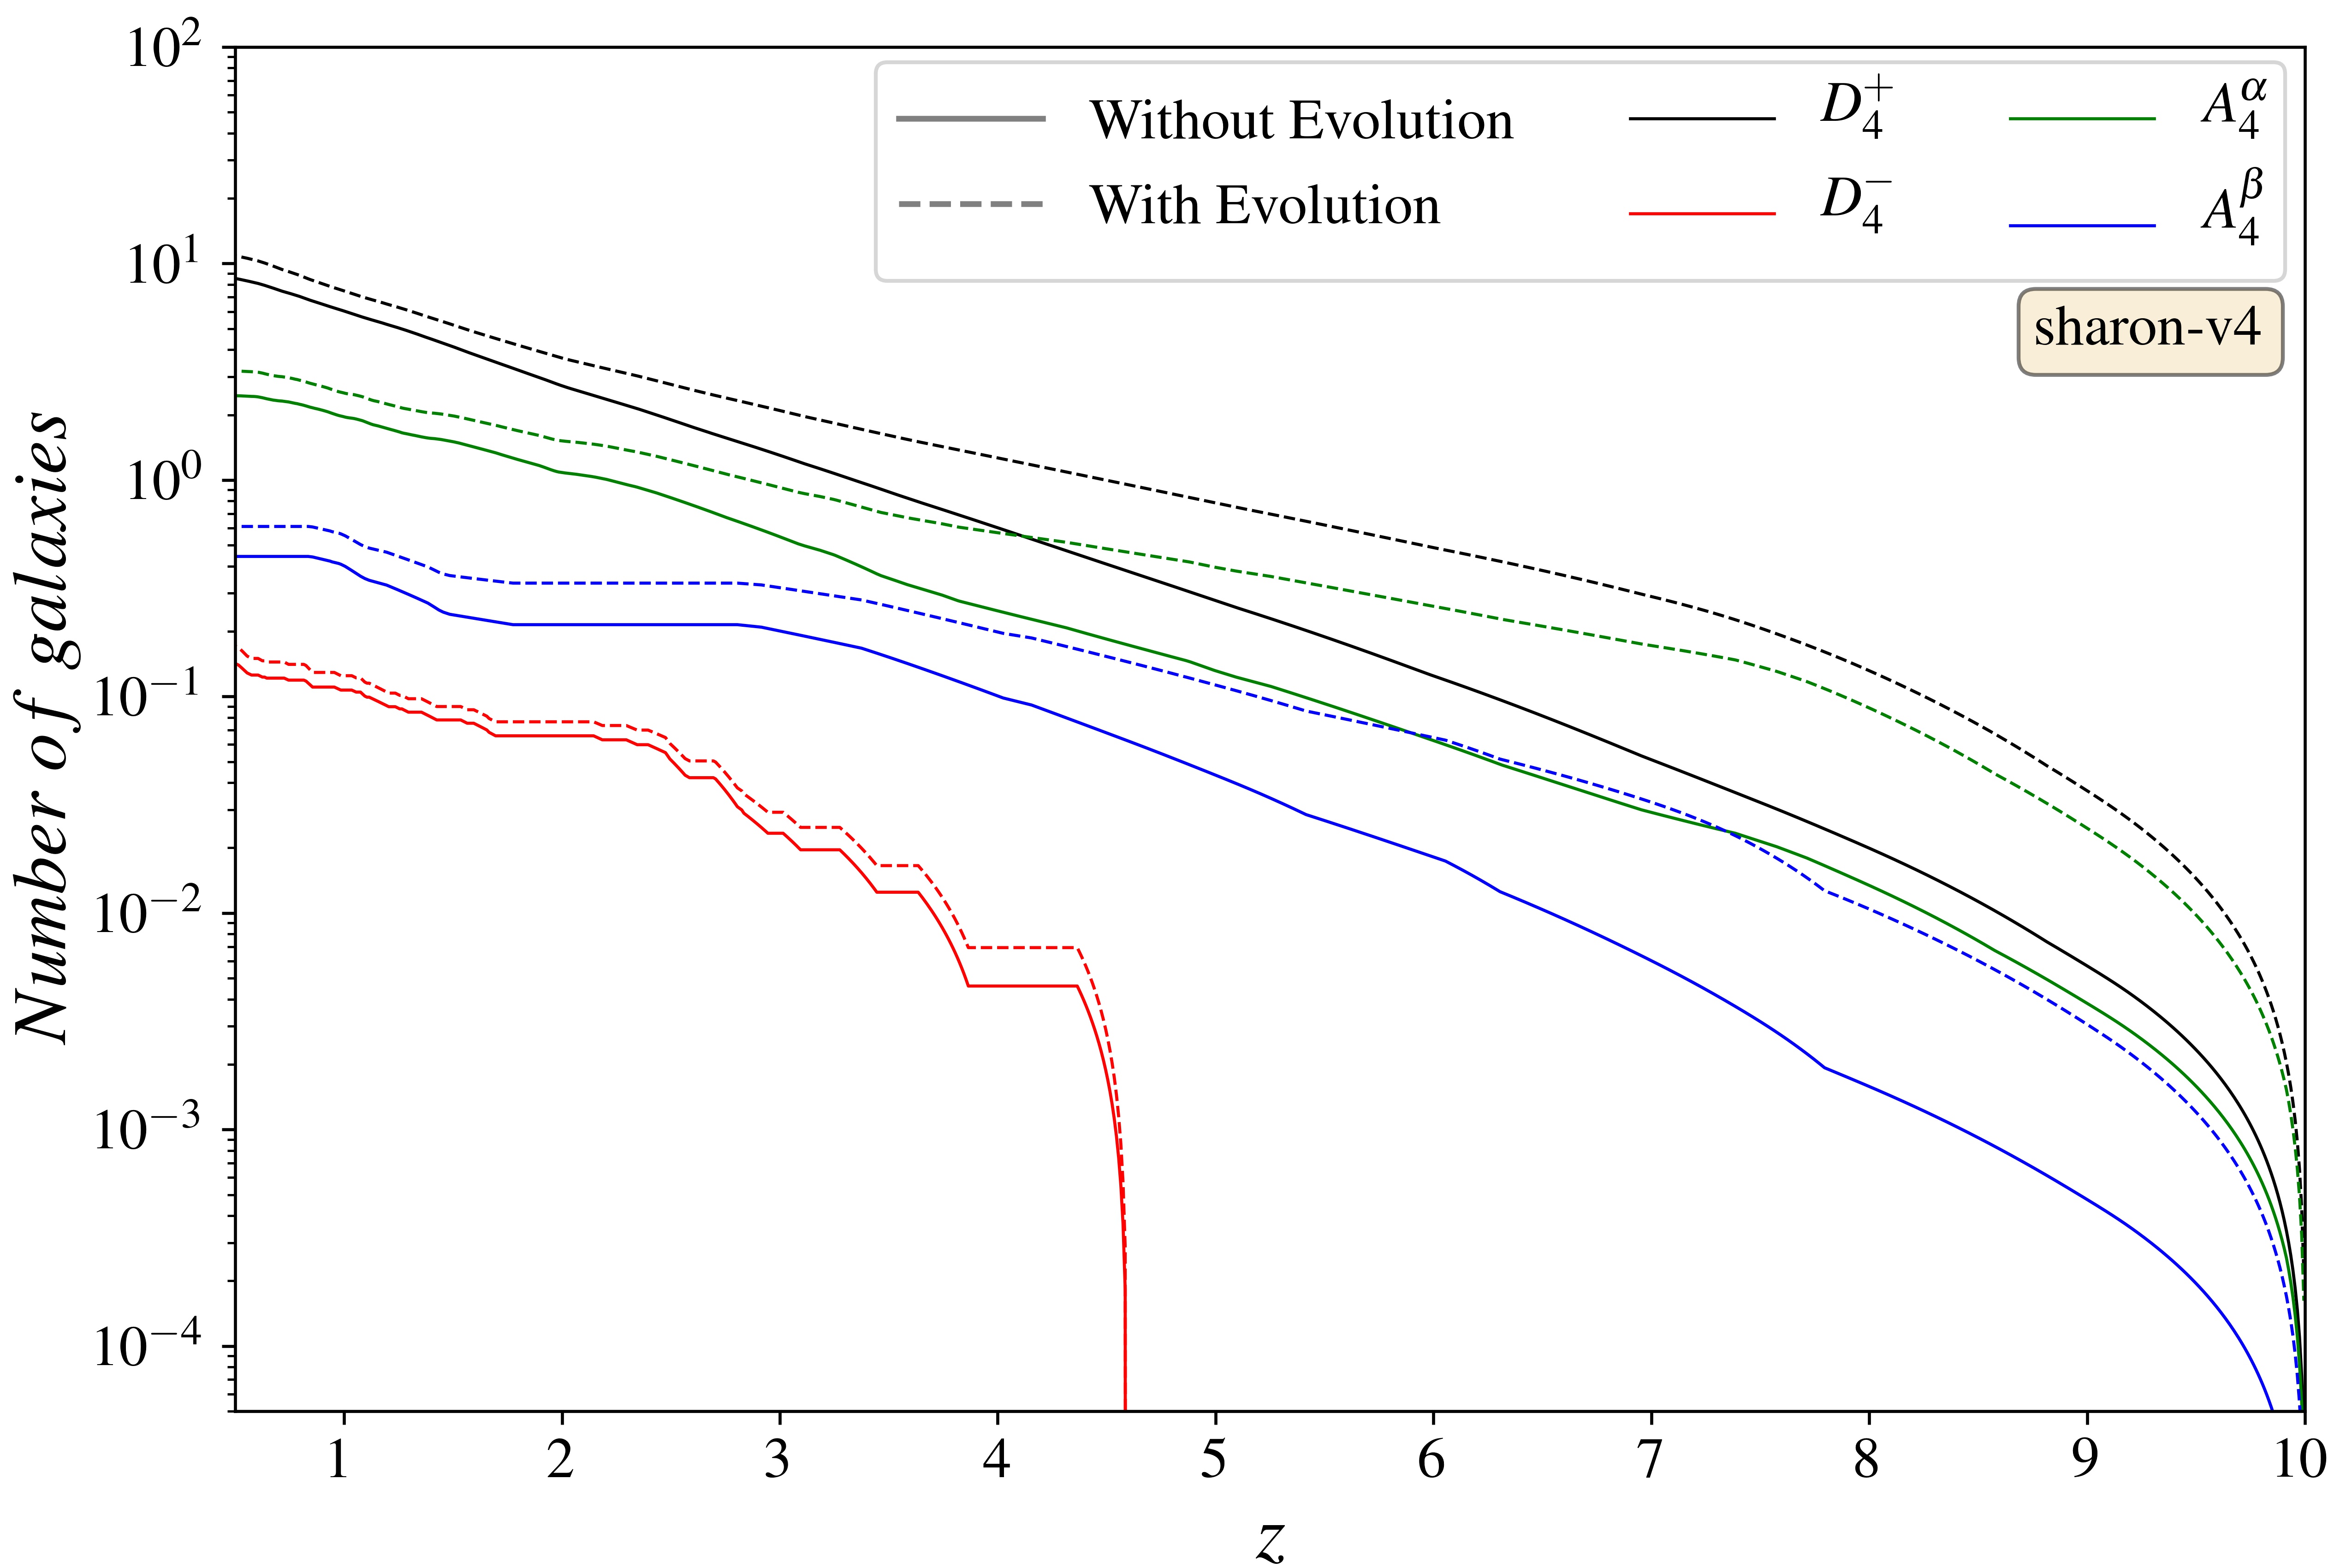
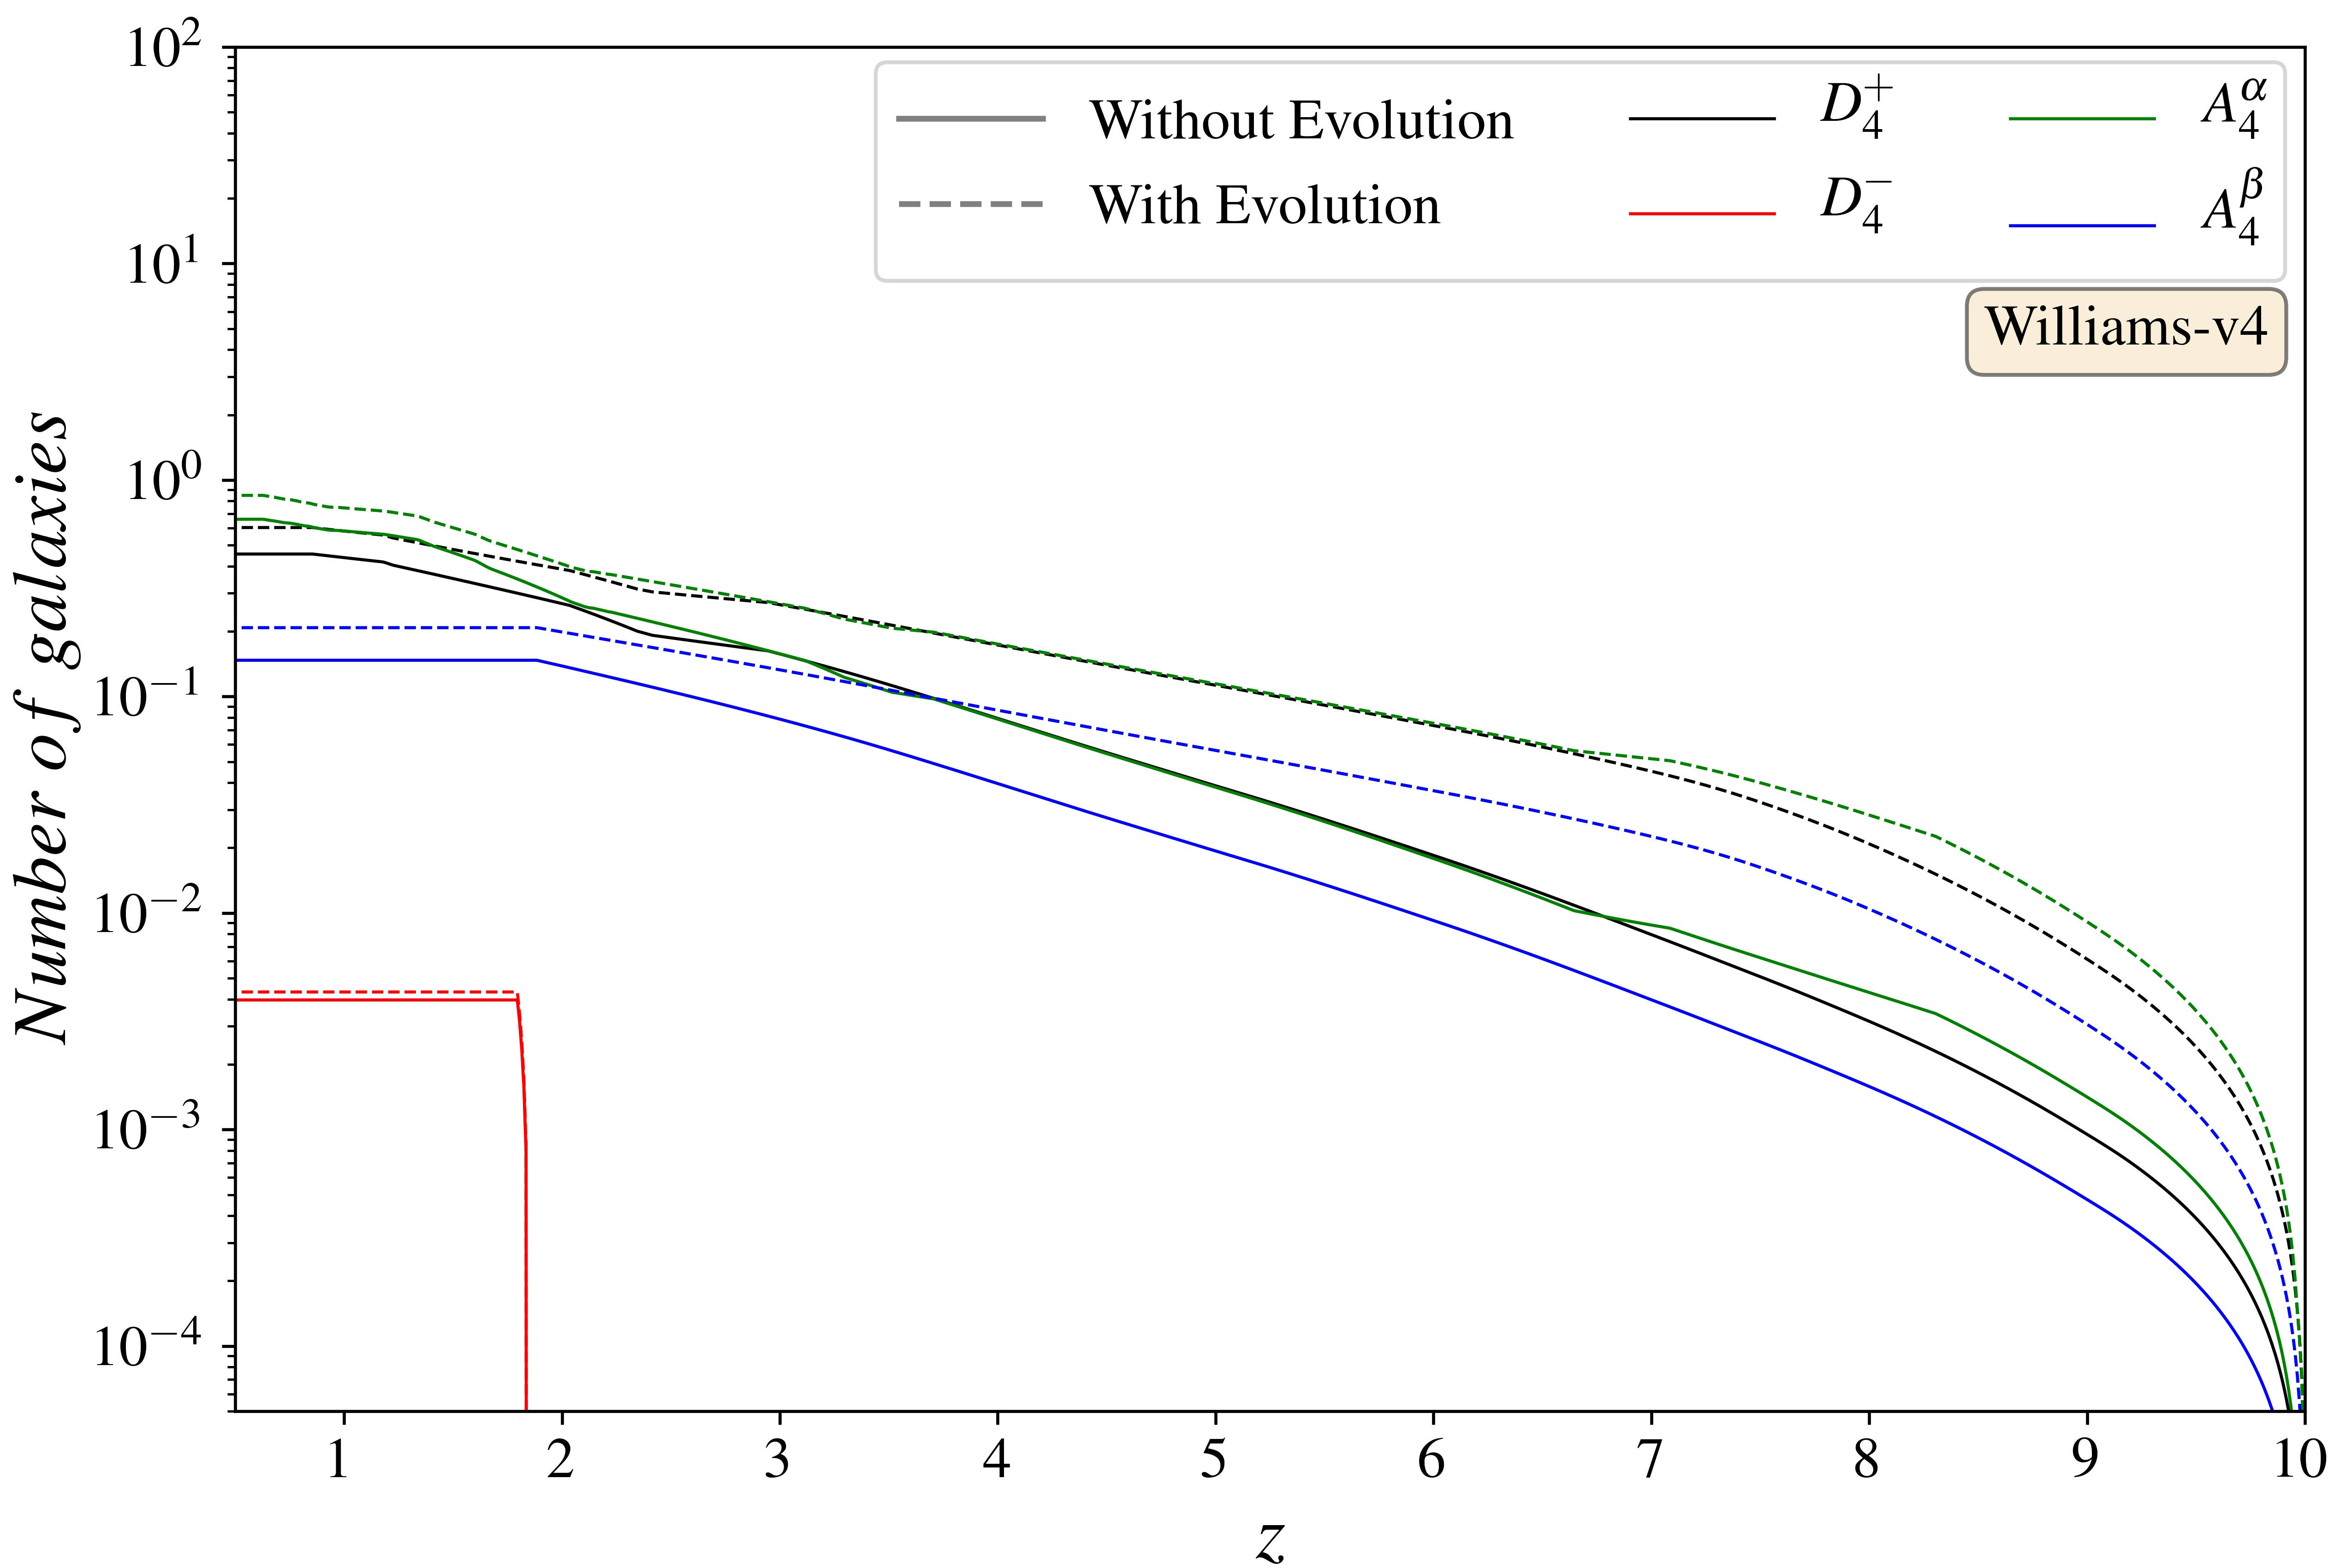
Figure 3, represents the cumulative distribution of the number of galaxies as a function of redshift which can provide us the characteristic image formation corresponding to different point singularities for A370: we have plotted the numbers expected at higher redshifts. Different panels in Figure 3 correspond to the singularity maps in Figure 1 for different mass models, respectively. The solid lines represent the galaxy numbers with the fiducial model, and the dashed lines correspond to a model with evolving feedback (please see C18 for further details). The black, red, green, and blue lines are cumulative source galaxy numbers that provide the characteristic image formations corresponding to the hyperbolic umbilic, elliptic umbilic, swallowtail for -line, and swallowtail for -line, respectively.
As one can see from Figure 3, the probability of finding a source galaxy at with characteristic image formation near hyperbolic umbilic or swallowtail for -line is an order of magnitude higher for the Keeton/Sharon group mass models compared to the Williams group mass model. This is due to the fact that the number of point singularities in the Keeton/Sharon group mass models is much higher than the Williams group mass models (please see Figure 1). On the other hand, the number of galaxies for the Zitrin group mass model lies somewhat in between the galaxy numbers for Keeton/Sharon and William models.
This difference in the number of observed galaxy sources near point singularities can also be seen in Figure 4. Figure 4 represents the composite cumulative distribution of the number of galaxies near point singularities for five of the HFF clusters we are using for the present study. The left, right, and bottom panels correspond to the Keeton, Sharon, and Williams group mass models, respectively. Here we did not calculate the galaxy numbers near point singularities for the Zitrin group mass models (zitrinnfw) as the corresponding singularity maps contain spurious point singularities. However, the singularity maps are available online (except for MACS1149 since the corresponding (zitrinnfw) mass model is not available). One can again see that the parametric mass reconstruction models give an order of magnitude more source galaxies with characteristic image formations at redshifts compared to the non-parametric mass reconstruction models. From the Keeton and the Sharon group mass models, one expects to observe at least one image formation near swallowtail in all the HFF clusters and (on average) one image formation near hyperbolic umbilic in every HFF cluster. On the other hand, from the Williams group mass models, one expects to observe at least one image formation near swallowtail and one image formation near hyperbolic umbilic in all of the HFF clusters. Given this pattern, singularity maps corresponding to the non-parametric mass models can be used to estimate the minimum number of expected characteristic image formation in the upcoming surveys.
Our current analysis is based only on the best-fit models provided by different groups. Each of these models also has uncertainties associated with them due to the finite number of constraints available (Lotz, et al., 2017; Priewe, et al., 2017). These uncertainties affect the caustic structure in the source plane, and as a result, will also affect the point singularity cross-section. However, we cannot estimate these uncertainties at present as we will need to construct the singularity map for each ensemble map to do that, and the corresponding potential or deflection maps are not available online (except for the Williams and Zitrin group). A detailed investigation of the effects of these uncertainties is subject to our future study and will be presented in a forthcoming publication.
4.4 Redshift Measurements
We have mentioned above that point singularities are critical only for certain source redshifts, and the corresponding characteristic image formation is only observable within a finite range for source redshift. This encourages us to ask the question: can these point singularities be used to constrain the source redshift as the corresponding characteristic image formation is only visible within a specific redshift range? In order to address this question, we consider the distance ratio intervals, for characteristic image formation near different kinds of point singularities. We find that point singularities constrain the source redshift more strongly at smaller source redshifts than higher source redshifts. For example, if a hyperbolic umbilic is critical at source redshift one for a lens at redshift 0.35, then the characteristic image formation is observable in the redshift range . If the hyperbolic umbilic is critical at redshift below one, then the redshift interval for the characteristic image formation further narrows down considerably. On the other hand, if the hyperbolic umbilic is critical at redshift five, then the image formation can be observed in the redshift range . The same argument can be also used for other point singularities. However, for other point singularities the redshift range is smaller than the redshift range for hyperbolic umbilic (please see subsection 4.3) and these can provide stronger constraints on source redshift than the hyperbolic umbilics, if observed. Hence, point singularities are more useful in constraining the source redshift at smaller redshifts. One can also understand such behavior from the fact that the caustic structure evolves more rapidly at smaller redshifts compared to higher redshifts. The elliptic umbilic can be useful at higher redshifts; however, the observational cross-section for the corresponding image formation is negligible (please see Figure 3 and 4). It is also important to keep the context of a known lens map for this discussion, if there are uncertainties in the lens map then it may be better to find out the source redshift to constrain the lens map.
5 Conclusion
We have constructed singularity maps corresponding to ten different galaxy clusters selected from the HFF and the RELICS survey. To construct singularity maps, we followed the algorithm developed and discussed in the paper I. Such a singularity map traces all the optimal sites for the upcoming deep surveys in the cluster lens plane as well as mark the locations of all the point singularities. Point singularities are very sensitive to the lens potential as these have a non-linear dependence on higher-order derivatives of the lens potential. Hence, these are also sensitive to the mass reconstruction methods as different methods use a different set of assumptions to construct mass models. We have constructed singularity maps corresponding to five of the HFF clusters (Table 1), considering mass models reconstructed using both parametric (Keeton, Sharon, and Zitrin groups) and non-parametric (Williams group) techniques. On the other hand, for five of the RELICS clusters, we only considered one mass model (provided by the Zitrin group) for each cluster lens. We find that the number of point singularities corresponding to parametric and non-parametric mass models is very different. The parametric models give a large number of point singularities compared to non-parametric models where only a handful of point singularities are present (Figure 1). This also affects the estimated number of galaxy sources with characteristic image formation as the parametric models yield an order of magnitude large number of such sources compared to non-parametric models (Figure 3 and 4). We suspect that the assumption of mass associated with each of the galaxies in the lensing cluster is the reason for this (Jullo, et al., 2007). As the number of point singularities corresponding to the non-parametric mass models is the least, one can use these models to compute the lower limit on the observation of characteristic image formation in the upcoming all-sky surveys. We find that the number of point singularities is significantly higher than estimates in earlier studies (Orban de Xivry & Marshall, 2009). Recently Meneghetti et al. (2020) pointed out an order of magnitude discrepancy in substructure lenses in the observed galaxy clusters (which are modeled using the parametric approach) and simulated galaxy clusters. While the discrepancy with LCDM is disputed (Bahé, 2021; Robertson, 2021), one can expect a significant difference in the number of point singularities that may arise as lens models are better constrained with more images.
The key takeaway from our analysis is that the predicted number of instances of point singularities in cluster lenses is likely to be much higher than estimated earlier (Orban de Xivry & Marshall, 2009). We expect to get at least one hyperbolic umbilic and one swallowtail image formation for a source at z > 1 for every five clusters with JWST. This estimation is based on the non-parametric mass models corresponding to the Williams group, and it can be considered as a lower limit since the number of point singularities is much higher in parametric models than non-parametric models.
We have not considered galaxy lenses in our analysis. Each galaxy scale lens has at least one pair of hyperbolic umbilics (as these are modeled as elliptical mass distributions with more details thrown in) and sometimes a few swallowtails (if a substructure also exists). Including the galaxy lenses will further increase the possibility of observing the image formations near point singularities.
Addition of substructure always adds more singular points, hence the numbers and distribution of singular points can be connected with the amount of substructure in clusters. Image formation near a point singularity consists of multiple images lying very close to each other in the lens plane: the characteristic image formation being different for each type of singularity. This opens up the possibility of measuring the relative time delay between these images. Such measurements are possible even if the multiple images are not well resolved (Borra, 2008). Along with the time delay analysis, one can also construct an atlas of realistic image configurations near point singularities for training and identification using machine learning programs in the upcoming surveys (Davies, Serjeant & Bromley, 2019). These possibilities are the subject of our future studies and the results will be presented in forthcoming publications.
6 Acknowledgements
AKM would like to thank Council of Scientific Industrial Research (CSIR) for financial support through research fellowship No. 524007. Authors are very grateful to Liliya Williams for providing the mass models for HFF clusters and their help. Authors thank Adi Zitrin for answering queries related to mass models provided by their group. Authors thank Prasenjit Saha for their useful comments on the manuscript. Authors thank the anonymous referee for useful comments. We acknowledge the HPC@IISERM, used for some of the computations presented here. This research has made use of NASA’s Astrophysics Data System Bibliographic Services. This work utilizes gravitational lensing models produced by PIs Bradac, Natarajan Kneib (CATS), Merten Zitrin, Sharon, Williams, Keeton, Bernstein and Diego, and the GLAFIC group. This lens modeling was partially funded by the HST Frontier Fields program conducted by STScI. STScI is operated by the Association of Universities for Research in Astronomy, Inc. under NASA contract NAS 5-26555. The lens models were obtained from the Mikulski Archive for Space Telescopes (MAST). This work is based on observations taken by the RELICS Treasury Program (GO 14096) with the NASA/ESA HST, which is operated by the Association of Universities for Research in Astronomy, Inc., under NASA contract NAS5-26555.
7 Data Availability
The clusters mass models used in this article are available at the official site of Hubble Frontier Fields (HFF) survey 444https://archive.stsci.edu/prepds/frontier/ and Reionization Lensing Cluster Survey (RELICS) 555https://archive.stsci.edu/prepds/relics/. The high resolution mass models for the Williams group is available on request from the modelers.
References
- Abdelsalam, Saha & Williams (1998) Abdelsalam H. M., Saha P., Williams L. L. R., 1998, MNRAS, 294, 734
- Acebron et al. (2018) Acebron A., Cibirka N., Zitrin A., Coe D., Agulli I., Sharon K., Bradač M., et al., 2018, ApJ, 858, 42.
- Acebron et al. (2019) Acebron A., Alon M., Zitrin A., Mahler G., Coe D., Sharon K., Cibirka N., et al., 2019, ApJ, 874, 132.
- Acebron et al. (2020) Acebron A., Zitrin A., Coe D., Mahler G., Sharon K., Oguri M., Bradač M., et al., 2020, ApJ, 898, 6.
- Akeson, et al. (2019) Akeson R., et al., 2019, arXiv, arXiv:1902.05569
- Atek, et al. (2018) Atek H., Richard J., Kneib J.-P., Schaerer D., 2018, MNRAS, 479, 5184
- Bagla (2001) Bagla J. S., 2001, ASPC, 237, 77
- Bahé (2021) Bahé Y. M., 2021, arXiv, arXiv:2101.12112
- Bartelmann, et al. (1998) Bartelmann M., Huss A., Colberg J. M., Jenkins A., Pearce F. R., 1998, AA, 330, 1
- Blandford & Narayan (1992) Blandford R. D., Narayan R., 1992, ARAA, 30, 311
- Bergamini, et al. (2019) Bergamini P., et al., 2019, AA, 631, A130
- Boldrin, et al. (2016) Boldrin M., Giocoli C., Meneghetti M., Moscardini L., Tormen G., Biviano A., 2016, MNRAS, 457, 2738
- Borra (2008) Borra E. F., 2008, MNRAS, 389, 364
- Bowler, et al. (2020) Bowler R. A. A., et al., 2020, MNRAS, 493, 2059
- Bradley, et al. (2008) Bradley L. D., et al., 2008, ApJ, 678, 647
- Broadhurst, et al. (2005) Broadhurst T., et al., 2005, ApJ, 621, 53
- Caminha, et al. (2017) Caminha G. B., et al., 2017, AA, 600, A90
- Cerny et al. (2018) Cerny C., Sharon K., Andrade-Santos F., Avila R. J., Bradač M., Bradley L. D., Carrasco D., et al., 2018, ApJ, 859, 159.
- Chae (2003) Chae K.-H., 2003, MNRAS, 346, 746
- Cibirka et al. (2018) Cibirka N., Acebron A., Zitrin A., Coe D., Agulli I., Andrade-Santos F., Bradač M., et al., 2018, ApJ, 863, 145.
- Cirasuolo, et al. (2007) Cirasuolo M., et al., 2007, MNRAS, 380, 585
- Cirasuolo, et al. (2010) Cirasuolo M., McLure R. J., Dunlop J. S., Almaini O., Foucaud S., Simpson C., 2010, MNRAS, 401, 1166
- Cowley, et al. (2018) Cowley W. I., Baugh C. M., Cole S., Frenk C. S., Lacey C. G., 2018, MNRAS, 474, 2352
- Coe, et al. (2008) Coe D., Fuselier E., Benítez N., Broadhurst T., Frye B., Ford H., 2008, ApJ, 681, 814
- Coe, et al. (2013) Coe D., et al., 2013, ApJ, 762, 32
- Coe, et al. (2019) Coe D., et al., 2019, ApJ, 884, 85
- Davies, Serjeant & Bromley (2019) Davies A., Serjeant S., Bromley J. M., 2019, MNRAS, 487, 5263
- Diego, et al. (2005) Diego J. M., Protopapas P., Sandvik H. B., Tegmark M., 2005, MNRAS, 360, 477
- Diego (2019) Diego J. M., 2019, AA, 625, A84
- Gardner, et al. (2006) Gardner J. P., et al., 2006, SSRv, 123, 485
- Grillo, et al. (2015) Grillo C., et al., 2015, ApJ, 800, 38
- Hoag, et al. (2016) Hoag A., et al., 2016, ApJ, 831, 182
- Ishigaki et al. (2015) Ishigaki M., Kawamata R., Ouchi M., Oguri M., Shimasaku K., Ono Y., 2015, ApJ, 799, 12.
- Ivezić, et al. (2019) Ivezić Ž., et al., 2019, ApJ, 873, 111
- Jauzac, et al. (2014) Jauzac M., et al., 2014, MNRAS, 443, 1549
- Johnson, et al. (2014) Johnson T. L., Sharon K., Bayliss M. B., Gladders M. D., Coe D., Ebeling H., 2014, ApJ, 797, 48
- Jullo, et al. (2007) Jullo E., Kneib J.-P., Limousin M., Elíasdóttir Á., Marshall P. J., Verdugo T., 2007, NJPh, 9, 447
- Jullo, et al. (2010) Jullo E., Natarajan P., Kneib J.-P., D’Aloisio A., Limousin M., Richard J., Schimd C., 2010, Sci, 329, 924
- Kawamata, et al. (2018) Kawamata R., Ishigaki M., Shimasaku K., Oguri M., Ouchi M., Tanigawa S., 2018, ApJ, 855, 4
- Kelly, et al. (2018) Kelly P. L., et al., 2018, NatAs, 2, 334
- Liesenborgs, et al. (2007) Liesenborgs J., de Rijcke S., Dejonghe H., Bekaert P., 2007, MNRAS, 380, 1729
- Kneib & Natarajan (2011) Kneib J.-P., Natarajan P., 2011, AARv, 19, 47
- Lotz, et al. (2017) Lotz J. M., et al., 2017, ApJ, 837, 97
- Laureijs (2009) Laureijs R., 2009, arXiv, arXiv:0912.0914
- Limousin, et al. (2008) Limousin M., et al., 2008, AA, 489, 23
- Mahler et al. (2019) Mahler G., Sharon K., Fox C., Coe D., Jauzac M., Strait V., Edge A., et al., 2019, ApJ, 873, 96.
- McCully, et al. (2014) McCully C., Keeton C. R., Wong K. C., Zabludoff A. I., 2014, MNRAS, 443, 3631
- Meena & Bagla (2020) Meena A. K., Bagla J. S., 2020, MNRAS, 492, 3294
- Meneghetti, et al. (2013) Meneghetti M., Bartelmann M., Dahle H., Limousin M., 2013, SSRv, 177, 31
- Meneghetti, et al. (2017) Meneghetti M., et al., 2017, MNRAS, 472, 3177
- Meneghetti et al. (2020) Meneghetti M., Davoli G., Bergamini P., Rosati P., Natarajan P., Giocoli C., Caminha G. B., et al., 2020, arXiv, arXiv:2009.04471
- Merten, et al. (2011) Merten J., et al., 2011, MNRAS, 417, 333
- Mortlock, et al. (2017) Mortlock A., et al., 2017, MNRAS, 465, 672
- Moutard, et al. (2020) Moutard T., et al., 2020, MNRAS.tmp,
- Muñoz, et al. (1998) Muñoz J. A., et al., 1998, ApSS, 263, 51
- Okabe et al. (2020) Okabe T., Oguri M., Peirani S., Suto Y., Dubois Y., Pichon C., Kitayama T., et al., 2020, MNRAS, 496, 2591.
- Ono, et al. (2018) Ono Y., et al., 2018, PASJ, 70, S10
- Orban de Xivry & Marshall (2009) Orban de Xivry G., Marshall P., 2009, MNRAS, 399, 2
- Paterno-Mahler et al. (2018) Paterno-Mahler R., Sharon K., Coe D., Mahler G., Cerny C., Johnson T. L., Schrabback T., et al., 2018, ApJ, 863, 154.
- Priewe, et al. (2017) Priewe J., Williams L. L. R., Liesenborgs J., Coe D., Rodney S. A., 2017, MNRAS, 465, 1030
- Postman, et al. (2012) Postman M., et al., 2012, ApJS, 199, 25
- Puchwein, et al. (2005) Puchwein E., Bartelmann M., Dolag K., Meneghetti M., 2005, AA, 442, 405
- Robertson (2021) Robertson A., 2021, arXiv, arXiv:2101.12067
- Schechter (1976) Schechter P., 1976, ApJ, 203, 297
- Schneider et. al. (1992) Schneider P., Ehlers J., Falco E. E., 1992, Gravitational Lenses. Springer- Verlag, Berlin.
- Soucail, et al. (1988) Soucail G., Mellier Y., Fort B., Mathez G., Cailloux M., 1988, AA, 191, L19
- Suyu & Halkola (2010) Suyu S. H., Halkola A., 2010, AA, 524, A94
- Watson, et al. (2015) Watson D., Christensen L., Knudsen K. K., Richard J., Gallazzi A., Michałowski M. J., 2015, Natur, 519, 327
- Williams, et al. (2018) Williams C. C., et al., 2018, ApJS, 236, 33
- Yung, et al. (2019) Yung L. Y. A., Somerville R. S., Finkelstein S. L., Popping G., Davé R., 2019, MNRAS, 483, 2983
- Zitrin, et al. (2009) Zitrin A., et al., 2009, MNRAS, 396, 1985
- Zitrin, et al. (2013) Zitrin A., et al., 2013, ApJL, 762, L30