Cosmological constraints from higher-redshift gamma-ray burst, H ii starburst galaxy, and quasar (and other) data
Abstract
We use higher-redshift gamma-ray burst (GRB), H ii starburst galaxy (H iiG), and quasar angular size (QSO-AS) measurements to constrain six spatially flat and non-flat cosmological models. These three sets of cosmological constraints are mutually consistent. Cosmological constraints from a joint analysis of these data sets are largely consistent with currently-accelerating cosmological expansion as well as with cosmological constraints derived from a combined analysis of Hubble parameter () and baryon acoustic oscillation (BAO, with Planck-determined baryonic matter density) measurements. A joint analysis of the + BAO + QSO-AS + H iiG + GRB data provides fairly model-independent determinations of the non-relativistic matter density parameter and the Hubble constant . These data are consistent with the dark energy being a cosmological constant and with spatial hypersurfaces being flat, but they do not rule out mild dark energy dynamics or a little spatial curvature. We also investigate the effect of including quasar flux measurements in the mix and find no novel conclusions.
keywords:
cosmological parameters – dark energy – cosmology: observations1 Introduction
There is a large body of evidence indicating that the Universe recently transitioned from a decelerated to an accelerated phase of expansion (at redshift ; see e.g. Farooq et al., 2017) and has been undergoing accelerated expansion ever since (for reviews, see e.g. Ratra & Vogeley, 2008; Martin, 2012; Coley & Ellis, 2020). In the standard model of cosmology, called the CDM model (Peebles, 1984), the accelerated expansion is powered by a constant dark energy density (the cosmological constant, ). This model also assumes that spatial hypersurfaces are flat on cosmological scales, and that the majority of non-relativistic matter in the Universe consists of cold dark matter (CDM).
Out of all the models that have been devised to explain the observed accelerated expansion of the Universe, the CDM model is currently the most highly favored in terms of both observational data and theoretical parsimony (see e.g. Farooq et al., 2017; Scolnic et al., 2018; Planck Collaboration, 2020; eBOSS Collaboration, 2020). In spite of these virtues, however, there are some indications that the CDM model may not tell the whole story. On the observational side, some workers have found evidence of discrepancies between the CDM model and cosmological observations (Riess, 2019; Martinelli & Tutusaus, 2019) and on the theoretical side, the origin of has yet to be explained in fundamental terms (e.g., Martin, 2012). One way to pin down the nature of dark energy is by studying its dynamics phenomenologically. It is possible that the dark energy density may evolve in time (Peebles & Ratra, 1988), and many dark energy models exhibiting this behavior have been proposed.
Cosmological models have largely been tested in the redshift range , with baryon acoustic oscillation (BAO111In our BAO data analyses in this paper the sound horizon computation assumes a value for the current baryonic matter physical density parameter , appropriate for the model under study, computed from Planck CMB anisotropy data.) measurements probing the upper end of this range, and at , using cosmic microwave background (CMB) anisotropy data. To determine the accuracy of our cosmological models, we also need to test them in the redshift range . Quasar angular size (QSO-AS), H ii starburst galaxy (H iiG), quasar X-ray and UV flux (QSO-Flux), and gamma-ray burst (GRB) measurements are some of the handful of data available in this range. The main goal of this paper is, therefore, to examine the effect that QSO-AS, H iiG, and GRB data have on cosmological model parameter constraints, in combination with each other, and in combination with more well-known probes.222We relegate the analysis of QSO-Flux data to an appendix, the reasons for which are discussed there.
Gamma-ray bursts are promising cosmological probes for two reasons. First, it is believed that they can be used as standardizable candles (Lamb & Reichart, 2000, 2001; Amati et al., 2002; Amati et al., 2008; Amati et al., 2009; Ghirlanda et al., 2004; Demianski & Piedipalumbo, 2011; Wang et al., 2015). Second, they cover a redshift range that is wider than most other commonly-used cosmological probes, having been observed up to (Amati et al., 2008; Amati et al., 2009; Amati et al., 2019; Samushia & Ratra, 2010; Demianski & Piedipalumbo, 2011; Wang et al., 2016; Demianski et al., 2017, 2019; Fana Dirirsa et al., 2019; Khadka & Ratra, 2020c). In particular, the –8.2 part of the Universe is primarily accessed by GRBs,333Though QSO-Flux measurements can reach up to . so if GRBs can be standardized, they could provide useful information about a large, mostly unexplored, part of the Universe.
QSO-AS data currently reach to . These data, consisting of measurements of the angular size of astrophysical radio sources, furnish a standard ruler that is independent of that provided by the BAO sound horizon scale. The intrinsic linear size of intermediate luminosity QSOs has recently been accurately determined by Cao et al. (2017), opening the way for QSOs to, like GRBs, test cosmological models in a little-explored region of redshift space.444The use of QSO-AS measurements to constrain cosmological models dates back to near the turn of the century (e.g. Gurvits et al., 1999; Vishwakarma, 2001; Lima & Alcaniz, 2002; Zhu & Fujimoto, 2002; Chen & Ratra, 2003), but, as discussed in Ryan et al. (2019), these earlier results are suspect, because they are based on an inaccurate determination of .
H iiG data reach to , just beyond the range of current BAO data. Measurements of the luminosities of the Balmer lines in H ii galaxies can be correlated with the velocity dispersion of the radiating gas, making H ii galaxies a standard candle that can complement both GRBs and lower-redshift standard candles like supernovae (Siegel et al., 2005; Plionis et al., 2009; Mania & Ratra, 2012; Chávez et al., 2014; González-Morán et al., 2019).
Current QSO-Flux measurements reach to , but they favor a higher value of the current (denoted by the subscript “0”) non-relativistic matter density parameter () than what is currently thought to be reasonable. The values obtained using QSO-Flux data, in a number of cosmological models, are in nearly 2 tension with the values obtained by using other well-established cosmological probes like CMB, BAO, and Type Ia supernovae (Risaliti & Lusso, 2019; Yang et al., 2019; Wei & Melia, 2020; Khadka & Ratra, 2020b). Techniques for standardizing QSO-Flux measurements are still under development, so it might be too early to draw strong conclusions about the cosmological constraints obtained from QSO-Flux measurements. Therefore, in this paper, we use QSO-Flux data alone and in combination with other data to constrain cosmological parameters in four different models, and record these results in Appendix A.
We find that the GRB, H iiG, and QSO-AS constraints are largely mutually consistent, and that their joint constraints are consistent with those from more widely used, and more restrictive, BAO and Hubble parameter () data. When used jointly with the + BAO data, these higher- data tighten the + BAO constraints.
This paper is organized as follows. In Section 2 we introduce the data we use. Section 3 describes the models we analyze, with a description of our analysis method in Section 4. Our results are in Section 5, and we provide our conclusions in Section 6. Additionally, we discuss our results for QSO-Flux measurements in Appendix A.
2 Data
We use QSO-AS, H iiG, QSO-Flux, and GRB data to obtain constraints on the cosmological models we study. The QSO-AS data, comprising 120 measurements compiled by Cao et al. (2017) (listed in Table 1 of that paper) and spanning the redshift range , are also used in Ryan et al. (2019); see these papers for descriptions. The H iiG data, comprising 107 low redshift () H iiG measurements, used in Chávez et al. (2014) (recalibrated by González-Morán et al., 2019), and 46 high redshift () H iiG measurements, used in González-Morán et al. (2019), are also used in Cao et al. (2020). The GRB data, spanning the redshift range , are collected from Fana Dirirsa et al. (2019) (25 from Table 2 of that paper (F10), and the remaining 94 from Table 5 of the same, which are a subset of those compiled by Wang et al., 2016) and also used in Khadka & Ratra (2020c). We also add 1598 QSO-Flux measurements spanning the redshift range , from Risaliti & Lusso (2019). These data are used in Khadka & Ratra (2020b); see that paper for details. Results related to these QSO-Flux data are discussed in Appendix A.
In order to be useful as cosmological probes, GRBs need to be standardized, and many phenomenological relations have been proposed for this purpose (Amati et al., 2002, Ghirlanda et al., 2004, Liang & Zhang, 2005, Muccino, 2020, and references therein). As in Khadka & Ratra (2020c), we use the Amati relation (Amati et al., 2002), which is an observed correlation between the peak photon energy and the isotropic-equivalent radiated energy of long-duration GRBs, to standardize GRB measurements. There have been many attempts to standardize GRBs using the Amati relation. Some analyses assume a fixed value of to calibrate the Amati relation, so they favor a relatively reasonable value of . Others use supernovae data to calibrate the Amati relation, while some use data to calibrate it. This means that most previous GRB analyses are affected by some non-GRB external factors. In some cases this leads to a circularity problem, in which the models to be constrained by using the Amati relation are also used to calibrate the Amati relation itself (Liu & Wei, 2015; Demianski et al., 2017, 2019; Fana Dirirsa et al., 2019). In other cases, the data used in the calibration process dominate the analysis results. To overcome these problems, we fit the parameters of the Amati relation simultaneously with the parameters of the cosmological models we study (as done in Khadka & Ratra, 2020c; also see Wang et al., 2016).
The isotropic radiated energy of a source in its rest frame at a luminosity distance is
| (1) |
where is the bolometric fluence, and (defined below) depends on and on the parameters of our cosmological models. is connected to the source’s peak energy output via the Amati relation (Amati et al., 2008; Amati et al., 2009)
| (2) |
where and are free parameters that we vary in our model fits.555 is implied hereinafter. Note here that the peak energy where is the observed peak energy.
The correlation between H iiG luminosity () and velocity dispersion () is:
| (3) |
where is the slope and is the intercept. As in Cao et al. (2020) (see that paper for details), we use the values
| (4) |
and
| (5) |
One can test a cosmological model with parameters p by using it to compute a theoretical distance modulus
| (6) |
and comparing this prediction to the distance modulus computed from observational H iiG luminosity and flux () data
| (7) |
QSO-AS data can be used to test cosmological models by comparing the theoretical angular size of the QSO
| (8) |
with its observed angular size . In equation (8), is the characteristic linear size of the QSO,666For the data sample we use, this quantity is equal to pc; see Cao et al. (2017). and (defined below) is its angular size distance.
Underestimated systematic uncertainties for both H iiG and QSO-AS data might be responsible for the large reduced (described in Sec. 5.4).
The transverse comoving distance is related to the luminosity distance and the angular size distance through , and is a function of and the parameters p:
|
|
(9) |
In the preceding equation,
| (10) |
is the Hubble constant, is the current value of the spatial curvature energy density parameter, and is the speed of light (Hogg, 1999).
We also use and BAO measurements to constrain cosmological parameters. The data, 31 measurements spanning the redshift range , are compiled in Table 2 of Ryan et al. (2018). The BAO data, 11 measurements spanning the redshift range , are listed in Table 1 of Cao et al. (2020).
Systematic errors that affect measurements include assumptions about the stellar metallicity of the galaxies in which cosmic chronometers are found, progenitor bias, the presence of a population of young stars in these galaxies, and assumptions about stellar population synthesis models. These effects were studied in Moresco et al. (2012, 2016); Moresco et al. (2018, 2020). Moresco et al. (2020) found that the dominant contribution to the systematic error budget comes from the choice of stellar population synthesis model, which introduces an average systematic error of % (though the authors say that this can be reduced to % by removing an outlier model from the analysis). The impacts of a population of young stars and of the progenitor bias were found to be negligible in Moresco et al. (2018); Moresco et al. (2012), and Moresco et al. (2020) found that the impact of a 5–10% uncertainty in the metallicity estimates produces a 4–9% systematic error in the measurements.
The systematic uncertainties of BAO from Alam et al. (2017) (described in Sec. 7) are included in their covariance matrix. The BAO data from Carter et al. (2018) is the combined result of the 6dF Galaxy Survey1 (6dFGS) and the SDSS DR7 MGS, where the systematic effects are described in detail in Jones et al. (2009) and Ross et al. (2015) (negligible), respectively. As described in DES Collaboration (2019b), the BAO systematic uncertainty is 15% of their statistical uncertainty and thus negligible. The same negligible systematic effect applies to the BAO measurement from Ata et al. (2018). de Sainte Agathe et al. (2019) added polynomial terms to the correlation function, so as to test the sensitivity of the slowly-varying part of the correlation function to systematic effects. They found that this shifted the BAO peak position by less than relative to its position in their fiducial model.
3 Cosmological models
In this paper we consider three pairs of flat and non-flat cosmological models, with non-dynamical and dynamical dark energy density.777Observational constraints on non-flat models are discussed in Farooq et al. (2015), Chen et al. (2016), Yu & Wang (2016), Rana et al. (2017), Ooba et al. (2018a, b, c), Yu et al. (2018), Park & Ratra (2018, 2019a, 2019b, 2019c, 2020), Wei (2018), DES Collaboration (2019a), Coley (2019), Jesus et al. (2020), Handley (2019), Zhai et al. (2020), Li et al. (2020), Geng et al. (2020), Kumar et al. (2020), Efstathiou & Gratton (2020), Di Valentino et al. (2020), Gao et al. (2020), Yang & Gong (2020), Agudelo Ruiz et al. (2020), Velásquez-Toribio & Fabris (2020), and references therein. Since the data we use are at low redshift, we neglect the contribution that radiation makes to the cosmological energy budget.
In the CDM model the Hubble parameter is
| (11) |
where , , and the cosmological constant dark energy density parameter are the parameters to be constrained, and obeys . When (flat CDM), we only constrain and , as the value of is fixed by .
The XCDM parametrization is an extension of the CDM model in which the dark energy equation of state parameter, , is allowed to take values different from , where and are the pressure and energy density, respectively, of the dark energy, treated in this case as an ideal, spatially homogeneous X-fluid.888Unlike the CDM and CDM models, the XCDM parametrization is physically incomplete because it cannot sensibly describe the evolution of spatial inhomogeneities. The XCDM parametrization can be made sensible by allowing for an additional free parameter and requiring . In the XCDM parametrization the Hubble parameter takes the form
|
|
(12) |
where is the current value of the X-fluid energy density parameter (its constraints are not reported in this paper) subject to . When XCDM reduces to CDM. In the general, non-flat case, the model parameters to be constrained are , , , and . When (flat XCDM), we only constrain , , and , as the value of is fixed by .
In the CDM model, a dynamical scalar field , whose stress-energy tensor acts like that of a time-variable , characterizes the dark energy, and has a potential energy density
| (13) |
Here is the Planck mass, , and
| (14) |
(Peebles & Ratra, 1988; Ratra & Peebles, 1988; Pavlov et al., 2013).999Observational constraints on the CDM model are discussed in, e.g., Chen & Ratra (2004), Samushia et al. (2007), Yashar et al. (2009), Samushia et al. (2010), Chen & Ratra (2011b), Campanelli et al. (2012), Farooq & Ratra (2013), Farooq et al. (2013), Avsajanishvili et al. (2015), Solà et al. (2017), Zhai et al. (2017), Sangwan et al. (2018), Solà Peracaula et al. (2018, 2019), Ooba et al. (2019), Singh et al. (2019), Ryan et al. (2019), Khadka & Ratra (2020a),Ureña-López & Roy (2020). For the CDM models reduce to the CDM models.
In this paper we make the approximation, valid for our purposes, that the scalar field is spatially homogeneous. When is approximated in this way, two coupled non-linear ordinary differential equations control its dynamics. The first is its equation of motion
| (15) |
and the second is the Friedmann equation
| (16) |
where is the scale factor and an overdot denotes a time derivative. In equation (16), is the spatial curvature term (with , , corresponding to , , , respectively), and and are the non-relativistic matter and scalar field energy densities, respectively, where
| (17) |
It follows that the Hubble parameter in CDM is
| (18) |
where the scalar field energy density parameter
| (19) |
In the general, non-flat case, the parameters to be constrained are , , , and . In the special case that (flat CDM), we only constrain , , and .
4 Data Analysis Methodology
By using the python module emcee (Foreman-Mackey et al., 2013), we perform a Markov chain Monte Carlo (MCMC) analysis to maximize the likelihood function, , and thereby determine the best-fitting values of the free parameters. The flat cosmological parameter priors are the same as those used in Cao et al. (2020) and the flat priors of the parameters of the Amati relation are non-zero over (described below), , and .
The likelihood functions associated with , BAO, H iiG, and QSO-AS data are described in Cao et al. (2020). For GRB data, the natural log of its likelihood function (D’Agostini, 2005) is
| (20) |
where
| (21) |
, , , and is the extrinsic scatter parameter, which contains the unknown systematic uncertainty. For the GRB with uncertainty in ,
| (22) |
and for those without uncertainties (the non-zero has a negligible effect on our results).
The Akaike Information Criterion () and the Bayesian Information Criterion () are used to compare the goodness of fit of models with different numbers of parameters, where
| (23) |
and
| (24) |
In these equations, is the maximum value of the relevant likelihood function, is the number of free parameters of the model under consideration, and is the number of data points (e.g., for GRB ).
5 Results
5.1 H iiG, QSO-AS, and GRB constraints, individually
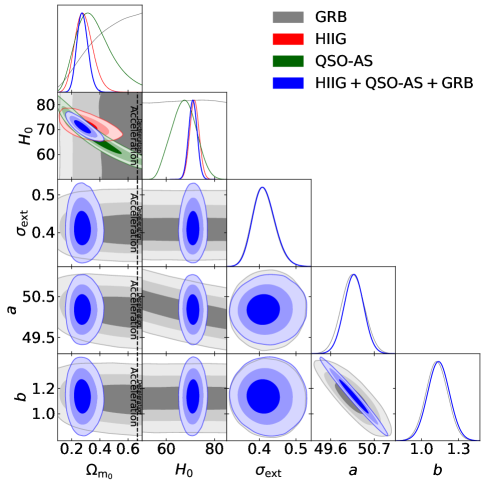
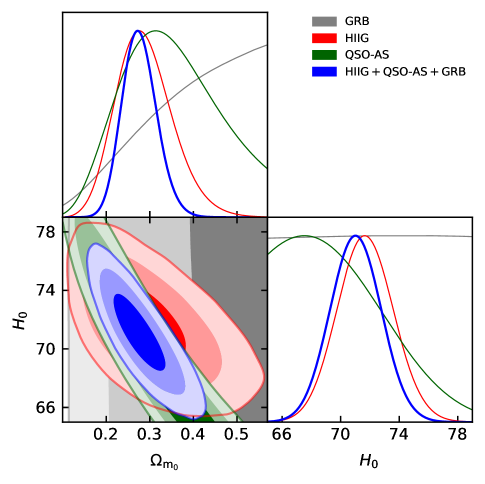
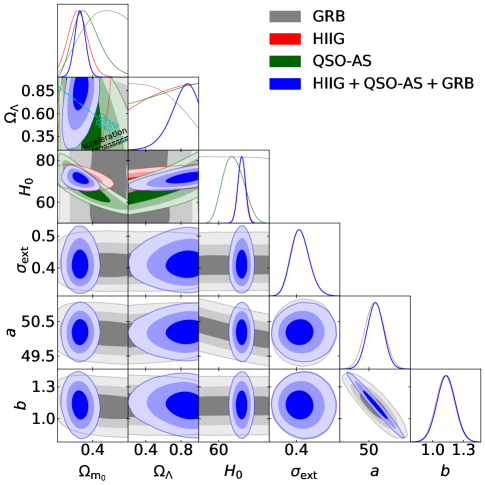
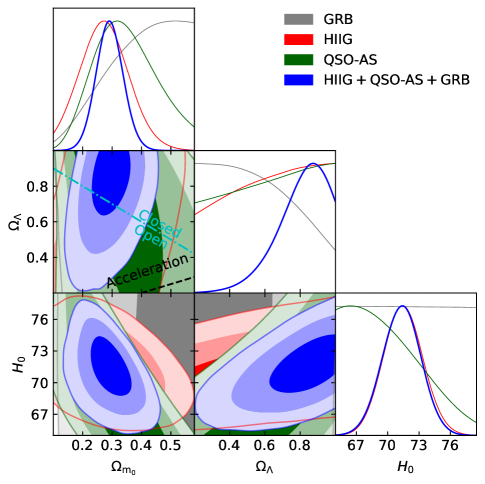
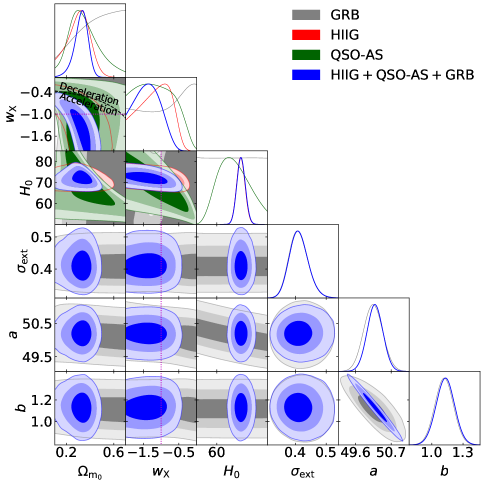
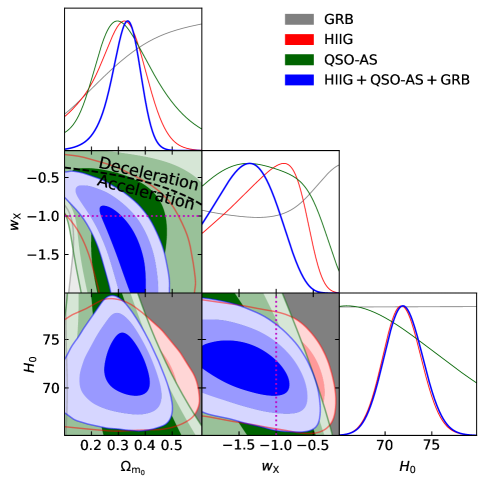
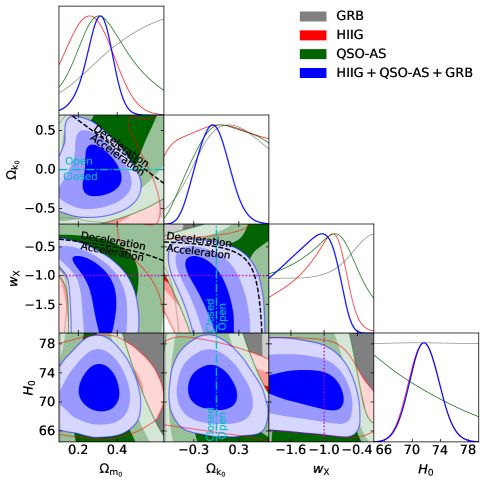
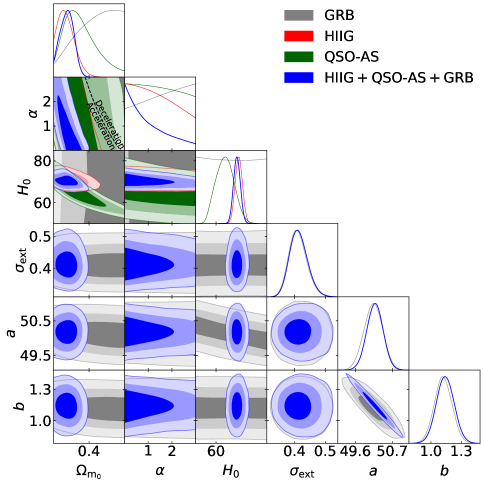
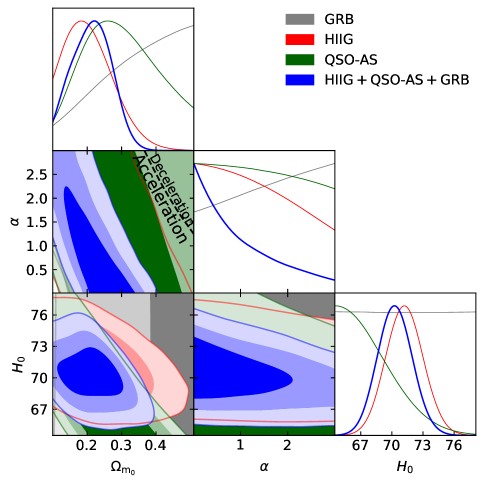
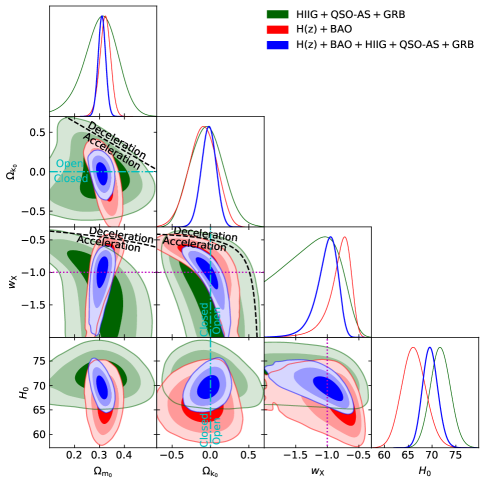
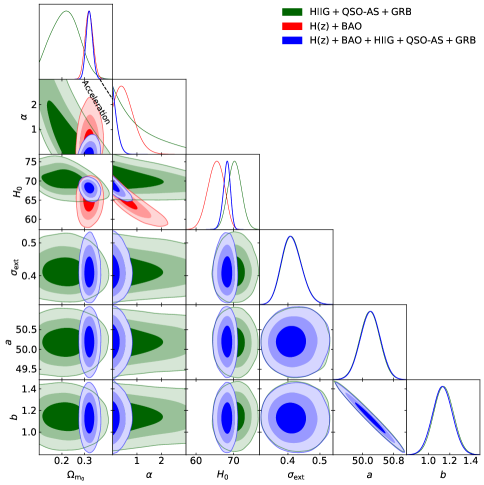
We present the posterior one-dimensional (1D) probability distributions and two-dimensional (2D) confidence regions of the cosmological and Amati relation parameters for the six flat and non-flat models in Figs. 1–6, in gray (GRB), red (H iiG), and green (QSO-AS). The unmarginalized best-fitting parameter values are listed in Table 1, along with the corresponding , , , , and degrees of freedom (where ).101010Note that the values listed in Tables 1 and 3 are computed from the best-fitting parameter values and are not necessarily the minimum (especially when including GRB and QSO-Flux data). The values of , , and reported in Table 1 are discussed in Section 5.4, where we define , , and , respectively, as the differences between the values of the , , and associated with a given model and their corresponding minimum values among all models. The marginalized best-fitting parameter values and uncertainties ( error bars or limits) are given in Table 2.111111We use the python package getdist (Lewis, 2019) to plot these figures and compute the central values (posterior means) and uncertainties of the free parameters listed in Table 2. From Table 2 we find that the QSO-AS constraints on are consistent with other results within a 1 range but with large error bars, ranging from a low of (flat CDM) to a high of (flat CDM).
The QSO-AS constraints on are between (non-flat CDM) and (flat XCDM), with large error bars and relatively low values for non-flat XCDM and the CDM models.
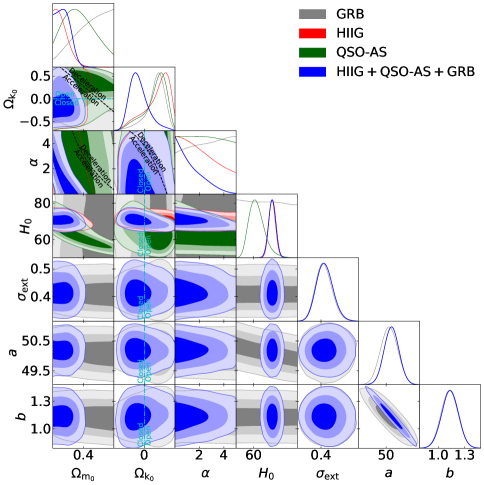
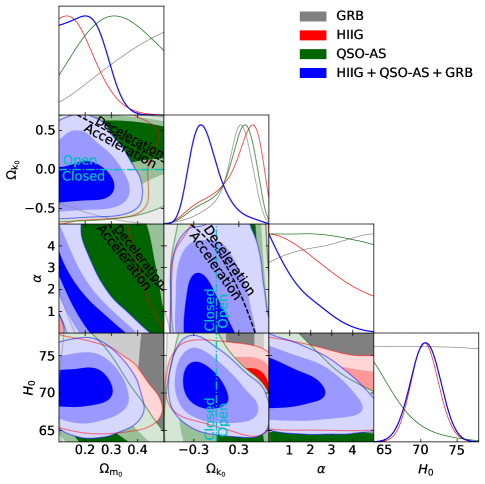
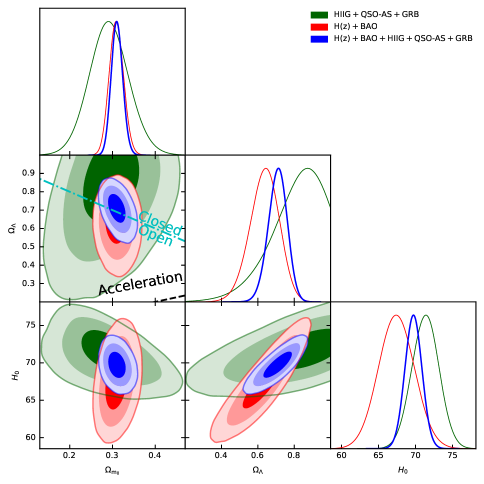
The non-flat models mildly favor open geometry, but are also consistent, given the large error bars, with spatially-flat hypersurfaces (except for non-flat CDM, where the open case is favored at ). For non-flat CDM, non-flat XCDM, and non-flat CDM, we find , , and , respectively.121212From Table 2 we see that GRB data are also consistent with flat spatial geometry in the non-flat CDM and XCDM cases, but also favor, at , open spatial geometry in the case of non-flat CDM.
The fits to the QSO-AS data favor dark energy being a cosmological constant but do not strongly disfavor dark energy dynamics. For flat (non-flat) XCDM, (), and for flat (non-flat) CDM, upper limits of are (). In the former case, both results are within 1 of , and in the latter case, both 1D likelihoods peak at .
Constraints on cosmological model parameters derived solely from H iiG data are discussed in Sec. 5.1 of Cao et al. (2020), while those derived from GRB data are described in Sec. 5.1 of Khadka & Ratra (2020a) (though there are slight differences coming from the different treatments of and the different ranges of flat priors used there and here); both are listed in Table 2 here. In contrast to the H iiG and QSO-AS data sets, the GRB data alone cannot constrain because there is a degeneracy between the intercept parameter () of the Amati relation and ; for consistency with the analyses of the H iiG and QSO-AS data, we treat as a free parameter in the GRB data analysis here.
Cosmological constraints obtained using the H iiG, QSO-AS, and GRB data sets are mutually consistent, and are also consistent with those obtained from most other cosmological probes. This is partially a consequence of the larger H iiG, QSO-AS, and GRB data error bars, which lead to relatively weaker constraints on cosmological parameters when each of these data sets is used alone (see Table 2). However, because the H iiG, QSO-AS, and GRB constraints are mutually consistent, we may jointly analyze these data. Their combined cosmological constraints will therefore be more restrictive than when they are analyzed individually.
We note, from Figs. 1–6, that a significant part of the likelihood of each of these three data sets lies in the parameter space part with currently-accelerating cosmological expansion.

5.2 H iiG, QSO-AS, and GRB (HQASG) joint constraints
Because the H iiG, QSO-AS, and GRB contours are mutually consistent for all six of the models we study, we jointly analyze these data to obtain HQASG constraints.
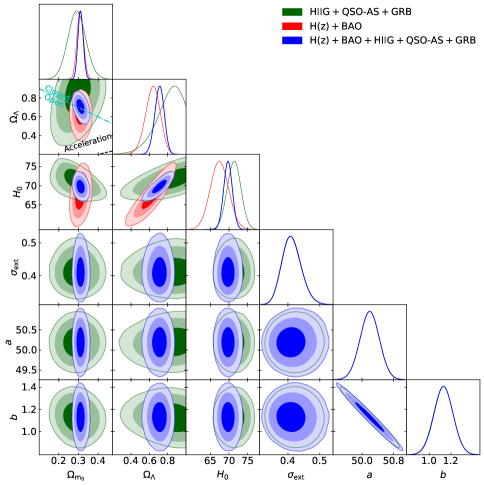
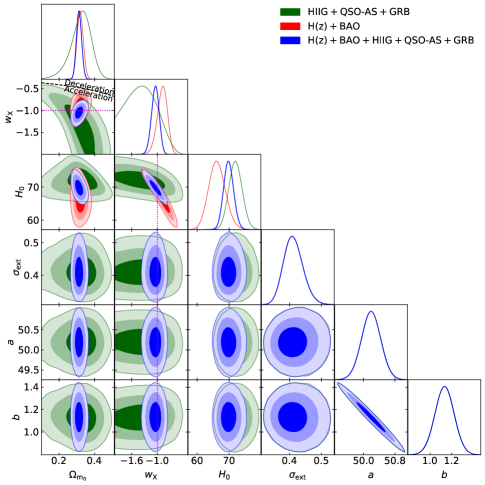
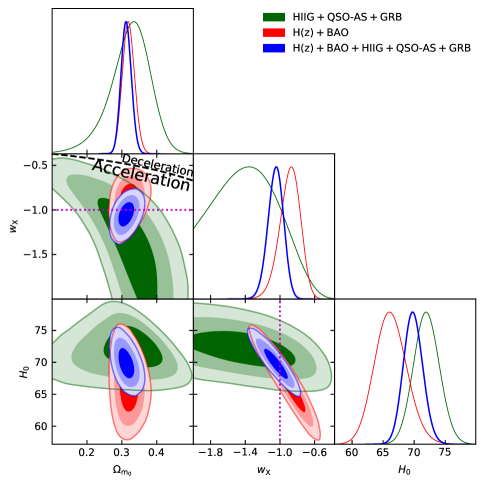
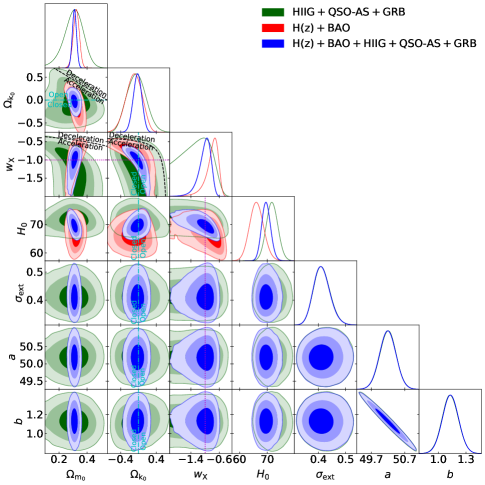
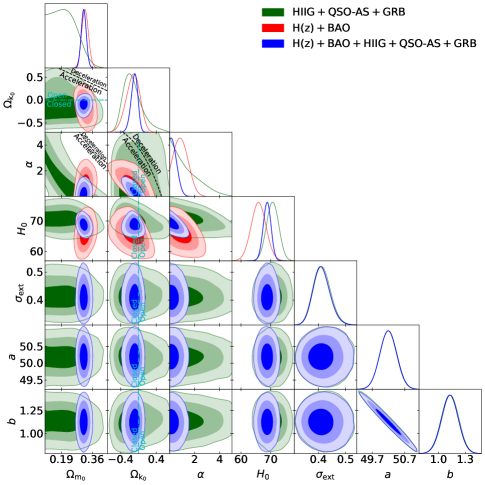
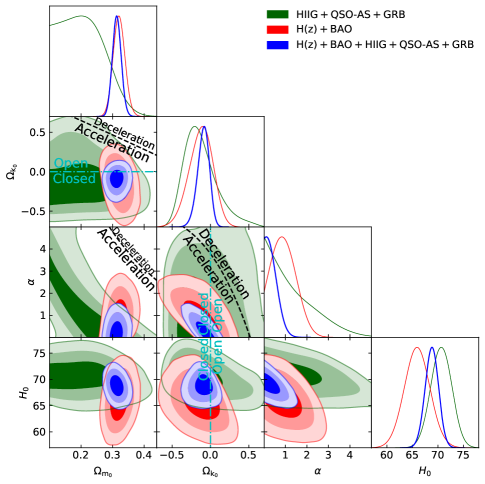
The 1D probability distributions and 2D confidence regions of the cosmological and Amati relation parameters from the HQASG data are in Figs. 1–6, in blue, Figs. 7–12, in green, and panels (a) of Figs. 13–16, in red. The best-fitting results and uncertainties are in Tables 1 and 2.
We find that the HQASG data combination favors currently-accelerating cosmological expansion.
The fit to the HQASG data produces best-fitting values of that lie between (non-flat CDM) at the low end, and (flat XCDM) at the high end. This range is smaller than the ranges within which falls when it is determined from the H iiG, QSO-AS, and GRB data individually, but the low and high ends of the range are still somewhat mutually inconsistent, being 2.66 away from each other. This is a consequence of the low value for non-flat CDM; the values for CDM and XCDM are quite consistent with the recent estimate of Planck Collaboration (2020). In contrast, the best-fitting values of that we measure from the HQASG data are mutually very consistent (within ), with (flat CDM) at the low end of the range and (flat XCDM) at the high end of the range. These measurements are (flat XCDM) and (flat CDM) lower than the local Hubble constant measurement of (Riess et al., 2019), and (flat CDM) and (flat XCDM) higher than the median statistics estimate of (Chen & Ratra, 2011a).131313Other local expansion rate determinations have slightly lower central values with slightly larger error bars (Rigault et al., 2015; Zhang et al., 2017; Dhawan et al., 2018; Fernández Arenas et al., 2018; Freedman et al., 2019, 2020; Rameez & Sarkar, 2019; Breuval et al., 2020; Efstathiou, 2020; Khetan et al., 2020). Our measurements are consistent with earlier median statistics estimates (Gott et al., 2001; Chen et al., 2003) and with other recent determinations (Chen et al., 2017; DES Collaboration, 2018; Gómez-Valent & Amendola, 2018; Planck Collaboration, 2020; Zhang, 2018; Domínguez et al., 2019; Martinelli & Tutusaus, 2019; Cuceu et al., 2019; Zeng & Yan, 2019; Schöneberg et al., 2019; Lin & Ishak, 2019; Blum et al., 2020; Lyu et al., 2020; Philcox et al., 2020; Zhang & Huang, 2020; Birrer et al., 2020; Denzel et al., 2020).
In contrast to the H iiG, QSO-AS, and GRB only cases, when fitted to the HQASG data combination the non-flat models mildly favor closed spatial hypersurfaces. For non-flat CDM, non-flat XCDM, and non-flat CDM, we find , , and , respectively, with the non-flat CDM model favoring closed spatial hypersurfaces at 1.01.
The fit to the HQASG data combination produces stronger evidence for dark energy dynamics in the flat and non-flat XCDM parametrizations but weaker evidence in the flat and non-flat CDM models (in comparison to the H iiG and QSO-AS only cases) with tighter error bars on the measured values of and . For flat (non-flat) XCDM, (), with being within the 1 range for non-flat XCDM and being 1.05 larger for flat XCDM. For flat (non-flat) CDM, (), where both likelihoods peak at .
The constraints on the Amati relation parameters from the HQASG data are also model-independent, but with slightly larger central values and smaller error bars for the parameter . A reasonable summary is , , and .
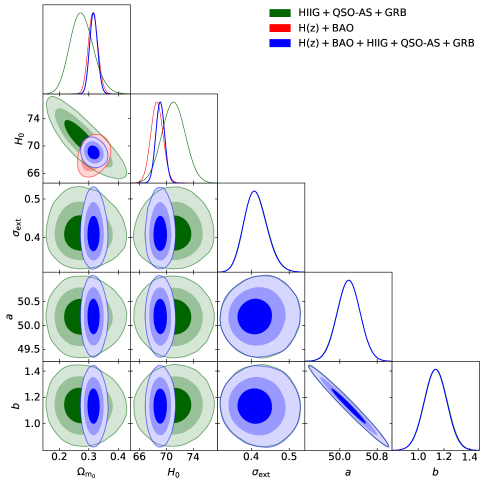
The HQASG cosmological constraints are largely consistent with those from other data, like the constraints from the + BAO data used in Cao et al. (2020) and Khadka & Ratra (2020c), that are shown in red in Figs. 7–12. We note, however, that there is some mild tension between CDM values, and between XCDM and CDM values determined from + BAO and HQASG data, with the difference between values estimated from the two different data combinations in the non-flat CDM model being the only somewhat troubling difference (see Table 2).
| Model | Data set | c | ||||||||||||||||
|---|---|---|---|---|---|---|---|---|---|---|---|---|---|---|---|---|---|---|
| Flat CDM | GRB | 0.698 | 0.302 | – | – | – | 80.36 | 0.404 | 49.92 | 1.113 | 117.98 | 114 | 130.12 | 140.12 | 154.01 | 1.08 | 0.00 | 0.00 |
| H iiG | 0.276 | 0.724 | – | – | – | 71.81 | – | – | – | 410.75 | 151 | 410.75 | 414.75 | 420.81 | 3.15 | 0.00 | 0.00 | |
| QSO-AS | 0.315 | 0.685 | – | – | – | 68.69 | – | – | – | 352.05 | 118 | 352.05 | 356.05 | 361.62 | 1.76 | 0.00 | 0.00 | |
| HQASGd | 0.271 | 0.729 | – | – | – | 71.13 | 0.407 | 50.18 | 1.138 | 879.42 | 387 | 895.05 | 905.05 | 924.91 | 0.12 | 0.00 | 0.00 | |
| + BAO | 0.314 | 0.686 | – | – | – | 68.53 | – | – | – | 20.82 | 40 | 20.82 | 24.82 | 28.29 | 2.39 | 0.00 | 0.00 | |
| HzBHQASGe | 0.317 | 0.683 | – | – | – | 69.06 | 0.404 | 50.19 | 1.134 | 903.61 | 429 | 917.79 | 927.79 | 948.16 | 4.05 | 0.00 | 0.00 | |
| Non-flat CDM | GRB | 0.691 | 0.203 | 0.106 | – | – | 77.03 | 0.402 | 49.96 | 1.115 | 117.37 | 113 | 129.96 | 141.96 | 158.64 | 0.47 | 1.84 | 4.63 |
| H iiG | 0.311 | 1.000 | – | – | 72.41 | – | – | – | 410.44 | 150 | 410.44 | 416.44 | 425.53 | 2.84 | 1.69 | 4.72 | ||
| QSO-AS | 0.266 | 1.000 | – | – | 74.73 | – | – | – | 351.30 | 117 | 351.30 | 357.30 | 365.66 | 1.01 | 1.25 | 4.04 | ||
| HQASGd | 0.291 | 0.876 | – | – | 72.00 | 0.406 | 50.22 | 1.120 | 879.30 | 386 | 894.02 | 906.02 | 929.85 | 0.00 | 0.97 | 4.94 | ||
| + BAO | 0.308 | 0.643 | 0.049 | – | – | 67.52 | – | – | – | 20.52 | 39 | 20.52 | 26.52 | 31.73 | 2.09 | 1.70 | 3.44 | |
| HzBHQASGe | 0.309 | 0.716 | – | – | 69.77 | 0.402 | 50.17 | 1.141 | 904.47 | 428 | 917.17 | 929.17 | 953.61 | 4.91 | 1.38 | 5.45 | ||
| Flat XCDM | GRB | 0.102 | – | – | – | 55.30 | 0.400 | 50.22 | 1.117 | 118.28 | 113 | 129.79 | 141.79 | 158.47 | 1.38 | 1.67 | 4.46 | |
| H iiG | 0.251 | – | – | – | 71.66 | – | – | – | 410.72 | 150 | 410.72 | 416.72 | 425.82 | 3.12 | 1.97 | 5.01 | ||
| QSO-AS | 0.267 | – | – | – | 81.70 | – | – | – | 351.84 | 117 | 351.84 | 357.84 | 366.20 | 1.55 | 1.79 | 4.58 | ||
| HQASGd | 0.320 | – | – | – | 72.03 | 0.404 | 50.20 | 1.131 | 880.47 | 386 | 894.27 | 906.27 | 930.10 | 1.17 | 1.22 | 5.19 | ||
| + BAO | 0.319 | – | – | – | 65.83 | – | – | – | 19.54 | 39 | 19.54 | 25.54 | 30.76 | 1.11 | 0.72 | 2.47 | ||
| HzBHQASGe | 0.313 | – | – | – | 69.90 | 0.407 | 50.19 | 1.132 | 902.09 | 428 | 917.55 | 929.55 | 953.99 | 2.53 | 1.76 | 5.83 | ||
| Non-flat XCDM | GRB | 0.695 | – | 0.556 | – | 57.64 | 0.399 | 50.13 | 1.133 | 118.43 | 112 | 129.73 | 143.73 | 163.19 | 1.53 | 3.61 | 9.18 | |
| H iiG | 0.100 | – | – | 72.57 | – | – | – | 407.60 | 149 | 407.60 | 415.60 | 427.72 | 0.00 | 0.85 | 6.91 | |||
| QSO-AS | 0.100 | – | – | 74.04 | – | – | – | 350.29 | 116 | 350.29 | 358.29 | 369.44 | 0.00 | 2.24 | 7.82 | |||
| HQASGd | 0.300 | – | – | 80.36 | 0.405 | 50.21 | 1.122 | 879.48 | 385 | 894.01 | 908.01 | 935.81 | 0.18 | 2.96 | 10.90 | |||
| + BAO | 0.327 | – | – | 65.97 | – | – | – | 18.43 | 38 | 18.43 | 26.43 | 33.38 | 0.00 | 1.61 | 5.09 | |||
| HzBHQASGe | 0.312 | – | – | 69.46 | 0.402 | 50.23 | 1.117 | 904.17 | 427 | 917.07 | 931.07 | 959.58 | 4.61 | 3.28 | 11.42 | |||
| Flat CDM | GRB | 0.674 | – | – | – | 2.535 | 84.00 | 0.399 | 49.88 | 1.104 | 119.15 | 113 | 130.14 | 142.14 | 158.82 | 2.25 | 2.02 | 4.81 |
| H iiG | 0.255 | – | – | – | 0.260 | 71.70 | – | – | – | 410.70 | 150 | 410.70 | 416.70 | 425.80 | 3.10 | 1.95 | 4.99 | |
| QSO-AS | 0.319 | – | – | – | 0.012 | 68.47 | – | – | – | 352.05 | 117 | 352.05 | 358.05 | 366.41 | 1.76 | 2.00 | 4.79 | |
| HQASGd | 0.282 | – | – | – | 0.012 | 70.81 | 0.402 | 50.19 | 1.135 | 882.56 | 386 | 895.28 | 907.28 | 931.11 | 3.26 | 2.23 | 6.20 | |
| + BAO | 0.318 | – | – | – | 0.364 | 66.04 | – | – | – | 19.65 | 39 | 19.65 | 25.65 | 30.86 | 1.22 | 0.83 | 2.57 | |
| HzBHQASGe | 0.316 | – | – | – | 0.013 | 69.15 | 0.405 | 50.24 | 1.114 | 903.52 | 428 | 918.12 | 930.12 | 954.56 | 3.96 | 2.33 | 6.40 | |
| Non-flat CDM | GRB | 0.664 | – | 0.188 | – | 4.269 | 59.65 | 0.403 | 50.17 | 1.111 | 116.90 | 112 | 129.93 | 143.93 | 163.39 | 0.00 | 3.81 | 9.38 |
| H iiG | 0.114 | – | – | 2.680 | 72.14 | – | – | – | 409.91 | 149 | 409.91 | 417.91 | 430.03 | 2.31 | 3.16 | 9.22 | ||
| QSO-AS | 0.100 | – | – | 2.948 | 72.37 | – | – | – | 350.98 | 116 | 350.98 | 358.98 | 370.13 | 0.69 | 2.93 | 8.51 | ||
| HQASGd | 0.276 | – | – | 72.11 | 0.402 | 50.16 | 1.142 | 881.09 | 385 | 894.24 | 908.24 | 936.03 | 1.79 | 3.19 | 11.12 | |||
| + BAO | 0.321 | – | – | 0.887 | 66.41 | – | – | – | 18.61 | 39 | 18.61 | 26.61 | 33.56 | 0.18 | 1.79 | 5.27 | ||
| HzBHQASGe | 0.310 | – | – | 0.193 | 69.06 | 0.411 | 50.21 | 1.126 | 899.56 | 427 | 917.26 | 931.26 | 959.77 | 0.00 | 3.47 | 11.61 |
-
c
.
-
d
H iiG + QSO-AS + GRB.
-
e
+ BAO + H iiG + QSO-AS + GRB.
5.3 , BAO, H iiG, QSO-AS, and GRB (HzBHQASG) constraints
Given the good mutual consistency between constraints derived from + BAO data and those derived from HQASG data, in this subsection we determine more restrictive joint constraints from the combined , BAO, H iiG, QSO-AS, and GRB (HzBHQASG) data on the parameters of our six cosmological models.
The 1D probability distributions and 2D confidence regions of the cosmological and Amati relation parameters for all models from the HzBHQASG data are in blue in Figs. 7–12, and in red in panels (b) of Figs. 13–16. The best-fitting results and uncertainties are in Tables 1 and 2.
The measured values of here are a little larger, and significantly more restrictively constrained, than the ones in the HQASG cases (except for flat XCDM), being between (non-flat XCDM) and (flat CDM). The measurements are a little lower, and more tightly constrained, than in the HQASG cases, and are in better agreement with the lower median statistics estimate of (Chen & Ratra, 2011a) than the higher local expansion rate measurement of (Riess et al., 2019), being between (flat CDM) and (flat XCDM).
For non-flat CDM, non-flat XCDM, and non-flat CDM, we measure , , and , respectively, where the central values are a little higher (closer to 0) than what was measured in the HQASG cases. The joint constraints are more restrictive, with non-flat CDM and XCDM within 0.44 and 0.26 of , respectively. The non-flat CDM model, on the other hand, still favors a closed geometry with an that is 1.15 away from zero.
The HzBHQASG case has slightly larger measured values and tighter error bars for and than the HQASG case, so there is also not much evidence in support of dark energy dynamics. For flat (non-flat) XCDM, (). For flat (non-flat) CDM, the upper limits are ().
The cosmological model-independent constraints from the HzBHQASG data combination on the parameters of the Amati relation can be summarized as , , and .
5.4 Model comparison
From Table 1, we see that the reduced values determined from GRB data alone are around unity for all models (being between 1.03 and 1.06) while those values determined from the + BAO data combination range from 0.48 to 0.53, with the lower reduced here being due to the data (that probably have overestimated error bars). As discussed in Ryan et al. (2019) and Cao et al. (2020), the cases that involve H iiG and QSO-AS data have a larger reduced (between 2.11 and 3.02), which is probably due to underestimated systematic uncertainties in both cases.
Based on the and the (see Table 1), the flat CDM model remains the most favored model, across all data combinations, among the six models we study.141414Note that based on the results of Table 1 non-flat CDM has the minimum in the HQASG case and non-flat XCDM has the minimum in the H iiG, QSO-AS, and + BAO cases, whereas non-flat CDM has the minimum for the GRB and HzBHQASG cases. The values do not, however, penalize a model for having more parameters. From and , we find mostly weak or positive evidence against the models we considered, and only in a few cases do we find strong evidence against them. According to , the evidence against non-flat XCDM is strong for the H iiG, QSO-AS, and GRB only cases, and very strong for the HQASG and HzBHQASG cases. Similarly, the evidence against flat CDM is strong for the HQASG and HzBHQASG cases, and the evidence against non-flat CDM is strong for the H iiG, QSO-AS, and GRB only cases, and very strong for the HQASG and HzBHQASG cases.
Among these six models, a comparison of the values from Table 1 shows that the most disfavored model is non-flat CDM, and that the second most disfavored model is non-flat XCDM. This is especially true when these models are fitted to the HQASG and HzBHQASG data combinations, in which cases non-flat CDM and non-flat XCDM are very strongly disfavored. These models aren’t as strongly disfavored by the , however; from a comparison of the values in Table 1, we see that the evidence against the most disfavored model (non-flat CDM) is only positive.
| Model | Data set | c | ||||||||
|---|---|---|---|---|---|---|---|---|---|---|
| Flat CDM | GRB | – | – | – | – | – | ||||
| H iiG | – | – | – | – | – | – | – | |||
| QSO-AS | – | – | – | – | – | – | – | |||
| HQASGe | – | – | – | – | ||||||
| + BAO | – | – | – | – | – | – | – | |||
| HzBHQASGf | – | – | – | – | ||||||
| Non-flat CDM | GRB | d | – | – | – | |||||
| H iiG | d | – | – | – | – | – | ||||
| QSO-AS | – | – | – | – | – | – | ||||
| HQASGe | – | – | ||||||||
| + BAO | – | – | – | – | – | |||||
| HzBHQASGf | – | – | ||||||||
| Flat XCDM | GRB | d | – | – | – | – | – | |||
| H iiG | – | – | – | – | – | – | ||||
| QSO-AS | – | – | – | – | – | – | ||||
| HQASGe | – | – | – | |||||||
| + BAO | – | – | – | – | – | – | ||||
| HzBHQASGf | – | – | – | |||||||
| Non-flat XCDM | GRB | d | – | d | – | – | ||||
| H iiG | – | – | – | – | – | |||||
| QSO-AS | – | – | – | – | – | |||||
| HQASGe | – | – | ||||||||
| + BAO | – | – | – | – | – | |||||
| HzBHQASGf | – | – | ||||||||
| Flat CDM | GRB | d | – | – | – | – | – | |||
| H iiG | – | – | – | – | – | – | ||||
| QSO-AS | – | – | – | – | – | – | ||||
| HQASGe | – | – | – | |||||||
| + BAO | – | – | – | – | – | – | ||||
| HzBHQASGf | – | – | – | |||||||
| Non-flat CDM | GRB | – | – | – | – | |||||
| H iiG | – | – | – | – | – | |||||
| QSO-AS | – | – | – | – | – | |||||
| HQASGe | – | – | ||||||||
| + BAO | – | – | – | – | – | |||||
| HzBHQASGf | – | – |
-
c
.
-
d
This is the 1 limit. The limit is set by the prior, and is not shown here.
-
e
H iiG + QSO-AS + GRB.
-
f
+ BAO + H iiG + QSO-AS + GRB.


6 Conclusion
We find that cosmological constraints determined from higher- GRB, H iiG, and QSO-AS data are mutually consistent. It is both reassuring and noteworthy that these higher- data jointly favor currently-accelerating cosmological expansion, and that their constraints are consistent with the constraints imposed by more widely used and more restrictive and BAO data. Using a data set consisting of 31 , 11 BAO, 120 QSO-AS, 153 H iiG, and 119 GRB measurements, we jointly constrain the parameters of the GRB Amati relation and of six cosmological models.
The GRB measurements are of special interest because they reach to (far beyond the highest reached by BAO data) and into a much less studied area of redshift space. Current GRB data do not provide very restrictive constraints on cosmological model parameters, but in the near future we expect there to be more GRB observations (Shirokov et al., 2020) which should improve the GRB data and provide more restrictive cosmological constraints.
Some of our conclusions do not differ significantly between models and so are model-independent. In particular, for the HzBHQASG data (the full data set excluding QSO-Flux data), we find a fairly restrictive summary value of that agrees well with many other recent measurements. From these data we also find a fairly restrictive summary value of that is in better agreement with the results of Chen & Ratra (2011a) and Planck Collaboration (2020) than with the result of Riess et al. (2019); note that we do not take the tension issue into account (for a review, see Riess, 2019). The HzBHQASG measurements are consistent with flat CDM, but do not rule out mild dark energy dynamics or a little spatial curvature energy density. More and better-quality higher- GRB, H iiG, QSO, and other data will significantly help to test these extensions of flat CDM.
Acknowledgements
We thank Adam Riess for his comments and the anonymous referee for useful suggestions. This work was partially funded by Department of Energy grant DE-SC0011840. The computing for this project was performed on the Beocat Research Cluster at Kansas State University, which is funded in part by NSF grants CNS-1006860, EPS-1006860, EPS-0919443, ACI-1440548, CHE-1726332, and NIH P20GM113109.
Data availability
References
- Agudelo Ruiz et al. (2020) Agudelo Ruiz J. A., Fabris J. C., Velasquez-Toribio A. M., Shapiro I. L., 2020, preprint, (arXiv:2007.12636)
- Alam et al. (2017) Alam S., et al., 2017, MNRAS, 470, 2617
- Amati et al. (2002) Amati L., et al., 2002, A&A, 390, 81
- Amati et al. (2008) Amati L., Guidorzi C., Frontera F., Della Valle M., Finelli F., Landi R., Montanari E., 2008, MNRAS, 391, 577
- Amati et al. (2009) Amati L., Frontera F., Guidorzi C., 2009, A&A, 508, 173
- Amati et al. (2019) Amati L., D’Agostino R., Luongo O., Muccino M., Tantalo M., 2019, MNRAS, 486, L46
- Ata et al. (2018) Ata M., et al., 2018, MNRAS, 473, 4773
- Avsajanishvili et al. (2015) Avsajanishvili O., Samushia L., Arkhipova N. A., Kahniashvili T., 2015, preprint, (arXiv:1511.09317)
- Birrer et al. (2020) Birrer S., et al., 2020, preprint, (arXiv:2007.02941)
- Blum et al. (2020) Blum K., Castorina E., Simonović M., 2020, ApJ, 892, L27
- Breuval et al. (2020) Breuval L., et al., 2020, A&A, 643, A115
- Campanelli et al. (2012) Campanelli L., Fogli G. L., Kahniashvili T., Marrone A., Ratra B., 2012, European Physical Journal C, 72, 2218
- Cao et al. (2017) Cao S., Zheng X., Biesiada M., Qi J., Chen Y., Zhu Z.-H., 2017, A&A, 606, A15
- Cao et al. (2020) Cao S., Ryan J., Ratra B., 2020, MNRAS, 497, 3191
- Carter et al. (2018) Carter P., Beutler F., Percival W. J., Blake C., Koda J., Ross A. J., 2018, MNRAS, 481, 2371
- Chávez et al. (2014) Chávez R., Terlevich R., Terlevich E., Bresolin F., Melnick J., Plionis M., Basilakos S., 2014, MNRAS, 442, 3565
- Chen & Ratra (2003) Chen G., Ratra B., 2003, ApJ, 582, 586
- Chen & Ratra (2004) Chen G., Ratra B., 2004, ApJ, 612, L1
- Chen & Ratra (2011a) Chen G., Ratra B., 2011a, PASP, 123, 1127
- Chen & Ratra (2011b) Chen Y., Ratra B., 2011b, Physics Letters B, 703, 406
- Chen et al. (2003) Chen G., Gott III J. R., Ratra B., 2003, PASP, 115, 1269
- Chen et al. (2016) Chen Y., Ratra B., Biesiada M., Li S., Zhu Z.-H., 2016, ApJ, 829, 61
- Chen et al. (2017) Chen Y., Kumar S., Ratra B., 2017, ApJ, 835, 86
- Coley (2019) Coley A. A., 2019, preprint, (arXiv:1905.04588)
- Coley & Ellis (2020) Coley A. A., Ellis G. F. R., 2020, Classical and Quantum Gravity, 37, 013001
- Cuceu et al. (2019) Cuceu A., Farr J., Lemos P., Font-Ribera A., 2019, J. Cosmology Astropart. Phys., 2019, 044
- D’Agostini (2005) D’Agostini G., 2005, preprint, (arXiv:physics/0511182)
- DES Collaboration (2018) DES Collaboration 2018, MNRAS, 480, 3879
- DES Collaboration (2019a) DES Collaboration 2019a, Phys. Rev. D, 99, 123505
- DES Collaboration (2019b) DES Collaboration 2019b, MNRAS, 483, 4866
- de Sainte Agathe et al. (2019) de Sainte Agathe V., et al., 2019, A&A, 629, A85
- Demianski & Piedipalumbo (2011) Demianski M., Piedipalumbo E., 2011, MNRAS, 415, 3580
- Demianski et al. (2017) Demianski M., Piedipalumbo E., Sawant D., Amati L., 2017, A&A, 598, A112
- Demianski et al. (2019) Demianski M., Piedipalumbo E., Sawant D., Amati L., 2019, preprint, (arXiv:1911.08228)
- Denzel et al. (2020) Denzel P., Coles J. P., Saha P., Williams L. L. R., 2020, preprint, (arXiv:2007.14398)
- Dhawan et al. (2018) Dhawan S., Jha S. W., Leibundgut B., 2018, A&A, 609, A72
- Di Valentino et al. (2020) Di Valentino E., Melchiorri A., Silk J., 2020, preprint, (arXiv:2003.04935)
- Domínguez et al. (2019) Domínguez A., et al., 2019, ApJ, 885, 137
- eBOSS Collaboration (2020) eBOSS Collaboration 2020, preprint, (arXiv:2007.08991)
- Efstathiou (2020) Efstathiou G., 2020, preprint, (arXiv:2007.10716)
- Efstathiou & Gratton (2020) Efstathiou G., Gratton S., 2020, MNRAS, 496, L91
- Fana Dirirsa et al. (2019) Fana Dirirsa F., et al., 2019, ApJ, 887, 13
- Farooq & Ratra (2013) Farooq O., Ratra B., 2013, ApJ, 766, L7
- Farooq et al. (2013) Farooq O., Crandall S., Ratra B., 2013, Physics Letters B, 726, 72
- Farooq et al. (2015) Farooq O., Mania D., Ratra B., 2015, Ap&SS, 357, 11
- Farooq et al. (2017) Farooq O., Ranjeet Madiyar F., Crandall S., Ratra B., 2017, ApJ, 835, 26
- Fernández Arenas et al. (2018) Fernández Arenas D., et al., 2018, MNRAS, 474, 1250
- Foreman-Mackey et al. (2013) Foreman-Mackey D., Hogg D. W., Lang D., Goodman J., 2013, PASP, 125, 306
- Freedman et al. (2019) Freedman W. L., et al., 2019, ApJ, 882, 34
- Freedman et al. (2020) Freedman W. L., et al., 2020, ApJ, 891, 57
- Gao et al. (2020) Gao C., Chen Y., Zheng J., 2020, Research in Astronomy and Astrophysics, 20, 151
- Geng et al. (2020) Geng C.-Q., Hsu Y.-T., Yin L., Zhang K., 2020, Chinese Physics C, 44, 105104
- Ghirlanda et al. (2004) Ghirlanda G., Ghisellini G., Lazzati D., 2004, ApJ, 616, 331
- Gómez-Valent & Amendola (2018) Gómez-Valent A., Amendola L., 2018, J. Cosmology Astropart. Phys., 4, 051
- González-Morán et al. (2019) González-Morán A. L., et al., 2019, MNRAS, 487, 4669
- Gott et al. (2001) Gott III J. R., Vogeley M. S., Podariu S., Ratra B., 2001, ApJ, 549, 1
- Gurvits et al. (1999) Gurvits L. I., Kellermann K. I., Frey S., 1999, A&A, 342, 378
- Handley (2019) Handley W., 2019, Phys. Rev. D, 100, 123517
- Hogg (1999) Hogg D. W., 1999, preprint, (arXiv:astro-ph/9905116)
- Jesus et al. (2020) Jesus J. F., Valentim R., Moraes P. H. R. S., Malheiro M., 2020, MNRAS,
- Jones et al. (2009) Jones D. H., et al., 2009, MNRAS, 399, 683
- Khadka & Ratra (2020a) Khadka N., Ratra B., 2020a, MNRAS, 492, 4456
- Khadka & Ratra (2020b) Khadka N., Ratra B., 2020b, MNRAS, 497, 263
- Khadka & Ratra (2020c) Khadka N., Ratra B., 2020c, MNRAS, 499, 391
- Khetan et al. (2020) Khetan N., et al., 2020, preprint, (arXiv:2008.07754)
- Kumar et al. (2020) Kumar D., Jain D., Mahajan S., Mukherjee A., Rani N., 2020, preprint, (arXiv:2002.06354)
- Lamb & Reichart (2000) Lamb D. Q., Reichart D. E., 2000, ApJ, 536, 1
- Lamb & Reichart (2001) Lamb D. Q., Reichart D. E., 2001, in Costa E., Frontera F., Hjorth J., eds, Gamma-ray Bursts in the Afterglow Era. p. 226 (arXiv:astro-ph/0108099), doi:10.1007/10853853_61
- Lewis (2019) Lewis A., 2019, preprint, (arXiv:1910.13970)
- Li et al. (2020) Li E.-K., Du M., Xu L., 2020, MNRAS, 491, 4960
- Liang & Zhang (2005) Liang E., Zhang B., 2005, ApJ, 633, 611
- Lima & Alcaniz (2002) Lima J. A. S., Alcaniz J. S., 2002, ApJ, 566, 15
- Lin & Ishak (2019) Lin W., Ishak M., 2019, preprint, (arXiv:1909.10991)
- Liu & Wei (2015) Liu J., Wei H., 2015, General Relativity and Gravitation, 47, 141
- Lyu et al. (2020) Lyu M.-Z., Haridasu B. S., Viel M., Xia J.-Q., 2020, ApJ, 900, 160
- Mania & Ratra (2012) Mania D., Ratra B., 2012, Physics Letters B, 715, 9
- Martin (2012) Martin J., 2012, Comptes Rendus Physique, 13, 566
- Martinelli & Tutusaus (2019) Martinelli M., Tutusaus I., 2019, Symmetry, 11, 986
- Moresco et al. (2012) Moresco M., et al., 2012, J. Cosmology Astropart. Phys., 8, 006
- Moresco et al. (2016) Moresco M., et al., 2016, J. Cosmology Astropart. Phys., 5, 014
- Moresco et al. (2018) Moresco M., Jimenez R., Verde L., Pozzetti L., Cimatti A., Citro A., 2018, ApJ, 868, 84
- Moresco et al. (2020) Moresco M., Jimenez R., Verde L., Cimatti A., Pozzetti L., 2020, ApJ, 898, 82
- Muccino (2020) Muccino M., 2020, Symmetry, 12, 1118
- Ooba et al. (2018a) Ooba J., Ratra B., Sugiyama N., 2018a, ApJ, 864, 80
- Ooba et al. (2018b) Ooba J., Ratra B., Sugiyama N., 2018b, ApJ, 866, 68
- Ooba et al. (2018c) Ooba J., Ratra B., Sugiyama N., 2018c, ApJ, 869, 34
- Ooba et al. (2019) Ooba J., Ratra B., Sugiyama N., 2019, Ap&SS, 364, 176
- Park & Ratra (2018) Park C.-G., Ratra B., 2018, ApJ, 868, 83
- Park & Ratra (2019a) Park C.-G., Ratra B., 2019a, Ap&SS, 364, 82
- Park & Ratra (2019b) Park C.-G., Ratra B., 2019b, Ap&SS, 364, 134
- Park & Ratra (2019c) Park C.-G., Ratra B., 2019c, ApJ, 882, 158
- Park & Ratra (2020) Park C.-G., Ratra B., 2020, Phys. Rev. D, 101, 083508
- Pavlov et al. (2013) Pavlov A., Westmoreland S., Saaidi K., Ratra B., 2013, Phys. Rev. D, 88, 123513
- Peebles (1984) Peebles P. J. E., 1984, ApJ, 284, 439
- Peebles & Ratra (1988) Peebles P. J. E., Ratra B., 1988, ApJ, 325, L17
- Philcox et al. (2020) Philcox O. H. E., Ivanov M. M., Simonović M., Zaldarriaga M., 2020, J. Cosmology Astropart. Phys., 2020, 032
- Planck Collaboration (2020) Planck Collaboration 2020, A&A, 641, A6
- Plionis et al. (2009) Plionis M., Terlevich R., Basilakos S., Bresolin F., Terlevich E., Melnick J., Georgantopoulos I., 2009, in Journal of Physics Conference Series. p. 012032 (arXiv:0903.0131), doi:10.1088/1742-6596/189/1/012032
- Rameez & Sarkar (2019) Rameez M., Sarkar S., 2019, preprint, (arXiv:1911.06456)
- Rana et al. (2017) Rana A., Jain D., Mahajan S., Mukherjee A., 2017, J. Cosmology Astropart. Phys., 3, 028
- Ratra & Peebles (1988) Ratra B., Peebles P. J. E., 1988, Phys. Rev. D, 37, 3406
- Ratra & Vogeley (2008) Ratra B., Vogeley M. S., 2008, PASP, 120, 235
- Riess (2019) Riess A. G., 2019, Nature Reviews Physics, 2, 10
- Riess et al. (2019) Riess A. G., Casertano S., Yuan W., Macri L. M., Scolnic D., 2019, ApJ, 876, 85
- Rigault et al. (2015) Rigault M., et al., 2015, ApJ, 802, 20
- Risaliti & Lusso (2015) Risaliti G., Lusso E., 2015, ApJ, 815, 33
- Risaliti & Lusso (2019) Risaliti G., Lusso E., 2019, Nature Astronomy, 3, 272
- Ross et al. (2015) Ross A. J., Samushia L., Howlett C., Percival W. J., Burden A., Manera M., 2015, MNRAS, 449, 835
- Ryan et al. (2018) Ryan J., Doshi S., Ratra B., 2018, MNRAS, 480, 759
- Ryan et al. (2019) Ryan J., Chen Y., Ratra B., 2019, MNRAS, 488, 3844
- Samushia & Ratra (2010) Samushia L., Ratra B., 2010, ApJ, 714, 1347
- Samushia et al. (2007) Samushia L., Chen G., Ratra B., 2007, preprint, (arXiv:0706.1963)
- Samushia et al. (2010) Samushia L., Dev A., Jain D., Ratra B., 2010, Physics Letters B, 693, 509
- Sangwan et al. (2018) Sangwan A., Tripathi A., Jassal H. K., 2018, preprint, (arXiv:1804.09350)
- Schöneberg et al. (2019) Schöneberg N., Lesgourgues J., Hooper D. C., 2019, J. Cosmology Astropart. Phys., 2019, 029
- Scolnic et al. (2018) Scolnic D. M., et al., 2018, ApJ, 859, 101
- Shirokov et al. (2020) Shirokov S. I., Sokolov I. V., Lovyagin N. Y., Amati L., Baryshev Y. V., Sokolov V. V., Gorokhov V. L., 2020, MNRAS, 496, 1530
- Siegel et al. (2005) Siegel E. R., Guzmán R., Gallego J. P., Orduña López M., Rodríguez Hidalgo P., 2005, MNRAS, 356, 1117
- Singh et al. (2019) Singh A., Sangwan A., Jassal H. K., 2019, J. Cosmology Astropart. Phys., 2019, 047
- Solà Peracaula et al. (2018) Solà Peracaula J., de Cruz Pérez J., Gómez-Valent A., 2018, MNRAS, 478, 4357
- Solà Peracaula et al. (2019) Solà Peracaula J., Gómez-Valent A., de Cruz Pérez J., 2019, Physics of the Dark Universe, 25, 100311
- Solà et al. (2017) Solà J., Gómez-Valent A., de Cruz Pérez J., 2017, Modern Physics Letters A, 32, 1750054
- Terlevich et al. (2015) Terlevich R., Terlevich E., Melnick J., Chávez R., Plionis M., Bresolin F., Basilakos S., 2015, MNRAS, 451, 3001
- Ureña-López & Roy (2020) Ureña-López L. A., Roy N., 2020, Phys. Rev. D, 102, 063510
- Velásquez-Toribio & Fabris (2020) Velásquez-Toribio A. M., Fabris J. C., 2020, preprint, (arXiv:2008.12741)
- Vishwakarma (2001) Vishwakarma R. G., 2001, Classical and Quantum Gravity, 18, 1159
- Wang et al. (2015) Wang F. Y., Dai Z. G., Liang E. W., 2015, New Astron. Rev., 67, 1
- Wang et al. (2016) Wang J. S., Wang F. Y., Cheng K. S., Dai Z. G., 2016, A&A, 585, A68
- Wei (2018) Wei J.-J., 2018, ApJ, 868, 29
- Wei & Melia (2020) Wei J.-J., Melia F., 2020, ApJ, 888, 99
- Yang & Gong (2020) Yang Y., Gong Y., 2020, preprint, (arXiv:2007.05714)
- Yang et al. (2019) Yang T., Banerjee A., Colgáin E. Ó., 2019, preprint, (arXiv:1911.01681)
- Yashar et al. (2009) Yashar M., Bozek B., Abrahamse A., Albrecht A., Barnard M., 2009, Phys. Rev. D, 79, 103004
- Yu & Wang (2016) Yu H., Wang F. Y., 2016, ApJ, 828, 85
- Yu et al. (2018) Yu H., Ratra B., Wang F.-Y., 2018, ApJ, 856, 3
- Zeng & Yan (2019) Zeng H., Yan D., 2019, ApJ, 882, 87
- Zhai et al. (2017) Zhai Z., Blanton M., Slosar A., Tinker J., 2017, ApJ, 850, 183
- Zhai et al. (2020) Zhai Z., Park C.-G., Wang Y., Ratra B., 2020, J. Cosmology Astropart. Phys., 2020, 009
- Zhang (2018) Zhang J., 2018, PASP, 130, 084502
- Zhang & Huang (2020) Zhang X., Huang Q.-G., 2020, preprint, (arXiv:2006.16692)
- Zhang et al. (2017) Zhang B. R., Childress M. J., Davis T. M., Karpenka N. V., Lidman C., Schmidt B. P., Smith M., 2017, MNRAS, 471, 2254
- Zhu & Fujimoto (2002) Zhu Z.-H., Fujimoto M.-K., 2002, ApJ, 581, 1
Appendix A QSO-Flux
QSOs obey a nonlinear relation between their luminosities in the X-ray and UV bands. Using a sample of 808 QSOs in the redshift range , Risaliti & Lusso (2015) confirmed that this relation can be written
| (25) |
where and are the X-ray and UV luminosities of the QSOs. To make contact with observations, equation (25) must be expressed in terms of the fluxes and measured at fixed rest-frame wavelengths in the X-ray and UV bands, respectively. With this, equation (25) becomes
|
|
(26) |
Here (defined in equation 9) is the luminosity distance, which depends on the parameters of our cosmological models. We also treat the slope and intercept as free parameters in our cosmological model fits.
For QSO-Flux data, the natural log of its likelihood function is
where . Here is the uncertainty in , and is the global intrinsic dispersion in the data (including the systematic uncertainties), which we treat as a free parameter in our cosmological model fits. We use the Risaliti & Lusso (2019) compilation of 1598 QSO-Flux measurements in the range . The flat priors of cosmological parameters and the Amati relation parameters are in Sec. 4 and, as in Khadka & Ratra (2020b), the flat priors of the parameters , , and are non-zero over , , and , respectively.
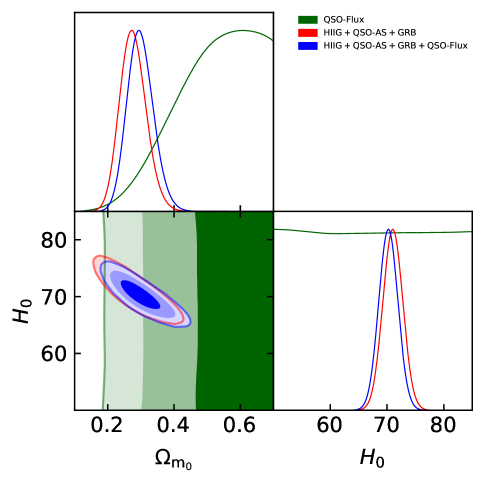
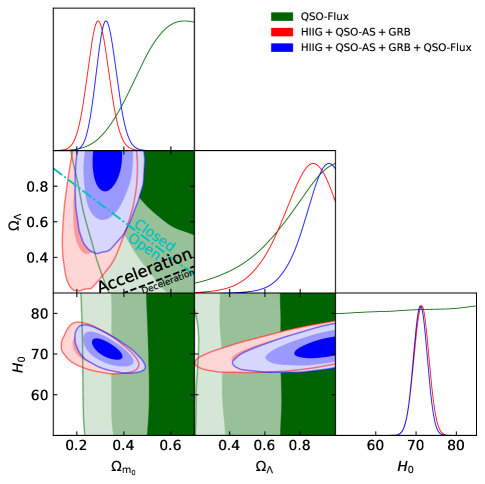
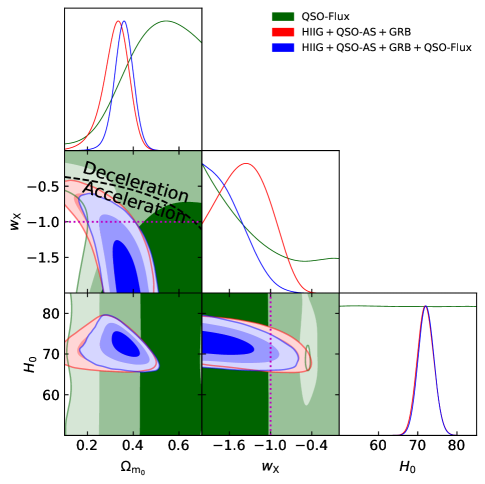
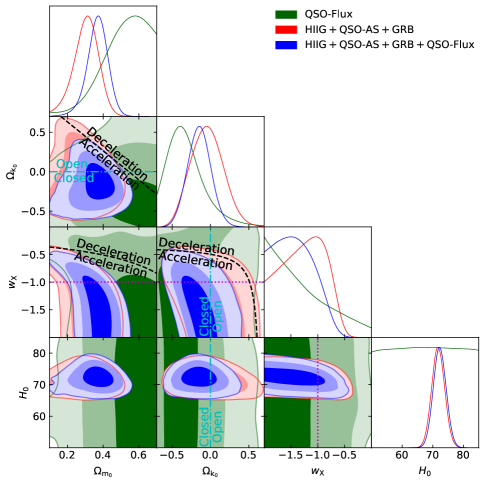
As discussed in Khadka & Ratra (2020b) the QSO-Flux data alone favors large values for the physically-motivated flat and non-flat CDM and CDM models. Risaliti & Lusso (2019) and Khadka & Ratra (2020b) note that this is largely a consequence of the –5 QSO data. While these large values differ from almost all other measurements of , the QSO-Flux data have larger error bars and their cosmological constraint contours are not in conflict with those from other data sets. For these reasons we have used the QSO-Flux data, but in this Appendix and not in the main text, and we have not computed QSO-Flux data results for the CDM cases (these being computationally demanding). We briefly summarize our constraints, listed in Tables 3 and 4 and shown in Figs. 13–16, below.
A.1 QSO-Flux constraints
Except for flat CDM, the constraints on in the QSO-Flux only case are 2 larger than those in the combined HzBHQASQFG case (see Sec. A.3). QSO-Flux data cannot constrain , nor can they constrain (for the same reason that GRB data cannot constrain this parameter; see Section 5.1). QSO-Flux data set upper limits on for flat and non-flat XCDM, with within the 1 range.
A.2 H iiG, QSO-AS, QSO-Flux, and GRB (HQASQFG) constraints
When adding QSO-Flux to HQASG data, the joint constraints favor larger and lower . In non-flat CDM closed geometry is favored at 3.24. The constraints are only mildly affected by the addition of the QSO-Flux data. The constraint on changes from in the HQASG case to (2 limit) in the HQASQFG case for flat XCDM, while for non-flat XCDM, the constraint on in the HQASQFG case is 0.40 lower than that in the HQASG case and is 1.80 away from .
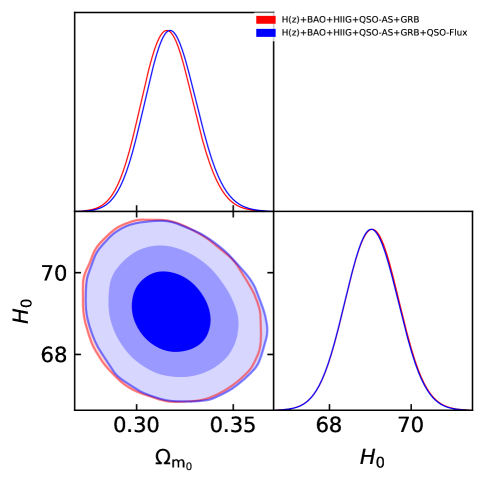
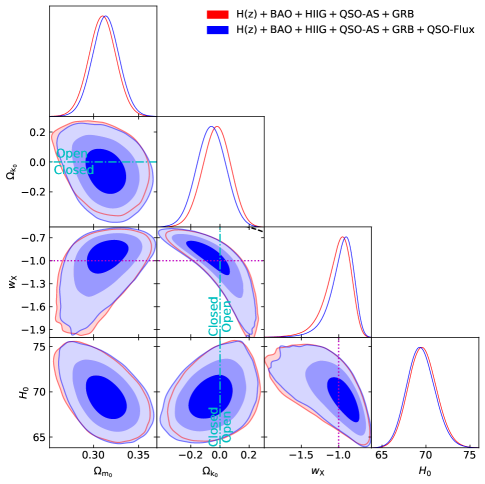
A.3 , BAO, H iiG, QSO-AS, QSO-Flux, and GRB (HzBHQASQFG) constraints
When adding QSO-Flux to the HzBHQASG combination, the central values are only slightly larger because the + BAO data dominate this compilation. The joint-constraint central values are lower, and consistent with flat geometry, while the constraints on from this combination are almost unaltered. The constraints on are 0.02 lower and 0.23 higher for flat and non-flat XCDM, respectively, both being consistent with within 1.


A.4 Model comparison
From Table 3, we see that the reduced of the QSO-Flux case for all models is near unity () and that the reduced of cases that include QSO-Flux is brought down to –1.26 for all models. Based on the (see Table 3), flat CDM is the most favored model, while based on the , non-flat XCDM, flat XCDM, and flat CDM are the most favored models for the QSO-Flux, HQASQFG, and HzBHQASQFG combinations, respectively.151515Note that based on the results of Table 3 flat CDM has the minimum in the QSO-Flux, HQASQFG, and HzBHQASQFG cases. From and , we find mostly weak or positive evidence against the models, and only in a few cases do we find strong evidence against our models. According to , the evidence against non-flat XCDM is strong for the QSO-Flux data, and very strong for the HQASQFG and HzBHQASQFG data, and the evidence against non-flat CDM is strong for the HzBHQASQFG data. According to , the evidence against flat XCDM is strong for the HzBHQASQFG data.
| Model | Data set | c | |||||||||||||||||||
|---|---|---|---|---|---|---|---|---|---|---|---|---|---|---|---|---|---|---|---|---|---|
| Flat CDM | QSO-Flux | 0.315 | 0.685 | – | – | – | 68.69 | – | – | – | – | – | – | 1603.28 | 1593 | -50.13 | -40.13 | -13.24 | 0.00 | 1.62 | 0.00 |
| HQASGd | 0.271 | 0.729 | – | – | – | 71.13 | 0.407 | 50.18 | 1.138 | – | – | – | 879.42 | 387 | 895.05 | 905.05 | 924.91 | 0.12 | 0.00 | 0.00 | |
| HQASQFGe | 0.305 | 0.695 | – | – | – | 70.01 | 0.399 | 50.20 | 1.132 | 0.231 | 0.639 | 7.083 | 2480.01 | 1982 | 848.53 | 864.53 | 909.29 | 0.00 | 2.58 | 0.00 | |
| HzBHQASGf | 0.317 | 0.683 | – | – | – | 69.06 | 0.404 | 50.19 | 1.134 | – | – | – | 903.61 | 429 | 917.79 | 927.79 | 948.16 | 1.52 | 0.00 | 0.00 | |
| HzBHQASQFGg | 0.317 | 0.683 | – | – | – | 69.06 | 0.399 | 50.23 | 1.119 | 0.232 | 0.637 | 7.144 | 2499.87 | 2024 | 870.31 | 886.31 | 931.25 | 0.00 | 0.00 | 0.00 | |
| Non-flat CDM | QSO-Flux | 0.540 | 0.985 | – | – | 75.75 | – | – | – | 0.230 | 0.611 | 7.888 | 1603.83 | 1592 | -53.25 | -41.25 | -8.99 | 0.55 | 0.50 | 4.25 | |
| HQASGd | 0.291 | 0.876 | – | – | 72.00 | 0.406 | 50.22 | 1.120 | – | – | – | 879.30 | 386 | 894.02 | 906.02 | 929.85 | 0.00 | 0.97 | 4.94 | ||
| HQASQFGe | 0.325 | 0.944 | – | – | 71.49 | 0.404 | 50.21 | 1.116 | 0.230 | 0.632 | 7.304 | 2486.97 | 1981 | 844.38 | 862.38 | 912.75 | 6.96 | 0.43 | 3.46 | ||
| HzBHQASGf | 0.309 | 0.716 | – | – | 69.77 | 0.402 | 50.17 | 1.141 | – | – | – | 904.47 | 428 | 917.17 | 929.17 | 953.61 | 2.38 | 1.38 | 5.45 | ||
| HzBHQASQFGg | 0.309 | 0.709 | – | – | 69.59 | 0.412 | 50.21 | 1.128 | 0.231 | 0.637 | 7.151 | 2503.43 | 2023 | 869.71 | 887.71 | 938.26 | 3.56 | 1.40 | 7.01 | ||
| Flat XCDM | QSO-Flux | 0.477 | – | – | – | 60.86 | – | – | – | 0.230 | 0.625 | 7.530 | 1604.18 | 1592 | -52.13 | -40.13 | -7.88 | 0.90 | 1.62 | 5.36 | |
| HQASGd | 0.320 | – | – | – | 72.03 | 0.404 | 50.20 | 1.131 | – | – | – | 880.47 | 386 | 894.27 | 906.27 | 930.10 | 1.17 | 1.22 | 5.19 | ||
| HQASQFGe | 0.370 | – | – | – | 73.66 | 0.399 | 50.18 | 1.129 | 0.231 | 0.632 | 7.301 | 2485.59 | 1981 | 843.95 | 861.95 | 912.31 | 5.58 | 0.00 | 3.02 | ||
| HzBHQASGf | 0.313 | – | – | – | 69.90 | 0.407 | 50.19 | 1.132 | – | – | – | 902.09 | 428 | 917.55 | 929.55 | 953.99 | 0.00 | 1.76 | 5.83 | ||
| HzBHQASQFGg | 0.313 | – | – | – | 69.84 | 0.401 | 50.18 | 1.134 | 0.231 | 0.635 | 7.215 | 2506.25 | 2023 | 870.16 | 888.16 | 938.71 | 6.38 | 1.85 | 7.46 | ||
| Non-flat XCDM | QSO-Flux | 0.507 | – | – | 75.28 | – | – | – | 0.229 | 0.611 | 7.934 | 1614.59 | 1591 | -55.75 | -41.75 | -4.12 | 11.31 | 0.00 | 9.12 | ||
| HQASGd | 0.300 | – | – | 80.36 | 0.405 | 50.21 | 1.122 | – | – | – | 879.48 | 385 | 894.01 | 908.01 | 935.81 | 0.18 | 2.96 | 10.90 | |||
| HQASQFGe | 0.395 | – | – | 73.48 | 0.411 | 50.21 | 1.112 | 0.230 | 0.627 | 7.441 | 2486.77 | 1980 | 843.65 | 863.65 | 919.61 | 6.76 | 1.70 | 10.32 | |||
| HzBHQASGf | 0.312 | – | – | 69.46 | 0.402 | 50.23 | 1.117 | – | – | – | 904.17 | 427 | 917.07 | 931.07 | 959.58 | 2.08 | 3.28 | 11.42 | |||
| HzBHQASQFGg | 0.316 | – | – | 69.05 | 0.410 | 50.23 | 1.111 | 0.230 | 0.633 | 7.247 | 2516.49 | 2022 | 869.25 | 889.25 | 945.41 | 16.62 | 2.94 | 14.16 |
-
c
.
-
d
H iiG + QSO-AS + GRB.
-
e
H iiG + QSO-AS + GRB + QSO-Flux.
-
f
+ BAO + H iiG + QSO-AS + GRB.
-
g
+ BAO + H iiG + QSO-AS + GRB + QSO-Flux.
| Model | Data set | c | |||||||||||
|---|---|---|---|---|---|---|---|---|---|---|---|---|---|
| Flat CDM | QSO-Flux | – | – | – | – | – | – | – | – | ||||
| HQASGd | – | – | – | – | – | – | – | ||||||
| HQASQFGe | – | – | – | – | |||||||||
| HzBHQASGf | – | – | – | – | – | – | – | ||||||
| HzBHQASQFGg | – | – | – | – | |||||||||
| Non-flat CDM | QSO-Flux | – | – | – | – | – | – | ||||||
| HQASGd | – | – | – | – | – | ||||||||
| HQASQFGe | – | – | |||||||||||
| HzBHQASGf | – | – | – | – | – | ||||||||
| HzBHQASQFGg | – | – | |||||||||||
| Flat XCDM | QSO-Flux | – | – | h | – | – | – | – | – | ||||
| HQASGd | – | – | – | – | – | – | |||||||
| HQASQFGe | – | – | – | ||||||||||
| HzBHQASGf | – | – | – | – | – | – | |||||||
| HzBHQASQFGg | – | – | – | ||||||||||
| Non-flat XCDM | QSO-Flux | – | – | – | – | – | – | ||||||
| HQASGd | – | – | – | – | – | ||||||||
| HQASQFGe | – | – | |||||||||||
| HzBHQASGf | – | – | – | – | – | ||||||||
| HzBHQASQFGg | – | – |
-
c
.
-
d
H iiG + QSO-AS + GRB.
-
e
H iiG + QSO-AS + GRB + QSO-Flux.
-
f
+ BAO + H iiG + QSO-AS + GRB.
-
g
+ BAO + H iiG + QSO-AS + GRB + QSO-Flux.
-
h
This is the 1 limit. The limit is set by the prior, and is not shown here.