A Complete Census of Circumgalactic Mg II at Redshift z 0.5††thanks: Based on data gathered with the 6.5m Magellan Telescopes located at Las Campanas Observatory.
Abstract
This paper presents a survey of Mg II absorbing gas in the vicinity of 380 random galaxies, using 156 background quasi-stellar objects (QSOs) as absorption-line probes. The sample comprises 211 isolated (73 quiescent and 138 star-forming galaxies) and 43 non-isolated galaxies with sensitive constraints for both Mg II absorption and H emission. The projected distances span a range from to 497 kpc, redshifts of the galaxies range from to 0.48, and rest-frame absolute B-band magnitudes range from to . Our analysis shows that the rest-frame equivalent width of Mg II, , depends on halo radius (), -band luminosity() and stellar mass () of the host galaxies, and declines steeply with increasing for isolated, star-forming galaxies. At the same time, exhibits no clear trend for either isolated, quiescent galaxies or non-isolated galaxies. In addition, the covering fraction of Mg II absorbing gas is high with % at kpc for isolated galaxies and declines rapidly to at kpc. Within the gaseous radius, the incidence of Mg II gas depends sensitively on both and the specific star formation rate inferred from H. Different from what is known for massive quiescent halos, the observed velocity dispersion of Mg II absorbing gas around star-forming galaxies is consistent with expectations from virial motion, which constrains individual clump mass to and cool gas accretion rate of . Finally, we find no strong azimuthal dependence of Mg II absorption for either star-forming or quiescent galaxies. Our results demonstrate that multiple parameters affect the properties of gaseous halos around galaxies and highlight the need of a homogeneous, absorption-blind sample for establishing a holistic description of chemically-enriched gas in the circumgalactic space.
keywords:
surveys – galaxies: halos – intergalactic medium – quasars: absorption lines – galaxies: formation1 Introduction
Over the past decades, extensive progress has been made to understand the impact of the baryon cycle on galaxy formation and evolution, with particular focus on gas reservoirs such as the circumgalactic medium (CGM). Located in the space between galaxies and the intergalactic medium (IGM), the CGM contains critical information on gas accretion and outflows, processes that drive the evolution of galaxies (see Chen, 2017; Tumlinson et al., 2017, for recent reviews). Thus, the CGM provides an excellent laboratory for understanding the physical processes that drive the formation and evolution of galaxies.
Absorption-line spectroscopy of background quasars has provided a unique probe of the low-density CGM, which is otherwise too diffuse to be detected in emission beyond the local Universe. Over the last decade, statistically significant samples of galaxies at have been assembled using a combination of space- and ground-based telescopes. The Cosmic Origins Spectrograph (COS) on the Hubble Space Telescope (HST) has enabled studies of a rich suite of absorption lines including the HI Lyman series (e.g., Chen et al., 1998; Tripp et al., 1998; Rudie et al., 2013; Tumlinson et al., 2013; Werk et al., 2014; Liang & Chen, 2014; Borthakur et al., 2016), the O VI doublet (e.g., Chen & Mulchaey, 2009; Prochaska et al., 2011; Tumlinson et al., 2011; Johnson et al., 2015a) and the C IV doublet (e.g., Borthakur et al., 2013; Bordoloi et al., 2014; Liang & Chen, 2014).
From the ground, at the majority of studies have focused on the measurement of the Mg II doublets due to their strength and visibility in the optical range. This transition is thought to arise primarily in photoionized gas of temperature (Bergeron & Stasińska, 1986; Charlton et al., 2003) and high neutral hydrogen column density clouds of (Rao et al., 2006) for Å absorbers. Many investigations have been carried out to characterize the statistical properties of Mg II absorbers, including the frequency distribution function, redshift evolution of the absorber number density and kinematic signatures (e.g. Lanzetta et al., 1987; Petitjean & Bergeron, 1990; Charlton & Churchill, 1998; Churchill et al., 2000; Churchill et al., 2003; Nestor et al., 2005). Studies also show that Mg II absorbing gas probes the underlying gas kinematics around galaxies (e.g.,outflow and inflow gas. Weiner et al., 2009; Kacprzak et al., 2012; Rubin et al., 2014; Ho et al., 2017; Ho & Martin, 2020).
To have a comprehensive understanding of the baryonic structures around galaxies, significant progress has been made in constructing samples of galaxy-Mg II absorber pairs to understand the correlation between cool, enriched gas and galaxy properties. On the one hand, some galaxy-Mg II pair associations begin with quasar spectra and then search for nearby galaxies responsible for the Mg II absorption (e.g. Kacprzak et al., 2011). Such studies commonly target galaxies already known to have Mg II absorption in the spectra of background quasars and therefore may result in biased galaxy populations. On the other hand, studies have investigated relationships between galaxies and their surrounding gas using unbiased samples, where the galaxy-QSO pairs are chosen without any prior knowledge of the presence or absence of absorbing gas, allowing detailed studies of the CGM as a function of galaxy properties (including stellar mass, star formation rate and color) and environment (e.g. Chen et al., 2010a; Johnson et al., 2015b; Huang et al., 2016; Zahedy et al., 2016; Lan & Mo, 2018; Martin et al., 2019).
As the Mg II doublet features start to be observable in the optical wavelengths at , this transition has not been studied as extensively at . Here we make use of the UV sensitive spectrograph, the Magellan Echellette Spectrograph (MagE; Marshall et al., 2008), to perform searches for Mg II absorbers at redshifts as low as . Building upon the SDSS database, we conduct the Magellan MagE Mg II (M3) Halo Project in the spectra of background QSOs at . The main goal of the M3 Halo Project is to establish an unbiased, statistically significant sample of Mg II absorbers to constrain the incidence, strength and extent of Mg II absorbing gas around galaxies of different properties.
The first-year results of the M3 Halo Project is reported in Chen et al. (2010a) (hereafter C10). With a spectroscopic sample of 94 galaxies at a median redshift of and projected distance , Chen et al. (2010a, b) investigated the possible correlations between the incidence and extent of Mg II absorbers and galaxy properties. We found the rest-frame equivalent width of Mg II () declines steeply with increasing from the galaxies. Moreover, the extent of Mg II gaseous halos scales strongly with the galaxy band luminosity and galaxy stellar masses, with slight dependence on specific star formation rate (sSFR) and no dependence on galaxy color. The first-year results clearly demonstrate that Mg II absorbing gas is strongly connected to the physical properties of host galaxies. Using the full sample of the M3 Halo Project, we will show that we are able to observe a clear difference in surrounding gas properties between star-forming and quiescent galaxies.
The paper is organized as follows. In Section 2, we describe the experimental design of the M3 Halo Project, and the spectroscopic observations and data reduction of the photometrically selected galaxies and spectroscopically confirmed quasars in the SDSS archive. We present the catalogs of galaxies and Mg II absorbers in Section 3. In Section 4, we describe our likelihood analysis and characterize the correlation between Mg II absorption strength and galaxy properties. In Section 5, we discuss the covering fraction, the kinematics and the azimuthal dependence of Mg II absorbing gas. We discuss the difference between different types of galaxies, the difference between isolated and non-isolated galaxies, and compare our results with previous studies. We present a summary of our findings in Section 6. We adopt the standard cosmology, = 0.3 and =0.7 with a Hubble constant .
| ID | RA(J2000) | Dec(J2000) | Instrument | Exptime | UT Date | ||
| SDSSJ000548.29084757.25 | 00:05:48.29 | 08:47:57.25 | 19.2 | MagE | 2009 Oct 19 | ||
| SDSSJ000548.59084801.16 | 00:05:48.59 | 08:48:01.14 | 19.4 | MagE | 2009 Oct 19 | ||
| SDSSJ001335.12+141439.54 | 00:13:35.12 | +14:14:39.55 | 20.9 | DIS | 2008 Dec 22 | ||
| SDSSJ001336.14+141428.04 | 00:13:36.14 | +14:14:28.01 | 19.5 | DIS | 2008 Dec 22 | ||
| SDSSJ003009.52+011445.25 | 00:30:09.52 | +01:14:45.25 | 17.7 | SDSS | … | … | |
| SDSSJ003009.90+011343.95 | 00:30:09.90 | +01:13:43.95 | 21.0 | SDSS | … | … | |
| SDSSJ003010.18+011219.92 | 00:30:10.18 | +01:12:19.92 | 18.5 | SDSS | … | … | |
| SDSSJ003012.84+011131.36 | 00:30:12.84 | +01:11:31.36 | 17.0 | SDSS | … | … | |
| SDSSJ003014.16+011359.19 | 00:30:14.17 | +01:13:59.14 | 20.8 | DIS | 2009 Nov 9 | ||
| SDSSJ003016.41+011406.90 | 00:30:16.41 | +01:14:06.90 | 21.2 | SDSS | … | … | |
| The full table is available in the on-line version of the paper. | |||||||
2 OBSERVATIONS
2.1 Experiment Design
To investigate the correlation between galaxy properties and Mg II absorbing gas at small projected distances, we need to obtain spectroscopic data of both galaxies and QSO absorbers along common sightlines. We utilize the Magellan Echellette Spectrograph (MagE; Marshall et al., 2008) on the Magellan Clay Telescope to conduct a survey of Mg II absorbers at . The high UV throughput of MagE from Å enables searches of Mg II absorbers at redshift as low as 0.11. We refer the reader to C10 for a detailed description of the survey design. Briefly, the QSO and galaxy pairs are selected from the SDSS DR6 catalogs (Adelman-McCarthy et al., 2008). To maximize the efficiency of searching Mg II absorbers, we consider galaxies at photometric redshifts of that have background QSOs in close projected distance . is the distinct boundary found by Chen & Tinker (2008) using 23 galaxy-QSO pairs at intermediate redshifts of , beyond which no Mg II absorbers are found. Note that although we pre-select galaxy-QSO pairs with for the spectroscopic followup survey, we also search the public SDSS DR14 sample (Abolfathi et al., 2018) to include galaxies with spectroscopic redshifts at around our observed QSOs to study the gaseous halo beyond . Therefore, the properties of Mg II absorbing gas around galaxies are studied both within and beyond in our survey. We reiterate that the galaxy-QSO pairs are chosen without any prior knowledge of the presence or absence of absorbing gas. In the following sections, we describe the galaxy spectroscopic sample either obtained from our own observations or SDSS DR14 archive and the observations of background quasars.
2.2 Galaxy Spectroscopy
To establish a physical connection between galaxies and Mg II absorbing systems along nearby QSO sightlines, it is essential to have medium to high resolution spectra to obtain precise and accurate redshift measurements of these galaxies. We have obtained optical spectra of 218 galaxies that satisfy the criteria described above using the MagE Spectrograph (Marshall et al., 2008) at the Las Campanas Observatory and the Double Imaging Spectrograph (DIS; Lupton, 1995) on the 3.5 m telescope at the Apache Point Observatory. Details about the spectroscopic observation setups and data reduction are presented in C10. In summary, we acquired 120 long-slit galaxy spectra using DIS over the period from 2008 August through 2010 September, and echellette spectra of 98 galaxies using MagE from 2008 August to 2011 March. The spectra obtained using DIS and MagE have intermediate resolution of FWHM and 150 in the wavelength range between 4000Å and . We reduced the DIS spectroscopic data using standard long-slit spectral reduction procedures, and the MagE spectra using the software developed by G. Becker with a slight modification to work with binned spectral frames. The redshifts of these galaxies were determined using a cross-correlation analysis with a linear combination of SDSS galaxy eigen spectra The typical redshift uncertainty is and 0.0001 for galaxy spectra taken using DIS and MagE.
We include 17 additional SDSS DR14 galaxies which already have reliable spectroscopic redshifts in the SDSS archive with projected distance in our galaxy sample. We have also extended our search to in the SDSS archive and located 145 SDSS galaxies with accurate spectroscopic redshifts available. Combined with our own observations, we have a total of 380 galaxies at in our final galaxy sample for searches of Mg II absorbers. A journal of the observations of the full galaxy sample is presented in Table 1.
| ID | RA(J2000) | Dec(J2000) | Exptime | UT Date | ||
| SDSSJ000548.24084808.44 | 00:05:48.24 | 08:48:08.44 | 1.19 | 17.96 | 2009 Oct 19 | |
| SDSSJ001335.75+141424.07 | 00:13:35.75 | +14:14:24.07 | 1.54 | 19.32 | 2009 Oct 20 | |
| SDSSJ003013.91+011405.14 | 00:30:13.91 | +01:14:05.14 | 1.46 | 18.12 | 2010 Jul 13 | |
| SDSSJ003340.21005525.53 | 00:33:40.21 | 00:55:25.53 | 0.94 | 17.99 | 2008 Sep 23 | |
| SDSSJ003407.35085452.12 | 00:34:07.35 | 08:54:52.12 | 1.31 | 18.59 | 2008 Sep 24 | |
| SDSSJ003413.04010026.86 | 00:34:13.04 | 01:00:26.86 | 1.29 | 17.33 | 2008 Sep 23 | |
| SDSSJ010135.84005009.08 | 01:01:35.84 | 00:50:09.08 | 1.01 | 19.31 | 2008 Sep 24 | |
| SDSSJ010156.32084401.74 | 01:01:56.32 | 08:44:01.74 | 0.98 | 18.29 | 2008 Sep 25 | |
| SDSSJ010205.89+001156.99 | 01:02:05.89 | +00:11:56.99 | 0.72 | 17.59 | 2009 Oct 18 | |
| SDSSJ010352.47+003739.79 | 01:03:52.47 | +00:37:39.79 | 0.70 | 18.36 | 2008 Sep 25 | |
| The full table is available in the on-line version of the paper. | ||||||
2.3 Echellette Spectra of QSOs
Echellete spectroscopic observations of 156 QSOs were obtained using the MagE spectrograph (Marshall et al., 2008) on the Magellan Clay telescope over the period from 2008 January through 2011 June. The majority of QSOs were observed using a slit, yielding a typical spectral resolution of FWHM 70 . All the QSO spectra were processed and reduced using the data reduction software developed by G. Becker. We refer the reader to C10 for details of observations and spectral reduction procedures. In brief, we first performed the wavelength and flux calibrations, and co-added the individual echellete orders to form a single contiguous spectrum across the spectral range from Å to . The individual order-combined exposures were then continuum normalized and finally were stacked to form the final reduced spectrum. Ths S/N per resolution element is 10 at wavelengths greater than Å( 0.14), leading to a 2 upper limit of Å. For galaxies at lower redshifts, the error blows up and the S/N per resolution element can be as low as . We present a journal of the spectroscopic observations of the QSOs in Table 2.
3 THE GALAXY AND Mg II ABSORBER CATALOGS
3.1 Galaxy properties
We have constructed a full sample of 380 galaxies with robust redshift measurements in the vicinity of 156 distant background QSO sightlines. Among these galaxies, 103 galaxies are found to have at least one spectroscopic neighbor at projected distance and radial velocity difference smaller than 1000 . The presence of close neighbors imply that these galaxies are likely to reside in a group environment, where the interactions of group members may change the correlation between galaxy properties and their gaseous halos. We also performed a literature search and identified 9 galaxies that are either previously known merging systems, galaxy groups or clusters (e.g., Koester et al., 2007; Hao et al., 2010; Smith et al., 2012; Johnson et al., 2014). To avoid the confusion of associating Mg II absorbers with host galaxies, we classify these galaxies as “non-isolated” galaxies and discuss them separately. The criteria yielded a sample of 277 “isolated” galaxies and 103 “non-isolated” galaxies.
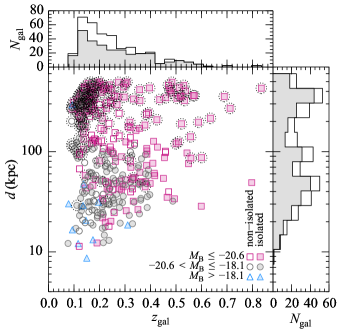
We first present the projected distance versus redshift distribution of the full galaxy sample in Figure 1. The isolated and non-isolated galaxies are presented in solid and open symbols. The redshifts of the galaxies range from to with a median of . Using our own DIS and MagE observations, we measure redshifts of 218 galaxies and find that the SDSS photometric redshift measurements are accurate to within a median residual of = 0.05 with a rms scatter of . We find that 91 % of galaxies (198 out of 218) have redshifts at , showing that the target selection based on photometric redshifts is effective in identifying foreground galaxies at our targeted redshift range.
For our own observations, the projected distances of the QSOs range from kpc with a median of kpc. 18% (39 out of 218) galaxies have projected distance , and only one galaxy has , showing that our QSO-galaxy pair selection effectively probes properties of gaseous halos close to the host galaxies. The SDSS galaxies occupy predominantly the regime of large projected distances, where 40 galaxies have and the remaining 122 galaxies extend out to . The full galaxy sample has with a median of kpc. In Figure 1, we also adopt various colors and symbols to highlight different ranges of galaxy luminosity. We estimate a -band luminosity for each galaxy following the steps in Chen et al. (2010a), and find that the full galaxy sample spans a wide range of -band luminosity. The sample has 200 luminous galaxies () spanning a range in their projected distance to a QSO sightline from to , and 169 sub- galaxies () covering a range from to . The sample also includes 11 low-luminosity dwarf galaxies with from to .
While -band luminosity is known to scale with halo mass (e.g., Yang et al., 2005; Tinker et al., 2007), it is also found to correlate with [O II] luminosity despite a large scatter (Zhu et al., 2009). To have a more robust tracer of dark matter halo mass, we also calculate the total stellar mass (More et al., 2011) and H equivalent width as an indicator of star formation. We estimate the stellar mass according to Johnson et al. (2015a, Equation 1 and 2). Briefly, they use low-redshift galaxies of in the NASA-Sloan Atlas (e.g. Maller et al., 2009) to derive the relation between stellar mass and rest-frame - and - band absolute magnitudes. The relation can well reproduce the NASA-Sloan altas stellar masses with a systematic error of less than 0.02 dex and a 1- scatter of less than 0.15 dex over the entire range of our galaxy absolute -band magnitudes. They also show that the systematic error induced by the redshift evolution of the mass-to-light ratio relation for galaxies is less than 0.1 dex. We estimate the rest-frame - and - band absolute magnitudes by interpolation of observed SDSS bands. For fainter galaxies with - detection in -band absolute magnitude, we calculate the stellar mass using the relation between stellar mass and single rest-frame -band magnitude in Liang & Chen (2014), which is also derived using the NASA-Sloan Atlas sample.
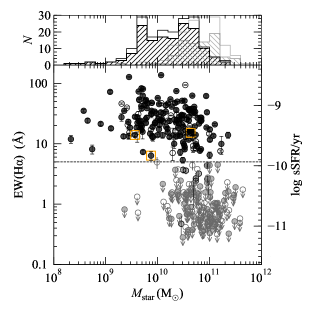
We measure the equivalent width of the H emission line for each galaxy spectrum, adopting the window definitions from Yan et al. (2006). The stellar mass as a function of H equivalent width, EW(H), is presented in Figure 2. We also show on the right axis the inferred specific star-formation rate (sSFR) following Equations (2) & (4) in Fumagalli et al. (2012). We mark cyan squares around galaxies likely to be dominated by an AGN (active galactic nucleus), based on the classification scheme derived by Kewley et al. (2001) with the optical line ratios N II/H and [O III]/H. We find that there seems to be a clear distinction at EW(H) 5 Å. Below EW(H)=5 Å, only 15 out of 146 galaxies (10%) have detected H emission at a 2- level. At EW(H)5 Å, most galaxies (98%) have detected H, except for 3 galaxies with low S/N spectra. We therefore divide our galaxies into “star-forming” and “quiescent” galaxy samples using the criterion of whether their EW(H) are greater than 5 Å. A total of 327 out of 380 galaxies have high enough S/N measurements on the H emission, where 184 (143) are classified as star-forming (quiescent) galaxies. The cut essentially limits our galaxy sample to , beyond which the observed H emission is red-shifted to and falls outside of the wavelength range of the optical spectrographs. We find that our full sample spans a wide range in stellar mass, from to with a median . The star-forming galaxies have lower stellar mass from with a median of , while the quiescent galaxy sample has higher stellar mass from with a median of .
3.2 Absorber Properties
For each galaxy in our sample, we searched for the corresponding Mg II absorption doublet in the echellette spectra of the background QSO within a radial velocity difference of the galaxy redshift. When a Mg II absorber was identified, we measured its rest-frame equivalent width and associated error by direct integration over the line region in our continuum normalized spectrum. We accepted the absorption lines according to a 2 detection threshold, which is appropriate since the searches are performed at known galaxy redshifts. We then determined the absorber redshift based on the best-fit line centroid of a Gaussian profile analysis of Mg II . In cases where no Mg II features are detected, we placed 2 upper limits on the Mg II equivalent widths. For “non-isolated” systems, we calculate the luminosity-weighted projected position and redshift using members in each system and obtain its associated absorber properties following the same procedure.
In summary, the procedure yielded 85 physical galaxy-Mg II pairs and 126 upper limits in the vicinities of 211 isolated galaxies, and 18 Mg II absorbers and 25 upper limits around 43 “non-isolated” systems. We were not able to obtain significant constraints for Mg II absorption equivalent widths around 14 galaxies and 2 “non-isolated” systems, where the expected QSO spectra are contaminated by other strong absorption features (e.g. C IV 1548, 1550) or the atmosphere O3 absorption complex at . Also, six galaxies and two “non-isolated” systems were found at spectroscopic redshifts , falling outside the wavelength range of the MagE spectrograph. We present the properties of each spectroscopically confirmed galaxy sample in Table 3 (Columns ), and the associated redshift and absorption equivalent width of Mg II absorbers in Columns 11 and 12 of Table 3.
| Galaxies | Absorption Systems | |||||||||||
| EW(H) | ||||||||||||
| ID | (arcsec) | (arcsec) | (kpc) | (kpc) | (Å) | (Å) | ||||||
| (1) | (2) | (3) | (4) | (5) | (6) | (7) | (8) | (9) | (10) | (11) | (12) | |
| SDSSJ001336.14+141428.04 | 0.1910 | 21.9 | 19.52 | 9.7 | 143.9 | 20.8 1.2 | 0.1908 | 1.30 0.13 | ||||
| SDSSJ003009.52+011445.25 | 0.1845 | 238.7 | 17.72 | 10.7 | 247.7 | 40.9 0.7 | 0.1845 | 0.10 | ||||
| SDSSJ003010.18+011219.92 | 0.1501 | 311.6 | 18.48 | 10.4 | 200.6 | 49.7 0.4 | 0.1501 | 0.13 | ||||
| SDSSJ003014.16+011359.19 | 0.2125 | 24.7 | 20.81 | 9.7 | 142.9 | 19.4 4.0 | 0.2126 | 0.37 0.05 | ||||
| SDSSJ003339.86005522.39 | 0.2124 | 21.9 | 18.99 | 9.8 | 149.0 | 46.7 2.9 | 0.2121 | 1.05 0.03 | ||||
| SDSSJ003406.33085448.74 | 0.1403 | 38.5 | 18.04 | 10.6 | 228.1 | 0.7 | 0.1403 | 0.14 | ||||
| SDSSJ003407.78085453.28 | 0.3617 | 32.8 | 21.59 | 9.8 | 134.7 | 50.7 3.0 | 0.3616 | 0.48 0.05 | ||||
| SDSSJ003411.94005808.52 | 0.1539 | 372.2 | 19.20 | 9.7 | 149.0 | 80.7 1.4 | 0.1539 | 0.14 | ||||
| SDSSJ003412.85010019.81 | 0.2564 | 30.4 | 20.08 | 10.3 | 184.1 | 3.7 | 0.2564 | 0.61 0.06 | ||||
| SDSSJ003414.49005927.51 | 0.1202 | 136.9 | 17.27 | 10.7 | 267.4 | 1.4 | 0.1212 | 0.21 | ||||
| non-isolated Galaxies | ||||||||||||
| SDSSJ000548.29084757.25 | 0.3293 | 53.2 | 19.21 | 11.0 | 297.9 | 1.9 0.5 | 0.3288 | 0.11 0.02 | ||||
| SDSSJ000548.59084801.16 | 0.3293 | 42.4 | 19.43 | 10.8 | 251.4 | 0.6 | … | … | ||||
| SDSSJ003339.66005518.39 | 0.1760 | 32.5 | 19.66 | 10.1 | 172.4 | 1.1 | 0.1759 | 0.19 0.04 | ||||
| SDSSJ003341.48005522.82 | 0.1758 | 57.4 | 20.79 | 9.4 | 133.1 | 20.6 3.0 | … | … | ||||
| SDSSJ003357.90085356.03 | 0.1381 | 367.9 | 17.76 | 10.6 | 235.0 | 0.7 | 0.1381 | 0.22 | ||||
| SDSSJ010133.65005028.98 | 0.2605 | 154.9 | 17.98 | 11.2 | 409.4 | 0.8 | 0.2605 | 0.10 | ||||
| SDSSJ012557.41000749.58 | 0.2574 | 359.3 | 18.66 | 11.0 | 302.5 | 0.4 | 0.2569 | 0.79 0.04 | ||||
| SDSSJ012603.20000827.82 | 0.2571 | 24.6 | 18.55 | 10.8 | 255.4 | 1.5 | … | … | ||||
| SDSSJ020111.79002537.67 | 0.1568 | 296.8 | 19.44 | 9.9 | 158.1 | 47.7 1.6 | … | … | ||||
| SDSSJ020117.91002559.59 | 0.1577 | 291.5 | 18.97 | 10.3 | 189.6 | 1.4 | … | … | ||||
| SDSSJ020119.90002831.16 | 0.1602 | 322.4 | 17.83 | 10.8 | 271.5 | 0.7 | 0.1602 | 0.15 | ||||
| The full table is available in the on-line version of the paper. | ||||||||||||
The final isolated galaxy-absorber pair sample spans a projected distance range of kpc with a median of kpc. The redshifts of the isolated galaxies range from with a median of , and the rest-frame absolute -band magnitudes range from to with a median of . The “non-isolated” systems span a redshift range of with a median of , with projected distance from kpc with a median of kpc.
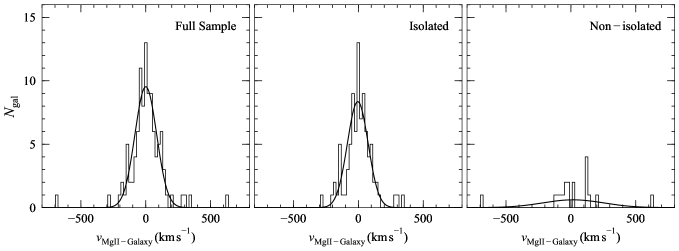
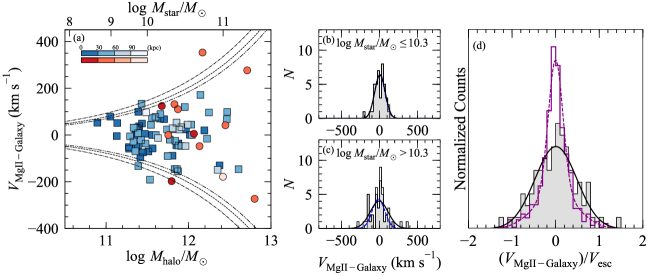
We examine the relative velocity distribution of Mg II absorbers with respect to the systematic redshifts of the galaxies. In the left panel of Figure 3 we present the velocity dispersion of the detected Mg II absorbing gas around the full galaxy-absorber pair sample. We also show the velocity dispersion separately for isolated and non-isolated galaxy-absorber pairs in the central and right panels of Figure 3. We characterize the velocity distribution using a Gaussian profile with iterative 3-sigma clipping to exclude outliers. The velocity distribution of Mg II absorbing gas around galaxies can be characterized by a single Gaussian distribution of mean velocity difference and dispersion (left-hand panel of Figure 3), while the velocity distribution for isolated galaxies is best represented by a Gaussian profile centered at and . For “non-isolated” systems, we find the associated Mg II absorbers have a broad velocity distribution with a standard deviation of .
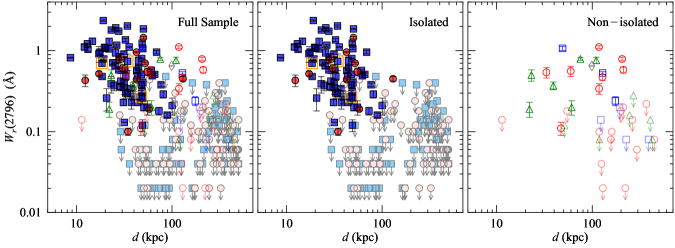
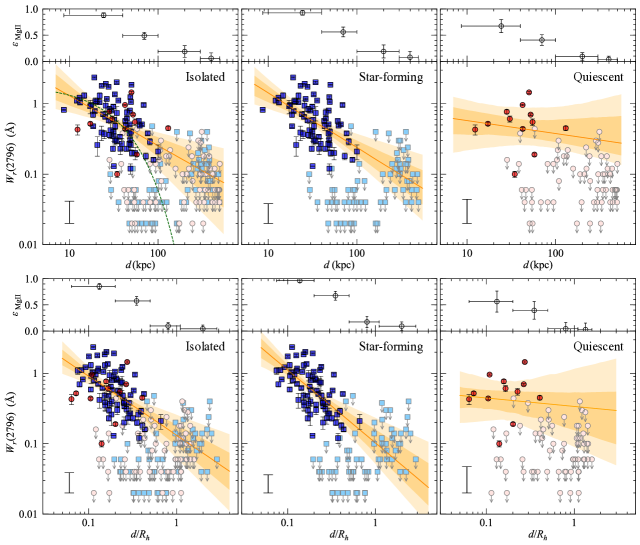
We present in Figure 4 the correlation between the strength of Mg II absorption and galaxy projected distance. Following the presentation in Figure 3, we show the distributions separately for isolated and non-isolated galaxies to investigate the influence of galaxy environment. Similar to previous surveys (e.g. Chen et al., 2010a), we find a clear trend of decreasing absorption strength with increasing projected distance for isolated galaxies (see the middle panel of Figure 4). Beyond 70 kpc, no Mg II absorbing gas with is found, and no detections are present beyond projected distance kpc (). In contrast, while non-isolated systems do have lower Mg II covering fraction at larger projected distance , we do not find a clear anti-correlation between the and . The strong Mg II absorbers of are detected out to 150 kpc. Note that using the projected distance of the nearest galaxy in non-isolated systems as does not change the lack of anti-correlation in the versus plot.
To determine whether the recent star formation of galaxies has an impact on Mg II absorbing gas, we further divide the isolated galaxy sample into star-forming and quiescent galaxy samples and show the distributions of versus projected distance in the upper panels of Figure 5. While both galaxy samples appear to occupy a similar versus space, qualitatively the star-forming galaxies show strong inverse correlation whereas only a modest trend is revealed for quiescent galaxies.
4 Analysis
In the previous section, we use the samples of 211 isolated galaxies (73 quiescent galaxies and 138 star-forming galaxies) and 43 non-isolated galaxies to show that the strength and incidence of Mg II absorbing gas appear to depend on galaxy properties. In this section, we quantify the correlation between and different galaxy properties. We obtain and assess various models that well describe the data and present the best-fit results.
4.1 Fitting Procedure and Model Evaluation
We perform a likelihood analysis to obtain the best-fit models and to better characterize the correlation between galaxy properties and Mg II absorbers. The generalized functional form to describe the mean Mg II absorption equivalent width is
| (1) |
where ’s are independent measurements of galaxy properties including projected distance (), rest-frame absolute band luminosity () and stellar mass (). We adopt a simple power-law profile to describe the correlation between , and other properties. In logarithmic space, the model is expressed as a linear equation
| (2) |
In addition, we introduce a non-parametric covering fraction in the model to describe the clumpy nature of Mg II gaseous halos. This is motivated by our findings that the covering fraction of Mg II absorbing gas may be less than unity and varying at different projected distances. As shown in Figure 4, a non-negligible fraction of galaxies at small projected distances ( kpc) do not give rise to Mg II absorption to sensitive upper limits, and we find an increasing fraction of upper limits at larger projected distances. We divide the mean covering fraction into four projected distance intervals. To obtain a better sampling of at small projected distances, the first two bins () are designed for , where most Mg II absorbers are found. The other two bins () are used for larger projected distances, each with a roughly equal number of galaxies.
Here we perform the maximum likelihood analysis to determine the values of coefficients and four mean covering fractions that best represent the data. The likelihood function is defined as
| (3) |
where represents the probability density function that the QSO sightline intercepts the Mg II gas around galaxy and its strength () follows the underlying power-law model, and denotes the pdf that the QSO sightline does not intercept any Mg II gas around galaxy . Here is the non-parametric mean covering fraction given the projected distance of galaxy (). The two probability density functions and are weighted according to the mean covering fraction () and combined to get the likelihood function of a single galaxy .
The first probability density function is expressed as
| (4) |
where is the observed for galaxy , is the model expectation, and is the measurement error of . Specifically, the first term takes into account the intrinsic scatter () of a given model expectation () due to variations between individual galaxies and between different sightlines probing the same galaxy (e.g. Chen et al., 2014). Motivated by Figure 4 and previous studies (e.g., Chen et al., 2010a), we model the intrinsic scatter as a constant in logarithmic space, independent of galaxy properties and projected distance. The second term represents the pdf of a normal distribution induced by measurement uncertainty .
On the other hand, is defined simply as a normal distribution with measurement error and a mean consistent with absence of gas (i.e. zero)
| (5) |
We note that for each non-detection, we also measure the rest-frame equivalent width by direct summation of the continuum normalized spectrum over a resolution element, centering at the systematic redshift of the galaxy. This allows us to appropriately exploit the constraints from both detections and non-detections the same way. We multiply the likelihood function of each galaxy over a total of target galaxies to obtain the total likelihood function in Equation 3. We assess the confidence intervals of derived model parameters using the Markov Chain Monte Carlo (MCMC) method.
4.2 Dependence of Extended Gas on Galaxy Projected Distance
First, we seek the best-fit models to describe the dependence of on (see the upper left panel of Figure 5; Model I). The maximum likelihood solution for isolated galaxies is
| (6) |
with an intrinsic scatter in common logarithm. Note that is a simple conversion of (see Equation 4) from natural to common logarithm. The errors in the coefficients are 1 uncertainties. The non-parametric covering fractions are , , , and . The intervals of the covering fraction bins are listed in Table 4. The maximum likelihood solution shows a significant anti-correlation ( level) between the Mg II absorption strength and projected distance . Our results also show that the mean gas covering fraction declines steeply as the projected distance increases. We note that the inferred low covering fraction at kpc may be driven by weak absorbers (i.e. 0.04Å) for which our data have insufficient S/N to uncover.
To understand the influence of galaxy types on their Mg II absorbing gas properties, we also obtain the best-fit models for isolated star-forming and quiescent galaxy samples (respectively the upper middle and right panels of Figure 5). For star-forming galaxies, we find based on the likelihood analysis a best-fit model
| (7) |
with an intrinsic scatter and mean covering fractions of , , , and . Similar to the full sample, the and incidence of gas for star-forming galaxies both decrease as increasing projected distance. For quiescent galaxies, however, the dependence of Mg II absorbing gas and projected distance reveals a stark contrast. The best-fit power-law model from the likelihood analysis yields
| (8) |
with and covering fractions of , , , and . While the best-fit mean covering fractions decline with increasing , they are lower compared to that of the star-forming ones at kpc. Furthermore, the maximum likelihood solution shows no statistically significant dependence between Mg II absorption strength and among detections.
In Figure 2, we show that the star-forming galaxy sample spans a wide range of stellar masses from , while quiescent galaxies have on average higher stellar masses ranging from . It has been shown in observations (e.g., Chen et al., 2010b) and theoretical models (e.g., Mo & Miralda-Escude, 1996; Maller & Bullock, 2004) that more massive galaxies tend to have more extended gaseous halos. To address whether the apparent differential observed versus plane between star-forming and quiescent galaxy samples can be affected by the gaseous halos with various sizes, we estimate the dark matter halo radius () of individual galaxies and examine how Mg II absorption strength varies with -normalized projected distance (). The halo radius is calculated following the prescription in Liang & Chen (2014). Specifically, we obtain halo mass () using the stellar-mass-to-halo-mass relation derived in Kravtsov et al. (2018), and is then converted to with standard cosmology (Bryan & Norman, 1998).
We present the correlation between and galaxy -normalized projected distance () in the lower panels of Figure 5 (Model II). We note that Mg II absorbing gas declines steeply beyond 0.4 . Essentially only one galaxy at has an associated Mg II absorber. The maximum likelihood solution for the full isolated galaxy sample is
| (9) |
with an intrinsic scatter and covering fractions of , , , and .
We find that after accounting for the mass scaling of gaseous radius, the slope of the anti-correlation is steepened by 17% and becomes more statistically significant. For the isolated star-forming galaxies, we obtain a similar improvement based on the likelihood analysis
| (10) |
with an intrinsic scatter and covering fractions of , , , and . The best-fit result also shows a steeper slope by 32% and a significance of the anti-correlation. In contrast, including scaling with does not improve the observed versus anti-correlation for the quiescent galaxy sample. We find a best-fit model of
| (11) |
with an intrinsic scatter and covering fractions of , , , and . The observed Mg II absorption strength versus remains consistent with a flat distribution.
On the other hand, previous studies have shown that galaxy -band luminosity, which is a direct observable, also has an impact on both the extent of Mg II absorbing gas and absorption strength (e.g. Chen & Tinker, 2008; Chen et al., 2010a). Therefore, we include rest-frame -band magnitude in the power-law model ( in Equation 2) to examine how Mg II absorber strength scales with (Model III). We adopt from Faber et al. (2007), the characteristic -band magnitude for describing blue galaxy population at . Based on the maximum likelihood analysis, we find the Mg II gaseous extent scales with and following
| (12) |
with an intrinsic scatter of and covering fractions of , , , and . The results show that including the intrinsic -band luminosity also leads to a steeper slope of the anti-correlation between and . Note that has a negative correlation coefficient, consistent with the expectation that brighter galaxies have larger extent of gas.
For star-forming galaxies, we also perform the likelihood analysis and find the observed absorber strength is best described by
| (13) |
with an intrinsic scatter and covering fractions of , , , and . The results show trends similar to the full isolated galaxy sample. We find a steeper anti-correlation between versus and an anti-correlation between absorption strength and . The intrinsic scatter is slightly smaller than the results obtained without the scaling of -band luminosity.
For quiescent galaxies, we obtain a best-fit model of
| (14) |
with an intrinsic scatter and covering fractions of , , , and . Contrary to the star-forming galaxies, we do not find strong correlation between and . A slight negative correlation between and is shown. The addition of scaling in the power-law model does not seem to reduce the intrinsic scatter of the versus relation.
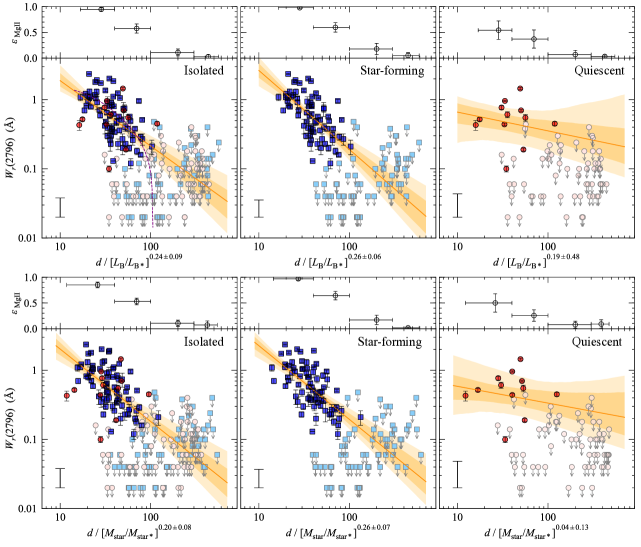
It is notable that although is known to scale with halo mass (e.g., Zheng et al., 2007), it also correlates with [O II] luminosity (e.g., Zhu et al., 2009) and thus might be coupled with recent star-formation. Here we inspect the correlation between and total stellar mass , which is believed to be a good tracer of halo mass (More et al., 2011) (Model IV).
We obtain the best-fit models with the scaling of total stellar mass of
| (15) |
where . The best-fit intrinsic scatter is and best-fit covering fractions are , , , and . The best-fit coefficients show a positive correlation between and , and an anti-correlation between and , consistent with the results accounting for .
Next, based on the likelihood analysis the star-forming galaxy sample has a best-fit model of
| (16) |
with an intrinsic scatter and covering fractions of , , , and .
For quiescent galaxies, the best-fit model with the scaling of stellar mass is
| (17) |
with an intrinsic scatter and covering fractions of , , , and . The results of the likelihood analyses are summarized in Table 4.
Finally, to assess the significance of the anti-correlation without model dependence, we also perform a non-parametric, generalized Kendall’s test (Feigelson & Nelson, 1985) that accounts for the presence of non-detections. The results of Kendall’s test are presented in Table 4. We find that the versus for isolated galaxies deviate from a random distribution at more than an 11 level. The is anti-correlated with at level of significance for isolated, star-forming galaxies. The distribution of versus after accounting for , or shows similar level of significance. For isolated, quiescent galaxy sample, the significance of the generalized Kendall test is at level, weaker than the significance for star-forming galaxy sample. In our likelihood analysis, we treat an upper limit as either the QSO sightline intercepts Mg II gas but below the detection limit or simply does not intercept Mg II gas. The generalized Kendall test considers all data to follow a single distribution and therefore sensitive upper limits contribute significantly to the anti-correlation in the generalized Kendall test compared to the likelihood analysis.
| Model I | |||||||||
|---|---|---|---|---|---|---|---|---|---|
| full | … | ||||||||
| blue | … | ||||||||
| red | … | ||||||||
| Model II | |||||||||
| Rh-full | … | ||||||||
| Rh-blue | … | ||||||||
| Rh-red | … | ||||||||
| Model III | |||||||||
| MB-full | |||||||||
| MB-blue | |||||||||
| MB-red | |||||||||
| Model IV | |||||||||
| Mstar-full | |||||||||
| Mstar-blue | |||||||||
| Mstar-red | |||||||||
| represents the mean covering fraction within in or normalized . | |||||||||
5 Discussion
We have established a spectroscopic sample of 211 isolated galaxies and 43 non-isolated galaxies with constraints on Mg II absorption from background quasars at projected distances of kpc. We characterized the cool gas contents of galaxy host halos as a function of projected distance. We performed likelihood analysis for the isolated galaxies to study the dependence of Mg II gas on galaxy projected distance . Here, we present the observed mean covering fraction () of MgII absorbing gas and examine how the incidence of cool gas varies with galaxy properties (i.e. -band magnitude, stellar mass and H equivalent width). We discuss the kinematics, physical conditions and azimuthal dependence of these MgII absorbers. Finally, we discuss the properties of gaseous halos around different host galaxies and compare our results with previous studies.
5.1 Covering fraction of Mg II absorbers
In the previous section, we show that while Mg II absorption equivalent widths of individual absorbers decrease with increasing distance for star-forming galaxies, no clear trends are seen for quiescent galaxies. On the other hand, the best-fit results of the likelihood analysis suggest a strong anti-correlation between covering fraction of Mg II gas () and projected distance for both samples (Table 4). Take model I for example, the best-fit Mg II gas covering fraction for star-forming galaxies at is , which declines to at . For quiescent galaxies, the covering fraction is at , which subsequently declines to at . Beyond , both samples show covering fraction consistent with within 2- level. Similar anti-correlations are also reported in the best-fit results of Model II - Model IV, regardless of various scaling relations with halo radius, band magnitude and stellar mass.
We note that the Mg II covering fraction () derived using the likelihood analysis denotes the intrinsic incidence of Mg II gas, which does not depend on the absorption strength of Mg II . In practice, given the sensitivity of the background QSO spectra, our survey does not provide much information for Mg II absorbers weaker than 0.1Å. Here we also report the observed mean covering fraction () of Mg II absorbing gas and examine how the incidence of cool gas varies with galaxy properties. Following the prescription in Chen et al. (2010a), we employ a maximum likelihood analysis to estimate and its uncertainties. The likelihood of detecting an ensemble of galaxies of which galaxies with associated Mg II absorbers of and galaxies with no absorbers detected down to a sensitive limit of is
| (18) |
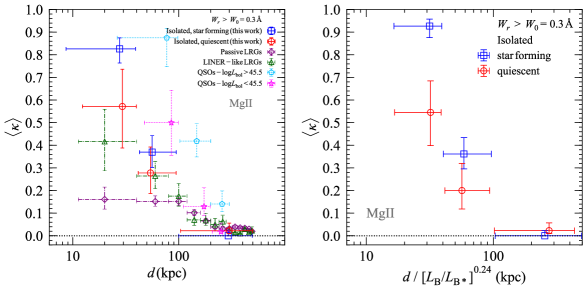
We evaluate for a detection threshold of . In the isolated galaxy samples, 201/211 MagE spectra of corresponding QSOs have sufficient S/N for detecting Mg II gas with absorption strength exceeding . We evenly divide each sample into various projected distance intervals, and obtain best-fit observed covering fractions () and associated uncertainties for each projected distance bin. The results are shown in the left panel of Figure 7.
For the star-forming galaxy sample, the covering fraction of Å absorbers declines from at to at . Beyond , the covering fraction declines to . Quiescent galaxies exhibit similar but mildly lower observed Mg II covering fraction at inner projected distances (). At , for quiescent galaxies, which decreases to at and subsequently to beyond . The observed anti-correlations between covering fraction and projected distance for both samples are consistent with the best-fit results from the likelihood analysis. We find that star-forming galaxies seem to have elevated incidence of Mg II gas at inner projected distance of compared to our quiescent galaxy sample.
To take into account the possible correlation between covering fraction and galaxy properties, we also calculate the mean observed covering fractions in different -normalized projected distance intervals, using the best-fit scaling relation of Equation (16). The results are shown in the right panel of Figure 7. After applying the -scaling, The anti-correlation between covering fraction and normalized projected distance for star-forming galaxies is strengthened. The Mg II gas covering fraction for star-forming galaxies is at and at , where is the -normalized projected distance. For quiescent galaxies, we obtain at and at . At inner , the incidence of Mg II gas seems to be suppressed in the quiescent galaxy sample compared to that of star-forming galaxies at 3- level. The fact that the difference in covering fraction between the two samples is more evident after the -scaling highlights that there is an unambiguous connection between the Mg II gas and host galaxy properties.
Indeed, the high Mg II gas covering fractions of both star-forming and quiescent galaxy samples at kpc are in stark contrast to what we have seen in luminous red galaxies (LRGs; Huang et al., 2016), which we also show in the left panel of Figure 7 for comparison. In Huang et al. (2016), we utilized LRG-QSO pairs in SDSS DR12 and divided the LRGs into passive (purple diamonds) and LINER-like subsamples (green triangles) according to whether they exhibit [O II]-emission features. We reported a constant Mg II gas covering fraction of merely at 120 kpc for passive LRGs, which comprises the majority of the LRG sample (). The LINER-like LRGs have a slightly elevated covering fraction of at , which declines to a similar level of at . We also display the measurement of quasar host halos from Johnson et al. (2015b) for comparison. The luminous quasars of bolometric luminosity at are shown in light blue pentagons and low-luminosity ones of at are shown in magenta stars. Both the luminous and low-luminosity quasars exhibit substantial amount of Mg II absorbing gas ( and respectively) at kpc, and elevated Mg II covering fraction of and within 100 kpc compared to our isolated star-forming and quiescent galaxy samples.
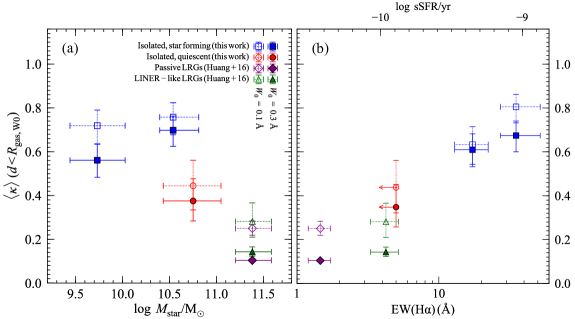
We note that LRGs are luminous and massive (), residing in halos of (e.g., Zhu et al., 2014; Huang et al., 2016). The galaxies in our samples are primarily fainter, spanning a broad range of stellar mass from , with a median stellar mass . Using our large galaxy samples with sensitive limits of Mg II absorption, we can examine how the observed mean Mg II covering fraction depends on the stellar mass. To perform a representative comparison across a broad range of stellar mass, the mean covering fraction is calculated based on observations of Mg II absorbing gas within a fiducial halo gas radius, (Kacprzak et al., 2008; Chen et al., 2010a). In Chen et al. (2010a), we used a sample of 71 isolated galaxies from this survey to show that the extent of Mg II absorbing haloes is well described by an isothermal density profile with a boundary at , that scales with galaxy -band luminosity according to . We equally divide our star-forming galaxies into two mass intervals, with median stellar masses of and . The corresponding is respectively around and . For LRGs with a mean luminosity of , we infer .
We present in the left panel of Figure 8 the mean gas covering fraction within for our star-forming and quiescent galaxy samples, and the LRG samples in Huang et al. (2016). We show for absorption equivalent width thresholds (solid symbols) and (open symbols). A number of interesting features are revealed in this plot.
At the threshold, firstly the star-forming galaxies display a slightly elevated gas covering fraction from at to at . Second, there is an apparent difference in covering fraction between the star-forming and quiescent galaxy samples for galaxies. The covering fraction for quiescent galaxies is at , merely of what we observe in star-forming galaxy halos. Finally, a sharp decline of Mg II gas covering fraction is revealed from even quiescent galaxies to massive LRGs. Specifically, declines from around galaxies to around massive LRGs. The strong mass dependence of Mg II covering fraction qualitatively agrees with the expectation from the observed clustering of Mg II absorbers, where the Mg II covering fraction peaks at ( galaxies) and rapidly falls off at smaller and higher masses (Tinker & Chen, 2008, 2010).
In the right panel of Figure 8 we present the mean gas covering fraction within as a function of H equivalent width for our MagE galaxies and the LRG samples in Huang et al. (2016). The symbols are the same as in the left panel. We find that there is a positive correlation between and H equivalent width (or star formation rate). We note that although LINER-like LRGs (green triangles) have significantly lower compared to the MagE quiescent galaxy sample, in Huang et al. (2016) we find that their H is likely contributed by post-asymptotic giant branch (post-AGB) stars. Therefore, the star-formation rates of LRG samples represent upper limits.
5.2 Kinematics
The line-of-sight velocity dispersion of Mg II absorbers provides important insights into the underlying motion and physical nature of cool clumps within host halos. The left panel of Figure 9 displays the relative velocity between MgII absorbers and their host galaxies as a function of inferred dark matter halo mass. The dashed curves mark the projected escape velocities at =30, 60, 90 kpc (from outside to inside) with respect to mass. No significant trends are observed between the relative velocity and the projected distance between QSO-galaxy pairs. Below projected distance , we find the median relative velocity difference to be . At , the relative velocity difference is . At similar stellar masses, quiescent galaxies seem to have higher relative velocity offsets from the galaxy systematic redshifts compared to that of star-forming galaxies. The majority of the detected Mg II absorbing gas is found at velocities below the expected projected escape velocities, indicating that these Mg II gas complexes are likely to be gravitationally bound.
Using the large sample of galaxy and absorber pairs in the M3 Halo Project, we are able to constrain how the ensemble average of the velocity distribution of absorbing gas changes with their host galaxy properties. We divide isolated galaxy sample into low-mass () and high-mass () galaxies to investigate the correlation between mass and velocity dispersion in the middle panels of Figure 9. The velocity distribution is well characterized by a Gaussian of dispersion around low-mass galaxies and for high-mass galaxies. Quiescent galaxies seem to have higher relative velocities than that of star-forming galaxies. If we consider only star-forming galaxies, we find that the relative velocity dispersion of low-mass galaxies is , and is for high-mass galaxies. The velocity dispersion of the high-mass sample is more elevated than the low-mass sample.
We use the bootstrap method to estimate the 68% confidence levels of the relative velocity dispersion. For isolated star-forming galaxies, the low-mass sample gives , while the high-mass sample gives . There seems to be a positive correlation between the velocity dispersion of Mg II absorbing gas and mass of associated host halos. Assuming a NFW profile (Navarro et al., 1997) with halo concentration of , we can calculate the expected line-of-sight velocity dispersion for virialized motion within , beyond which no Mg II gas is detected in the isolated star-forming galaxy sample. The expected line-of-sight velocity dispersion for low-mass and high-mass galaxies are respectively and , comparable to the observed velocity dispersion. The recent work on Mg II absorbing gas around 50 star-forming galaxies at (Martin et al., 2019) also shows a consistent result. With a median stellar mass of , the sample has a relative velocity dispersion of , comparable to the expected line-of-sight velocity dispersion of .
Our result is in stark contrast to the Mg II gas in LRG halos, where the line-of-sight velocity dispersion is merely 60 percent of what is expected from virial motion (Huang et al., 2016; Zhu et al., 2014; Zahedy et al., 2019; Afruni et al., 2019). In the right panel of Figure 9, we display the relative velocity distributions of Mg II absorbers divided by the line-of-sight projected halo escape velocity for our isolated galaxies (filled histogram) and passive LRGs in Huang et al. (2016) (open histogram). It is clear that while for both samples the majority of the detected Mg II absorbing gas is at velocities well within the expected projected escape velocities, Mg II gas found around passive LRGs have suppressed velocity dispersion compared to our isolated galaxies. Since the Kolmogorov-Smirnov (K-S) test tends to be most sensitive around the median values of distributions and less sensitive to the tails of distributions, we use Anderson-Darling (A-D) test (Anderson & Darling, 1952), which provide increased sensitivity on the shapes of distributions. The A-D test shows that the probability of the two velocity dispersions of Mg II absorbers to be drawn from the same distribution is %.
The comparable velocities between observation and the expectation from virial motion support the physical formalism for a two-phase CGM, where QSO absorption systems in the vicinity of galaxies originate in cool clumps which are in thermal pressure equilibrium with the hot halo (Mo & Miralda-Escude, 1996). The positive correlation between the mean gas covering fraction and H equivalent width (sSFR) in the right panel of Figure 8 also hints on the possibility that the cool clumps may be able to survive and reach the central galaxy.
If clouds are sufficiently massive, they can travel at a characteristic speed equal to the halo velocity as the clouds move through host gas halo. Following Maller & Bullock (2004), we are able to place a lower limit on the cloud mass using their Equation (40),
| (19) |
where is the temperature of hot halo gas, is a cooling parameter that depends on the gas metallicity and Gyr is the halo formation timescale. For our low-mass and high-mass galaxy samples of and 10.6, and K assuming an isothermal gas, and according to N-body simulations (Wechsler et al., 2002). We find the lower limits of cloud mass are for low-mass galaxies and for high-mass galaxies assuming (0.1, 1.0) solar metallicity. The cloud mass is qualitatively consistent with the initial cloud mass of at the virial radius in Afruni et al. (2019). Unlike massive LRG halos, the inflow accretion of gas clouds from external parts of galaxy halos does not suffer from severe deceleration by the hot gas drag force, and therefore remain massive in the internal regions.
We estimate the free-fall time () for the clouds to reach the center to be Gyr for our Mg II absorbers at projected distance kpc and . This timescale is about an order of magnitude smaller than the characteristic timescale for the clouds being evaporated by conduction from the surrounding hot gas. If we assume it takes a free-fall time () for the clouds to reach the center of the host halo, we can infer a cool gas accretion rate of
| (20) |
where is the volume filling factor of Mg II gas within 33 kpc, is the cloud mass, and is the mean clump size. Assuming and kpc, we can obtain a lower limit of cool gas accretion rate of for low-mass galaxies and for high-mass galaxies assuming (0.1, 1.0) solar metallicity. The estimated accretion rate is similar to the star formation rate of the Milky Way of (Chomiuk & Povich, 2011). Note that given the lower limit of cloud mass we obtain from the Equation (19), the characteristic timescale () for clouds being evaporated by conduction from the surrounding hot gas is about . Therefore, the cool clumps are likely to reach the center of the host halo.
5.3 Angular Distribution of Mg II Absorption Relative to Galaxy Major Axis
To examine the azimuthal dependence of , we calculate the azimuthal angle () of each galaxy following the same procedure in Huang et al. (2016). Briefly, is calculated using the position angle (PA) and ellipticity () measurements from the SDSS database. The azimuthal angle () is defined as the angle from the galaxy’s major axis to the line connecting the center of the galaxy to the location of the QSO. A QSO sightline that occurs along the major axis of the galaxy has and one that occurs along the minor axis of the galaxy has .
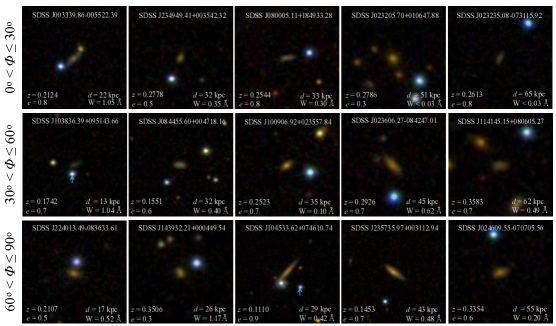
To ensure a high confidence in the following azimuthal dependence investigation, we restrict our sample to those galaxies with measured ellipticities and consistent measurements of PA in both SDSS and bands. SDSS and bands are the most sensitive bandpasses for measuring the surface brightness profiles and for galaxies at in our sample. A total of 128 out of 201 galaxies meet this criterion. We then divide these galaxies into three bins of , where the bin size is chosen to be larger than the typical uncertainty in our data (). In Figure 10, we display 15 galaxy-QSO pairs to illustrate typical cases with azimuthal angles falling in the three bins: (top), (middle), and (bottom) that go into the calculations in Figure 11. From visual inspection of Figure 10, it is clear that the measurements of for the restricted sample are sufficiently adequate for the adopted bin size .
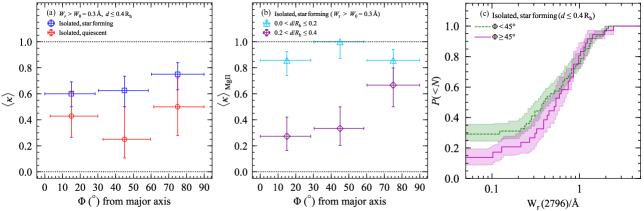
We present in the left panel of Figure 11 the as a function of for our star-forming and quiescent galaxy samples. As we only have one detected Mg II absorber for the isolated galaxy sample beyond 0.4, we limit our investigation to . We find no strong dependence of on for either star-forming or quiescent galaxies. While we find a modest enhancement ( 10 percent at 1 level) of Mg II absorption closer to the minor axis () of star-forming galaxies, no azimuthal angle preference is found for quiescent galaxies. In the middle panel of Figure 11, we further divide star-forming galaxies into two projected distance bins. We find no azimuthal angle dependence of for star-forming galaxies at small projected distance , and a mild elevated covering fraction along the minor axis ( level) at . To further investigate the strength of Mg II absorbers around galaxies closer to the major () and minor () axis, we use the Kaplan-Meier estimator (Feigelson & Nelson, 1985) to derive the median rest-frame equivalent width of Mg II and associated error. Based on the Kaplan-Meier curves, we infer a median for galaxies with and for galaxies with . The excess around galaxies closer to the minor axis () is at level. We find no statistical significant dependence of or on azimuthal angle .
5.4 Comparison between Star-forming and Quiescent Galaxies
With the large isolated galaxy samples, here we compare the physical properties of Mg II absorbing gas around star-forming and quiescent galaxies. Using our likelihood analysis, we have noted that there is a significant anti-correlation () between the Mg II absorption strength and projected distance for star-forming galaxies. The anti-correlation becomes even stronger when including scaling with -band luminosity () and stellar mass (). In contrast, the results of likelihood analysis show that the quiescent galaxies do not have a trend in Mg II absorption strength versus projected distance within a level. Including the scaling of -band luminosity or stellar mass has little improvement on the anti-correlation.
In Figure 7, we show that both star-forming and quiescent galaxies show steep declining covering fraction with increasing . For the star-forming galaxy sample, the covering fraction of Å absorbers declines from at to at (55% decline), similar to that of the quiescent galaxy sample ( 51% decline). Beyond , the covering fraction of both samples is consistent with . The dependence of and for our galaxies are in stark contrast to the massive LRG samples (Huang et al., 2016). Specifically, the passive LRGs display flat distribution of 15% at kpc, and an overall 5% out to kpc.
Next, in Figure 8(a) we show that in addition to the strong dependence of covering fraction on galaxy mass, at a similar mass range of , star-forming galaxies reveal an elevated covering fraction than that of quiescent galaxies. Note that despite the higher we obtain for the star-forming galaxies, the sample has on average a slightly lower stellar mass of compared to that of the quiescent galaxy sample (). To investigate whether the elevated for star-forming galaxies is due to the physical properties of associated galaxies or simply a steep dependence on mass, we restrict the two samples to a narrow stellar mass range of , making both samples similar stellar mass distributions with . We find the resultant covering fraction of star-forming galaxies is , while that of quiescent galaxies is . With the same stellar mass distribution, the quiescent galaxies have merely 45% gas covering fraction compared to the star-forming galaxies. We find the resultant covering fraction of star-forming galaxies is , while that of quiescent galaxies is . With the same stellar mass distribution, the quiescent galaxies have merely 45% gas covering fraction compared to the star-forming galaxies. The positive correlation between specific star formation rate and gas covering fraction is manifest in Figure 8(b). An enhanced Mg II covering fraction around star-forming galaxies seems to imply an outflow origin. However, the origin is complicated by the fact that the majority of Mg II absorbers around isolated galaxies are gravitationally bound (Figure 9). In addition, no statistically significant dependence of or on the azimuthal angle is found in Section 5.3. Furthermore, the kinematics discussed in Section 5.2 indicates that while cool clumps around star-forming galaxies can reach the center of the halo, the clumps in massive quiescent halos are likely to be destroyed during the infall before reaching the LRGs (e.g., Gauthier & Chen, 2011; Huang et al., 2016; Zahedy et al., 2019).
5.5 Comparison between Isolated and Non-isolated Systems
In the panel of Figure 4, we find that the 43 non-isolated systems exhibit no hint of a trend between Mg II absorber strength and galaxy projected distance among detections, contrary to the clear anti-correlation shown in isolated galaxies ( panel). Specifically, while we do not find any detection beyond kpc for isolated, star-forming galaxies, strong systems of Å are detected for non-isolated systems at large distances. The results remain unchanged irrespective of whether the distance from nearest galaxy or a luminosity-weighted distance is adopted for non-isolated systems. The result is in line with previous findings that detections of Å absorbers are frequently found in non-isolated or group systems at beyond 100 kpc (e.g., Chen et al., 2010a; Nielsen et al., 2018; Fossati et al., 2019). Indeed, previous studies have discovered strong MgII absorbers 1 Å associated with galaxy groups (e.g., Whiting et al., 2006; Fossati et al., 2019), LRGs (Gauthier, 2013; Huang et al., 2016) and luminous quasar hosts (Johnson et al., 2015a), whereas such absorbers are only found at kpc in our 211 isolated galaxy samples.
Recently, new wide-field integral field spectrographs such as the Multi Unit Spectroscopic Explorer (MUSE; Bacon et al., 2010) have enabled discoveries of spatially extended line-emitting nebulae on scales reaching kpc in group or cluster environments (e.g., Epinat et al., 2018; Johnson et al., 2018; Chen et al., 2019). Johnson et al. (2018) found that these giant [O III] nebulae correspond both morphologically and kinematically to interacting galaxy pairs in the group, likely arising from cool filaments and interaction-related debris. Furthermore, covering of the area around the quasar at kpc, the nebulae may be an explanation of the high covering fraction of Mg II absorbing gas around luminous QSO hosts in Johnson et al. (2015a). Chen et al. (2019) also uncovered a giant nebula ( physical kpc) associated with a low-mass galaxy group at , where the line-emitting gas connects between group galaxies and follows closely the motion of member galaxies. The study demonstrates that gas stripping in low-mass groups may be effective in releasing metal-enriched gas from star-forming regions, producing absorption systems (e.g., Mg II absorbers) in QSO spectra.
The case studies of spatially-extended line-emitting nebulae associated with galaxy groups provide unambiguous evidence of the importance of interactions in distributing metal-enriched gas on large scales. Despite the lack of morphological information in our absorption-line survey, the commonly found strong Mg II absorbers ( Å) at kpc in the 43 non-isolated systems support the idea that interactions between group galaxies may contribute to the presence of strong absorbers at large scales.
5.6 Comparison with Other Studies
The M3 Halo Project consists of 211 isolated and 43 non-isolated galaxies with at projected distance kpc from a background QSO, chosen without any prior knowledge of the presence or absence of Mg II absorbing gas. The absorption-blind sample chosen from SDSS enables an unbiased characterization of the correlation between Mg II absorbing gas and physical properties of associated galaxies. Our survey shows a distinct difference in the versus inverse correlation between star-forming and quiescent halos. While there is a significant anti-correlation () between and for star-forming galaxies, there is no hint of a correlation among Mg II detected quiescent galaxies. We also show that while star-forming galaxies have elevated % at kpc, both star-forming and quiescent galaxies show beyond 90 kpc. These findings are different from the results of MAGIICAT (Nielsen et al., 2013b, a). At the threshold, MAGIICAT galaxies reveal a non-negligible Mg II gas covering fraction % at kpc.
It is worth noting that even though 69 out of 182 galaxies in MAGIICAT come from our M3 Halo Project (Chen & Tinker, 2008; Chen et al., 2010a), MAGIICAT consists of galaxy-Mg II absorber pairs from different programs. While some of these programs were designed to be absorption-blind like the M3 Halo Project, others select galaxies at the redshifts of known Mg II absorbers. The galaxy-absorber pairs from these other programs have associated Mg II absorbers by design, therefore imposing a strong bias on the calculated gas covering fraction. Similarly, the lack of mass dependence on the covering fraction of Mg II absorbing gas in Churchill et al. (2013) can be understood by an over estimation of covering fraction at high mass, where detections at this mass range come mostly from absorber centric surveys.
Martin et al. (2019) constructed a sample of 50 star-forming galaxies with at close projected distances kpc, properties similar to our star-forming galaxies. For absorbers with a detection threshold of , this sample yields % at kpc, which declines to % at kpc (through private communication). The steep anti-correlation and the mean covering fraction is roughly consistent with our results, where we find declines from at to at .
It is clear from our results that Mg II absorbing gas is tightly coupled with the physical properties of host galaxies. In particular, our survey displays a strong dependence of mean covering fraction of Mg II absorbing gas on the stellar mass of host galaxies, where increases with mass at and decreases steeply at higher masses. We further demonstrate in Section 5.2 that at the same stellar masses of , star-forming galaxies have in average twice of the mean Mg II gas covering fraction (64%) compared to that of quiescent galaxies (29%). The properties of Mg II absorbing gas are shown to strongly depend on multiple host galaxy properties. Here we highlight the importance of having a homogeneous, absorption-blind galaxy sample, in order to identify different dependences (e.g. stellar mass and star-formation) and carefully study how Mg II gas correlates with their host galaxy properties.
6 Summary
We have carried out the M3 Halo Project of galaxies and Mg II absorbers in the spectra of background QSOs that are within close projected distances at . The catalog contains 211 isolated and 43 non-isolated galaxy-QSO pairs with spectroscopic redshifts of and projected distances of kpc. This is the largest homogeneous, absorption-blind sample at to date, allowing us to conduct a comprehensive study of the correlation between Mg II absorbing gas and the physical properties of host galaxies at low-redshift. The main findings of our survey are summarized as the following:
-
(1)
We observe a stark contrast in the distribution of Mg II absorber strength versus galaxy projected distance between isolated and non-isolated galaxies (Figure 4). While both galaxy samples appear to occupy a similar versus space, isolated galaxies show strong inverse correlation but non-isolated galaxies exhibit no hint of a trend among detections. When dividing isolated galaxies into star-forming and quiescent galaxy samples, star-forming galaxies show a strong anti-correlation between and distance , in contrast to the moderate trend revealed in quiescent galaxy sample.
-
(2)
Based on the likelihood analysis, we confirm that declines with increasing for isolated galaxies. The anti-correlation between and is strengthened when considering only isolated, star-forming galaxies. The inverse correlation is further enhanced for star-forming galaxies after accounting for either mass scaling of gaseous radius (), -band luminosity() or stellar mass () of host galaxies. On the contrary, Mg II detected quiescent galaxies exhibit little correlation between and , whether or not accounting for scaling (see Figures 5 & 6).
-
(3)
In Figure 7, we show that the covering fraction of Mg II absorbing gas is high for isolated galaxies at small projected distances and declines rapidly to at kpc for absorbers of . At kpc, we find an elevated covering fraction for star-forming galaxies compared to for quiescent galaxies. After the scaling of band luminosity, the inverse correlation between and is strengthened and the difference in covering fraction between star-forming and quiescent galaxies become more evident ().
-
(4)
The high Mg II gas covering fraction for both our star-forming and quiescent galaxy samples at kpc () is in stark contrast to what we have seen in the massive LRGs. Within , we find a sharp decline of Mg II covering fraction from 30-70% around galaxies to 10-15% around massive LRGs (Figure 8a). The strong mass dependence of Mg II incidence is qualitatively consistent with the expectation from the observed clustering of Mg II absorbers. In addition, at stellar mass of , the Mg II gas covering fraction for quiescent galaxies () is merely half of what we find for star-forming galaxies (=0.64). We also find a positive correlation between specific star formation rate and Mg II gas covering fraction (Figure 8b).
-
(5)
We find that most of the galaxy-Mg II absorber pairs have relative velocities smaller than the expected projected escape velocity of their host halos, implying that the Mg II absorbers are likely to be gravitationally bound (Figure 9). In addition, Mg II absorbers have line-of-sight velocity dispersion of = (58-73, 73-90) for low-mass and high-mass star-forming galaxies, consistent with the expected line-of-sight velocity dispersion = (52, 86) for virialized motion. If the clouds are massive enough to travel through the hot gas at the halo velocity without significant deceleration by the hot gas drag force, we are able to place lower limits on the cloud mass of and the cool gas accretion rate of .
-
(6)
In Figure 11, we investigate the possible azimuthal dependence in the covering fraction of Mg II absorbers for isolated, star-forming and quiescent galaxies. While no apparent trend is seen for quiescent galaxies at , there is a modest enhancement in the gas covering fraction along the minor axis of star-forming galaxies at . We find excess around galaxies closer to the minor axis () at level. No statistical significant dependence of or on azimuthal angle is shown in our isolated galaxy sample.
Acknowledgments
The authors thank Stephanie Ho for the covering fraction measurement for their survey and careful reading on the early draft of this paper. HWC acknowledges partial support from HST-GO- 15163.001A and NSF AST-1715692 grants. YHH acknowledges support from NSF AST 15-15115 and AST 19-08284 grants.
We are grateful to the SDSS collaboration for producing and maintaining the SDSS public data archive. Funding for the SDSS and SDSS-II has been provided by the Alfred P. Sloan Foundation, the Participating Institutions, the National Science Foundation, the U.S. Department of Energy, the National Aeronautics and Space Administration, the Japanese Monbukagakusho, the Max Planck Society, and the Higher Education Funding Council for England. The SDSS Web Site is http://www.sdss.org/. The SDSS is managed by the Astrophysical Research Consortium for the Participating Institutions.
This research has made use of NASA?s Astrophysics Data System and the NASA/IPAC Extragalactic Database (NED) which is operated by the Jet Propulsion Laboratory, California Institute of Technology, under con- tract with the National Aeronautics and Space Administration.
DATA AVAILABILITY
The data underlying this article will be shared on reasonable request to the corresponding author.
References
- Abolfathi et al. (2018) Abolfathi B., et al., 2018, ApJS, 235, 42
- Adelman-McCarthy et al. (2008) Adelman-McCarthy J. K., et al., 2008, ApJS, 175, 297
- Afruni et al. (2019) Afruni A., Fraternali F., Pezzulli G., 2019, A&A, 625, A11
- Anderson & Darling (1952) Anderson T. W., Darling D., 1952, The Annals of Mathematical Statistics, 23, 193
- Bacon et al. (2010) Bacon R., et al., 2010, in Proc. SPIE. p. 773508, doi:10.1117/12.856027
- Bergeron & Stasińska (1986) Bergeron J., Stasińska G., 1986, A&A, 169, 1
- Bordoloi et al. (2014) Bordoloi R., et al., 2014, ApJ, 796, 136
- Borthakur et al. (2013) Borthakur S., Heckman T., Strickland D., Wild V., Schiminovich D., 2013, ApJ, 768, 18
- Borthakur et al. (2016) Borthakur S., et al., 2016, ApJ, 833, 259
- Bryan & Norman (1998) Bryan G. L., Norman M. L., 1998, ApJ, 495, 80
- Charlton & Churchill (1998) Charlton J. C., Churchill C. W., 1998, ApJ, 499, 181
- Charlton et al. (2003) Charlton J. C., Ding J., Zonak S. G., Churchill C. W., Bond N. A., Rigby J. R., 2003, ApJ, 589, 111
- Chen (2017) Chen H.-W., 2017, in Knapen J. H., Lee J. C., Gil de Paz A., eds, Astrophysics and Space Science Library Vol. 434, Outskirts of Galaxies. p. 291 (arXiv:1612.05305), doi:10.1007/978-3-319-56570-5˙9
- Chen & Mulchaey (2009) Chen H.-W., Mulchaey J. S., 2009, ApJ, 701, 1219
- Chen & Tinker (2008) Chen H.-W., Tinker J. L., 2008, ApJ, 687, 745
- Chen et al. (1998) Chen H.-W., Lanzetta K. M., Webb J. K., Barcons X., 1998, ApJ, 498, 77
- Chen et al. (2010a) Chen H.-W., Helsby J. E., Gauthier J.-R., Shectman S. A., Thompson I. B., Tinker J. L., 2010a, ApJ, 714, 1521
- Chen et al. (2010b) Chen H.-W., Wild V., Tinker J. L., Gauthier J.-R., Helsby J. E., Shectman S. A., Thompson I. B., 2010b, ApJ, 724, L176
- Chen et al. (2014) Chen H.-W., Gauthier J.-R., Sharon K., Johnson S. D., Nair P., Liang C. J., 2014, MNRAS, 438, 1435
- Chen et al. (2019) Chen H.-W., Boettcher E., Johnson S. D., Zahedy F. S., Rudie G. C., Cooksey K. L., Rauch M., Mulchaey J. S., 2019, ApJ, 878, L33
- Chomiuk & Povich (2011) Chomiuk L., Povich M. S., 2011, AJ, 142, 197
- Churchill et al. (2000) Churchill C. W., Mellon R. R., Charlton J. C., Jannuzi B. T., Kirhakos S., Steidel C. C., Schneider D. P., 2000, ApJS, 130, 91
- Churchill et al. (2003) Churchill C. W., Vogt S. S., Charlton J. C., 2003, AJ, 125, 98
- Churchill et al. (2013) Churchill C. W., Nielsen N. M., Kacprzak G. G., Trujillo-Gomez S., 2013, ApJ, 763, L42
- Epinat et al. (2018) Epinat B., et al., 2018, A&A, 609, A40
- Faber et al. (2007) Faber S. M., et al., 2007, ApJ, 665, 265
- Feigelson & Nelson (1985) Feigelson E. D., Nelson P. I., 1985, ApJ, 293, 192
- Fossati et al. (2019) Fossati M., et al., 2019, MNRAS, 490, 1451
- Fumagalli et al. (2012) Fumagalli M., et al., 2012, ApJ, 757, L22
- Gauthier (2013) Gauthier J.-R., 2013, MNRAS, 432, 1444
- Gauthier & Chen (2011) Gauthier J.-R., Chen H.-W., 2011, MNRAS, 418, 2730
- Hao et al. (2010) Hao J., et al., 2010, ApJS, 191, 254
- Ho & Martin (2020) Ho S. H., Martin C. L., 2020, ApJ, 888, 14
- Ho et al. (2017) Ho S. H., Martin C. L., Kacprzak G. G., Churchill C. W., 2017, ApJ, 835, 267
- Huang et al. (2016) Huang Y.-H., Chen H.-W., Johnson S. D., Weiner B. J., 2016, MNRAS, 455, 1713
- Johnson et al. (2014) Johnson S. D., Chen H.-W., Mulchaey J. S., Tripp T. M., Prochaska J. X., Werk J. K., 2014, MNRAS, 438, 3039
- Johnson et al. (2015a) Johnson S. D., Chen H.-W., Mulchaey J. S., 2015a, MNRAS, 449, 3263
- Johnson et al. (2015b) Johnson S. D., Chen H.-W., Mulchaey J. S., 2015b, MNRAS, 452, 2553
- Johnson et al. (2018) Johnson S. D., et al., 2018, ApJ, 869, L1
- Kacprzak et al. (2008) Kacprzak G. G., Churchill C. W., Steidel C. C., Murphy M. T., 2008, AJ, 135, 922
- Kacprzak et al. (2011) Kacprzak G. G., Churchill C. W., Evans J. L., Murphy M. T., Steidel C. C., 2011, MNRAS, 416, 3118
- Kacprzak et al. (2012) Kacprzak G. G., Churchill C. W., Nielsen N. M., 2012, ApJ, 760, L7
- Kewley et al. (2001) Kewley L. J., Dopita M. A., Sutherland R. S., Heisler C. A., Trevena J., 2001, ApJ, 556, 121
- Koester et al. (2007) Koester B. P., et al., 2007, ApJ, 660, 239
- Kravtsov et al. (2018) Kravtsov A. V., Vikhlinin A. A., Meshcheryakov A. V., 2018, Astronomy Letters, 44, 8
- Lan & Mo (2018) Lan T.-W., Mo H., 2018, ApJ, 866, 36
- Lanzetta et al. (1987) Lanzetta K. M., Turnshek D. A., Wolfe A. M., 1987, ApJ, 322, 739
- Liang & Chen (2014) Liang C. J., Chen H.-W., 2014, MNRAS, 445, 2061
- Lupton (1995) Lupton R. H., 1995, http://www.apo.nmsu.edu/35m_operations/35m_manual/Instruments/DIS/DIS_usage.html#Lupton_Manual. http://www.apo.nmsu.edu/35m_operations/35m_manual/Instruments/DIS/DIS_usage.html#Lupton_Manual
- Maller & Bullock (2004) Maller A. H., Bullock J. S., 2004, MNRAS, 355, 694
- Maller et al. (2009) Maller A. H., Berlind A. A., Blanton M. R., Hogg D. W., 2009, ApJ, 691, 394
- Marshall et al. (2008) Marshall J. L., et al., 2008, in Society of Photo-Optical Instrumentation Engineers (SPIE) Conference Series. p. 54 (arXiv:0807.3774), doi:10.1117/12.789972
- Martin et al. (2019) Martin C. L., Ho S. H., Kacprzak G. G., Churchill C. W., 2019, ApJ, 878, 84
- Mo & Miralda-Escude (1996) Mo H. J., Miralda-Escude J., 1996, ApJ, 469, 589
- More et al. (2011) More S., van den Bosch F. C., Cacciato M., Skibba R., Mo H. J., Yang X., 2011, MNRAS, 410, 210
- Navarro et al. (1997) Navarro J. F., Frenk C. S., White S. D. M., 1997, ApJ, 490, 493
- Nestor et al. (2005) Nestor D. B., Turnshek D. A., Rao S. M., 2005, ApJ, 628, 637
- Nielsen et al. (2013a) Nielsen N. M., Churchill C. W., Kacprzak G. G., Murphy M. T., 2013a, ApJ, 776, 114
- Nielsen et al. (2013b) Nielsen N. M., Churchill C. W., Kacprzak G. G., 2013b, ApJ, 776, 115
- Nielsen et al. (2018) Nielsen N. M., Kacprzak G. G., Pointon S. K., Churchill C. W., Murphy M. T., 2018, ApJ, 869, 153
- Petitjean & Bergeron (1990) Petitjean P., Bergeron J., 1990, A&A, 231, 309
- Prochaska et al. (2011) Prochaska J. X., Weiner B., Chen H. W., Mulchaey J., Cooksey K., 2011, ApJ, 740, 91
- Rao et al. (2006) Rao S. M., Turnshek D. A., Nestor D. B., 2006, ApJ, 636, 610
- Rubin et al. (2014) Rubin K. H. R., Prochaska J. X., Koo D. C., Phillips A. C., Martin C. L., Winstrom L. O., 2014, ApJ, 794, 156
- Rudie et al. (2013) Rudie G. C., Steidel C. C., Shapley A. E., Pettini M., 2013, ApJ, 769, 146
- Smith et al. (2012) Smith A. G., Hopkins A. M., Hunstead R. W., Pimbblet K. A., 2012, MNRAS, 422, 25
- Tinker & Chen (2008) Tinker J. L., Chen H.-W., 2008, ApJ, 679, 1218
- Tinker & Chen (2010) Tinker J. L., Chen H.-W., 2010, ApJ, 709, 1
- Tinker et al. (2007) Tinker J. L., Norberg P., Weinberg D. H., Warren M. S., 2007, ApJ, 659, 877
- Tripp et al. (1998) Tripp T. M., Lu L., Savage B. D., 1998, ApJ, 508, 200
- Tumlinson et al. (2011) Tumlinson J., et al., 2011, Science, 334, 948
- Tumlinson et al. (2013) Tumlinson J., et al., 2013, ApJ, 777, 59
- Tumlinson et al. (2017) Tumlinson J., Peeples M. S., Werk J. K., 2017, ARA&A, 55, 389
- Wechsler et al. (2002) Wechsler R. H., Bullock J. S., Primack J. R., Kravtsov A. V., Dekel A., 2002, ApJ, 568, 52
- Weiner et al. (2009) Weiner B. J., et al., 2009, ApJ, 692, 187
- Werk et al. (2014) Werk J. K., et al., 2014, ApJ, 792, 8
- Whiting et al. (2006) Whiting M. T., Webster R. L., Francis P. J., 2006, MNRAS, 368, 341
- Yan et al. (2006) Yan R., Newman J. A., Faber S. M., Konidaris N., Koo D., Davis M., 2006, ApJ, 648, 281
- Yang et al. (2005) Yang X., Mo H. J., Jing Y. P., van den Bosch F. C., 2005, MNRAS, 358, 217
- Zahedy et al. (2016) Zahedy F. S., Chen H.-W., Rauch M., Wilson M. L., Zabludoff A., 2016, MNRAS, 458, 2423
- Zahedy et al. (2019) Zahedy F. S., Chen H.-W., Johnson S. D., Pierce R. M., Rauch M., Huang Y.-H., Weiner B. J., Gauthier J.-R., 2019, MNRAS, 484, 2257
- Zheng et al. (2007) Zheng Z., Coil A. L., Zehavi I., 2007, ApJ, 667, 760
- Zhu et al. (2009) Zhu G., Moustakas J., Blanton M. R., 2009, ApJ, 701, 86
- Zhu et al. (2014) Zhu G., et al., 2014, MNRAS, 439, 3139