Explaining Chemical Toxicity Using Missing Features
Abstract
Chemical toxicity prediction using machine learning is important in drug development to reduce repeated animal and human testing, thus saving cost and time. It is highly recommended that the predictions of computational toxicology models are mechanistically explainable. Current state of the art machine learning classifiers are based on deep neural networks, which tend to be complex and harder to interpret. In this paper, we apply a recently developed method named contrastive explanations method (CEM) to explain why a chemical or molecule is predicted to be toxic or not. In contrast to popular methods that provide explanations based on what features are present in the molecule, the CEM provides additional explanation on what features are missing from the molecule that is crucial for the prediction, known as the pertinent negative. The CEM does this by optimizing for the minimum perturbation to the model using a projected fast iterative shrinkage-thresholding algorithm (FISTA). We verified that the explanation from CEM matches known toxicophores and findings from other work.
1 Introduction
The dramatic increase of potential drugs in the discovery phase over the last decade has not been accompanied by a similar increase in new drug approvals; rather, approvals have decreased with a large portion of these drug candidates being rejected (Hwang et al., 2016). Poor efficacy and toxicity remain major limiting aspects of this drug discovery (Hay et al., 2014). Traditionally, in vivo methods have been used to test the toxicities of these chemicals and drugs. But these are usually expensive and time consuming and hence there has been a shift towards in vitro and to machine learning (ML) based in silico methods.
A variety of ML models have been applied for this task, predicting toxicities in cells (in vitro), in animals (in vivo), and in humans. These models take in a variety of inputs, from chemical descriptors to mechanistic biological descriptors, such as targets and biological pathways. Chemical descriptors are used more frequently, from descriptors derived from chemical and physical properties (Luco & Ferretti, 1997; Abdelaziz et al., 2016), to structural chemical fingerprints (Mayr et al., 2016), to even chemical 3D (Matsuzaka & Uesawa, 2019) and 2D images (Fernandez et al., 2018). Chemical structures, even though not always directly related to the toxic effect of a molecule (Alves et al., 2016), are commonly used for screening in the drug development process (Limban et al., 2018). The type of model applied also differs, from similarity based models (Ajmani et al., 2006; Chavan et al., 2015) to SVMs (Cao et al., 2012), to random forests (Polishchuk et al., 2009), and most recently towards deep learning models (Mayr et al., 2016; Jimenez-Carretero et al., 2018). This shift towards deep learning models has been pushed by their superior predictive performance (Mayr et al., 2016), and their ability to self select significant features (Tang et al., 2018). However, though the performance of these predictive models is getting better, this shift towards more “black-box” models makes it increasingly unclear to explain why a molecule is predicted as toxic or not toxic. Yet this information is extremely important, not only for the drug development process in highlighting which chemical substructures to avoid while designing new molecules, but also for providing more confidence to the end-users of this information - e.g., the experimentalists, who design molecules and in vitro toxicity measuring assays and already have expert knowledge on which chemical (sub)structures to avoid during new molecule design. Therefore, it is highly recommended for predictions of computational toxicology models to be explainable (OECD, 2016).
Many different methods have been applied to pinpoint these toxic substructures, or “structural alerts”/“toxicophores” in order to help explain toxicity prediction results. However, these methods have only focused on pinpointing the presence of certain features, such as toxicophores, on explaining the resulting toxicity predictions, but they in general have not examined the affect of the absence of these features to generate explanations. However, when defining contrastive features that are necessary for a prediction, defining both the present and absent features, that are minimal and necessary, can help provide an explanation that is more easily comprehensible for users. Keeping this in mind, Dhurandhar et al. (2018) have recently developed a contrastive explanations method (CEM), to identify both pertinent positive and pertinent negative features in neural networks applied to image data (MNIST handwritten digits dataset), to text data (procurement fraud dataset), and to brain activity strength data.
In our current work, we apply this model to the domain of predicting toxicity of molecules, to provide better insights into explanations of toxicity predictions. For the task of predicting toxicity from chemical structures of molecules, these contrastive features could be chemical substructures or functional groups — for positive pertinent features these would be the minimum required substructures for a molecule’s classification (structural alerts or toxicophores in the case for a toxic class), while for negative pertinent features these would be the minimum changes to the molecule that would flip the classification of a molecule, from toxic to nontoxic or vice versa. Such an explanation will expand the scope of current toxicity prediction explanations, beyond just defining toxicophores. These explanations can also provide information on how to convert a toxic molecule to a nontoxic molecule, the exact contributing chemical substructures, as well as provide information on what can make a molecule safe.
2 Contrastive Explanations Method (CEM)
One major strength of the CEM is to identify missing features that contribute to an explanation, in addition to features that are present in a molecule. To illustrate, a molecule can be nontoxic because it does not have a particular toxicophore that is harmful. Such explanation is more intuitive and complete than just saying that the molecule is nontoxic because of the presence of other structures that correlate with nontoxicity.
The CEM introduces the notion of Pertinent Negative (PN) and Pertinent Positve (PP). A PN is a subset of the feature set that is necessary for a classifier to predict a given class, while a PP is the minimal subset of features whose presence gives rise to its prediction. The CEM obtains the PN and PP via an optimization problem to look for a required minimum perturbation to the model, using a projected fast iterative shrinkage-thresholding algorithm (FISTA). Refer to Dhurandhar et al. (2018) for more details. Examples on PN and PP are given in Section 4.
3 Toxicity Prediction Model
We apply the CEM to a deep neural network (DNN) model used for toxicity prediction. For simplicity, we focus on one specific task within the Tox21 challenge, i.e., ‘SR-MMP’. This particular task is chosen because it is the simplest toxicity prediction task with 95% AUC-ROC achieved by the winner of the Tox21 challenge.111https://tripod.nih.gov/tox21/challenge/leaderboard.jsp
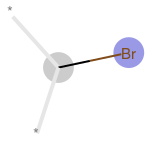
The Tox21 challenge provides the results of twelve in vitro assays that test seven different nuclear receptor signaling effects, and five stress response effects of 10,000 molecules in cells (Huang et al., 2016); these are a subset of the broader “Toxicology in the 21st Century” initiative that test experimentally, in vitro, the effect of a large number of chemicals on their ability to disrupt biological pathways through high-throughput screening (HTS) techniques (Krewski et al., 2010; Tice et al., 2013; Kavlock et al., 2009). The SR-MMP task specifically tests the ability of molecules to disrupt the mitochondrial membrane potential (MMP) in cells (Huang et al., 2016). To generate the features to the DNN model, we convert the SMILES representation of each molecule into a fixed length bit vector of size 4096 using Morgan fingerprinting (Rogers & Hahn, 2010). These bits convey information about the substructure of the molecules, for example, the 3236th bit corresponds to a substructure containing the bromine atom (see Figure 3). Our Morgan fingerprints encapsulate all molecular substructures up to a radius of size 2.
Since our main focus is on the explanation method, we employ a simple DNN model, one with only three hidden layers and ReLU activation function. The sizes of the hidden layers are 2048, 1024 and 512 respectively. The output layer has 2 nodes corresponding to the toxic/nontoxic labels and is activated by a softmax. We train the DNN model for 200 epochs with random batches of 256 molecules per training step. Binary cross entropy was chosen as the loss function and it was optimized using the ADADELTA optimizer. The simple DNN model achieves a test set ROC AUC of 0.8777, with true positive of 0.5754 and true negative of 0.9524, overall, the F1 score is 0.6280. Note that the results are comparable with that of Liu et al. (2019, Table S14).
4 Results
Pertinent Negative Features.
In our toxicity prediction model, pertinent negatives (PN) are the minimum changes to the input feature of a molecule to flip its predicted label.
Example 1: Triphenylphosphine oxide: For example, triphenylphosphine oxide was correctly predicted to be nontoxic for the SR-MMP endpoint, with a prediction probability of 0.9999. However, if we were to add some bits corresponding to the pertinent negatives, the DNN model will now predict the molecule to be toxic in SR-MMP.
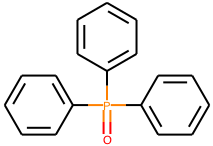
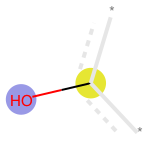
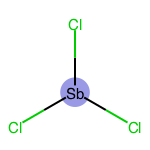
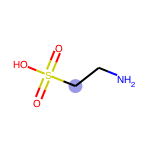
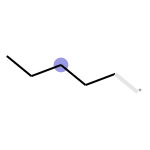
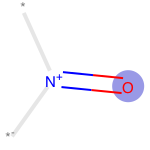
In order to make triphenylphosphine oxide toxic, the bits to be added are 690, 876, 164, 62, 276, etc. To give an illustration of what these bits entail, we refer to other molecules in the database that have these bits and borrow the toxic parts corresponding to these bits. A selection of top 10 parts for the pertinent negatives are displayed below in Figure 2. Interestingly, we can see that the PN includes the trichloride (SbCl3), which is known to be very toxic (Cooper & Harrison, 2009).

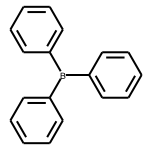
Example 2: Triphenylborane: We now look at another example where the DNN model misclassified the molecule triphenylborane to be nontoxic, where it is in fact toxic for the endpoint SR-MMP. Here, we use the pertinent negatives to identify why the model makes such false prediction.
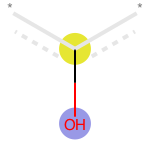
For triphenylborane, the CEM algorithm provides only 5 pertinent negative bits, meaning that it takes less changes to flip the prediction to toxic (classification probability for toxic class changed from 0.0205 to 0.5062). Here, we can clearly see that adding of bromine atom and hydroxyl (OH) group would flip the classifier’s prediction. Here, one way to explain why the classifier makes the false prediction is because such features were not observed in triphenylborane. In fact, this molecule bears close resemblance to triphenylphosphine oxide (example 1) where the only difference is in the connecting molecule in between the aromatic rings. Thus it is not bizarre to see such a false prediction.
In contrast to existing explanation methods that provide explanation based on what is present in a molecule, the pertinent negatives instead look at what is missing from the molecule, which is an useful and more complete explanation criteria. This is one of the main strength of using the pertinent negatives for explanation.


Pertinent Positive.
Pertinent Positives (PP) answer the question: what is the minimum required features such that a molecule is classified as such?
Example 3: Ethalfluralin: Ethalfluralin is a known herbicide for weeds. Here, the DNN model correctly predicted that the molecule is toxic on the endpoint SR-MMP.
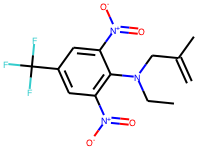
To understand why the model makes such prediction, we can inspect the pertinent positive for the molecule. In Figure 5, we display five pertinent positives for the prediction.

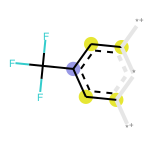
Here, we can see that one of the contributing factor to its toxicity prediction is its trifluoromethyl functional group. However, we caution that this functional group may or may not be the causal factor to its toxicity, as the CEM can only extract correlated factors rather than causal ones.
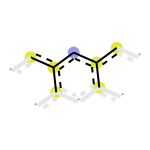
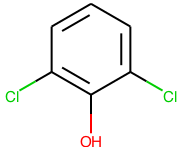
Example 4: 2,6-Dichlorophenol: Next, we look at an example when the DNN model predicts a molecule incorrectly. The 2,6-dichlorophenol is corrosive and is an environmental hazard according to PubChem but it is not toxic in the SR-MMP endpoint. However, the DNN model predicts it to be toxic with a probability of 0.9999. We employ the CEM to look for its pertinent positive bits.
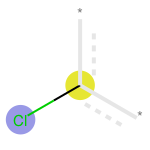
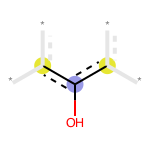
The CEM identifies three main bits for the pertinent positive, which are illustrated in the Figure 6. These three bits correspond to the hydroxyl (OH) functional group and the chlorine atom. The presence of these parts in the molecule resulted in the DNN model to predict the molecule to be toxic, albeit incorrectly.
Verifying Identified Explanations.
Akita et al. (2018, Fig 3) found that the phenolic OH group is responsible for the prediction of the toxicity of the molecule tyrphostin 9 in their classification model. This is consistent with the finding of CEM, which identified the OH functional group as an explanation (in both PP and PN) for our predictions. In addition, we also found that the phenolic OH functional group solely forms the pertinent positive of tyrphostin 23 (not displayed), which is closely related to tyrphostin 9.
Checking with Known Toxicophores.
Our model’s explanations, through identifying PP and PN substructures, can pinpoint structural alerts — substructures in molecule that are required for a toxic label or substructures that can flip the predicted label to a toxic label.
The SR-MMP task measures the ability of molecules to disrupt the mitochondrial membrane potential in cells. Weakly acid groups are known to uncouple this membrane potential, with the phenolic OH being the most common weakly acid group (Terada, 1990). Our model identifies phenolic OH groups as PP or PNs to for multiple molecules, consistent with this work (Table 1).
Further, through past experiments and testing, various substructures have already been known to act as structural alerts / toxicophores for different toxic endpoints. A commonly used experiment is the Ames test that tests for the mutagenicity of chemicals in vitro in cells, general structural alerts from these have already been curated in past studies and is a common benchmark in identifying toxicophores in molecules (Kazius et al., 2005, 2006; Yang et al., 2017). Our model was able to identify several of these general toxicophores that are connected to mutagenicty, e.g., aliphatic halides, polycylic aromatic systems, aromatic nitros (Kazius et al., 2006), as both PP and PN to either explain the toxicity of a molecule or to turn a molecule into a toxic one (Table 1).
| General | Pertinent Negative | Pertinent Positive | ||
| Toxicophore | SA | Eg | SA | Eg |
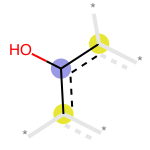
| Phenolic OH | -cc(O)c- | (1) | -cO | (3) |
| -cO | (1, 2) | |||
| Aliphatic halides | Br | (1, 2) | -cc(c(F)(F)F)cc- | (3) |
| (Cl, Br, I, F) | Br | (2) | -c(Cl) | (4) |
| Polycyclic | -c(ccc(c)c)c- | (1) | ||
| aromatic system | ||||
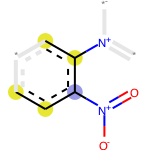
| Aromatic nitro | -ccc(N+(O-)=O)c(N+)c- | (1) | N, O-, N+=O | (3) |
5 Conclusion
Applying the recently proposed CEM (Dhurandhar et al., 2018) to the task of predicting toxicity of molecules, in particular the SR-MMP task, we were able to demonstrate the ability to explain toxic predictions both from structural alerts as well as examining the substructures that are missing that can switch a molecule to be toxic. This is helpful in terms of both identifying toxicophores that might need to be avoided in designing a molecule, as well as giving an indication of how to convert a molecule to be toxic, and thus reversely nontoxic. The toxicophores extracted in such a manner, were consistent with both known experimental toxicophores and past models of identifying substructures.
To note, even though a molecule can be classified as toxic or nontoxic by the SR-MMP endpoint, this is only measuring its toxicity in regards to this one endpoint - whether the molecule can disrupt the mitochondrial membrane potential. Thus this cannot necessarily predict if the molecule will be toxic for other endpoints, but can still give an indication of this. This can be the reason for seemingly contradicting known toxicities and toxicity for the SR-MMP endpoint, e.g., 2,6-dichlorophenol is corrosive and an environmental hazard, but not toxic in the SR-MMP endpoint. Thus, it is important to be cognisant of the definition of toxicity we are examining for our explanations.
Our PNs are general examples of the minimum required substructures that can flip a molecule’s label to toxic, thus missing substructures that cause the predicted label to be nontoxic. This is a good starting point to associate a particular substructure to toxicity, however for a more complete explanation, the next step would be to pinpoint the location to which these substructures can be added to the molecule to create chemically meaningful molecules.
Overall, the CEM is able to help discern both the missing and contributing structural alerts for toxicity that are consistent to known toxicophores. Further work will extend to identification of causal factors to molecular toxicity.
References
- Abdelaziz et al. (2016) Abdelaziz, A., Spahn-Langguth, H., Schramm, K.-W., and Tetko, I. V. Consensus modeling for HTS assays using in silico descriptors calculates the best balanced accuracy in Tox21 challenge. Frontiers in Environmental Science, 4:2, 2016.
- Ajmani et al. (2006) Ajmani, S., Jadhav, K., and Kulkarni, S. A. Three-dimensional QSAR using the k-nearest neighbor method and its interpretation. Journal of Chemical Information and Modeling, 46(1):24–31, 2006.
- Akita et al. (2018) Akita, H., Nakago, K., Komatsu, T., Sugawara, Y., Maeda, S.-i., Baba, Y., and Kashima, H. BayesGrad: Explaining predictions of graph convolutional networks. In International Conference on Neural Information Processing, pp. 81–92. Springer, 2018.
- Alves et al. (2016) Alves, V. M., Muratov, E. N., Capuzzi, S. J., Politi, R., Low, Y., Braga, R. C., Zakharov, A. V., Sedykh, A., Mokshyna, E., Farag, S., et al. Alarms about structural alerts. Green Chemistry, 18(16):4348–4360, 2016.
- Cao et al. (2012) Cao, D.-S., Zhao, J.-C., Yang, Y.-N., Zhao, C.-X., Yan, J., Liu, S., Hu, Q.-N., Xu, Q.-S., and Liang, Y.-Z. In silico toxicity prediction by support vector machine and SMILES representation-based string kernel. SAR and QSAR in Environmental Research, 23(1-2):141–153, 2012.
- Chavan et al. (2015) Chavan, S., Friedman, R., and Nicholls, I. A. Acute toxicity-supported chronic toxicity prediction: a k-nearest neighbor coupled read-across strategy. International Journal of Molecular Sciences, 16(5):11659–11677, 2015.
- Cooper & Harrison (2009) Cooper, R. G. and Harrison, A. P. The exposure to and health effects of antimony. Indian Journal of Occupational and Environmental Medicine, 13(1):3, 2009.
- Dhurandhar et al. (2018) Dhurandhar, A., Chen, P.-Y., Luss, R., Tu, C.-C., Ting, P., Shanmugam, K., and Das, P. Explanations based on the missing: Towards contrastive explanations with pertinent negatives. In Advances in Neural Information Processing Systems, pp. 592–603, 2018.
- Fernandez et al. (2018) Fernandez, M., Ban, F., Woo, G., Hsing, M., Yamazaki, T., LeBlanc, E., Rennie, P. S., Welch, W. J., and Cherkasov, A. Toxic colors: the use of deep learning for predicting toxicity of compounds merely from their graphic images. Journal of Chemical Information and Modeling, 58(8):1533–1543, 2018.
- Hay et al. (2014) Hay, M., Thomas, D. W., Craighead, J. L., Economides, C., and Rosenthal, J. Clinical development success rates for investigational drugs. Nature Biotechnology, 32(1):40–51, 2014.
- Huang et al. (2016) Huang, R., Xia, M., Nguyen, D.-T., Zhao, T., Sakamuru, S., Zhao, J., Shahane, S. A., Rossoshek, A., and Simeonov, A. Tox21 challenge to build predictive models of nuclear receptor and stress response pathways as mediated by exposure to environmental chemicals and drugs. Frontiers in Environmental Science, 3:85, 2016.
- Hwang et al. (2016) Hwang, T. J., Carpenter, D., Lauffenburger, J. C., Wang, B., Franklin, J. M., and Kesselheim, A. S. Failure of investigational drugs in late-stage clinical development and publication of trial results. JAMA Internal Medicine, 176(12):1826–1833, 2016.
- Jimenez-Carretero et al. (2018) Jimenez-Carretero, D., Abrishami, V., Fernández-de Manuel, L., Palacios, I., Quílez-Álvarez, A., Díez-Sánchez, A., del Pozo, M. A., and Montoya, M. C. Tox_(R)CNN: Deep learning-based nuclei profiling tool for drug toxicity screening. PLoS Computational Biology, 14(11), 2018.
- Kavlock et al. (2009) Kavlock, R. J., Austin, C. P., and Tice, R. R. Toxicity testing in the 21st century: Implications for human health risk assessment. Risk Analysis, 29(4):485–487, 2009.
- Kazius et al. (2005) Kazius, J., McGuire, R., and Bursi, R. Derivation and validation of toxicophores for mutagenicity prediction. Journal of Medicinal Chemistry, 48(1):312–320, 2005.
- Kazius et al. (2006) Kazius, J., Nijssen, S., Kok, J., Bäck, T., and IJzerman, A. P. Substructure mining using elaborate chemical representation. Journal of Chemical Information and Modeling, 46(2):597–605, 2006.
- Krewski et al. (2010) Krewski, D., Acosta Jr, D., Andersen, M., Anderson, H., Bailar III, J. C., Boekelheide, K., Brent, R., Charnley, G., Cheung, V. G., Green Jr, S., et al. Toxicity testing in the 21st century: A vision and a strategy. Journal of Toxicology and Environmental Health, Part B, 13(2-4):51–138, 2010.
- Limban et al. (2018) Limban, C., Nuţă, D. C., Chiriţă, C., Negreș, S., Arsene, A. L., Goumenou, M., Karakitsios, S. P., Tsatsakis, A. M., and Sarigiannis, D. A. The use of structural alerts to avoid the toxicity of pharmaceuticals. Toxicology Reports, 5:943–953, 2018.
- Liu et al. (2019) Liu, S., Demirel, M. F., and Liang, Y. N-gram graph: simple unsupervised representation for graphs, with applications to molecules. In Advances in Neural Information Processing Systems, pp. 8464–8476, 2019.
- Luco & Ferretti (1997) Luco, J. M. and Ferretti, F. H. QSAR based on multiple linear regression and PLS methods for the anti-HIV activity of a large group of HEPT derivatives. Journal of Chemical Information and Computer Sciences, 37(2):392–401, 1997.
- Matsuzaka & Uesawa (2019) Matsuzaka, Y. and Uesawa, Y. Prediction model with high-performance constitutive androstane receptor (CAR) using DeepSnap-Deep Learning approach from the Tox21 10K compound library. International Journal of Molecular Sciences, 20(19):4855, 2019.
- Mayr et al. (2016) Mayr, A., Klambauer, G., Unterthiner, T., and Hochreiter, S. DeepTox: Toxicity prediction using deep learning. Frontiers in Environmental Science, 3:80, 2016.
- OECD (2016) OECD. Guidance document for the use of AOPs in developing IATA, 2016. Accessed online.
- Polishchuk et al. (2009) Polishchuk, P. G., Muratov, E. N., Artemenko, A. G., Kolumbin, O. G., Muratov, N. N., and Kuz’min, V. E. Application of random forest approach to QSAR prediction of aquatic toxicity. Journal of Chemical Information and Modeling, 49(11):2481–2488, 2009.
- Rogers & Hahn (2010) Rogers, D. and Hahn, M. Extended-connectivity fingerprints. Journal of Chemical Information and Modeling, 50(5):742–754, 2010.
- Tang et al. (2018) Tang, W., Chen, J., Wang, Z., Xie, H., and Hong, H. Deep learning for predicting toxicity of chemicals: A mini review. Journal of Environmental Science and Health, Part C, 36(4):252–271, 2018.
- Terada (1990) Terada, H. Uncouplers of oxidative phosphorylation. Environmental Health Perspectives, 87:213–218, 1990.
- Tice et al. (2013) Tice, R. R., Austin, C. P., Kavlock, R. J., and Bucher, J. R. Improving the human hazard characterization of chemicals: a Tox21 update. Environmental Health Perspectives, 121(7):756–765, 2013.
- Yang et al. (2017) Yang, H., Li, J., Wu, Z., Li, W., Liu, G., and Tang, Y. Evaluation of different methods for identification of structural alerts using chemical Ames mutagenicity data set as a benchmark. Chemical Research in Toxicology, 30(6):1355–1364, 2017.