A fresh look at the RR Lyrae population in the Draco dwarf spheroidal galaxy with Gaia
Abstract
We present a catalogue of 285 RR Lyrae stars (RRLs) in the Draco dwarf spheroidal galaxy (dSph), obtained by combining data from a number of different surveys including the second data release (DR2) of the European Space Agency (ESA) cornerstone mission Gaia. We have determined individual distances to the RRLs in our sample using for the first time a Gaia -band luminosity-metallicity relation () and study the structure of the Draco dSph as traced by its RRL population. We find that the RRLs located in the western/south-western region of Draco appear to be closer to us, which may be a clue of interaction between Draco and the Milky Way (MW). The average distance modulus of Draco measured with the RRLs is mag, corresponding to a distance of kpc, in good agreement with previous determinations in the literature. Based on the pulsation properties of the RRLs we confirm the Oosterhoff-intermediate nature of Draco. We present an additional sample of 41 candidate RRLs in Draco, which we selected from the Gaia DR2 catalogue based on the uncertainty of their -band magnitudes. Additional epoch data that will become available in the Gaia third data release (DR3) will help to confirm whether these candidates are bona-fide Draco RRLs.
keywords:
Stars: variables: RR Lyrae – galaxies: Draco – galaxies: distance1 Introduction
RR Lyrae stars (RRLs) play an important role in different branches of astronomy. They are radially pulsating variables that populate the instability strip region of the horizontal branch (HB) in the colour-magnitude diagram (CMD), hence they can give a clue of the HB morphology and help characterising the core helium burning evolutionary stage of low mass stars (< 1 M☉). RRLs play an important role in the study of the resolved stellar population in galaxies as they are valuable tracers of the old stellar population (Age > 10 Gyr) abundant in globular clusters and galactic halos. Specific properties of the RRLs belonging to Local Group galaxies, such as the Oosterhoff dichotomy (Oosterhoff, 1939), allow us to constrain to what extent these systems could have contributed to the formation of larger galaxies (e.g. Clementini 2009) and, therefore, test existing cosmological models. Finally, RRLs are important distance indicators, since their luminosity/absolute magnitude (hence distance) can be inferred from the observed de-reddened apparent magnitude by means of the absolute magnitude - metallicity relation () in the visual band (e.g. Clementini et al. 2003; Cacciari & Clementini 2003; Bono et al. 2003; Gaia Collaboration et al. 2017; Muraveva et al. 2018a) and period-luminosity-metallicity relations () in the near- (e.g Longmore et al. 1986; Catelan et al. 2004; Sollima et al. 2006, 2008; Borissova et al. 2009; Muraveva et al. 2015, 2018a; Gaia Collaboration et al. 2017) and mid-infrared (e.g. Madore et al. 2013; Dambis et al. 2014; Klein et al. 2014; Neeley et al. 2015, 2017; Sesar et al. 2017a; Gaia Collaboration et al. 2017; Muraveva et al. 2018a, b) passbands, thus allowing estimations of the distance to the host systems.
A significant contribution to the study of variable stars and of RRLs in particular, is being provided by the European Space Agency (ESA) mission Gaia, which is designed to chart a three-dimensional map of the Milky Way (MW, Gaia Collaboration et al. 2016a, b) by repeatedly monitoring the whole sky down to a limiting magnitude of about 21 mag in the Gaia -band. Gaia Data Release 2 (DR2), on 2018 April 25 published a catalogue of more than half a million sources classified as variables of different types in the MW and beyond (Holl et al., 2018). Classification of candidate RRLs in Gaia DR2 was performed by (i) the classifiers of the general variability detection pipeline applied to sources with more than 20 epochs (hereafter nTransits:20+ classifier; Eyer et al. 2017, Holl et al. 2018) and, (ii) by a fully statistical approach specifically developed to classify all-sky high-amplitude pulsating stars with two or more epoch data (hereafter nTransits:2+ classifier, Rimoldini et al. 2019). The two classification procedures provided a total sample of 228,904 candidate RRLs (Holl et al., 2018). The Specific Objects Study pipeline for the processing of Cepheids and RRLs (SOS Cep&RRL; Clementini et al. 2016, 2019) confirmed as bona-fide RRLs 140,784 of them, among which approximately 1/3 are new discoveries, and provided their pulsation properties (period, amplitude), along with intensity-averaged mean magnitudes in the Gaia , and bands calculated by modelling the light curves, as well as metallicity and extinction for a fraction of them computed from the Fourier parameters of the -band light curves (Clementini et al., 2019). Gaia DR2 also published accurate positions, parallaxes and proper motions for a sample of about 1.3 billion sources brighter than mag (Gaia Collaboration et al., 2018a), which includes a large number of RRLs. Unfortunately, the accuracy of the Gaia DR2 parallaxes ( mas for mag) drops dramatically for fainter objects, reaching values of about 2 mas at mag (Gaia Collaboration et al., 2018a), which hampers an accurate estimation of distance directly from Gaia parallaxes for sources with such faint magnitudes. Thus, the use of standard candles such as RRLs becomes crucial to overcome Gaia’s limits in the context of distance scale measurements.
The Draco dwarf spheroidal (dSph) galaxy is a MW satellite located at kpc (McConnachie, 2012) from us. Due to its large distance, the mean Gaia DR2 parallax of Draco members happens to be negative (, Gaia Collaboration et al. 2018b), hence, basically useless for a direct estimation of distance. However, the HB of Draco is at magnitude mag. This is well above Gaia’s limiting magnitude, thus, classification, basic properties and photometry of Draco RRLs are available in the Gaia DR2 catalogue, and an accurate distance to Draco dSph can be estimated using the RRL -band luminosity - metallicity relation (; Muraveva et al. 2018a). In past years, the RRLs of Draco have been analysed in a number of different studies. Baade & Swope (1961) discovered 133 RRLs in this dSph. Their photometry was later re-analysed by Nemec (1985) who provided new estimations of period for the RRLs in the Baade & Swope (1961) sample. Bonanos et al. (2004) provided a catalogue of 146 RRLs observed with the 1.2 m telescope of the Fred Lawrence Whipple Observatory, of which 131 were already known from Baade & Swope (1961). Finally, Kinemuchi et al. (2008) performed a CCD survey of the Draco dSph galaxy with the 1.0 m telescope at the US Naval Observatory (USNO) and the 2.3 m telescope at the Wyoming Infrared Observatory (WIRO) and presented a catalogue of 270 RRLs, which includes 165 RRLs previously known in this dSph.
In this study we have compiled the most complete catalogue of RRLs in Draco by looking for additional RRLs belonging to this dSph in the variable star catalogues of the Catalina Sky Survey (Larson et al., 2003), the All Sky Automated Survey (ASAS, Pojmanski 1997), the Lincoln Near-Earth Asteroid Research (LINEAR; Stokes et al. 2000), the Palomar Transient Factory (PTF, Law et al. 2009), Pan-STARRS (Kaiser et al., 2010), the General Catalogue of Variables Stars (GCVS, Samus’ et al. 2017) and in the lists of RRLs published in Gaia DR2 (Holl et al., 2018; Clementini et al., 2019; Rimoldini et al., 2019). We have analysed the Oosterhoff properties and measured individual distances to each RRL in the sample using, for the first time the Gaia bands, and have studied their spatial distribution which suggests that Draco may be in tidal interaction with the MW.
The paper is organised as follows. In Section 2 we describe our updated catalogue of RRLs in Draco and present the main properties of the Draco RRL population. In Section 3 we measure the distance and analyse the structure of the Draco dSph as traced by its RRLs. In Section 4 we discuss the Oosterhoff classification of Draco RRLs. In Section 5 we present a catalogue of additional candidate RRLs belonging to Draco which were selected based on the uncertainty of their -band magnitudes in the Gaia DR2 catalogue. A summary of our results and main conclusions are presented in Section 6.
2 Data
2.1 Catalogues of RRLs in Draco
Our main goal was to compile the most complete as possible catalogue of RRLs in the Draco dSph. Kinemuchi et al. (2008) published mean and magnitudes, amplitudes, periods and photometric metallicities for 9 Anomalous Cepheids (ACs), 2 eclipsing binaries (EBs), 12 slow irregular red variables and 270 RRLs in this dSph, which we have used as a starting point to build our own catalogue of RRLs in Draco. As a first step, we searched for RRLs in the field of Draco in the catalogues of currently available large variability surveys (Catalina, ASAS, LINEAR, PTF, Pan-STARRS, GCVS). We selected from these catalogues all RRLs located in a circular region of 2 deg in radius around the centre of Draco (RA=260.05162 deg; Dec=57.91536 deg, J2000, Kinemuchi et al. 2008). Such a rather large radius, significantly exceeding the half-light radius of Draco (, McConnachie 2012), was adopted in order to include RRLs located in the outskirts of the galaxy and find those which might have been stripped from Draco as a result of the interaction with the MW.
A number of catalogues produced by the Catalina Sky Survey (Larson et al., 2003) comprise variable stars located within 2 deg from the centre of Draco. Specifically, Drake et al. (2014) found 35 periodic variable stars of different types, while 8 RRLs located towards Draco were identified by Drake et al. (2013a), one by Drake et al. (2013b) and 6 by Abbas et al. (2014). No RRLs or periodic variables of other types were identified in the Draco area by the ASAS survey (Pojmanski, 1998, 2000, 2002; Pigulski et al., 2009) and, similarly, the PTF catalogue does not contain RRLs belonging to Draco. On the other hand, Palaversa et al. (2013) and Sesar et al. (2013) found, respectively, 11 periodic variables and 3 RRLs in the data of the LINEAR survey (Stokes et al., 2000) and Sesar et al. (2017b) identified 312 RRLs using the multi-band, multi-epoch photometry provided by Pan-STARRS (Kaiser et al., 2010). Finally, 156 variable stars of different types are included in the GCVS (Samus’ et al., 2017).
As a last step, we checked the lists of variable stars published in the Gaia DR2 catalogue and available through the Gaia Archive website111http://archives.esac.esa.int/gaia. In total 269 DR2 sources in the Draco area are classified as candidate variable stars by the nTransit:20+ and the nTransit:2+ classifiers of the Gaia general variability processing pipeline (Eyer et al. 2017; Rimoldini et al. 2019). Furthermore, the SOS Cep&RRL pipeline confirmed the classification as RRLs and provided characteristic parameters for 239 of the variables identified as candidate RRLs in the Draco region by the classifiers (Clementini et al. 2019; see gaiadr2.vari_rrlyrae table).
The Gaia archive provides three independent measurements of the mean magnitude of the sources observed by Gaia: (i) phot_g_mean_mag which is available for all sources in the Gaia DR2 general catalogue (see gaiadr2.gaia_source table, hereafter, DR2 gaia_source catalogue) and it is calculated by the Gaia photometric processing pipelines (Evans et al., 2018); (ii) mean_mag_g_fov given in table gaiadr2.vari_time_series_statistics for all stars classified as variables and calculated as the mean magnitude of the time series data (Holl et al., 2018); and (iii) int_average_g for RRLs and Cepheids confirmed by the SOS Cep&RRL pipeline (Clementini et al., 2016, 2019), which is computed as the mean in flux of the Fourier model that best fits the source time-series data (gaiadr2.vari_rrlyrae and gaiadr2.vari_cepheid tables, for RRLs and Cepheids, respectively), with the latter values to be preferred, whenever available (Gaia Collaboration et al., 2018a; Arenou et al., 2018). Since phot_g_mean_mag mean magnitudes are available for all sources in the DR2 general catalogue and (phot_bp_mean_mag), (phot_rp_mean_mag) mean magnitudes are available for % of them (Gaia Collaboration et al., 2018a) we used these mean values in our study of the Draco CMD (Section 2.2). However, we relied on the intensity-averaged magnitudes computed by the SOS Cep&RRL pipeline, which provide a more accurate estimation of the mean magnitudes and are available for about 75% of the RRLs in our sample, to measure the distance and analyse the structure of Draco (Section 2.3). For the remaining stars (18% of our sample) we either adopted the phot_g_mean_mag mean magnitudes or obtained the -band mean magnitudes by performing our own analysis of the time series data available in the Gaia archive (6% of the sample), or transformed the literature and mean magnitudes to mean magnitudes (1% of the sample).
Compiling and crossmatching all the aforementioned catalogues we obtained a total sample of 379 variables of different types. Among them 336 are classified as RRLs in at least one of the catalogues we have analysed. In order to obtain the most complete census of the RRLs in Draco we proceeded with the full sample of 336 RRLs, even though for some of them there is inconsistency of classification among the various catalogues.
2.2 Sample selection
In order to extract from the sample of 336 RRLs the true members of the Draco dSph, we applied the following selection procedure:
-
1.
We constructed the , () CMD of Draco using sources from the Gaia general catalogue.
-
2.
We crossmatched our sample of 336 RRLs against the Gaia general catalogue and retrieved their , and magnitudes, which were used to place the sources on the CMD.
-
3.
Based on the distribution on the CMD we selected a sample of RRLs that we suggest are most likely bona-fide Draco members.
-
4.
To reduce the chances of removing RRLs that are true Draco members but which have incorrect Gaia mean magnitudes, we plotted on the CMD 279 RRLs which have a counterpart in the Kinemuchi et al. (2008) catalogue, using the , and magnitudes inferred from their and magnitudes, and update our sample based on this.
-
5.
Finally, we used the Gaia proper motions to check the membership to Draco of the RRLs in our sample.
In the following we describe in detail the various steps of our selection procedure.
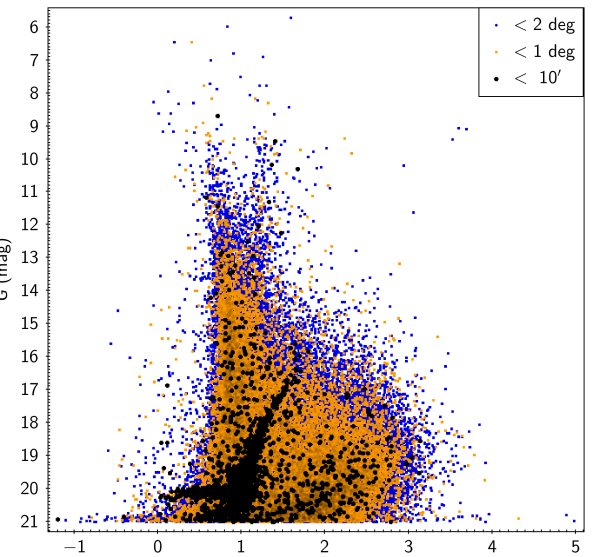
We retrieved from the Gaia general catalogue all sources (83,724 in total) located within a circular area of 2 deg in radius around the centre of Draco. They are plotted as blue points in the , () CMD in Fig. 1, whereas orange and black points show sources within 1 deg (22,221 sources) and (1803 sources), respectively. The latter corresponds to the half-light radius of the Draco galaxy according to McConnachie (2012). The CMD of the 1803 sources within is characterised by a well pronounced Red Giant Branch (RGB) and an HB with mean magnitude approximately at mag. We used this CMD in the following analysis to select from our sample of 336 RRLs those which are true members of Draco.
We then crossmatched our sample of 336 RRLs against the DR2 general catalogue and found counterparts within for 335 of them222One star observed only by the Catalina Sky Survey (J172209.3+560415; Drake et al. 2014) has no counterpart in the Gaia catalogue. Drake et al. (2014) provide only a mean magnitude for this object of mag, which would place the star mag above the HB of Draco ( mag), hence ruling out that the star can be an RRL belonging to Draco. Among these 335 sources 174 (52% of the sample) are located within from the centre of Draco.
The left panel of Fig. 2 shows the distribution of the 335 RRLs on the CMD of the 1803 sources located within from the centre. The vast majority of these RRLs are nicely placed on the Draco HB. However, their distribution in colour () is significantly extended ( mag) with sources showing rather extreme colours, such as ( 2.0 - 3.5 mag, clearly indicating issues with the Gaia , magnitudes of these RRLs. This is not surprising since the Draco RRLs are very close to the Gaia limiting magnitude, particularly in the and passbands. We also note that only very few of the RRLs in this region have , mean magnitudes estimated by the SOS Cep&RRL pipeline (see gaiadr2.vari_rrlyrae), therefore confirming the limited reliability of Gaia colours for variable stars with such faint magnitudes. Additionally, 44 RRLs appear to be significantly brighter than the HB having mean magnitudes between 19.5 and 13 mag in the band. They might either be foreground RRLs or, more likely, their mean magnitudes in the DR2 gaia_source catalogue could be incorrect because they are blended with sources not resolved by Gaia, or because the outlier rejection procedure applied for DR2 in the general photometric processing (Evans et al., 2018) led to incorrect mean values (see, Gaia Collaboration et al. 2018a; Arenou et al. 2018). Finally, some of these variables could be wrong cross-identifications. Indeed, crossmatching the different literature lists with the DR2 gaia_source catalogue might have caused wrong cross-identifications due to uncertainties in the source coordinates. Whatever the cause, in the following we consider all sources located in the region: mag and mag of the CMD (dashed box in Fig. 2), as RRLs likely belonging to the Draco dSph and the variables located outside this region (cyan open triangles in Fig. 2) either as foreground RRLs or as RRLs belonging to Draco for which the photometry in the DR2 gaia_source catalogue is incorrect for some of the reasons discussed previously. There is a total number of 290 variable stars inside the dashed box in Fig. 2, among which 288 are classified as RRLs (blue filled triangles) and two (red filled squares) are reported as RRLs in all studies, but Kinemuchi et al. (2008) who classify them as ACs.
| Gaia source_id | RA | Dec | Catalogue∗ | Type | Period | Source∗∗ | ||||||
|---|---|---|---|---|---|---|---|---|---|---|---|---|
| (deg) | (deg) | (days) | (mag) | (mas) | (mas/yr) | (mas/yr) | (mag) | (mag) | ||||
| 1433901705381651840 | 259.21302 | 58.35194 | (5) | RRc | 0.41714 | 0.483 | 20.020 | (1) | 19.473 | |||
| 1433898406846766848 | 259.24834 | 58.32383 | (5) | RRc | 0.48788 | 0.400 | 20.052 | (1) | 19.505 | |||
| 1433121704960670848 | 259.29090 | 57.86995 | (5) | RRab | 0.60396 | 0.783 | 20.161 | (1) | 19.615 | |||
| 1433128778770683008 | 259.35005 | 58.04222 | (2) | RRab | 0.55392 | 0.861 | 20.130 | (2) | 19.584 | |||
| 1433055729967360128 | 259.37152 | 57.57381 | (1), (3), (5) | RRab | 0.61233 | 0.700 | 20.004 | (3) | 19.458 | |||
| 1433105929544530816 | 259.44539 | 57.72432 | (1), (3), (5) | RRc | 0.35233 | 0.670 | 20.102 | (3) | 19.556 | |||
| 1433125274077368192 | 259.49618 | 58.03480 | (1), (3), (5) | RRab | 0.62179 | 0.680 | 20.077 | (3) | 19.530 | |||
| 1433057314810014464 | 259.50426 | 57.62156 | (2) | RRc | 0.37456 | 0.638 | 20.058 | (2) | 19.512 | |||
| 1433107205150933248 | 259.51113 | 57.80387 | (1), (2), (5) | RRab | 0.62424 | 0.680 | 20.074 | (2) | 19.528 |
∗ The source was classified as RRL by: (1) Kinemuchi et al. (2008); (2) the Gaia DR2 general variability detection classifiers (Eyer et al. 2017, Rimoldini et al. 2019); (3) the Gaia SOS Cep&RRL pipeline (Clementini et al., 2019); (4) the GCVS (Samus’ et al., 2017); (5) Pan-STARRS (Sesar et al., 2017b).
∗∗ The mean magnitude is: (1) taken from the DR2 gaia_source catalogue; (2) calculated in this study with the GRATIS software; (3) taken from table: gaiadr2.vari_rrlyrae, which summarises results for RRLs obtained by the SOS Cep&RRL pipeline (Clementini et al., 2019); (4) obtained transforming the , mean magnitudes of Kinemuchi et al. (2008) to the Gaia passbands with the transformation relations provided in Evans et al. (2018).
This table is published in its entirety online (Supporting information); a portion is shown here for guidance regarding its form and content.
In order to further test the soundness of our procedure to select bona-fide RRLs belonging to Draco, in the right panel of Fig. 2 we plot the CMD of the sources located within from the centre of Draco with superimposed 279 sources, out of our sample of 335 variables, which have a counterpart in the Kinemuchi et al. (2008) catalogue of variable stars in Draco. The , and mean magnitudes of these 279 sources were computed from the , magnitudes of Kinemuchi et al. (2008) using the transformation equations provided by Evans et al. (2018). The spread in colour of the RRLs (blue filled triangles) along the Draco HB is now reduced to less than 0.7 mag. Furthermore, two variable stars classified as ACs by Kinemuchi et al. (2008) (red filled squares) which fell inside the RR Lyrae region in the left panel of Fig. 2 are now located above the HB, consistently with Kinemuchi et al. (2008)’s classification as ACs. We therefore discard them from our RRL sample. Conversely, two RRLs according to Kinemuchi et al. (2008) which were located outside the RRL region in the left panel of Fig. 2 (cyan open triangles) now nicely fall within the dashed region of Fig. 2. They are Gaia source_id 1433157331713106304 for which the DR2 gaia_source catalogue provides a magnitude about 0.8 mag brighter and a colour about 0.4 mag redder than obtained by transforming to Gaia passbands the Kinemuchi et al. (2008)’s , mean magnitudes; and Gaia source_id 1433203652936566016 which has mag in Kinemuchi et al. (2008) to compare with mag, mag and mag from the DR2 gaia_source catalogue. For these two RRLs we rely on Kinemuchi et al. (2008) classification and magnitudes, hence we added them to our sample of bona-fide RRLs in Draco and adopt: mag and mag for the former and mag and mag for the latter, obtained by transforming the Kinemuchi et al. (2008) and magnitudes. Our final sample of Draco RRLs thus consists of 290 stars.
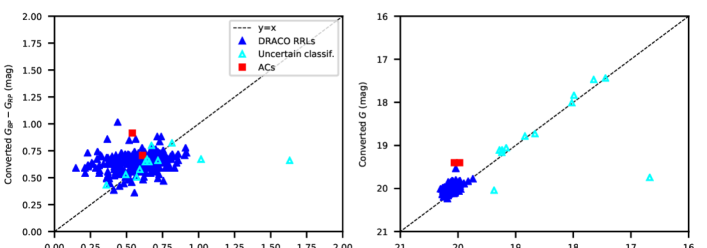
In the left panel of Fig. 3 we compare the () colours obtained converting the mean and magnitudes of Kinemuchi et al. (2008) with the colours provided in the Gaia main catalogue for the 279 RRLs, while the right panel shows the same comparison for the magnitudes. There is rather poor agreement between the observed and converted colours, again confirming that Gaia colours at such faint magnitudes should be treated with caution. Conversely, observed and converted magnitudes are in good agreement for all but the two ACs and the two RRLs discussed previously.
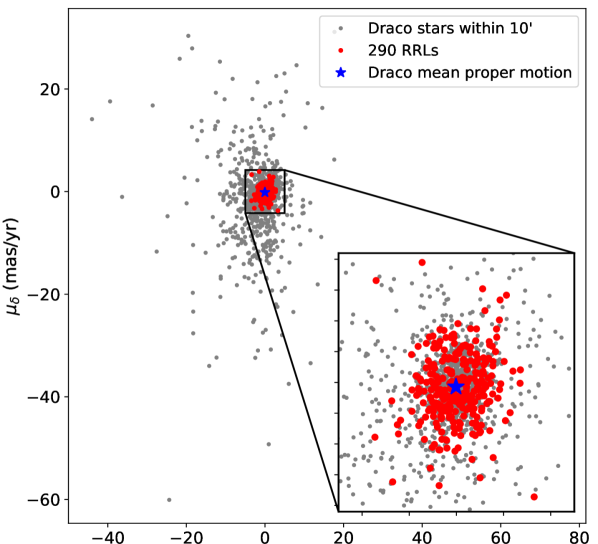
Gaia gives us a further, unprecedented opportunity to check whether these 290 RRLs truly belong to the Draco galaxy through the analysing of their proper motions. In Fig. 4 grey points show the distribution in the proper motion plane of the 1803 sources within from the centre of Draco, while red circles mark the 290 RRLs in our sample. They are all within an area of mas/yr around the mean proper motion value of the Draco members calculated by Gaia Collaboration et al. (2018b): mas/yr; mas/yr (blue star in Fig. 4). Their distribution appears to be significantly more concentrated than observed for other sources within the Draco half-light radius (grey points). We consider all 290 RRLs to be true members of Draco based on their distribution on the CMD and proper motion plane. An additional test of membership will be performed in Section 3 based on the individual distances measured for these RRLs. Among the 290 RRLs 236 (81%) were classified as RRLs based on the Gaia DR2 data (Clementini et al., 2019; Rimoldini et al., 2019), 267 (92%) by Kinemuchi et al. (2008), 131 (45%) by the GCVS (Samus’ et al., 2017) and 275 (95%) by Sesar et al. (2017b) using Pan-STARRS data.
2.3 Mean magnitudes of Draco RRLs
In our study of the Draco CMD (Section 2.2) we relied on the mean magnitudes estimated in the Gaia photometric processing (Evans et al., 2018), since they are available for all sources in the DR2 gaia_source catalogue. However, in our study of the distance and structure of Draco using the RRLs (Section 3), a more accurate estimation of the -band mean magnitudes is needed. Following recommendations in Gaia Collaboration et al. (2018a) and Arenou et al. (2018) in Section 3 we use the -band intensity-averaged magnitudes calculated by model fitting the time-series data as part of the Cepheids and RRLs processing performed with the SOS Cep&RRL pipeline (Clementini et al., 2019). These are available for 217 of the 290 RRLs in our sample. For the other 19 RRLs which do not have intensity-averaged magnitudes estimated by the SOS Cep&RRL pipeline we analysed the time series data available in the Gaia archive with the GRaphical Analyzer of TImes Series package (GRATIS, custom software developed at the Observatory of Bologna by P. Montegriffo, see e.g. Clementini et al. 2000) and modelled the -band light curves adopting the pulsation periods from Kinemuchi et al. (2008) and Sesar et al. (2017b) for 16 and one RRLs, respectively, whereas derived the period ourselves with GRATIS for the remaining two stars.
For a further 52 RRLs we adopted the mean magnitudes provided in the DR2 gaia_source catalogue. For the remaining two RRLs mean magnitudes were calculated transforming Kinemuchi et al. (2008) magnitudes, as discussed in Section 2.2. The mean magnitudes are provided in column 11 of Table 1.
| Gaia | Type | Period | |||
|---|---|---|---|---|---|
| source_id | (days) | (mag) | (mag) | (mag) | |
| 1433128778770683008∗ | RRab | 0.553924 | 0.861 | 20.130 | 0.134 |
| 1433057314810014464∗ | RRc | 0.374556 | 0.578 | 20.058 | 0.149 |
| 1433202519064167808∗∗ | RRab | 0.551806 | 1.120 | 20.008 | 0.003 |
∗ Parameters derived in this study using the GRATIS package.
The uncertainty in the mean magnitude of the Draco RRLs which were processed through the Gaia DR2 SOS Cep&RRL pipeline is 0.005 mag (as estimated via Monte Carlo simulations, see Clementini et al. 2019) while is of 0.01 mag for the RRLs with mean magnitude taken from the DR2 gaia_source catalogue (as calculated from the mean flux uncertainty). In order to estimate this uncertainty in a more consistent and rigorous way we have analysed the light curves of a test sample of 75 sources extracted from the sample of 290 RRLs (25%) with the GRATIS package and estimated the mean dispersion of the data points around the best-fit models of the light curves computed with GRATIS: mag. We consider this to be a most reliable estimation of the -band mean magnitude uncertainty and adopt this value for all the RRLs in our sample.
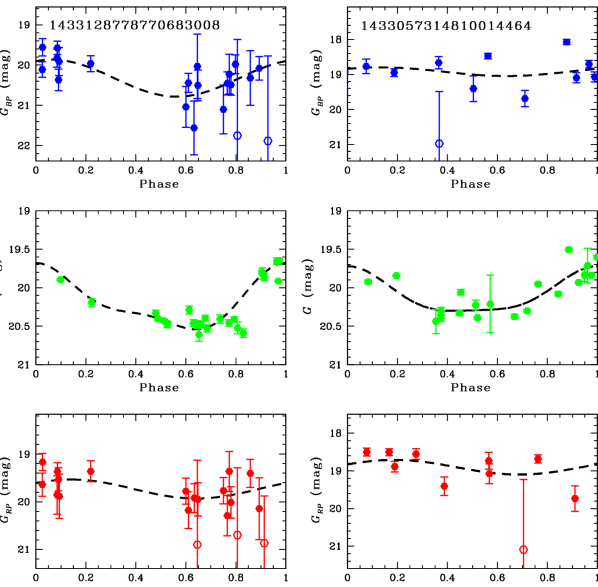
Gaia discovered three new RRLs in Draco: two of them were classified as candidate RRLs by the DR2 general variability detection classifiers (Eyer et al. 2017, Rimoldini et al. 2019) which we confirm in our study, and the third one is a source already confirmed as RRL by the SOS Cep&RRL pipeline (Clementini et al., 2019). Table 2 summarises information on these three new RRLs. Periods, amplitudes in the -band and intensity-averaged mean magnitudes in the table are those calculated by the Gaia SOS Cep&RRL pipeline for Gaia source_id 1433202519064167808, whereas for the other two sources were derived in the present study using the GRATIS package. Furthermore, the source with Gaia source_id 1433057314810014464 was classified as fundamental mode RRL (RRab) by the classifiers, however, according to the period derived with the GRATIS package we re-classify this source as first-overtone (RRc) RRL. Fig. 5 shows light curves in the , and passbands of the two RRLs, for which main parameters were calculated by us. The quality of the light curves drops dramatically in the and bands, hence no reliable mean magnitudes could be computed in these passbands.
3 Distance and structure of the Draco dSph
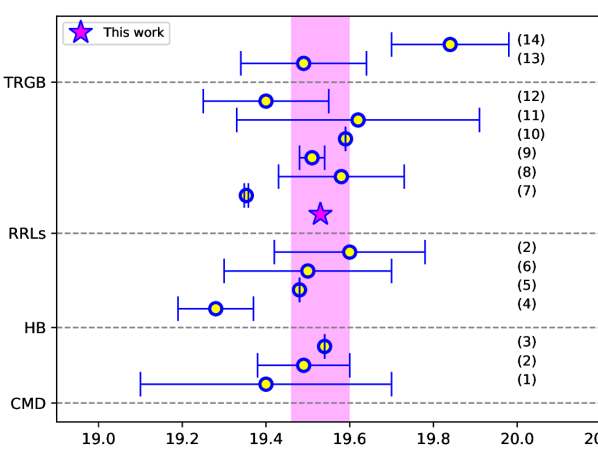
The most direct method of distance estimation is parallax, however, this technique can be significantly limited for faint distant objects, such as stars in the Draco dSph. Indeed, Gaia Collaboration et al. (2018b) found a mean value of the Gaia DR2 parallaxes for Draco members to be negative ( mas), hence, unusable for distance measurement. Thus, in order to measure the distance to Draco dSph we must rely on indirect techniques. In the literature there are several estimates of the distance to Draco based on different indirect methods such as: (i) the galaxy CMD (e.g. Stetson 1979; Dolphin 2002; Weisz et al. 2014); (ii) the luminosity of the HB (e.g. Irwin & Hatzidimitriou 1995; Grillmair et al. 1998; Aparicio, Carrera & Martínez-Delgado 2001; Dolphin 2002); (iii) the RRLs (e.g. Nemec 1985; Bonanos et al. 2004; Kinemuchi et al. 2008; Tammann, Sandage & Reindl 2008; Sesar et al. 2017b; Hernitschek et al. 2019); (iv) the tip of the RGB (TRGB; Cioni & Habing 2005; Bellazzini et al. 2002). A comparison of Draco distance moduli obtained by these various studies is presented in Fig. 6.
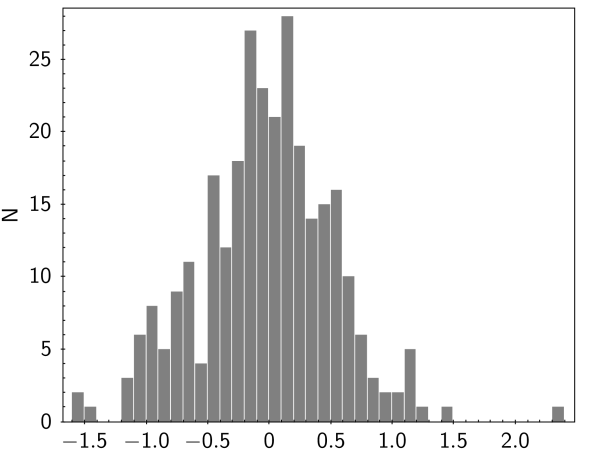
We have used the sample of RRLs selected as described in Section 2.2 to measure the distance and study the structure of Draco. The mean apparent magnitude of the 290 RRLs in our sample is mag. At such a faint magnitude, the uncertainty in Gaia DR2 parallaxes can be as large as 2 mas (Gaia Collaboration et al., 2018a), therefore increasing the number of stars with a negative parallax value. This is confirmed by the distribution of parallaxes shown in Fig. 7. Only 144 RRLs (50% of our sample) have a positive value of parallax with a mean relative error , while the mean parallax of the whole sample of 290 RRLs is mas, hence cannot be used to measure the distance to Draco. However, RRLs are valuable tools for indirect measurements of distances because their absolute magnitude can be inferred from a number of fundamental relations these variables conform to (Section 1). In the following, to calculate individual distances to the 290 RRLs in our sample we have used the relation from Muraveva et al. (2018a):
| (1) |
This relation is calibrated on Gaia DR2 parallaxes of 160 MW RRLs, corrected for the Gaia zero-point offset (Lindegren et al., 2018; Arenou et al., 2018) applying a Bayesian approach (Delgado et al., 2019), in combination with accurate -band mean magnitudes computed by the SOS Cep&RRL pipeline and metallicities from Dambis et al. (2013). In Muraveva et al. (2018a) we found a non-negligible dependence of the absolute -band magnitudes on metallicity, hence, an accurate estimation of metal abundance for the Draco RRLs is crucial. Kinemuchi et al. (2008) derived a mean metallicity for Draco of dex from the Fourier parameters of the light curves of fundamental mode RRLs in this dSph. Kirby et al. (2013) measured a metallicity of [Fe/H]= dex based on spectroscopic observations of 269 Draco members. Finally, Walker, Olszewski & Mateo (2015) measured individual spectroscopic metallicities for 1565 Draco members, among which 16 RRLs in our sample. The mean metallicity of these 16 RRLs is dex, in excellent agreement with Kirby et al. (2013) measurement. We therefore have adopted the metallicity estimate by Kirby et al. (2013) in our analysis, which is based on a larger number of stars.
| Gaia source_id | RA | Dec | Source | Distance modulus | Angular distance∗ | Period |
|---|---|---|---|---|---|---|
| (deg) | (deg) | (mag) | (deg) | (days) | ||
| 1432893659376784000 | 261.40951 | 57.29998 | Gaia + PS1 | 0.968 | 0.60606 | |
| 1422419196214658944 | 263.24290 | 57.79058 | Gaia + PS1 | 1.722 | 0.65891 | |
| 1433875037928103552 | 258.69214 | 58.01085 | PS1 | 0.708 | 0.47216 | |
| 1420713746305299840 | 259.60329 | 56.09359 | PS1 | 1.835 | 0.49933 | |
| 1434162354060730752 | 259.04649 | 58.90067 | PS1 | 1.108 | 0.36269 | |
| 1432778172000958336 | 258.23426 | 56.31075 | PS1 | 1.873 | 0.49841 | |
| 1433085485501417984 | 258.18352 | 57.54400 | PS1 | 1.046 | 0.59077 |
∗ Angular distance from the centre of Draco according to Kinemuchi et al. (2008)
Following Bonanos et al. (2004) and Kinemuchi et al. (2008) we adopt for the reddening towards Draco the value mag (Schlegel, Finkbeiner & Davis, 1998), which results in a -band extinction mag for a total-to-selective extinction ratio (Cardelli et al., 1989). The -band extinction was then transformed to the Gaia -band extinction mag using relations in Bono et al. (2019). By combining the -band absolute magnitudes (Muraveva et al., 2018a) and the -band apparent magnitudes derived in Section 2.2 we obtained individual distance moduli for each of our 290 RRLs. The uncertainty in these individual distance moduli is on the order of mag, due to the combination of the large uncertainties in the mean magnitudes (Section 2.2) and in the coefficients of the relation from Muraveva et al. (2018a). Hopefully, both these issues will improve in Gaia Data Release 3 (DR3) thanks to a better sampling of the light curves as well as the improved precision and reduced systematics in the parallax measurements.
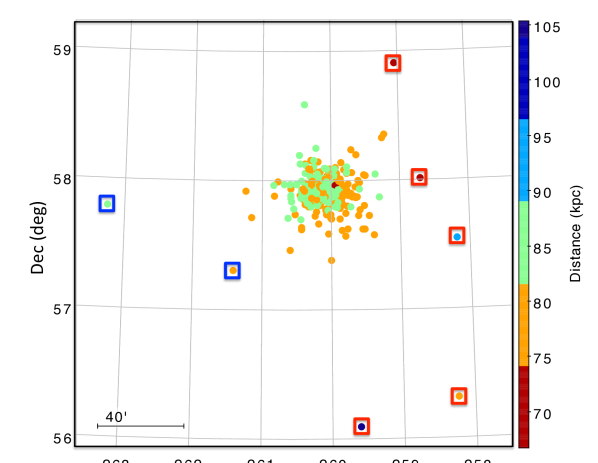
Fig. 8 shows the spatial distribution of the 290 RRLs in our sample, with the RRLs colour-coded according to their distances. Seven sources (highlighted with squares in Fig. 8) are located at angular distances more than 0.7 deg from the centre of Draco. All of them are classified as RRLs in the Pan-STARRS catalogue (Sesar et al., 2017b). Coordinates, distance modulus and angular distance from the centre of Draco of these seven RRLs are provided in Table 3. Two of them (listed in the first two rows of Table 3 and highlighted with blue squares in Fig. 8) are RRLs confirmed by the Gaia SOS Cep&RRL pipeline (Clementini et al., 2019). They have distance moduli of and mag, in good agreement with the mean distance modulus ( mag) derived for Draco using the remaining 283 RRLs, after removing the seven sources under discussion. We conclude that they are RRLs belonging to Draco, perhaps in the process of being stripped away from the galaxy. The remaining five sources (red squares in Fig. 8) are classified as RRLs only by Pan-STARRS and their individual distances deviate significantly from the mean distance of the RRL population in Draco. If they are indeed RRLs, likely they do not belong to Draco, hence we dropped them.
Our final sample of RRLs belonging to Draco thus consists of the 285 sources listed in Table 1. The 51 sources discarded from our initial sample of 336 candidate RRLs (Section 2.1) are listed in Table 4. The distance modulus of Draco based on our final sample of 285 RRLs is mag, corresponding to a distance of kpc (magenta filled star symbol in Fig. 6). This value is in good agreement with estimates of the distance to Draco available in the literature.
| Gaia source_id | RA | Dec | Catalogue∗ |
|---|---|---|---|
| (deg) | (deg) | ||
| 1433066145263630848 | 258.04534 | 57.22915 | (2), (3), (5), (6), (7) |
| 1433153827020071168 | 259.77654 | 57.83003 | (1), (2), (3), (4), (5), (6) |
| 1434263375987484544 | 259.67879 | 59.22883 | (2), (3), (5), (6), (7) |
| 1420862734426225664 | 261.72890 | 57.00584 | (2), (3), (5), (6) |
| 1434193587063385856 | 257.53717 | 58.85367 | (3), (5), (6) |
| 1420748793238290816 | 260.53843 | 56.07140 | (3), (5), (6) |
| 1433205710224834944 | 259.62730 | 57.93461 | (1), (5), (6) |
| 1433125411516401920 | 259.55362 | 58.04889 | (1), (5), (6) |
| 1433228078414897024 | 260.07962 | 58.27272 | (1), (5), (6) |
| 1432799616772993792 | 258.47379 | 56.68078 | (4), (5), (6) |
| 1433856694124428928 | 257.62200 | 57.76638 | (5), (6) |
| 1434304745112408960 | 260.82793 | 59.65609 | (5), (6) |
| 1433145649402070784 | 260.50300 | 57.83918 | (1), (3), (4), (5) |
| 1433205469706734336 | 259.78369 | 57.97637 | (1), (2), (4), (5), (6) |
| 1433202480409390848 | 259.90019 | 57.90431 | (1), (3), (4), (5) |
| 1433156167778147584 | 260.07411 | 57.95209 | (1), (4), (5) |
| 1433735846627961600 | 256.79750 | 58.06355 | (2), (3), (5), (6), (7) |
| 1433986917532215040 | 260.34591 | 58.54830 | (2), (3), (5), (6) |
| 1434215272353862272 | 257.96432 | 59.11785 | (2), (3), (5) |
| 1434401257322242816 | 261.81705 | 57.55481 | (2), (3), (5), (6) |
| 1434768425486064256 | 261.76622 | 58.87592 | (2), (3), (5), (6) |
| 1437222088762466944 | 257.75859 | 59.26286 | (2), (3), (5) |
| 1420767351792676864 | 260.20092 | 56.22475 | (2), (3), (5), (6) |
| 1420725085018633600 | 259.79440 | 56.32542 | (2), (3), (5) |
| 1422386653247036544 | 261.89340 | 57.38791 | (2), (3), (5), (6) |
| 1433058414322440704 | 259.48304 | 57.66667 | (1), (2), (3), (4), (5), (6) |
| 1436833999813447296 | 256.89134 | 58.84992 | (2), (5), (6) |
| 1433146718850102912 | 260.44898 | 57.88857 | (1), (5) |
| 1433202519065189248 | 259.92731 | 57.91376 | (1), (5) |
| 1433154789094759040 | 260.10482 | 57.88138 | (1), (2), (3), (4) |
| 1435524172226721920 | 261.62292 | 59.05737 | (2), (3) |
| 1433810548995515648 | 257.08989 | 58.53205 | (3) |
| 1433964446264098048 | 258.61022 | 58.61517 | (3) |
| 1434301206059349376 | 260.75617 | 59.60149 | (3) |
| 1432901214224342272 | 260.87156 | 57.23603 | (2) |
| 1433076556264412416 | 258.63455 | 57.52561 | (2) |
| 1433003095143411328 | 258.59581 | 57.02518 | (2) |
| 1433465852100234752 | 256.89900 | 57.34440 | (5) |
| 1432419804225335168 | 257.95292 | 56.41195 | (5) |
| 1432778172000958336 | 258.23426 | 56.31075 | (5) |
| 1433085485501417984 | 258.18352 | 57.54400 | (5) |
| 1420713746305299840 | 259.60329 | 56.09359 | (5) |
| 1433875037928103552 | 258.69214 | 58.01085 | (5) |
| 1434162354060730752 | 259.04649 | 58.90067 | (5) |
| 1433982686989407104 | 259.93819 | 58.49680 | (5) |
| 1434045084273586432 | 259.49137 | 58.61261 | (5) |
| 1433168120671188096 | 261.04323 | 57.97529 | (5) |
| 1422294642162968576 | 262.06508 | 56.75950 | (5) |
| 1420573764731259136 | 261.16735 | 56.01170 | (5) |
| 1432934096493482752 | 260.50193 | 57.48558 | (5), (6), (7) |
| ∗∗ | 260.53908 | 56.07089 | (6) |
∗ The source was included in the catalogue of variable stars of: (1) Kinemuchi et al. (2008); (2) the Gaia DR2 general variability detection classifiers (Eyer et al. 2017, Rimoldini et al. 2019); (3) the Gaia SOS Cep&RRL pipeline (Clementini et al., 2019); (4) the GCVS (Samus’ et al., 2017); (5) Pan-STARRS (Sesar et al., 2017b); (6) the Catalina Sky Survey; (7) the LINEAR survey.
∗∗ No counterpart was found within 10 arcsec in the gaia_source catalogue.
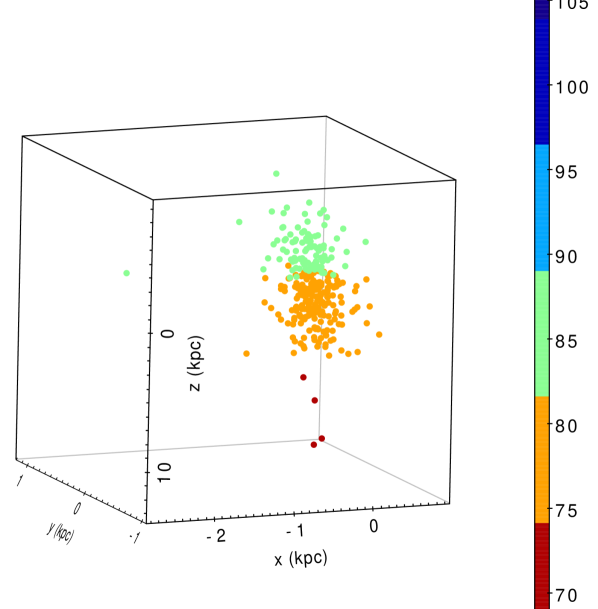
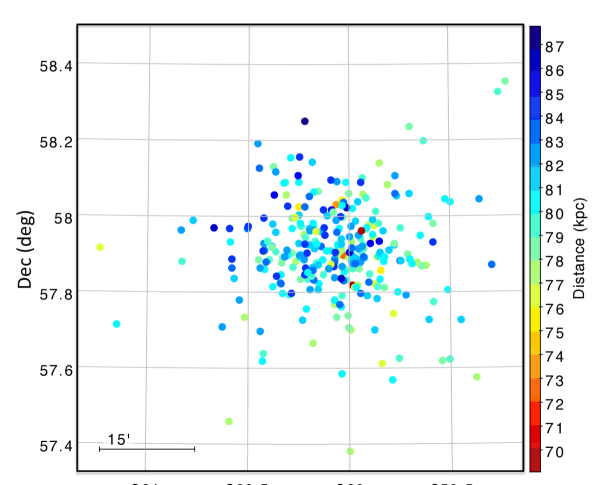
The distribution of RRLs in Fig. 8 seems to suggest that the western/south-western part of the Draco dSph might be closer to us, as if the halo of Draco traced by the RRLs were tilted likely due to the interaction with the MW. In order to better investigate this possibility, in Fig. 9 we show the three-dimensional distribution in Cartesian coordinates of the 285 RRLs in our final sample. The Cartesian coordinates were obtained from the RRLs’ , coordinates and individual distances, using transformation equations from van der Marel & Cioni (2001) and assuming as coordinates and distance to the origin of the system the centre coordinates of Kinemuchi et al. (2008): deg; deg, and the mean distance of kpc as derived from our sample of 285 RRLs. The -axis was assumed to be antiparallel to the axis, the -axis is parallel to the axis and the -axis extends along the line of sight with values increasing towards the observer. The three-dimensional distribution of the 285 RRLs also seems to suggest a possible tilt of Draco’s halo.
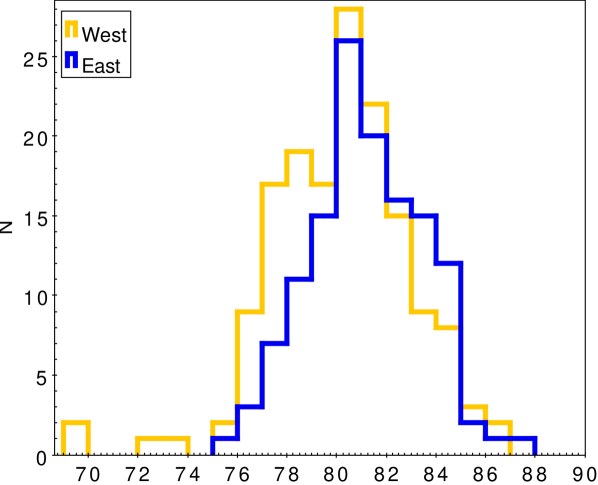
As a further test, we have divided the 285 RRLs into a western sample () and an eastern sample () containing 155 and 130 RRLs, respectively, where deg is the average right ascension of the full sample of 285 sources. The mean distance of the RRLs is and kpc, in the eastern and western regions of Draco, respectively, where uncertainties were calculated as the standard deviation of the mean. These mean values also seem to indicate that the western region of Draco is kpc closer to us than the eastern region. The distance distributions (adopting a bin size of 1 kpc) of the RRLs in the eastern (blue line) and western (yellow line) regions of Draco are shown in Fig 10. They also seems to indicate that the RRLs in the western region may be located closer to us. However, errors are still so large that the two distances/distributions cannot be considered statistically different. Finally, Fig. 11 shows a zoom-in of the spatial distribution of the RRLs in the central region of Draco. To conclude, the existence of a possible tilt in the Draco’s halo remains more a qualitative result, which will require confirmation based on better accuracy data to achieve a statistical significance.
It is worth noticing that the typical uncertainty of the individual RRL distances is on the order of 5 kpc, a main contributor being the uncertainty in the apparent magnitudes (Section 2.3). The improvement in photometric accuracy and the increased number of epoch-data for variable sources expected with Gaia DR3 will likely allow us to make a more sound analysis of the possible tilt of Draco’s halo.
4 The Oosterhoff dichotomy in the Draco dSph
The Oosterhoff dichotomy (Oosterhoff, 1939) is the observational evidence that the Galactic globular clusters (GCs) can be divided in two separate groups based on the properties of their RRL population. The mean period of RRab and RRc stars in Oosterhoff type I (Oo I) clusters is and days, respectively, and the fraction of RRc stars over total number of RRLs is %. Clusters of Oosterhoff type II (Oo II) instead contain RRLs with and days and the fraction of RRc stars is %. Oo I GCs are also more metal-rich than the Oo II GCs. Lately, field MW RRLs were also found to exhibit the Oosterhoff dichotomy, while systems outside the MW do not necessary show it. In particular, the vast majority of the classical dSphs around the MW have Oosterhoff intermediate (Oo-Int) properties (e.g. Catelan 2004, Clementini 2010), implying that systems like the classical dSphs have not provided a major contribution to the stellar content of the MW halo through hierarchical merging. The Draco dSph is known to belong to the Oo-Int class (e.g. Baade & Swope 1961; Bonanos et al. 2004; Kinemuchi et al. 2008), even though Kinemuchi et al. (2008) also found that RRc and double-mode RRLs (RRd) in Draco show the characteristic properties of the Oo II systems. It is clear though that in order to fully investigate the Oosterhoff type of a system one needs a sample of its RRL population as complete as possible. We have thus re-analysed the Oosterhoff class of Draco using our enlarged sample of 285 RRLs.
For 267 RRLs in our sample the period and -band amplitude () are available from Kinemuchi et al. (2008). For other 10 RRLs, -band amplitudes (), periods and classification in type were provided by the SOS Cep&RRL pipeline (Clementini et al., 2019). Three others sources were classified as RRLs by the nTransit:2+ classifier (Rimoldini et al., 2019) and their -band time series photometry is available on the Gaia archive. For two of them (first two entries in Table 2) we determined the period, classification in RRL type and -band amplitude using the GRATIS software, while for the third source we adopted the period and classification in type from Pan-STARRS (Sesar et al., 2017b) and estimated the -band amplitude with GRATIS. To transform the -band amplitudes to amplitudes in the band we then used equation 2 in Clementini et al. (2019). Finally, for five RRLs observed only by Pan-STARRS we took periods and amplitudes in the Sloan band () from Sesar et al. (2017b) and transformed the RRL amplitudes from the Sloan to the Johnson band, following Marconi et al. (2006). In their figures 11 and 12 these authors show that the ratio between and amplitudes for RRab and RRc stars is independent of period and metallicity and approximately equal to . In their catalogue Sesar et al. (2017b) only provide a probabilistic score for an RRL to be an RRab or an RRc pulsator. For the 5 RRLs observed only by Pan-STARRS we adopted a classification based on these scores. The characteristics (classification in type, period and -band amplitude obtained as described above) for our sample of 285 RRLs in Draco are summarised in Table 1. Our final sample is composed by 224 RRab, 35 RRc and 26 RRd stars.
| Gaia source_id | RA | Dec | ||
|---|---|---|---|---|
| (deg) | (deg) | (mag) | (mag) | |
| 1432983162200486528 | 261.59588 | 57.96386 | 20.225 | 0.010 |
| 1432870462257494400 | 259.94842 | 56.95765 | 20.003 | 0.009 |
| 1432864414943731712 | 260.79201 | 57.10239 | 19.977 | 0.013 |
| 1432954884135224832 | 260.97300 | 57.50792 | 20.185 | 0.011 |
| 1432949077339507712 | 260.65013 | 57.61801 | 20.096 | 0.017 |
| 1432843597237448064 | 259.78716 | 57.25623 | 20.215 | 0.011 |
| 1432885717981606784 | 261.08232 | 57.19960 | 19.923 | 0.013 |
This table is published in its entirety online (Supporting information); a portion is shown here for guidance regarding its form and content.
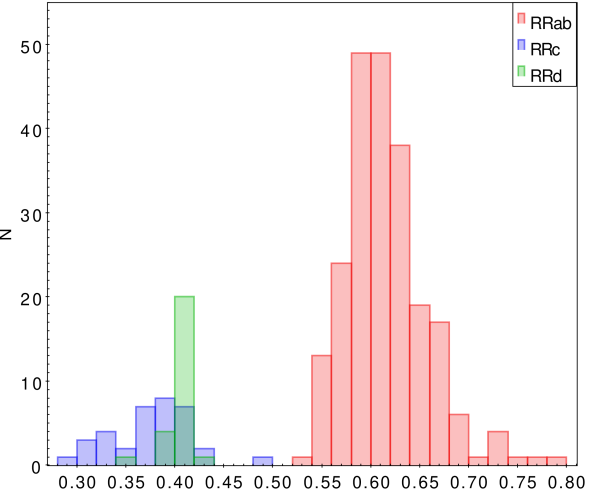
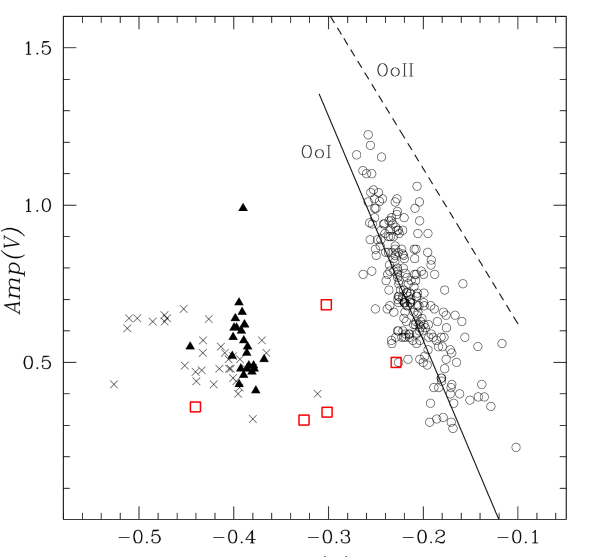
Red, blue and green histograms in Fig. 12 show the period distributions of our sample of RRab, RRc and RRd stars in Draco. The first-overtone period is shown for the RRd stars. As expected these distributions are very similar to the one in figure 5 of Kinemuchi et al. (2008). In Fig. 13 the period-amplitude diagram of the RRLs in Draco is compared with the Oo I and Oo II loci of Galactic GCs by Clement & Rowe (2000). In the figure we have marked with red empty squares the 5 RRLs that we discarded based on the distance moduli and angular distance from the centre of Draco (see Section 3, last five entries in Table 3 and red squares in Fig. 8). These five RRLs deviate from the bulk of RRL distribution on the period-amplitude diagram, thus endorsing our decision to discard them from the sample.
The mean periods of RRab and RRc stars are and days, respectively, and the ratio of number of RRc and RRd stars over total number of RRLs is 21%. The distribution of the RRab stars suggests an Oo I/Oo-Int classification for Draco. An Oo-Int class is also confirmed by the value. However, the mean period of the RRc stars is more typical of an Oo II system and the percentage of RRc and RRd stars is more similar to an Oo I. To summarise, based on our enlarged sample of 285 RRLs we re-confirm the Oo-Int nature of Draco, as already reported in the literature (e.g. Baade & Swope 1961, Bonanos et al. 2004, Kinemuchi et al. 2008).
5 Candidate RRLs in Draco
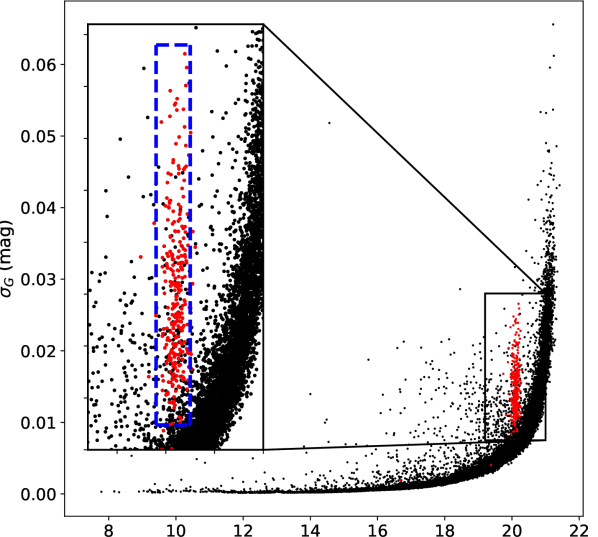
The variability of a source causes its mean magnitude, as estimated from a sequence of observations, to carry a larger dispersion than for a constant star of the same magnitude. We have used such an effect to search for additional RRLs in the Gaia general catalogue of sources located within 1 deg from the centre of Draco. Fig. 14 shows the distribution of these sources (black points) in the versus plane (scatter diagram), where the -band magnitudes are taken from the Gaia general catalogue and the values are calculated from the uncertainties in flux. In the figure the characteristic vertical feature (“finger”) at mag corresponds to the RRLs in Draco. All stars located in a box with mag and mag (blue dashed lines in Fig. 14) may be potentially RRLs belonging to Draco. This sample consists of 448 stars, which we further selected as to have a colour in the range mag, corresponding to the colour distribution of the RRLs in Draco (see Fig. 2). For 22 among the 448 sources in the above box an information on the colour is missing in the Gaia general catalogue, therefore, we exclude them from our analysis. Of the remaining 426 sources, 312 meet the selection in colour and 269 of them are already included in our sample of 285 RRLs in Draco (Section 3). They were marked as red circles in Fig. 14. The remaining 43 stars are potentially new RRLs of Draco. Two of them were classified as ACs by Kinemuchi et al. (2008) (red filled squares in Fig. 2) that we dropped from the list of RRLs based on the analysis of the Draco CMD (Section 2.2). We consider the remaining 41 sources (Table 5) as candidate RRLs belonging to Draco. More epoch data which will become available in Gaia DR3, may help shedding light on the actual nature of these stars.
6 Summary
Aiming to collect a sample of RRLs in the Draco dSph as complete as possible we performed an extensive search for RRLs in the literature and in the databases produced by large surveys (Catalina, ASAS, LINEAR, PTF, Pan-STARRS, GCVS), as well as in the catalogue of variable stars published in Gaia DR2 (Gaia Collaboration et al., 2018a). Combining different catalogues we have obtained a sample of 336 sources located within 2 deg from the centre of Draco, which have been classified as RRLs in at least one of the datasets we have analysed. From this sample we retrieved a subset of 285 RRLs which we consider to be true members of Draco based on: (i) an analysis of their location on the galaxy , () CMD; (ii) a study of their proper motions; (iii) an investigation of their distances and spatial distribution. Three among these 285 RRLs are new discoveries by Gaia.
We determined individual distances to these 285 RRLs applying the relation from Muraveva et al. (2018a) and used them to measure the distance and study the structure of the Draco dSph. The mean distance modulus of Draco from the RRLs is: mag, corresponding to a distance of kpc, in very good agreement with previous estimates available in the literature. There is some indication that the RRLs populating the western/south-western part of Draco may be located closer to us, hence, the halo of Draco might be tilted as a result of interaction with the MW. However, the large uncertainty in the individual RRL distances ( kpc) does not allow us to obtain a statistically robust proof of such an effect. A new full investigation will be carried out when more epoch data and more accurate parallaxes will become available with Gaia DR3.
We re-evaluated the Oosterhoff classification of Draco using the period-amplitude diagram and the mean period of the RRab stars defined by our enlarged sample of RRLs and confirm the intermediate Oosterhoff nature of the Draco dSph already reported in previous studies. Finally, we used the dispersion in the mean magnitude of sources in the Gaia general catalogue with 20 mag located within 1 deg from the Draco centre to identify a sample of further 41 candidate RRLs in this dSph.
This study shows once again the great potential of Gaia in the field of variable stars and, at the same time, how variable stars such as the RRLs allow us to extend our capability to measure distances well beyond the reach of Gaia astrometry. A further significant contribution to both topics will be achieved with Gaia DR3 currently foreseen for the second half of 2021.
Acknowledgements
We warmly thank the referee Dr V. Scowcroft for her valuable comments and suggestions which have significantly improved our paper. This work makes use of data from the ESA mission Gaia (https://www.cosmos.esa.int/gaia), processed by the Gaia Data Processing and Analysis Consortium (DPAC, https://www.cosmos.esa.int/web/gaia/dpac/consortium). Funding for the DPAC has been provided by national institutions, in particular the institutions participating in the Gaia Multilateral Agreement. Support to this study has been provided by the Agenzia Spaziale Italiana (ASI) through grants ASI 2014- 025-R.1.2015 and ASI 2018-24-HH.0, and by Premiale 2015, “MITiC" (P.I. B. Garilli).
Data availability
The data underlying this article are available in the article and in its online supplementary material.
References
- Abbas et al. (2014) Abbas M. A., Grebel E. K., Martin N. F., Burgett W. S.; Flewelling H.; Wainscoat R. J., 2014, MNRAS, 441, 1230
- Aparicio, Carrera & Martínez-Delgado (2001) Aparicio A., Carrera R., Martínez-Delgado D., 2001, AJ, 122, 2524
- Arenou et al. (2018) Arenou F. et al., 2018, A&A, 616, A17
- Baade & Swope (1961) Baade W., & Swope H. H., 1961, AJ, 66, 300
- Bellazzini et al. (2002) Bellazzini M., Ferraro F. R., Origlia L., Pancino E., Monaco L., Oliva E., 2002, AJ, 124, 3222
- Bonanos et al. (2004) Bonanos A. Z., Stanek K. Z., Szentgyorgyi A. H., Sasselov D. D., & Bakos G. A., 2004, AJ, 127, 861
- Bono et al. (2003) Bono, G., Caputo, F., Castellani, V., et al. 2003, MNRAS, 344, 1097
- Bono et al. (2019) Bono G. et al., 2019, ApJ, 870, 115
- Borissova et al. (2009) Borissova, J., Rejkuba, M., Minniti, D., Catelan, M. and Ivanov, V. D. 2009, A&A, 502, 505
- Cacciari & Clementini (2003) Cacciari C., & Clementini G., 2003, Stellar Candles for the Extragalactic Distance Scale, 635, 105
- Cardelli et al. (1989) Cardelli J. A., Clayton G. C., & Mathis, J. S. 1989, ApJ, 345, 245
- Catelan et al. (2004) Catelan M., Pritzl B. J. & Smith H. A. E. 2004, ApJS, 154, 633
- Catelan (2004) Catelan, M. 2004, in ASP Conf. Ser. 310, Variable Stars in the Local Group (IAU Colloquium 193), ed. D. W. Kurtz & K. R. Pollard (San Francisco, CA: ASP), 113
- Cioni & Habing (2005) Cioni M.-R. L., Habing H. J., 2005, A&A, 442, 165
- Clement & Rowe (2000) Clement C. M., & Rowe J., 2000, AJ, 120, 2579
- Clementini (2009) Clementini G., 2009, The Magellanic System: Stars, Gas, and Galaxies, 256, 373
- Clementini et al. (2000) Clementini G. et al., 2000, AJ, 120, 2054
- Clementini et al. (2003) Clementini G., Gratton R., Bragaglia A., Carretta E., Di Fabrizio L., Maio M., 2003, AJ, 125, 1309
- Clementini (2010) Clementini G., 2010, vsgh.conf, 107, vsgh.conf
- Clementini et al. (2016) Clementini G. et al., 2016, A&A, 595, A133
- Clementini et al. (2019) Clementini G., et al., 2019, A&A, 622, A60
- Dambis et al. (2013) Dambis A. K., Berdnikov L. N., Kniazev A. Y., Kravtsov V. V., Rastorguev A. S., Sefako R., Vozyakova O. V., 2013, MNRAS, 435, 3206
- Dambis et al. (2014) Dambis A. K., Rastorguev A. S., & Zabolotskikh M. V., 2014, MNRAS, 439, 3765
- Delgado et al. (2019) Delgado H. E., Sarro L. M., Clementini G., Muraveva T., & Garofalo A., 2019, A&A, 623, A156
- Dolphin (2002) Dolphin A. E., 2002, MNRAS, 332, 91
- Drake et al. (2013a) Drake A. J. et al., 2013, ApJ, 763, 32
- Drake et al. (2013b) Drake A. J. et al., 2013, ApJ, 765, 154
- Drake et al. (2014) Drake A. J. et al., 2014, ApJS, 213, 9
- Evans et al. (2018) Evans D. W. et al., 2018, A&A, 616, A4
- Eyer et al. (2017) Eyer L. et al., 2017, arXiv:1702.03295
- Gaia Collaboration et al. (2016a) Gaia Collaboration, Prusti T., de Bruijne J. H. J.,et al. 2016a, A&A, 595, A1
- Gaia Collaboration et al. (2016b) Gaia Collaboration, Brown A. G. A., Vallenari A. et al. 2016b, A&A, 595, A2
- Gaia Collaboration et al. (2017) Gaia Collaboration, Clementini G., Eyer L. et al. 2017, A&A, 605, A79
- Gaia Collaboration et al. (2018a) Gaia Collaboration, Brown A. G. A., Vallenari A. et al., 2018a, A&A, 616, A1
- Gaia Collaboration et al. (2018b) Gaia Collaboration, Helmi A., van Leeuwen F. et al., 2018b, A&A, 616, A12
- Grillmair et al. (1998) Grillmair C. J. et al., 1998, AJ, 115, 144
- Hernitschek et al. (2019) Hernitschek N. et al., 2019, ApJ, 871, 49
- Holl et al. (2018) Holl B. et al., 2018, A&A, 618, A30
- Irwin & Hatzidimitriou (1995) Irwin M., Hatzidimitriou D., 1995, MNRAS, 277, 1354
- Kaiser et al. (2010) Kaiser N. et al., 2010, Proc. SPIE, 7733, 77330E
- Kinemuchi et al. (2008) Kinemuchi K., Harris H. C., Smith H. A., Silbermann N. A., Snyder L. A., La Cluyz A. P., Clark,C. L., 2008, AJ, 136, 1921
- Kirby et al. (2013) Kirby E. N., Cohen J. G., Guhathakurta P., Cheng L., Bullock J. S., Gallazzi A., 2013, ApJ, 779, 102
- Klein et al. (2014) Klein C. R., Richards J. W., Butler N. R. & Bloom J. S., 2014, MNRAS, 440, L96
- Larson et al. (2003) Larson S., Beshore E., Hill R., Christensen E., McLean D.; Kolar S., McNaught R., Garradd G., 2003, Bulletin of the American Astronomical Society, 35, 36.04
- Law et al. (2009) Law N. M. et al., 2009, PASP, 121, 1395
- Lindegren et al. (2018) Lindegren L., et al., 2018, A&A, 616, A2
- Longmore et al. (1986) Longmore, A. J., Fernley, J. A., & Jameson, R. F. 1986, MNRAS, 220, 279
- Madore et al. (2013) Madore B. F. et al., 2013, ApJ, 776, 135
- Marconi et al. (2006) Marconi M., Cignoni M., Di Criscienzo M., Ripepi V., Castelli F., Musella I., Ruoppo A., 2006, MNRAS, 371, 1503
- McConnachie (2012) McConnachie A. W., 2012, AJ, 144, 4
- Mowlavi et al. (2018) Mowlavi N, et al., 2018, A&A, 618, A58
- Muraveva et al. (2015) Muraveva et al. 2015, ApJ, 807, 127
- Muraveva et al. (2018a) Muraveva T., Delgado H. E., Clementini G., Sarro L. M., Garofalo A., 2018, MNRAS, 481, 1195
- Muraveva et al. (2018b) Muraveva T., Garofalo A., Scowcroft V., Clementini G., Freedman W. L., Madore B. F., Monson A. J., 2018, MNRAS, 480, 4138
- Neeley et al. (2015) Neeley J. R. et al., 2015, ApJ, 808, 11
- Neeley et al. (2017) Neeley J. R et al., 2017, ApJ, 841, 84
- Nemec (1985) Nemec J. M., 1985, AJ, 90, 204
- Ngeow et al. (2016) Ngeow C.-C. et al., 2016, ApJS, 227, 30
- Oosterhoff (1939) Oosterhoff P. T.,1939, Observatory, 62, 104
- Palaversa et al. (2013) Palaversa L. et al., 2013, AJ, 146, 101
- Pigulski et al. (2009) Pigulski A., Pojmanski G., Pilecki B., Szczygieł D. M., 2009, Acta Astron., 59, 33
- Pojmanski (1997) Pojmanski G., 1997, Acta Astron., 47, 467
- Pojmanski (1998) Pojmanski G., 1998, Acta Astron., 48, 35
- Pojmanski (2000) Pojmanski G., 2000, Acta Astron., 50, 177
- Pojmanski (2002) Pojmanski G., 2002, Acta Astron., 52, 397
- Rimoldini et al. (2019) Rimoldini L., et al., 2019, A&A, 625, A97
- Samus’ et al. (2017) Samus’ N. N., Kazarovets E. V., Durlevich O. V., Kireeva N. N., & Pastukhova E. N., 2017, Astronomy Reports, 61, 80
- Sesar et al. (2013) Sesar B. et al., 2013, AJ, 146, 21
- Sesar et al. (2014) Sesar B. et al., 2014, ApJ, 793, 135
- Sesar et al. (2017a) Sesar B., Fouesneau M., Price-Whelan A. M., Bailer-Jones C. A. L., Gould A., Rix H.-W., 2017a, ApJ, 838, 107
- Sesar et al. (2017b) Sesar B. et al., 2017b, AJ, 153, 204
- Schlegel, Finkbeiner & Davis (1998) Schlegel, D. J., Finkbeiner, D. P., & Davis, M. 1998, ApJ, 500, 525
- Sollima et al. (2006) Sollima A., Cacciari C., & Valenti E., 2006, MNRAS, 372, 1675
- Sollima et al. (2008) Sollima A., Cacciari C., Arkharov A. A. H., Larionov V. M., Gorshanov D. L., Efimova N. V., Piersimoni A., 2008, MNRAS, 384, 1583
- Stetson (1979) Stetson P. B., 1979, AJ, 84, 1149
- Stokes et al. (2000) Stokes G. H., Evans J. B., Viggh H. E. M., Shelly F. C., Pearce E. C., 2000, Icarus, 148, 21
- Tammann, Sandage & Reindl (2008) Tammann G. A., Sandage A., Reindl B., 2008, ApJ, 679, 52
- van der Marel & Cioni (2001) van der Marel R. P., Cioni M.-R. L., 2001, AJ, 122, 1807
- Walker, Olszewski & Mateo (2015) Walker M. G., Olszewski E. W., Mateo M., 2015, MNRAS, 448, 2717
- Weisz et al. (2014) Weisz D. R., Dolphin A. E., Skillman E. D., Holtzman J., Gilbert K. M., Dalcanton J. J., Williams B. F., 2014, ApJ, 789, 147