Tarsier: Evolving Noise Injection in Super-Resolution GANs
Abstract
Super-resolution aims at increasing the resolution and level of detail within an image. The current state of the art in general single-image super-resolution is held by nESRGAN+, which injects a Gaussian noise after each residual layer at training time. In this paper, we harness evolutionary methods to improve nESRGAN+ by optimizing the noise injection at inference time. More precisely, we use Diagonal CMA to optimize the injected noise according to a novel criterion combining quality assessment and realism. Our results are validated by the PIRM perceptual score and a human study. Our method outperforms nESRGAN+ on several standard super-resolution datasets. More generally, our approach can be used to optimize any method based on noise injection.
|
|
||
| Low res. | EnhanceNet | SRGAN |
| ESRGAN | nESRGAN+ | Tarsier |
nESRGAN+ Tarsier
I Introduction
Super-resolution has received much attention from the computer vision and machine learning communities and enjoys a wide range of applications in domains such as medical imaging [9, 29], security [36, 27] and other computer vision tasks [5, 13, 43, 28]. Several architectures were proposed to maximize the Peak Signal-to-Noise Ratio (PSNR) [7, 21, 22, 6]. However, the PSNR score contradicts quality assessments from human observers and PSNR-oriented methods tend to produce blurry images [4, 32]. Recent works [46, 33, 50] evaluate their models based on the PIRM perceptual index, which combines the MA [24] and NIQE [26] scores and is related to perceptual quality.
Methods based on Generative Adversarial Networks (GANs) are especially successful at producing sharp and realistic images. Among them, we can list Super Resolution GANs (SRGANs) [23], and follow up works [33, 46, 30, 40, 23] that perform well according to the PIRM criterion. In this paper, we improve SRGAN and its variant known as nESRGAN+ [33] that uses noise injection [44] at training time. We consider the noise injection as a free parameter that can be leveraged in order to improve the output quality. More precisely, at inference time, we optimize the noise injection using an evolutionary algorithm in order to produce sharper and more detailed images. Our novel objective function combines an Image Quality Assessment tool, Koncept512 [15], and the discriminator of the GAN in order to improve both image quality and realism. Thanks to our proposed score, our criterion is also robust across datasets and requires little hyper-parameter tuning.
When optimizing our objective function, gradient-based optimization methods classically used in deep learning (e.g. Adam, Gradient Descent) quickly get stuck on critical points and only result in marginal improvements in our criterion. Evolutionary methods [14] are known as the jeep of artificial intelligence [41, 25]: they are compatible with rugged objective functions without gradient and search for flat, stable optima [19]. Moreover, the work [37] optimizing the latent space of GANs finds that evolutionary methods are especially robust to imperfect surrogate objective functions. Our experiments also support the use of evolutionary methods for optimizing noise injection in GANs: they show that Diagonal CMA is well suited to optimizing our rugged objective criterion, as it outperforms gradient-based methods on many datasets. When optimizing our criterion with an evolution strategy, we produce sharper and more detailed images. We outperform nESRGAN+ and other Super Resolution methods quantitatively (i.e. according the PIRM perceptual index) and qualitatively (according to a human study). A short paper [39] presented the idea of merging super-resolution GAN and quality estimation. The present paper contains experimental results, equations and detailed algorithms.
II Background
II-A nESRGAN+: noise injection in super-resolution GANs
SRGAN [23], an application of conditional GANs to super-resolution, showed that GANs are well suited to improving the perceptual quality of images generated with Super Resolution. SRGAN is equipped with attention in [31], and made size-invariant thanks to global pooling in [8]. Sometimes extended with dense connections, it performs well for perception-related measures [47]. ESRGAN [46] is an enhancement based on a novel architecture containing blocks without batch normalization layers [17], use of Relativistic average GAN [18] and features before activation for the perceptual loss. nESRGAN+ [33] is an extension of ESRGAN using additional residual connections and noise injection as depicted in Fig. 3. Gaussian noise is added to the output of each of the 23 residual layers of each of the 3 blocks (total 69 layers) along with learned per-feature scaling factors. It leverages stochastic variations that randomize only local aspects of the generated images without changing our global perception of these images, in a spirit similar to [20]. The injected noise is usually set to zero at inference time. In the present paper, we consider , optimized by evolutionary algorithms based on an objective function built with Koncept512 and the discriminator.
II-B Koncept512: image quality metric via supervised deep learning
We modify our conditional GAN to improve the quality of the generated images by considering the Koncept512 [15] image quality assessment (IQA) model.
Koncept512 is built by training a deep-learning model to rate the quality of images from the KonIQ-10k dataset. The KonIQ-10k dataset is the largest, reliably annotated in-the-wild IQA publicly available dataset, consisting of 10,073 subjectively rated images, each rated by 120 users. The images are sourced from Flickr and selected to cover a wide range of content sources (object categories) and quality-related indicators. The domain of the images in KonIQ-10k is particularly suitable for evaluating super-resolution methods. As the images on Flickr are predominantly taken by amateur photographers, they often focus incorrectly, take hand-held shots producing motion-blurs, or take pictures in low-light conditions.
For brevity, the Koncept512 IQA model will be referred to as . It takes as input an image and outputs its estimated quality score . Koncept512 is highly accurate, with a performance on the KonIQ-10k test set equivalent to the mean opinion score coming from nine users. However, when is cross-tested on another in-the-wild IQA database (LIVE in-the-wild), implying some domain shift, the performance drops; in this case, the model is equivalent to roughly the opinion of a single user. Thus, is effective on in-the-wild images and may not fare well on synthetic degradation. The limitations of the model require careful consideration when deploying it for guided super-resolution, as done in the present work.
III Tarsier: optimized noise injection
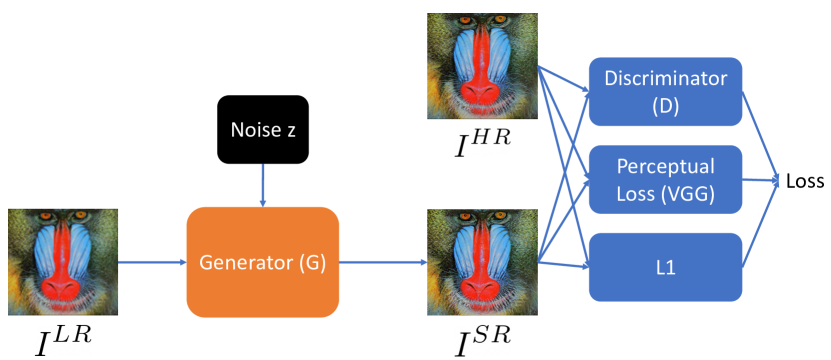
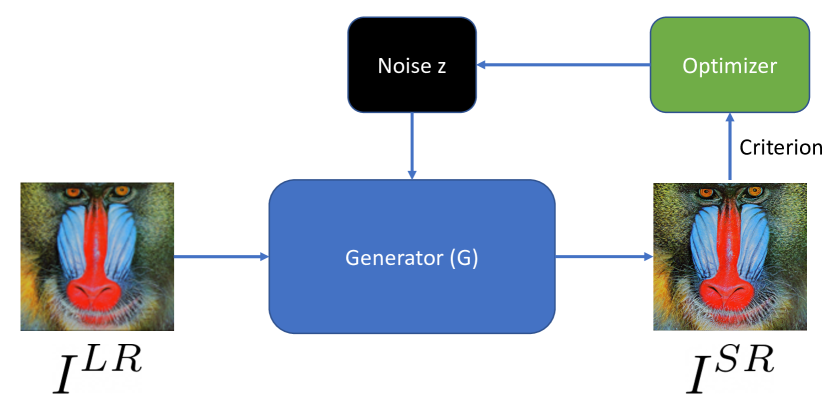
Given a low-resolution image and a noise vector of dimension , we can use a trained nESRGAN+ generator to generate a high resolution image . Whereas GANs with noise injection typically use , our algorithm Tarsier (named after a family of haplorrhine primates with excellent eyesight) considers maximizing one of the criteria defined below. See Figure 3 for an overview of our approach.
Training Stage (nESRGAN+)
Inference Stage (Tarsier)
III-A Image Quality Score
A naive quality scorer could consist in simply applying Koncept512 to the output of nESRGAN+:
We observe that the scores given by remain accurate as long as the generated images remain similar to natural images or to the images generated by nESRGAN+. However, the images obtained by optimizing for are not in this category: they tend to contain many artifacts, which increases the score of despite being unrealistic and visually displeasing. It prompted us to optimize a pessimistic version of the score given by :
| (1) |
with
| (2) |
We call pessimistic because it trusts bad scores while taking a safety margin for good ones. As is constant, is equivalent to when the proposed fares worse than the zero-noise injection baseline (i.e. ). In other words, we consider that is an accurate evaluation of the quality of the generated image when it gives a poor score. Inversely, when the proposed fares better than the baseline (i.e. ), increases logarithmically with the score of in order to account for the possibility that the image quality may be overestimated. Moreover, increases similarly to for very close to the baseline score, while it increases slowly when it is much larger.
Another advantage of the logarithm in the function is that it makes our optimization process less scale-dependent when the proposed clearly outperforms the baseline: when is large, multiplying by a constant is almost equivalent to adding a constant to our score and does not change the behaviour of our optimizer. This property makes our hyper-parameters more robust across images and datasets.
III-B Realism Score
Optimizing for compels the generator to produce high-quality images, but nothing forces it to generate realistic images. Generative Adversarial Networks train a generator concurrently with a discriminator, which aims at evaluating the realism of a high-resolution image given an input low-resolution image. The later can be used to produce a realism score. The discriminator still suffers from the same issue as . It is trained on real high-resolution images and images generated by the nESRGAN+ generator. Since the noise is sampled from a Gaussian distribution centered on zero during training, the discriminator is inaccurate on images generated with noises having extreme norms or directions. In order to mitigate this issue, we define a pessimistic realism score similarly to the quality score defined in Section III-A:
| (3) |
where is the discriminator score for the image .
In practice, the discriminator can only take images of dimension as input and the high-resolution images we generate with nESRGAN+ are always of higher dimension. To compute on the whole image, we divide the image in patches of size and compute the score on each one of them. In order to ensure that each part of the image looks realistic, we define as the minimum score over all the patches.
III-C Final Criterion
We define our final criterion, which is to be maximized, by adding a penalization to the quality score (Eq. 1) and the realism score (Eq. 3) with suitable coefficients:
| (4) |
where is the dimension of , and are scale factors for each term. The application of this first criterion yields better results on blurry images. This observation motivates the definition of a second criterion that adapts the noise injection to the blurriness of the input. We define it as follows:
| (5) |
where is the standard deviation of the Laplacian of image , divided by in order to keep the regularization on the same order of magnitude. The value of increases when the blurriness of image decreases. Maximizing Eq. 5 increases the regularization when the images are less blurry.
We tested several values of the hyperparameters , and . With our pessimistic scores, Tarsier is not very sensitive to small variations of the hyperparameters. While some values lead to slightly better results on some of the datasets, we find the results obtained by setting to be satisfactory and particularly robust across datasets.
Tarsier uses Diagonal Covariance Matrix Adaptation (DCMA) [38] for optimizing our criteria. CMA Evolution Strategy [12, 10] is a second order method which estimates a covariance matrix closely related to the Hessian matrix in Quasi-Newton methods. It requires no tedious parameter tuning, since the choice of most of the internal parameters of the strategy is automatically done during training with methods such as Cumulative Step-Size Adaptation [2]. DCMA is a variant of CMA in which the covariance matrix is constrained to be diagonal. It reduces the time and space complexity of CMA from quadratic to linear. It evaluates fewer parameters for the covariance matrix and requires fewer function evaluations than CMA for estimating the covariance in high dimension.
IV Experiments
IV-A Setup
As in [33], we use an nESRGAN+ model trained on DIV2K [1], improving significantly the performance of ESRGAN by injecting noise at training time. Noise vectors are injected after each residual connection in every residual dense block, and are sampled randomly from a Gaussian distribution at training time. At inference time, Tarsier learns noise vectors for each residual connection. We consider them as additional degrees of freedom for further improving the performance, as measured by our criterion. The dimension of the noise is 27,600. We use the code and the weights of the Koncept512 model available online111https://github.com/subpic/koniq. We compute the Tarsier criterion on a Tesla V100 GPU. We run upscaling experiments on widely used super-resolution datasets: Set5[3], Set14[49], the PIRM Validation and Test datasets[4], Urban100[16], and OST300[45]. We compute the PIRM score on Matlab using the code made available for the PIRM2018 challenge222https://github.com/roimehrez/PIRM2018. We refer to [46, 24, 26] and references therein for a precise definition of the perceptual quality estimation used in the present document. Here is a description of the optimizers we assess to maximize Eq. 4 and 5.
IV-B Optimizer choice: evolutionary computation
We use evolutionary algorithms implemented in the nevergrad library [34]. The motivations for this choice are:
-
•
As pointed out in [19] and [37] in the context of computer vision, evolutionary algorithms provide solutions robust to imperfect objective functions. More precisely, by focusing on optima stable by random variable-wise perturbations, evolutionary algorithms behave well on the real objective function (in particular, human assessment) when we optimize a proxy (here, our criterion). We see in Table I that, even from a purely numerical point of view, evolutionary computation outperforms gradient-based algorithms in the present setting. We observe that gradient-based methods tend to get stuck in suboptimal critical points after a few hundreds iterations. Gradient descent slightly outperforms Adam on all datasets but its performances are still way below these of Diagonal CMA.
TABLE I: Comparison of derivative-free methods (CMA, Diagonal CMA, the 1+1 evolution strategy [42], Differential Evolution) and gradient-based methods (Adam and Gradient Descent) for optimizing (higher is better). Gradient-based methods tend to get stuck in sub-optimal local minima and do not perform as well as Diagonal CMA. Dataset/Method Set5 Set14 PIRM Val Random Search CMA DCMA (1+1) GD ADAM
TABLE II: Gradient-based methods also do not perform as well according to the PIRM perceptual score [4] (lower is better). The budget is 10000 function evaluations. For each optimizer, the Blur version optimizes (Eq. 5) and the other version optimizes (Eq. 4). Best result shown in bold, second best underlined. DCMA DCMA GD GD ADAM ADAM + Blur + Blur +Blur set5 2.787 2.667 3.033 3.026 2.997 2.998 set14 2.740 2.656 2.826 2.828 2.937 2.937 PIRM Val 2.348 2.335 2.376 2.375 2.399 2.399 PIRM Test 2.260 2.277 2.297 2.297 2.307 2.307 TABLE III: PIRM perceptual scores computed (lower is better) on the raw outputs of several super-resolution models. For each dataset, the best result is shown in bold and the second best is underlined. Tarsier optimizes (Eq. 4) while Tarsier + Blur optimizes (Eq. 5). Both Tarsier and Tarsier+Blur outperform nESRGAN+ in all cases. Dataset SAN[6] EnhanceNet ESRGAN nESRGAN+ Tarsier Tarsier + Blur set5 5.94 2.93 3.76 3.21 2.79 2.67 set14 5.37 3.02 2.93 2.80 2.74 2.66 PIRM Val - 2.68 2.55 2.37 2.35 2.34 PIRM Test - 2.72 2.44 2.29 2.26 2.28 Urban100 5.12 3.47 3.77 3.55 3.50 3.49 OST300 - 2.82 2.49 2.49 2.47 2.47
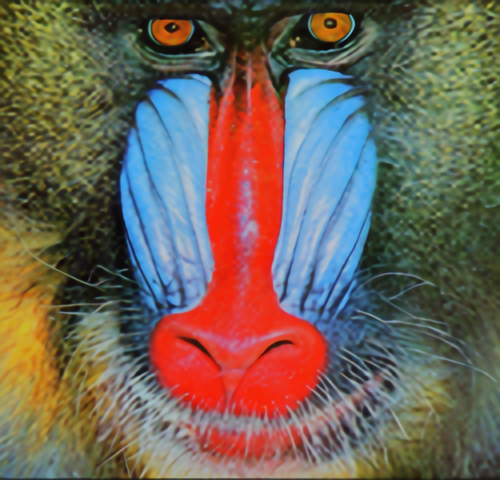
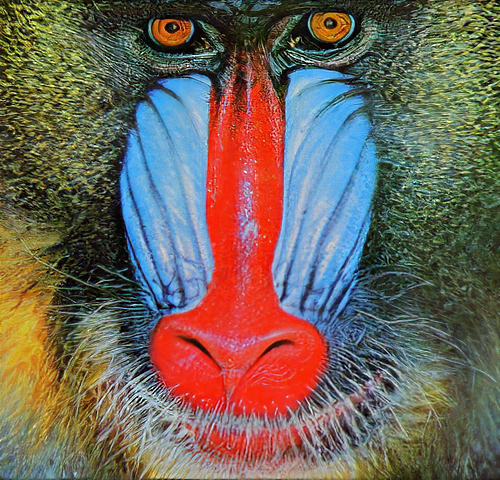
SAN Tarsier Figure 4: SAN and Tarsier on the baboon image from Set 14. The image generated by SAN is visibly more blurry than that generated by Tarsier. It is also the case for other images and when comparing SAN to ESRGAN. -
•
There is no need for gradient estimation. Although our criteria are differentiable, evolutionary methods could also be used to optimize non-differentiable criteria (e.g., direct human feedback). Moreover, computing the overall gradient over distinct deep learning frameworks can be a burden, and evolutionary methods do not require it. .
-
•
The optimization is naturally parallel.
We mainly use Diagonal CMA [38] as a derivative-free optimization algorithm because it is fast and reliable. Compared to CMA, the diagonal covariance matrix reduces the computational cost and reduces the budget requirement as we do not have to evaluate an entire covariance matrix. Compared to the -evolution strategy with one-fifth rule, DCMA has anisotropic mutations: it adapts the step-size on each dimension. DCMA frequently ranks high in black-box optimization benchmarks, particularly when the problem is partially separable and/or when the dimension is large. This is definitely the case here with 27600 parameters, while the black-box optimization literature focuses on dimensions [11]. DCMA and Differential Evolution (DE) are often the most performant among algorithms not using specific decompositions, e.g. on Nevergrad’s dashboard[35] or on LSGO[48]. In our experiments, DCMA performed better than DE.
IV-C Results
Our main quantitative experimental results are presented in Table II and Table III. In Table II, we compare gradient-based methods to the evolutionary method that performed best according to our criterion: Diagonal CMA. Diagonal CMA outperforms both GD and ADAM on four standard super-resolution datasets and when optimizing either the Blur or the normal criterion. Using the results from Tables I and II, we decided to eliminate gradient-based methods and to use Diagonal CMA to optimize our criterion in Tarsier.
Perceptual score
In Table III, we use the PIRM score to compare our method, Tarsier, to nESRGAN+[33], ESRGAN[46], EnhanceNet[40] and SAN [6]. All our baselines are perception-driven approaches based on GANs, except SAN that is based on a convolution network with attention. ESRGAN outperforms EnhanceNet on every dataset except set5, which is much smaller than the others, and Urban100, on which EnhanceNet is particularly efficient. nESRGAN+ outperforms ESRGAN on every dataset, even though it is only by a small margin for OST300. However, EnhanceNet still surpasses nESRGAN+ on set5 and Urban100. Whether it uses the Blur or the non-Blur criterion, Tarsier outperforms nESRGAN+ on every dataset. It also outperforms every other method on every dataset except Urban100, on which EnhanceNet is slightly better. SAN performs well in terms of PSNR, but not in terms of perceptual scores. The images it generates appear much blurrier than those generated by Tarsier or any of our baselines, see Fig. 4.
Qualitative comparison
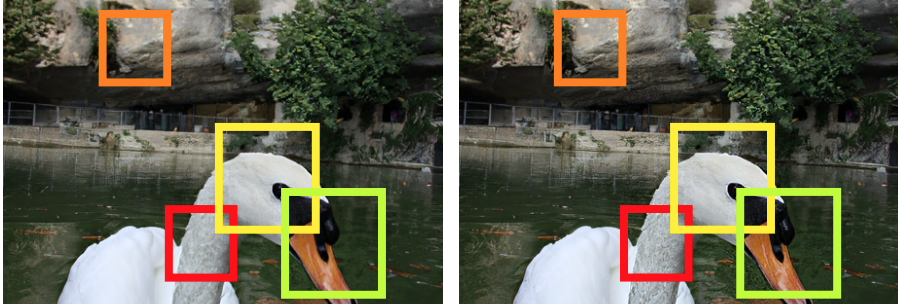
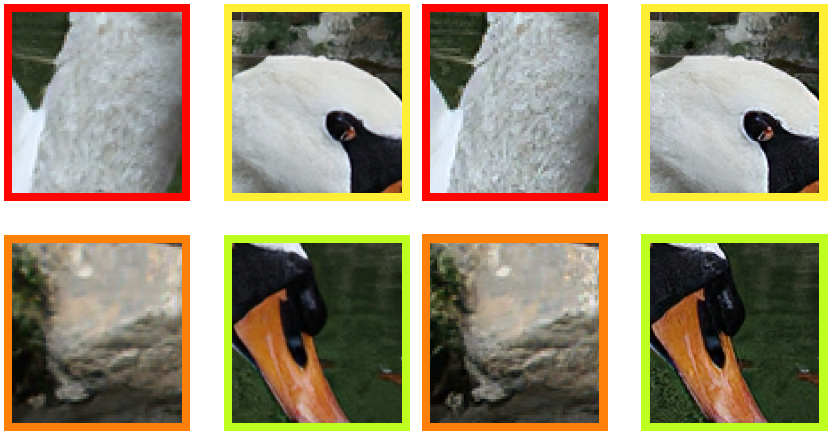
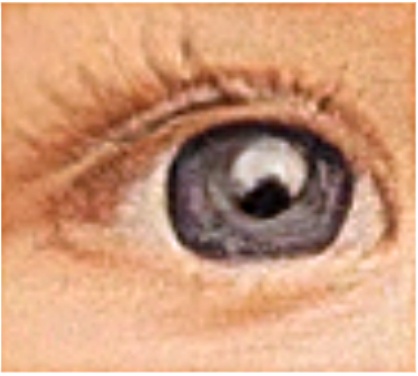
We present some examples in Figs. 2 and 2. Compared to nESRGAN+, Tarsier generates images that are sharper and more detailed. For instance, Tarsier produces sharper and more natural eyelashes on the boy in Fig. 2. On Fig. 2, it is capable of generating sharper patterns and shadows on the stones behind the swan, as well as more convincing wet feathers on the neck of the animal. The beak also appears less blurry. We show in Fig. 6 that Tarsier does more than applying a classical sharpening filer (unsharp masking) on top of nESRGAN+, while keeping the image clean, and reducing graininess.
Human study
We conducted a double-blind human study to validate that Tarsier improves the images generated by nESRGAN+. We took random samples of 20 images for the PIRM Test dataset and 30 for the OST300 dataset. We generated high resolution images with nESRGAN+ and Tarsier, and asked human reviewers to pick the best image among the two images shown in a random order. As nESRGAN+ already generates high-quality images, it is difficult to compare its output to that of Tarsier without zooming on the image. In order to make the comparison easier for the annotators, we generated zoomed-in images automatically for most different sub-images (measured using the PSNR). The images generated using Tarsier are preferred in of the cases for PIRM Val and for OST300. On both sets, Tarsier significantly outperforms nESRGAN+ (p-value 0.05).

|
Raw
Score |
 |
 |
|---|---|---|
|
Pessimistic
Score |
 |
 |
IV-D Ablation Study
 |
 |
| nESRGAN+ | Our result with Tarsier |
| nESRGAN+ | ||
| Tarsier |
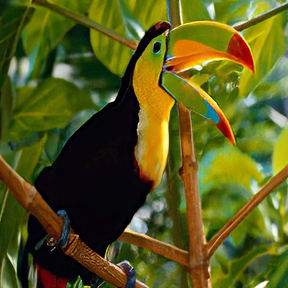
We study the impact of each term in our criterion by setting the corresponding parameters to 0. We observe that removing both the realism score and the penalization () leads to the generation of images with unrealistic and visually displeasing artifacts (see Fig. 7). Both terms act as regularizers: if one of them is set to 1, most of the artifacts disappear. Removing only the penalization term () sometimes produces slightly more detailed images (e.g., sheep on Fig. 7). However, it can also produce some artifacts (see bird on Fig. 8). We decided to keep the penalization term for more robustness. Removing the realism score () frequently produces small artifacts (see Fig. 8). Without the quality term (), the images become more blurry and similar to those obtained with (nESRGAN+).
As expected, the logarithm in the definition of the quality (Eq. 1) and realism (Eq. 3) scores can act as a regularizer and keep the generated images realistic. It is particularly visible when we also remove the realism score from our criterion (see on Fig. 6). The artifacts can also be avoided by increasing the penalization coefficient. However, without the pessimistic loss, the right value for would depend on the dataset and even on the image within a dataset. Therefore, using the raw instead of the pessimistic scores would make the method less robust and the penalization factor difficult and costly to tune. The pessimistic loss is less scale-dependent and the results it produces are much more robust across images and datasets: all the results we present are obtained with all the parameters set to 1. Another benefit of the pessimistic loss is to allow us to keep the quality and realism scores on the same scale. With the raw scores, i.e. without applying a logarithm to positive relative scores, the optimizer tends to optimize for whichever criterion is easiest to optimize. In our case, the optimizer often reaches very high realism scores (median value of on set5 and set14) and almost ignores the quality score (median value of ). Despite that, we do not often observe artifacts on the images generated without the pessimistic score. It indicates that optimizing the realism score does not easily create artifacts. However, these images are blurrier since the quality term tends to be ignored (see right column on Fig. 6). With the pessimistic scores, the median value of the quality score becomes on set5 and set14, meaning the median raw scores goes up from to .
 |
 |
| nESRGAN+ | Our result with Tarsier |
 |
 |
 |
| nESRGAN+ | ||
 |
 |
 |
| Tarsier |
V Conclusion
Noise injection has been left unexploited by super-resolution approaches that typically use noise at inference time. In this work, we combine the perceptual image quality assessment model Koncept512 and the adversarial network output into a novel criterion accounting for the image’s technical quality and realism. Without retraining the model, we optimize using our criterion and outperform the state-of-the-art on several standard super-resolution datasets according to the PIRM score and to human opinion.
Our experiments show that, in addition to being easy to use, Diagonal CMA is better suited to our problem than gradient-based methods. On every dataset we tested, it outperformed gradient-based methods for optimizing the criterion and when compared using the PIRM score.
Though this optimized noise injection is applied to super-resolution in the present paper, the method can be applied for optimizing noise injection in general. In this paper, we choose Koncept512 for our quality score in order to optimize the technical quality of the images. We could use the same method on another type of criterion (e.g. the artistic quality).
References
- [1] E. Agustsson and R. Timofte. Ntire 2017 challenge on single image super-resolution: Dataset and study. In Computer Vision and Pattern Recognition Workshops, 2017.
- [2] D. V. Arnold and H.-G. Beyer. Performance analysis of evolutionary optimization with cumulative step length adaptation. IEEE Transactions on Automatic Control, 2004.
- [3] M. Bevilacqua, A. Roumy, C. Guillemot, and M. L. Alberi-Morel. Low-complexity single-image super-resolution based on nonnegative neighbor embedding. 2012.
- [4] Y. Blau, R. Mechrez, R. Timofte, T. Michaeli, and L. Zelnik-Manor. The 2018 pirm challenge on perceptual image super-resolution. In Proceedings of the European Conference on Computer Vision (ECCV), 2018.
- [5] D. Dai, Y. Wang, Y. Chen, and L. Van Gool. Is image super-resolution helpful for other vision tasks? In Winter Conference on Applications of Computer Vision (WACV). IEEE, 2016.
- [6] T. Dai, J. Cai, Y. Zhang, S.-T. Xia, and L. Zhang. Second-order attention network for single image super-resolution. In Conference on Computer Vision and Pattern Recognition, 2019.
- [7] C. Dong, C. C. Loy, K. He, and X. Tang. Image super-resolution using deep convolutional networks. transactions on pattern analysis and machine intelligence, 2015.
- [8] S. Gautam, D. K. Pradhan, P. C. Chhipa, and S. Nakajima. Microgan: Size-invariant learning of gan for super-resolution of microscopic images. 2019.
- [9] H. Greenspan. Super-resolution in medical imaging. The computer journal, 2009.
- [10] N. Hansen. The CMA evolution strategy: a comparing review. In Towards a new evolutionary computation. 2006.
- [11] N. Hansen, A. Auger, S. Finck, and R. Ros. Real-parameter black-box optimization benchmarking: Experimental setup. Technical report, Université Paris Sud, INRIA Futurs, Équipe TAO, Orsay, France, Mar. 24, 2012.
- [12] N. Hansen and A. Ostermeier. Completely derandomized self-adaptation in evolution strategies. Evolutionary computation, 2001.
- [13] M. Haris, G. Shakhnarovich, and N. Ukita. Task-driven super resolution: Object detection in low-resolution images. arXiv preprint 1803.11316, 2018.
- [14] J. H. Holland. Genetic algorithms and the optimal allocation of trials. SIAM J. Comput., 2(2):88–105, 1973.
- [15] V. Hosu, H. Lin, T. Sziranyi, and D. Saupe. Koniq-10k: An ecologically valid database for deep learning of blind image quality assessment. IEEE Transactions on Image Processing, 2020.
- [16] J.-B. Huang, A. Singh, and N. Ahuja. Single image super-resolution from transformed self-exemplars. In Conference on Computer Vision and Pattern Recognition, 2015.
- [17] S. Ioffe and C. Szegedy. Batch normalization: Accelerating deep network training by reducing internal covariate shift. International Conference on Machine Learning, 2015.
- [18] A. Jolicoeur-Martineau. The relativistic discriminator: a key element missing from standard GAN. ICLR, 2019.
- [19] K. A. D. Jong. Genetic algorithms are not function optimizers. In Foundations of Genetic Algorithms, volume 2 of Foundations of Genetic Algorithms, pages 5 – 17. Elsevier, 1993.
- [20] T. Karras, S. Laine, and T. Aila. A style-based generator architecture for generative adversarial networks. In Conference on Computer Vision and Pattern Recognition, 2019.
- [21] J. Kim, J. Kwon Lee, and K. Mu Lee. Accurate image super-resolution using very deep convolutional networks. In Conference on Computer Vision and Pattern Recognition, 2016.
- [22] W.-S. Lai, J.-B. Huang, N. Ahuja, and M.-H. Yang. Deep laplacian pyramid networks for fast and accurate super-resolution. In Conference on Computer Vision and Pattern Recognition, 2017.
- [23] C. Ledig, L. Theis, F. Huszár, J. Caballero, A. Cunningham, A. Acosta, A. Aitken, A. Tejani, J. Totz, Z. Wang, et al. Photo-realistic single image super-resolution using a generative adversarial network. In Conference on Computer Vision and Pattern Recognition, 2017.
- [24] C. Ma, C.-Y. Yang, X. Yang, and M.-H. Yang. Learning a no-reference quality metric for single-image super-resolution. Computer Vision and Image Understanding, 2017.
- [25] N. Milano, P. Pagliuca, and S. Nolfi. Robustness, evolvability and phenotypic complexity: Insights from evolving digital circuits. Evolutionary Intelligence, pages 83–95, 2019.
- [26] A. Mittal, R. Soundararajan, and A. C. Bovik. Making a “completely blind” image quality analyzer. Signal Processing Letters, 2012.
- [27] K. Nguyen, C. Fookes, S. Sridharan, M. Tistarelli, and M. Nixon. Super-resolution for biometrics: A comprehensive survey. Pattern Recognition, 2018.
- [28] J. Noh, W. Bae, W. Lee, J. Seo, and G. Kim. Better to follow, follow to be better: Towards precise supervision of feature super-resolution for small object detection. In Proceedings of the IEEE International Conference on Computer Vision, 2019.
- [29] O. Oktay, E. Ferrante, K. Kamnitsas, M. Heinrich, W. Bai, J. Caballero, S. A. Cook, A. De Marvao, T. Dawes, D. P. O‘Regan, et al. Anatomically constrained neural networks (acnns): application to cardiac image enhancement and segmentation. IEEE transactions on medical imaging, 2017.
- [30] S.-J. Park, H. Son, S. Cho, K.-S. Hong, and S. Lee. Srfeat: Single image super-resolution with feature discrimination. In European Conference on Computer Vision, 2018.
- [31] H. N. Pathak, X. Li, S. Minaee, and B. Cowan. Efficient super resolution for large-scale images using attentional GAN. In 2018 International Conference on Big Data, 2018.
- [32] M. S. Rad, B. Bozorgtabar, U.-V. Marti, M. Basler, H. K. Ekenel, and J.-P. Thiran. Srobb: Targeted perceptual loss for single image super-resolution. In Proceedings of the IEEE International Conference on Computer Vision, pages 2710–2719, 2019.
- [33] N. C. Rakotonirina and A. Rasoanaivo. Esrgan+ : Further improving enhanced super-resolution generative adversarial network. In International Conference on Acoustics, Speech and Signal Processing (ICASSP), pages 3637–3641, May 2020.
- [34] J. Rapin and O. Teytaud. Nevergrad - A gradient-free optimization platform. https://GitHub.com/FacebookResearch/Nevergrad, 2018.
- [35] J. Rapin and O. Teytaud. Nevergrad’s Dashboard. https://GitHub.com/FacebookResearch/Nevergrad, 2018.
- [36] P. Rasti, T. Uiboupin, S. Escalera, and G. Anbarjafari. Convolutional neural network super resolution for face recognition in surveillance monitoring. In International conference on articulated motion and deformable objects. Springer, 2016.
- [37] M. Riviere, O. Teytaud, J. Rapin, Y. LeCun, and C. Couprie. Inspirational adversarial image generation. arXiv preprint 1906.11661, 2019.
- [38] R. Ros and N. Hansen. A simple modification in cma-es achieving linear time and space complexity. In G. Rudolph, T. Jansen, N. Beume, S. Lucas, and C. Poloni, editors, Parallel Problem Solving from Nature – PPSN X, pages 296–305, Berlin, Heidelberg, 2008. Springer Berlin Heidelberg.
- [39] B. Roziere, N. C. Rakotonirina, V. Hosu, H. Lin, A. Rasoanaivo, O. Teytaud, and C. Couprie. Evolutionary super-resolution. In Proceedings of the 2020 Genetic and Evolutionary Computation Conference Companion, pages 151–152, 2020.
- [40] M. S. Sajjadi, B. Scholkopf, and M. Hirsch. Enhancenet: Single image super-resolution through automated texture synthesis. In International Conference on Computer Vision, 2017.
- [41] J. Schonfeld and D. A. Ashlock. A comparison of the robustness of evolutionary computation and random walks. In Proceedings of the 2004 Congress on Evolutionary Computation (IEEE Cat. No.04TH8753), volume 1, pages 250–257 Vol.1, 2004.
- [42] M. Schumer and K. Steiglitz. Adaptive step size random search. IEEE Transactions on Automatic Control, 1968.
- [43] J. Shermeyer and A. Van Etten. The effects of super-resolution on object detection performance in satellite imagery. In Conference on Computer Vision and Pattern Recognition Workshops, 2019.
- [44] C. K. Sønderby, J. Caballero, L. Theis, W. Shi, and F. Huszár. Amortised map inference for image super-resolution, 2016.
- [45] X. Wang, K. Yu, C. Dong, and C. Change Loy. Recovering realistic texture in image super-resolution by deep spatial feature transform. In Conference on Computer Vision and Pattern Recognition, 2018.
- [46] X. Wang, K. Yu, S. Wu, J. Gu, Y. Liu, C. Dong, Y. Qiao, and C. C. Loy. Esrgan: Enhanced super-resolution generative adversarial networks. In European Conference on Computer Vision Workshops (ECCVW), 2018.
- [47] Z. Wang, K. Jiang, P. Yi, Z. Han, and Z. He. Ultra-dense gan for satellite imagery super-resolution. Neurocomputing, 2019.
- [48] A. Zamuda, J. Brest, B. Bošković, and V. Zumer. Large scale global optimization using differential evolution with self-adaptation and cooperative co-evolution. pages 3718 – 3725, 07 2008.
- [49] R. Zeyde, M. Elad, and M. Protter. On single image scale-up using sparse-representations. In International conference on curves and surfaces. Springer, 2010.
- [50] W. Zhang, Y. Liu, C. Dong, and Y. Qiao. Ranksrgan: Generative adversarial networks with ranker for image super-resolution. In Proceedings of the IEEE International Conference on Computer Vision, pages 3096–3105, 2019.