The mechanism of individual time cost heterogeneity promotes cooperation in snowdrift game111This work was partially supported by National Science Foundation (62073270, 61673016, 61703353), innovation Research Team of the Education Department of Sichuan province (15TD0050), and the Graduate Innovative Research Project of Southwest Minzu University, Project number: CX2020SZ90.
Abstract
Cost of time passing plays an important role when investigate the collective behaviour in real world. Each rational individual can get a more reasonable strategy by comprehensively considering the time cost. Motivated by the fact, we here propose a mechanism with individual time cost heterogeneity whose core lies in two aspects: 1. The individuals in the rule network are divided into 2 groups: high-time cost and low-time cost. 2. Each individual is endowed with a time cost parameter, and the individuals take into account the effect of time cost on the benefit when they interact with a neighbour. The synchronous updating algorithm is used to study the evolution of cooperation with time cost on a regular lattice. Simulation results show that the proposed mechanism effectively promotes cooperation in the snowdrift game. Moreover, it is revealed that the following reasons lead to a higher level of cooperation: The higher time cost, the more individuals of high-time cost in the group, and the more differences of time cost between groups when low-time cost remains unchanged.
keywords:
Snowdrift game, Time cost, Cooperation , Evolutionary game1 Introduction
Cooperation is the general trend in human society and biome. Research on cooperative behavior has become a hot spot in academic research [1, 2, 3]. And for studying this issue, evolutionary game theory provides a useful theoretical framework which can resolve the contradiction between cooperation and selfless [4]. The evolutionary game was developed by mathematician Von Neumann and economist Morgan Stern in 1944, and has formed many classic frameworks now. For example, snowdrift game, prisoner’s dilemma game, public goods game, deer hunting game, etc [5, 6, 7, 8, 9, 10].
Early in 2006, Novak proposed that cooperative behaviors should be supported by corresponding mechanisms before they can appear, and introduced five mechanisms [11] to promote cooperation: Kinship selection, direct reciprocity, indirect reciprocity, network reciprocity and group selection. The core idea of kinship selection is to explain the cooperative behavior that occurs between individuals with kinship or closer relationships, the derived mechanism is: Hanmilotons rule [12] (the condition for altruistic behavior is , where is the probability of having the same gene, and is the cost-benefit-ratio. For example, between brothers, cousins between ), the herd mechanism (individuals will choose the strategy that their neighbors choose the most to change themselves). Direct reciprocity [13] is the interaction that the two sides of the game will repeat many times. If this side chooses cooperation this round, then the probability of the other party choosing cooperation will be very high for the next round. There are mechanisms derived from this idea: Tit-For-Tat (TFT) rule [14, 15], which completely imitates the other party’s previous selection. Win-Stay, Lost-Shift (WSLS) rules [16, 17]. In this rule, if this round of selection gains high returns, the next round will keep the strategy, whereas the subsequent round will make the opposite choice. Indirect reciprocity [18] arises from the complex relationship of human society. The interaction between individuals and individual views is limited, and more interaction with strangers, so it can also be explained that indirect reciprocity is based on direct reciprocity. Mechanisms derived from indirect reciprocity, such as, reward and punishment mechanism [19, 20, 21, 22, 23]. Its basic idea is to reward cooperator and punish defectors. Both rewards and punishments can promote cooperation, but the research of various scholars and studies tells us that punishments can promote cooperation more than rewards. In the real world, an individual will not interact with all individuals, but only with a few individuals, and such an interactive relationship constitutes a network structure [24, 25, 26]. Therefore, many scholars have also focused on the network structure: The first evolutionary game proposed by Novak on the regular network [27], and then the research on the evolutionary game on the small-world network and the scale-free network has also become a hot spot for scholars [28, 29, 30, 31, 32, 33, 34, 35, 36]. In addition to these 5 types of mechanisms, some scholars have found that adding memory mechanism [37, 38, 39] can also promote cooperation. The idea of the memory mechanism is that the individual can refer to the strategies of the previous rounds and choose the strategy in the round with the highest benefit for him to play this round of the game. Some scholars have proposed adding some parameters, such as the heterogeneity of learning ability [40].
In 2019, some scholars suggested that time cost in the snowdrift game can also promote the level of cooperation [41]. They assume that two drivers are stuck on the road. If one chooses to cooperate and the other chooses to defect, the defector doesn’t seen to lose anything, but the passing of time can also cause losses to the defector. But the article has certain limitations. We find that few studies focus on the influence of group s type of the evolution of cooperation in network games. From this perspective, we propose a method for the effect of individual time cost heterogeneity(ITCH) mechanism on the level of cooperation in the snowdrift game. We mainly study the snowdrift game model, in addition to the originally considered snow shoveling cost, a new time cost parameter is added. Secondly, the whole group is divided into (high-time cost) and (low-time cost), that is to say, the time cost considered by and is different. Because, in human society, the importance of time for people with different identities is different, so the time cost for diverse groups of people due to the passing of time is also different. Considering these, we introduce a parameter that is the value of time cost which is represents the time cost of each individual caused by the passage of time. And introduce a parameter to represent the percentage of group in the whole group. In order to better reflect the impact of differences between groups on the level of cooperation, we also introduces a parameter for research. Simulation results show that the proposed mechanism effectively promotes cooperation in the snowdrift game.
The rest of this paper is organized as follows: In Section 2, we introduce a model of ITCH mechanism. In Section 3, we show the simulation results and analyze it. In Section 4, we give the conclusion of this article.

2 Model
The individuals in the network are divided into 2 groups, (high-time cost) and (low-time cost). Individual and individual production is defined by the parameters and , where represents the percentage of individual in the total population. In the traditional snowdrift game, the calculation of revenue is:
| (1) |
Among them, , and . According to the parameterization method, we transform the matrix into another more suitable form.
| (2) |
Among them. , , , , and , represents the cost benefit ratio of mutual cooperation.
When one side chooses to cooperate and the other side chooses to defect, the defector seen to have no cost, but as time goes by, the defector will also incur time cost. So define a parameter to represent time cost. In a situation where one chooses to cooperate and the other chooses to defect, the defector s benefit will become:
| (3) |
In this formula, the defector’s benefit minus the time cost, and represents the proportion of time cost in the cost . Different individuals have different sensitivities to the passage of time, so the benefit of the category group in the above situation is:
| (4) |
The benefit of the category group in the above situation is:
| (5) |
And ( is the differences of time cost coefficient between high-time cost and low-time cost)
Each point on the grid represents an individual , and the probability of each individual choosing cooperation or defection strategy in the first round is 50. 4 dots around represents its 4 neighbors , . In each round of the game, the individual chooses the appropriate strategy or to play with its neighbors, and at the same time it’s neighbors also choose the appropriate strategy or . In the model, this game is repeated four times among individuals who are not repeated among four neighbors. Then the four benefits obtained by individual are accumulated. In summary, the cumulative benefit obtained by individual in round is as follows:
| (6) |
For better simulation, we use the Fermi update formula to update the strategy of individual , the formula is as follows:
| (7) |
In the formula, indicates round parameter, is under the update rule of the noise parameter, the individual maintains its original strategy with a probability of . The parameter , indicates that all individuals are not affected by the neighbor’s benefit, and the decision is completely taken in a random way. In this case, even if the benefit of the individual is greater than the neighbor , the individual will still change the strategy, which will make the benefit lower. When , it means that the individual is completely rational. As long as is satisfied, the individual ’s strategy is replaced by the strategy of its neighbor . Depending on the above description, we choose . The simulation starts in a random state and iterates continuously until the simulation results are stable.
3 Simulation and discussion
The simulation process is performed on a regular grid with vertices. Each player is connected to his four nearest neighbors. The initial cooperative probability of each individual is set as , the size of the regular grid is . The average frequency of cooperative acts is quantified as the cooperation level F, where F is obtained by counting the ratio of the number of cooperators in the whole population after the system reaches a relatively steady state, that is, the F is gained by averaging rounds after a transient of rounds. In order to assure suitable accuracy, each point in simulation figures is averaged 20 interdependent realizations.
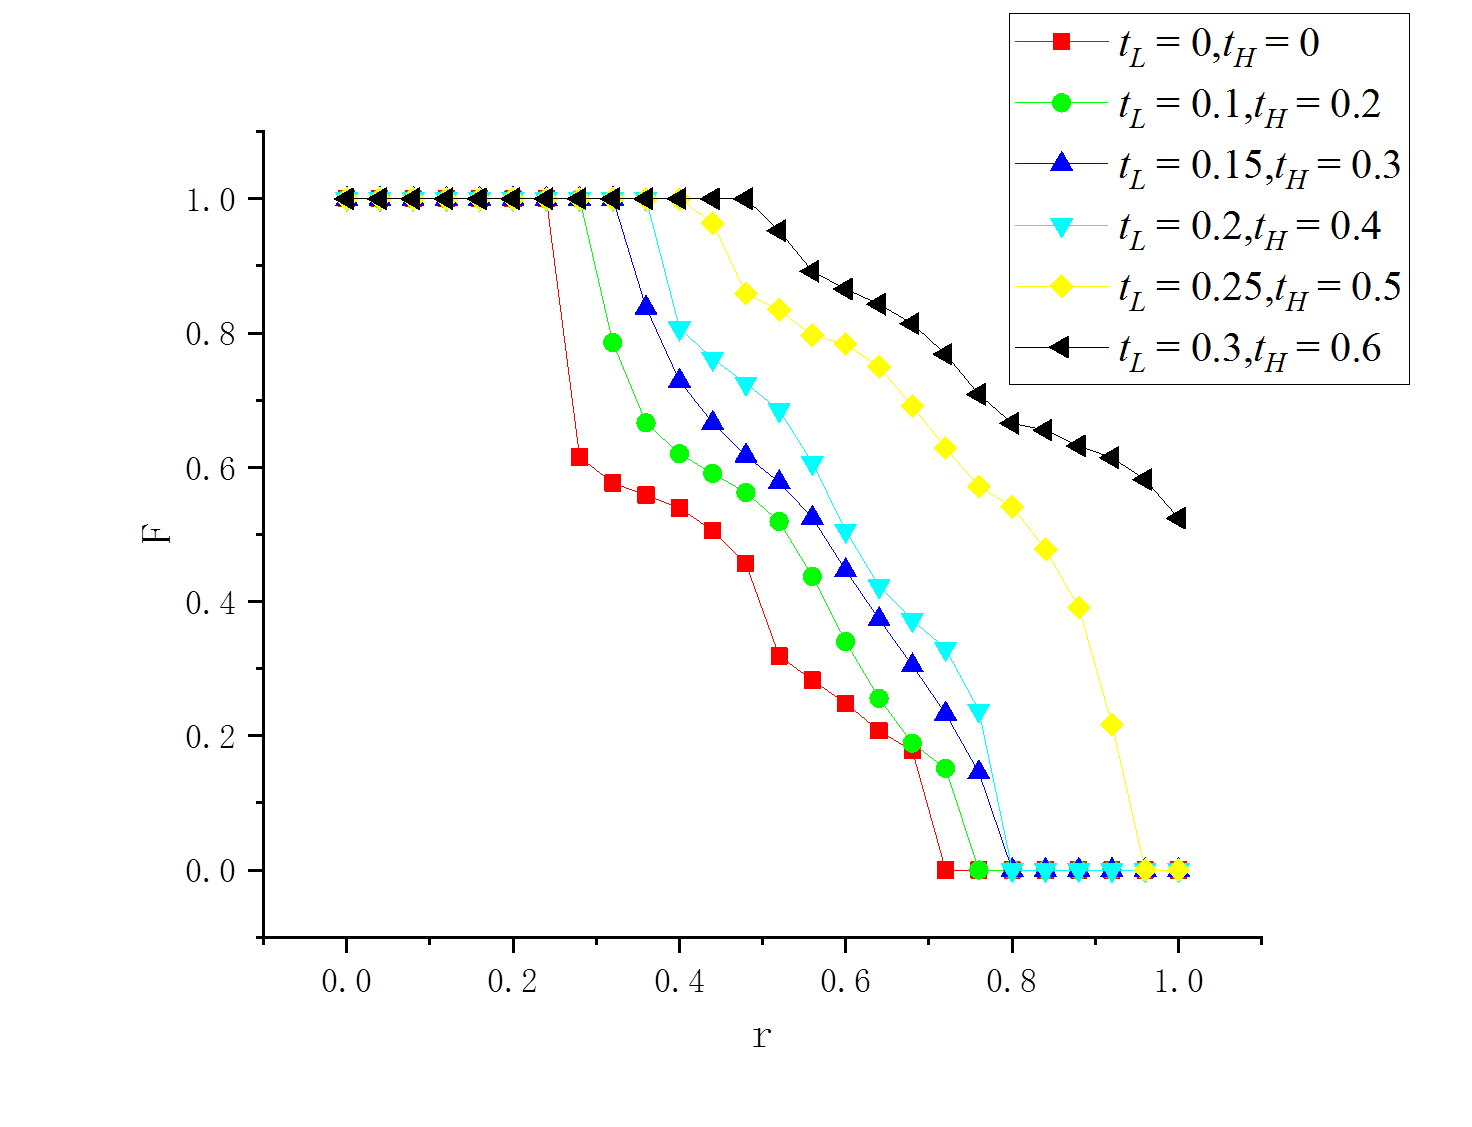
In our simulation, the following fact is observed: As shown in Fig. 1, we can see that the mixed strategy cannot maintain a high level of cooperation in the case of (that is, the traditional Fermi learning process), the system quickly turns into complete defect in the process of increasing . However, in the case of (that is, considering the learning process with ITCH mechanism), the number of defectors can be greatly reduced and the level of cooperation can be significantly improved. For different time cost , the cooperation level of the system increases as the increasing of value. When , players have few cost time, then the impact on the cooperation level is small. However, compared with , the threshold value of increases a lot, and when is about , the system is completely betrayed. Moreover, the larger and can enhance cooperation further.
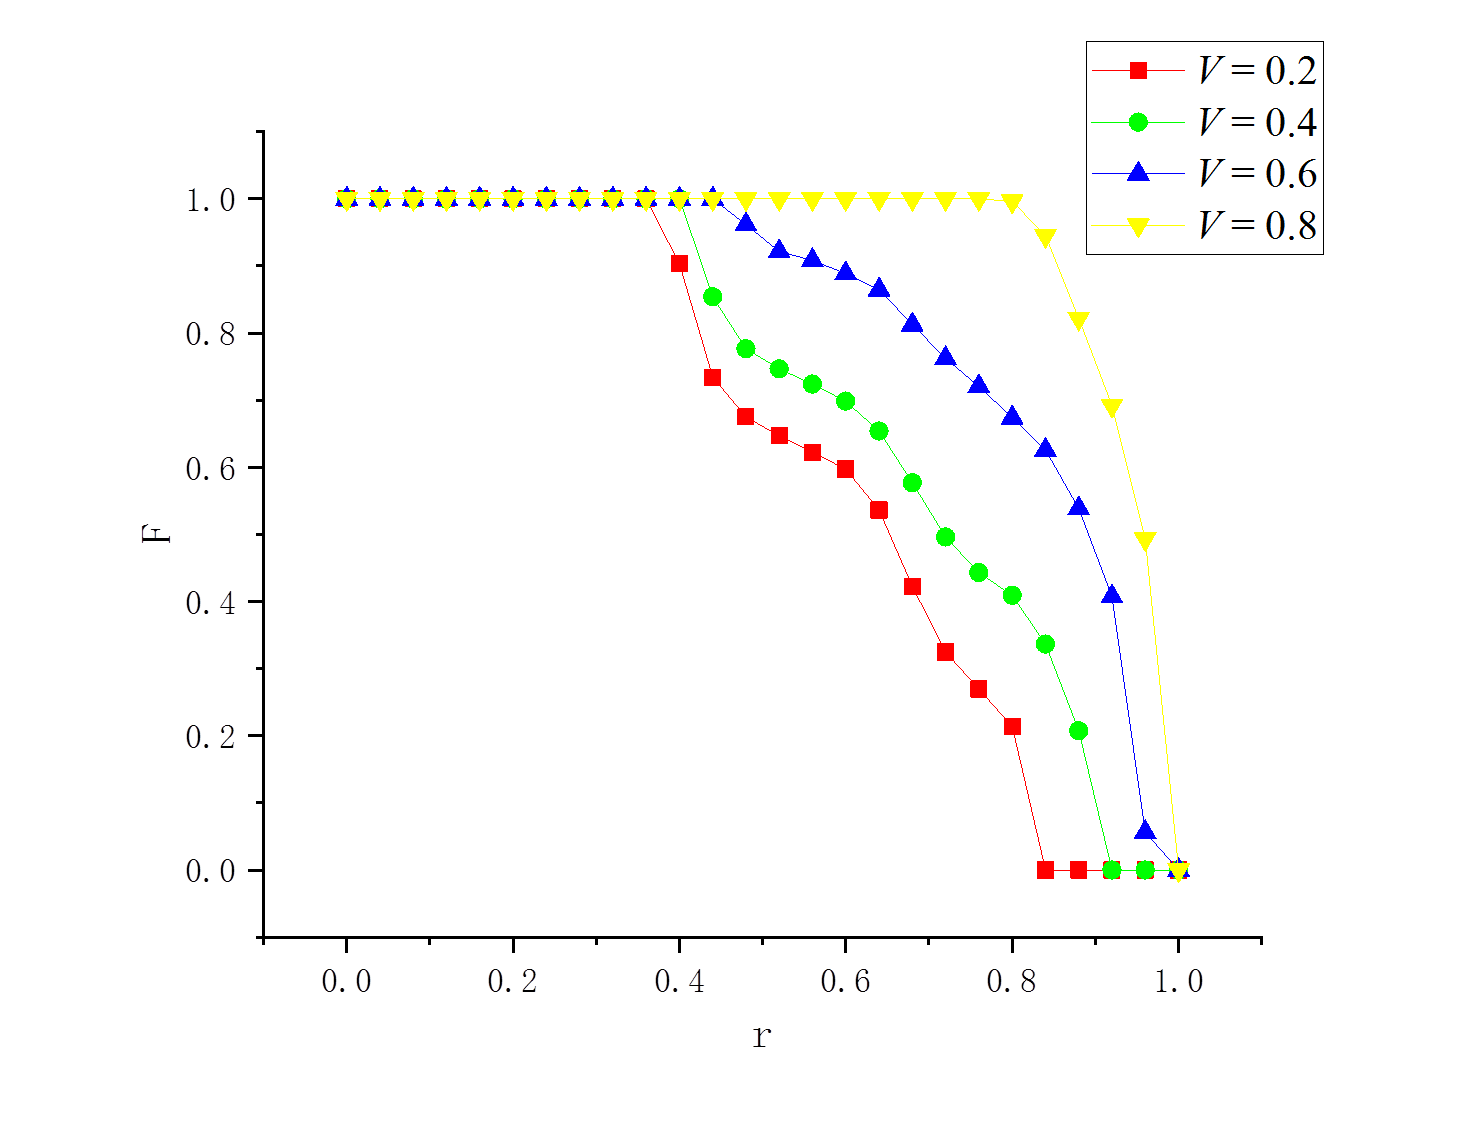
Then, we also pay attention to the situation that the cooperators’ fraction F changes with cost-to-benefit ratio of snow shoveling at several different (as shown in Fig. 2). The value of F increases when continue to increase. This is because controls the benefit of group, the higher the value is, the more time cost is and the more it will take for player to pay for their cost, the more their will choose cooperate. At the same time scale, players who continue to adopt the defect strategy will gain very few payoffs, only players who continue to adopt cooperative strategies can consistently maintain high payoffs, which successfully reduces large-scale defect and improves the level of cooperation. Therefore, the higher the value, the higher the level of cooperation.
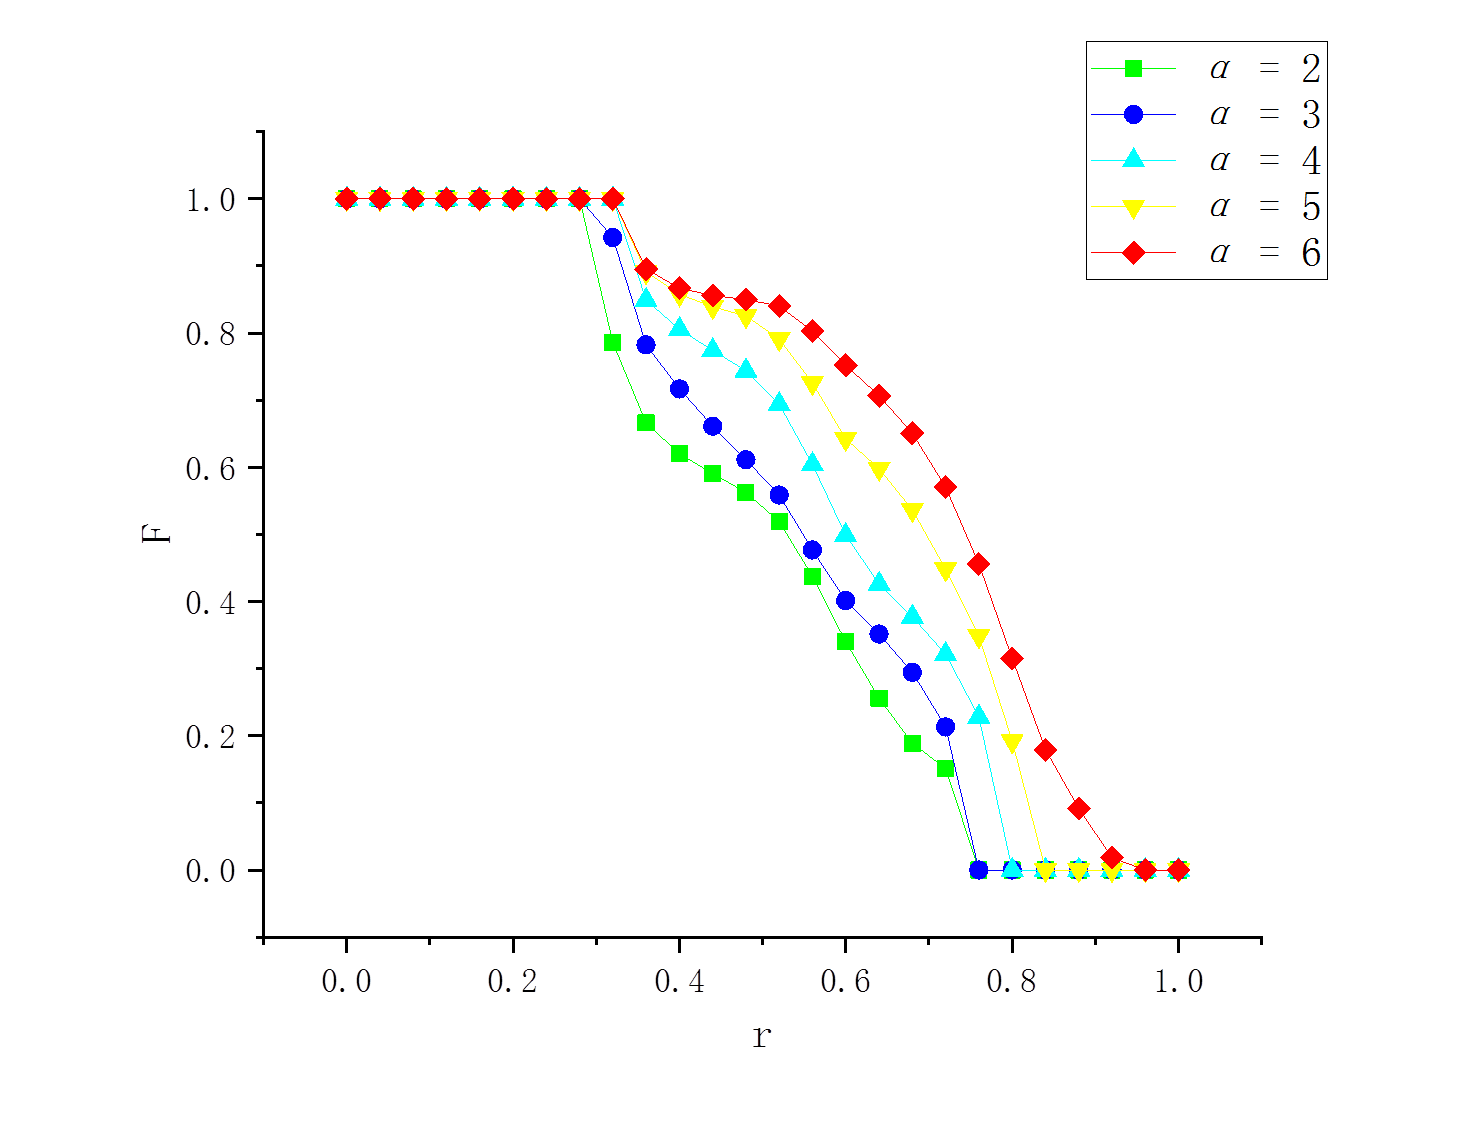
We have also studied the effect of the value on the cooperation level at different payoff. represents the time cost difference between the low-time cost individuals and the high-time cost individuals in the model when low-time cost unchanged. As shown in Fig. 3 that for a small (), F remains at a high level. Then gradually increases, the smaller is, the faster the cooperator will disappear.


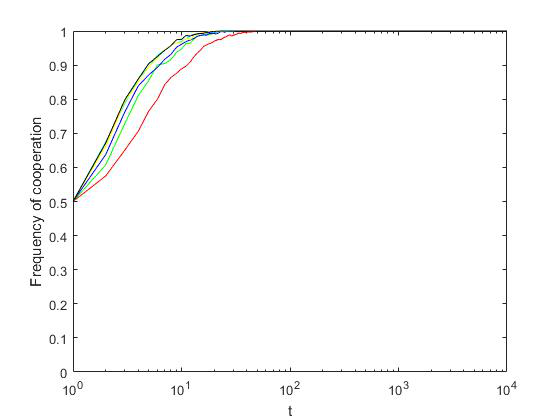
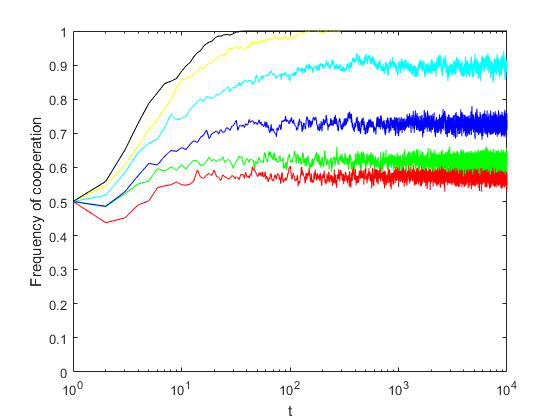
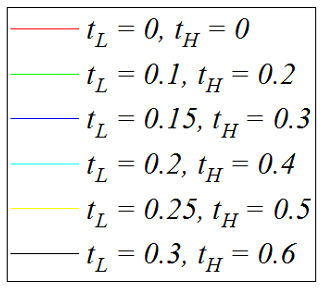
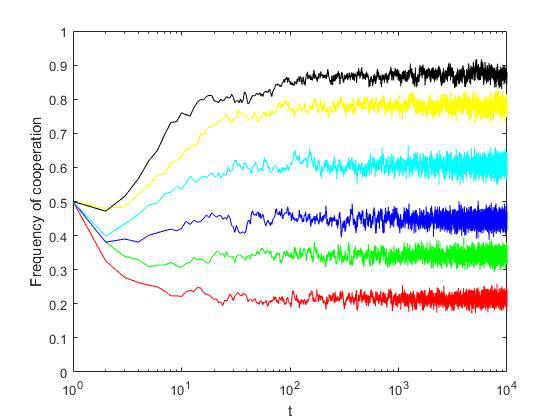
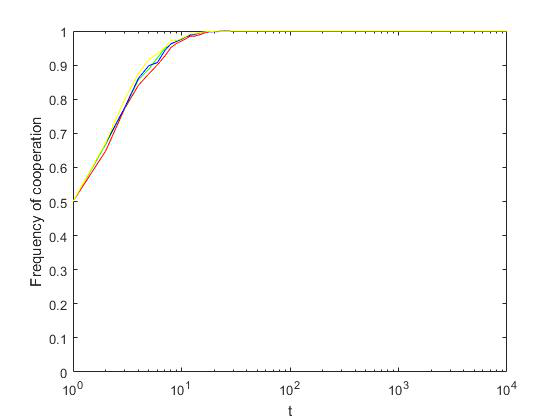
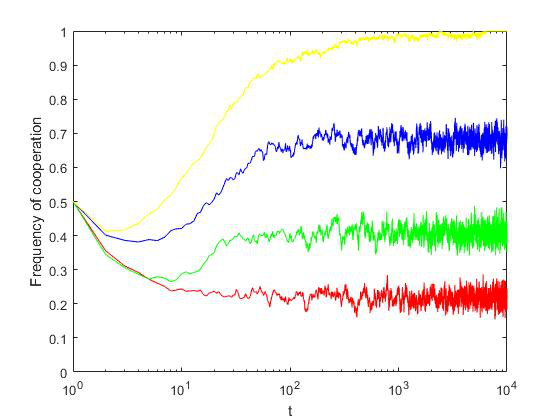
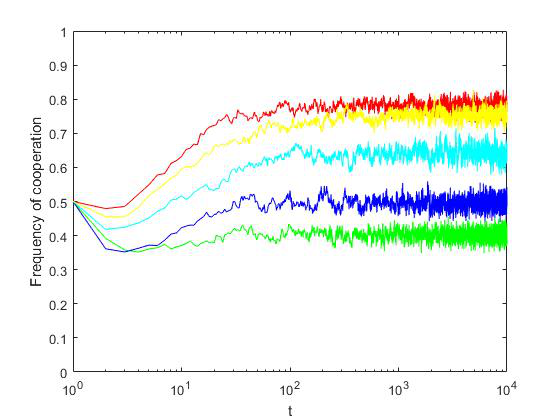
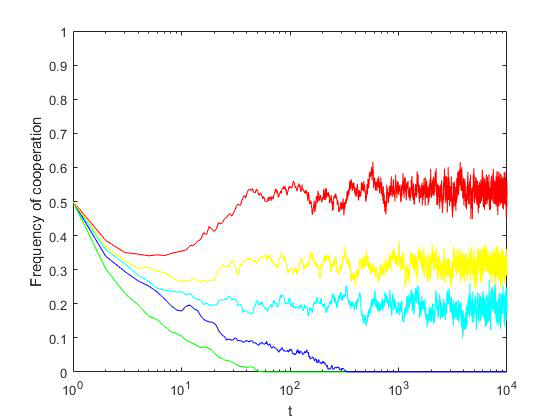
In order to further verify the obtained results, the numerical simulations of time courses that describe the relation between F and time steps are shown in Figs. 4-6.
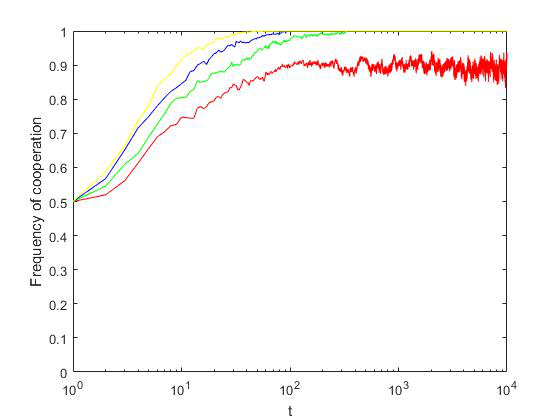
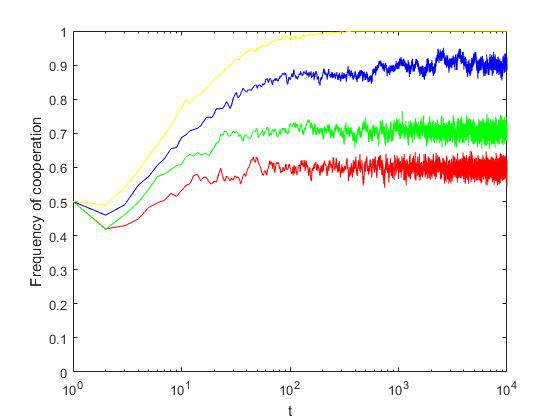
It is found from Fig. 4 that for a small =0.2, 0.4, F increases sharply. After a transitory period, F arrives at a relatively stable state. Obviously, the F for is higher than that for . For an intermediate =0.6, the F for tL,tH=0, 0.1, 0.15 decreases dramatically, while that for tL,tH = 0.2, 0.25, 0.3 surges. When the r is larger(r=0.8), the F values in the considered model still keep an upward trend with a fast speed for and a slight speed for .
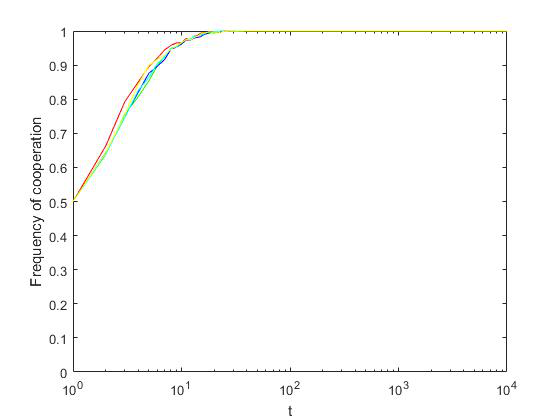
Then, we observe the effects of cooperation in population proportion . For the =0.2, 0.4, 0.6, F increases significantly for all . When further increasing (=0.8), the F value for =0.6, 0.8 continually remains a high ratio, while that for =0.2, 0.4, shows a downward trend.
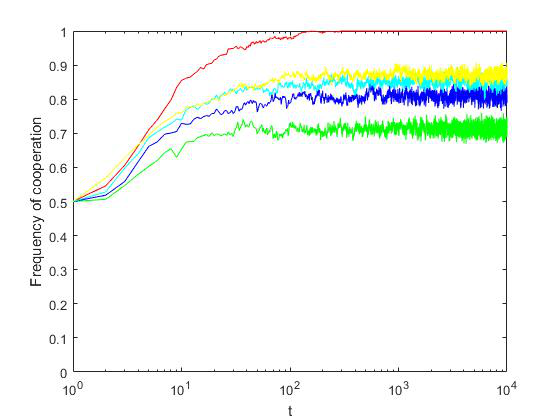
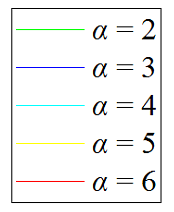
Finally, let us notice the impacts of evolution of cooperation in value. For the =0.2, 0.4, F increases significantly for all . However, for a large =0.8, the F for =2, 3, 4, 5 deceases quickly, but =6 decrease slowly, then gradually rise to a level.
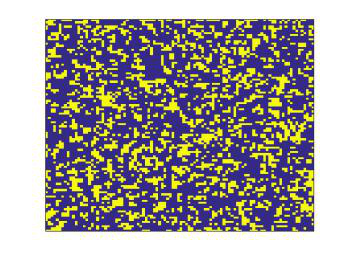
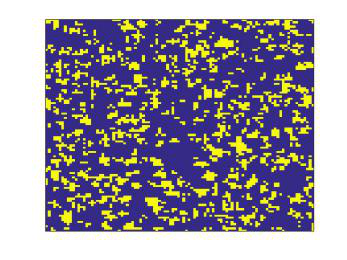
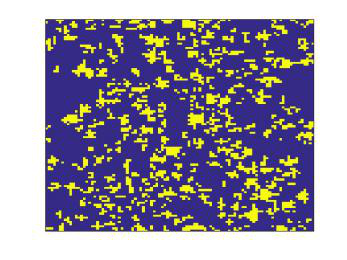
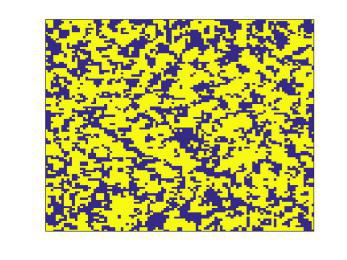

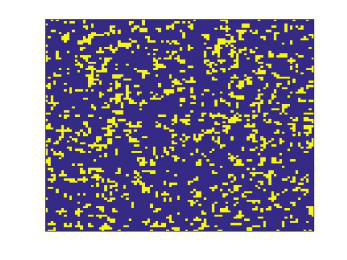
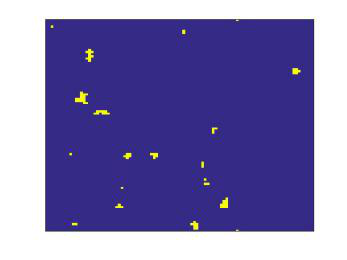
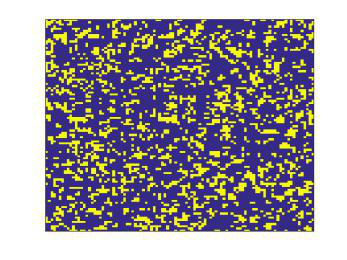
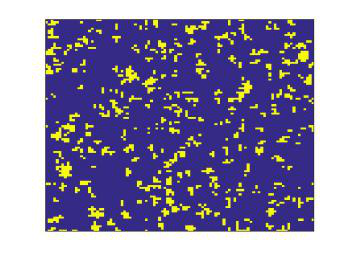
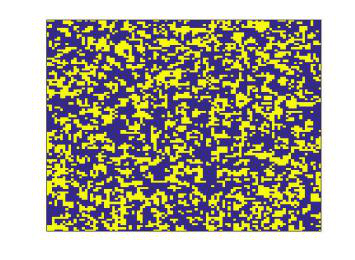
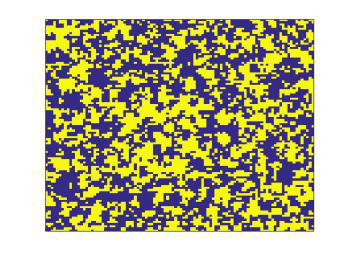
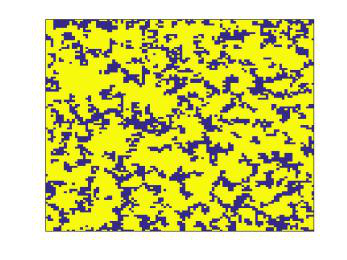
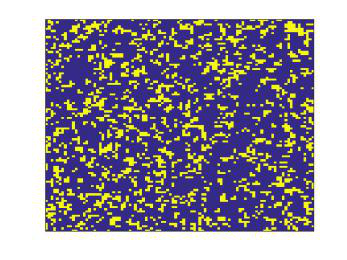
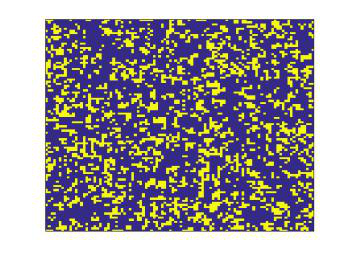
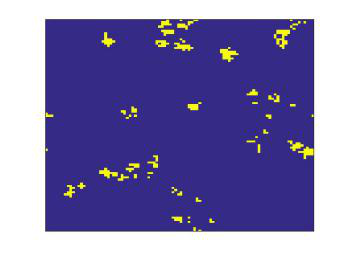
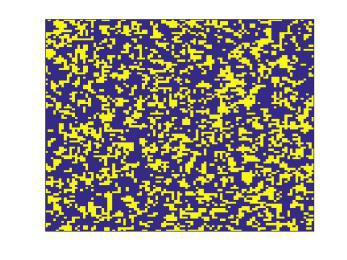
From the above descriptions, it is seen that in the three mentioned situations, whether the cost-to-benefit ratio of snow shoveling is small, intermediate or large, the F can be enhanced by the ITCH mechanism compared to the traditional model. On the other hand, to further understand the reason of above phenomena, we next scrutinize the microscopic evolutionary process in Figs. 7-9.
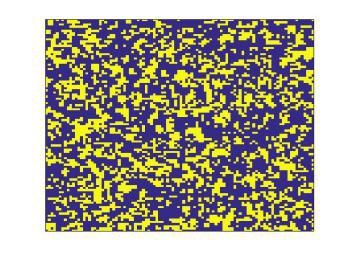
One can see from Fig. 7 that we choose a large =0.8, when the , the cooperators can survive by forming the compact clusters to avoid being exploited by the defectors, which will isolate the defectors little by little from the whole population. Although some patches of defectors appear in the evolutionary process, this does not prevent the extinction of them.
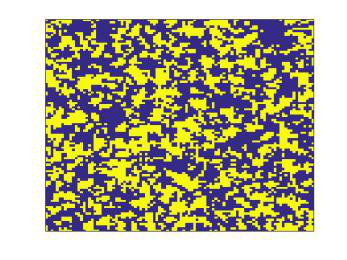
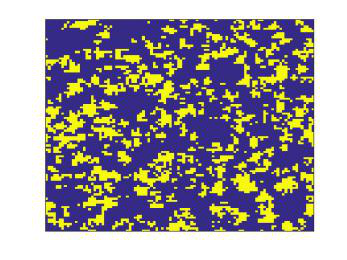
Similar results also appear in Fig. 8 Especially, for the large =0.8, cooperators form the clusters faster to protect themselves against invasion. As a result, the defectors vanish in the lattice.
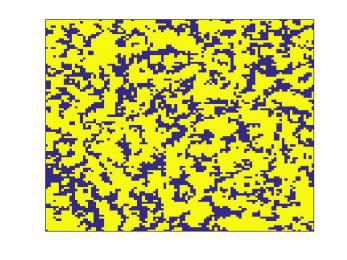
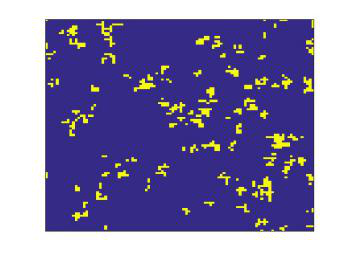
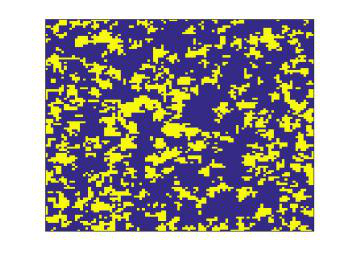
Analogous phenomenon is also discovered in Fig. 9 Nevertheless, when r is larger, the situation becomes much harsher in a small . A number of players are attracted by the temptation to defect and defectors win the evolutionary race.
By analyzing the evolutionary process of cooperators and defectors on a square lattice for different , we elucidate the reason why the ITCH strategy can promote cooperation in the structured population to some extent.


4 Conclusions
We have intensively explored how the mechanism of ITCH affects cooperation on the regular network. And we discuss the effect of different time cost, proportions of the two groups and the time cost difference on the level of cooperation in the model.
As for the evolution, each player interacts with its nearest four neighbours. The time cost plays a crucial part in the evolution of cooperation. It is found that when time cost increases gradually, the cooperation level always increases. And the level of cooperation is also affected by the proportion of the two groups, the simulation shows that the bigger proportion of high-time cost individual in the group leads to a higher level of cooperation. In addition, we discover if low-time cost remains unchanged, the greater time cost difference, the higher level of cooperation.
In conclusion, the mechanism of ITCH promotes cooperation.
References
References
- [1] G. Szabo, G. Fath, Evolutionary games on graphs, Physics Reports 446 (4) (2007) 97–216.
- [2] R. C. Lewontin, Evolution and the theory of games, Journal of Theoretical Biology 1 (3) (1961) 382–403.
- [3] J. M. Smith, G. R. Price, The logic of animal conflict, Nature 246 (5427) (1973) 15–18.
- [4] G. Palm, Evolutionary stable strategies and game dynamics for n-person games, Journal of Mathematical Biology 19 (3) (1984) 329–334.
- [5] T. Wu, F. Fu, L. Wang, Coevolutionary dynamics of aspiration and strategy in spatial repeated public goods games, New Journal of Physics 20 (6) (2018) 063007.
- [6] T. Wu, L. Wang, Adaptive play stabilizes cooperation in continuous public goods games, Physica A-statistical Mechanics and Its Applications 495 (2018) 427–435.
- [7] Q. Su, A. Li, L. Wang, Evolutionary dynamics under interactive diversity, New Journal of Physics 19 (10) (2017) 103023.
- [8] Z. Wu, Z. Rong, M. Z. Q. Chen, Diverse roles of the reduced learning ability of players in the evolution of cooperation, EPL 110 (3) (2015) 30002.
- [9] F. Fu, M. A. Nowak, C. Hauert, Invasion and expansion of cooperators in lattice populations: Prisoner’s dilemma vs. snowdrift games, Journal of Theoretical Biology 266 (3) (2010) 358–366.
- [10] J. Vukov, G. Szabo, A. Szolnoki, Cooperation in the noisy case: Prisoner’s dilemma game on two types of regular random graphs, Physical Review E 73 (6) (2006) 067103.
- [11] M. A. Nowak, Five rules for the evolution of cooperation, Science 314 (5805) (2006) 1560–1563.
- [12] W. D. Hamilton, The genetical evolution of social behaviour. i., Journal of Theoretical Biology 7 (1) (1964) 1–16.
- [13] R. Trivers, The evolution of reciprocal altruism, The Quarterly Review of Biology 46 (1) (1971) 35–57.
- [14] P. A. M. Van Lange, K. Visser, Locomotion in social dilemmas: How we adapt to cooperative, tit-for-tat, and noncooperative partners., Journal of Personality and Social Psychology 77 (4) (1999) 762–773.
- [15] M. A. Nowak, K. Sigmund, Tit for tat in heterogeneous populations, Nature 355 (6357) (1992) 250–253.
- [16] M. A. Nowak, K. Sigmund, A strategy of win-stay, lose-shift that outperforms tit-for-tat in the prisoner’s dilemma game., Nature 364 (6432) (1993) 56–58.
- [17] X. Chen, F. Fu, L. Wang, Promoting cooperation by local contribution under stochastic win-stay-lose-shift mechanism, Physica A-statistical Mechanics and Its Applications 387 (22) (2008) 5609–5615.
- [18] M. A. Nowak, K. Sigmund, Evolution of indirect reciprocity by image scoring, Nature 393 (6685) (1998) 573–577.
- [19] J. E. Bone, B. Wallace, R. Bshary, N. J. Raihani, The effect of power asymmetries on cooperation and punishment in a prisoner’s dilemma game, PLOS ONE 10 (1).
- [20] H. Rachlin, J. C. Brown, F. Baker, Reinforcement and punishment in the prisoner’s dilemma game, Psychology of Learning and Motivation 40 (2000) 327–364.
- [21] J. Li, L. Yu, Reward and punishment mechanism in a vertical safety regulation system: A transferred prisoner’s dilemma, Modern Economy 06 (5) (2015) 552–562.
- [22] E. Fehr, U. Fischbacher, The nature of human altruism., Nature 425 (6960) (2003) 785–791.
- [23] Y. Geng, C. Shen, K. Hu, L. Shi, Impact of punishment on the evolution of cooperation in spatial prisoner’s dilemma game, Physica A-statistical Mechanics and Its Applications 503 (2018) 540–545.
- [24] R. Albert, A. Barabasi, Statistical mechanics of complex networks, Reviews of Modern Physics 74 (1) (2001) 47–97.
- [25] S. N. Dorogovtsev, J. F. F. Mendes, Evolution of networks, Advances in Physics 51 (4) (2002) 1079–1187.
- [26] F. Reid, N. Hurley, Analysing structure in complex networks using quality functions evolved by genetic programming (2011) 283–290.
- [27] M. A. Nowak, R. M. May, Evolutionary games and spatial chaos, Nature 359 (6398) (1992) 826–829.
- [28] M. A. Nowak, R. M. May, The spatial dilemmas of evolution, International Journal of Bifurcation and Chaos 03 (01) (1993) 35–78.
- [29] M. A. Nowak, S. Bonhoeffer, R. M. May, More spatial games, International Journal of Bifurcation and Chaos 04 (01) (1994) 33–56.
- [30] M. A. Nowak, S. Bonhoeffer, R. M. May, Spatial games and the maintenance of cooperation, Proceedings of the National Academy of Sciences of the United States of America 91 (11) (1994) 4877–4881.
- [31] M. Nakamaru, H. Matsuda, Y. Iwasa, The evolution of cooperation in a lattice-structured population, Journal of Theoretical Biology 184 (1) (1997) 65–81.
- [32] G. Szabo, C. Toke, Evolutionary prisoner’s dilemma game on a square lattice, Physical Review E 58 (1) (1998) 69–73.
- [33] Y. Zhu, J. Zhang, Q. Sun, Z. Chen, Evolutionary dynamics of strategies for threshold snowdrift games on complex networks, Knowledge Based Systems 130 (2017) 51–61.
- [34] K. Kleineberg, Metric clusters in evolutionary games on scale-free networks, Nature Communications 8 (1) (2017) 1888.
- [35] Q. Su, L. Wang, H. E. Stanley, Understanding spatial public goods games on three-layer networks, New Journal of Physics 20 (10) (2018) 103030.
- [36] C. Xia, X. Li, Z. Wang, M. Perc, Doubly effects of information sharing on interdependent network reciprocity, New Journal of Physics 20 (7) (2018) 075005.
- [37] F. Shu, M. Li, X. Liu, Memory mechanism with weighting promotes cooperation in the evolutionary games, Chaos Solitons and Fractals 120 (2019) 17–24.
- [38] F. Shu, Y. Liu, X. Liu, X. Zhou, Memory-based conformity enhances cooperation in social dilemmas, Applied Mathematics and Computation 346 (2019) 480–490.
- [39] F. Shu, X. Liu, K. Fang, H. Chen, Memory-based snowdrift game on a square lattice, Physica A-statistical Mechanics and Its Applications 496 (2018) 15–26.
- [40] T. Wu, H. H. Wang, J. Yang, L. Xu, Y. Li, J. Zhang, The prisoner’s dilemma game on scale-free networks with heterogeneous imitation capability, International Journal of Modern Physics C 29 (09) (2018) 1850077.
- [41] J. Pu, T. Jia, Y. Li, Effects of time cost on the evolution of cooperation in snowdrift game, Chaos Solitons and Fractals 125 (2019) 146–151.