Isoelectronic perturbations to f-d-electron hybridization and the enhancement of hidden order in URu2Si2
Abstract
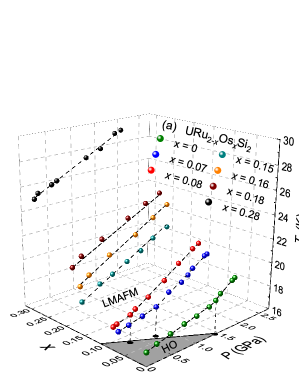
Electrical resistivity measurements were performed on single crystals of URu2-xOsxSi2 up to x = 0.28 under hydrostatic pressure up to P = 2 GPa. As the Os concentration, x, is increased, (1) the lattice expands, creating an effective negative chemical pressure Pch(x), (2) the hidden order (HO) phase is enhanced and the system is driven toward a large-moment antiferromagnetic (LMAFM) phase, and (3) less external pressure Pc is required to induce the HOLMAFM phase transition. We compare the T(x, P) phase behavior reported here for the URu2-xOsxSi2 system with previous reports of enhanced HO in URu2Si2 upon tuning with P, or similarly in URu2-xFexSi2 upon tuning with positive Pch(x). It is noted that pressure, Fe substitution, and Os substitution are the only known perturbations that enhance the HO phase and induce the first order transition to the LMAFM phase in URu2Si2. We present a scenario in which the application of pressure or the isoelectronic substitution of Fe and Os ions for Ru results in an increase in the hybridization of the U-5f- and transition metal d-electron states which leads to electronic instability in the paramagnetic phase and a concurrent stability of HO (and LMAFM) in URu2Si2. Calculations in the tight binding approximation are included to determine the strength of hybridization between the U-5f electrons and each of the isoelectronic transition metal d-electron states of Fe, Ru, and Os.
pacs:
71.27.+a, 72.10.Di, 74.62.Dh, 74.62.FjI introduction
The heavy-fermion superconducting compound URu2Si2 is known for its second-order phase transition into the so-called “hidden order” (HO) phase at a transition temperature 17.5 K.
Extensive investigation of the phase space in proximity to the HO phase transition has provided a detailed picture of the electronic and magnetic structure of this unique phase.Palstra et al. (1985); Maple et al. (1986); Schlabitz et al. (1986); Broholm et al. (1987); Schoenes et al. (1987); McElfresh et al. (1987); Dawson et al. (1989); Mason and Buyers (1991); Broholm et al. (1991); Santini and Amoretti (1994); Buyers et al. (1994); Escudero et al. (1994); Amitsuka et al. (1999); Chandra et al. (2002); Bourdarot et al. (2003); Wiebe et al. (2004); Behnia et al. (2005); Jeffries et al. (2007); Wiebe et al. (2007); Elgazzar et al. (2009); Janik et al. (2009); Santander-Syro et al. (2009); Haule and Kotliar (2010); Yoshida et al. (2010); Schmidt et al. (2010); Aynajian et al. (2010); Oppeneer et al. (2010, 2011); Kawasaki et al. (2011); Dakovski et al. (2011); Dubi and Balatsky (2011); Haraldsen et al. (2011); Pépin et al. (2011); Riseborough et al. (2012); Mydosh and Oppeneer (2011); Meng et al. (2013); Boariu et al. (2013); Bareille et al. (2009); Mydosh and Oppeneer (2014); Butch et al. (2015); Ran et al. (2016); Kung et al. (2016) However, more than three decades after the initial characterization of URu2Si2,Palstra et al. (1985); Maple et al. (1986); Schlabitz et al. (1986) the order parameter for the HO phase is still unidentified.
Most perturbations to the URu2Si2 compound have the effect of suppressing HO. The application of an external magnetic field () suppresses the HO phaseRan et al. (2016, 2017) and many of the chemical substitutions () at the U, Ru, or Si sites that have been explored, significantly reduce , even at modest levels of substituent concentration.Dalichaouch et al. (1989, 1990a, 1990b); Butch and Maple (2010); Yokoyama et al. (2004); Lopez de la Torre et al. (1992); Park and Coles (1994); Zwirner et al. (1997); Gallagher et al. (2016) At present, only three perturbations are known to consistently enhance the HO phase in URu2Si2: (1) external pressure , (2) isoelectronic substitution of Fe ions for Ru, and (3) isoelectronic substitution of Os ions for Ru. Upon applying pressure , the HO phase in pure URu2Si2 is enhancedMcElfresh et al. (1987) and the system is driven toward a large moment antiferromagnetic (LMAFM) phase.Butch et al. (2010) The HOLMAFM phase transition is identified indirectly by a characteristic “kink” at a critical pressure 1.5 GPa in the () phase boundary,Jeffries et al. (2007, 2008); Butch et al. (2010) and also directly by neutron diffraction experiments, which reveal an increase in the magnetic moment from (/U in the HO phase to /U in the LMAFM phase.Amitsuka et al. (1999); Bourdarot et al. (2004); Amitsuka et al. (2007)
Recent reports indicate that the isoelectronic substitution of Fe ions for Ru in URu2Si2 replicates the behavior in URu2Si2.Kanchanavatee et al. (2011); Das et al. (2015); Wolowiec et al. (2016) An increase in in URu2-xFexSi2 enhances the HO phase and drives the system toward the HOLMAFM phase transition at a critical Fe concentration 0.15.Das et al. (2015); Wilson et al. (2016) The decrease in the volume of the unit cell due to substitution of smaller Fe ions for Ru may be interpreted as a chemical pressure, , where the Fe concentration can be converted to ().Kanchanavatee et al. (2011); Wolowiec et al. (2016) In addition, the induced HOLMAFM phase transition in URu2-xFexSi2 occurs at combinations of and that consistently obey the additive relationship: + 1.5 GPa. Kanchanavatee et al. (2011); Wolowiec et al. (2016) These results have led to the suggestion that is equivalent to in affecting the HO and LMAFM phases.Das et al. (2015); Wolowiec et al. (2016)
Reports of the isoelectronic substitution of larger Os ions for Ru have shown that an increase in in URu2-xOsxSi2: (1) expands the volume of the unit cell, thus creating an effective chemical pressure ( 0), (2) enhances the HO phase, and (3) drives the system toward a similar HOLMAFM phase transition at a critical Os concentration of 0.065. Kanchanavatee et al. (2014); Hall et al. (2015); Wilson et al. (2016) These results are contrary to the expectation that a would lead to a suppression of HO and complicates the view of “chemical pressure” as a mechanism affecting the evolution of phases in URu2Si2.
In this paper, we report on the (, ) phase behavior for the URu2-xOsxSi2 system based on measurements of single crystals of URu2-xOsxSi2 as a function of Os concentration , and applied pressure . The (, ) phase behavior observed here for the URu2-xOsxSi2 systemKanchanavatee et al. (2011); Das et al. (2015); Wolowiec et al. (2016) is compared to that of the URu2-xFexSi2 system and also with the behavior in pure URu2Si2. As an explanation for the enhancement of HO toward the HOLMAFM phase transition, we suggest a scenario in which each of the perturbations of Os substitution, Fe substitution, and pressure favors delocalization of the 5 electrons and increases the hybridization of the uranium 5- and transition metal (Fe, Ru, Os) -electron states. In order to avoid an ad-hoc explanation of the effect of increasing the Os concentration in URu2-xOsxSi2, compared to the effects of pressure and Fe substitution, we explain how pressure , Fe substitution, and Os substitution are three perturbative routes to enhancement of the U-5- and -electron hybridization. The importance of the 5- and -electron hybridization to the emergence of HO/LMAFM is presented in the context of the Fermi surface instability that leads to a reconstruction and partial gapping of the Fermi-surface during the transition from the paramagnetic (PM) phase to the HO and LMAFM phases.Maple et al. (1986); McElfresh et al. (1987); Denlinger et al. (2001); Santander-Syro et al. (2009); Elgazzar et al. (2009); Yoshida et al. (2010); Schmidt et al. (2010); Aynajian et al. (2010); Boariu et al. (2013); Bareille et al. (2009)
In an effort to further understand the effect of isoelectronic substitution on the 5- and -electron hybridization, calculations in the tight-binding approximation were made for compounds from the series U2Si2 ( = Fe, Ru, and Os). The calculations indicate that the degree of hybridization is largely dependent on the magnitude of the difference between the binding energy of the localized U-5 electrons and that of the transition metal electrons.
II Experimental Details
The experimental design and procedure, including synthesis of single crystals, crystallographic measurements, and measurements of electrical resistivity under applied pressure are similar to those in the investigation of the URu2-xFexSi2 system as described in Ref. Wolowiec et al., 2016. Single crystals of URu2-xOsxSi2 at nominal concentrations of = 0, 0.025, 0.05, 0.10, 0.13, 0.16, and 0.20 were grown according to the Czochralski method in a tetra-Arc furnace. The quality of the single crystal samples were determined by Laue X-ray diffraction patterns together with X-ray powder diffraction (XRD) measurements. The XRD patterns were fitted according to the Rietveld refinement technique using the GSAS-II software package. Toby and Von Dreele (2013) Elemental analysis of single crystal samples of URu2-xOsxSi2 at nominal concentrations of = 0.025, 0.05, 0.10, 0.13, and 0.20 was performed using energy-dispersive X-ray spectroscopy (EDX). Based on the EDX measurements, the actual osmium concentrations in these samples were determined to be = 0.07, 0.08, 0.15, 0.18, and 0.28, respectively. In this report, the Os concentration in these single crystal URu2-xOsxSi2 samples is taken as as determined from the EDX measurements, unless otherwise stated. It is noted that the single crystal sample with nominal Os concentration = 0.16 was not available for EDX measurement and thus = = 0.16 in this case. (See Sec. VI for details on sample quality and the error in Os concentration.)
Annealed Pt wire leads were affixed with silver epoxy to gold-sputtered contact surfaces on each sample in a standard four-wire configuration. Electrical resistivity () measurements were performed on single crystals of URu2-xOsxSi2 under applied pressure up to = 2 GPa for Os concentrations = 0, 0.07, 0.08, 0.15, 0.16, 0.18 and 0.28. A 1:1 mixture by volume of -pentane and isoamyl alcohol was used to provide a quasi-hydrostatic pressure transmitting medium and the pressure was locked in with the use of a beryllium copper clamped piston-cylinder pressure cell. The pressure dependence of the superconducting transition temperature of high purity Sn was used as a manometer. Measurements of were performed upon warming from 1 to 300 K in a pumped 4He dewar and the temperature was determined from the four-wire electrical resistivity of a calibrated Cernox sensor.
III Results
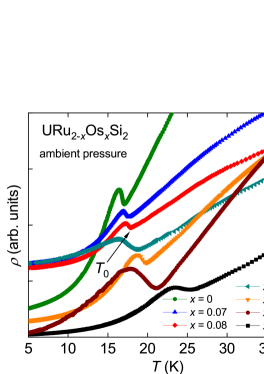
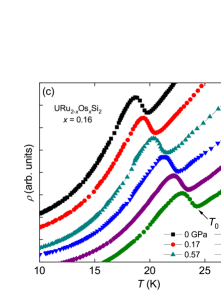
Figure 1 displays the temperature dependence of the ambient pressure electrical resistivity in the vicinity of the transition temperature for the URu2-xOsxSi2 system. The transition from the paramagnetic (PM) phase to the HO phase (or LMAFM phase at higher values of ) is defined to be at the location of the minimum in , which occurs prior to the upturn in upon cooling, as indicated by the black arrow. It is clear that the feature in shifts to higher temperature as is increased.
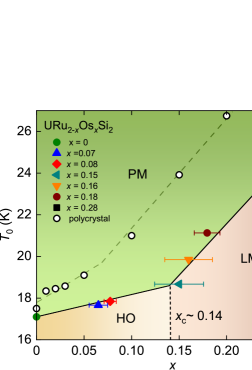
The values of , as determined from the data shown in Fig. 1 for single crystal samples of URu2-xOsxSi2 at = 0, 0.07, 0.08, 0.15, 0.16, 0.18, and 0.28, were used to construct the – phase diagram displayed in Fig. 2. The solid black lines that outline the phase boundary between the PM phase and the HO (or LMAFM) phase are linear fits to the data. The solid black line of smaller slope outlining the phase boundary between the PM phase and the HO phase is a linear fit to the data for samples with low Os concentrations up to = 0.15. The solid black line of larger slope outlining the phase boundary between the PM phase and the LMAFM phase is a linear fit to the data for the single crystal samples with Os concentrations from = 0.15 to 0.28. The intersection of the two lines forms a “kink” in the phase boundary and is taken to be the location of the HOLMAFM transition at a critical Os concentration of 0.14.
Similar linear fits (dashed green lines) to the values of (white circles) taken from Ref. Kanchanavatee et al., 2014 for polycrystalline samples of URu2-xOsxSi2 suggest a critical concentration of 0.07. Given the differences inherent to synthesis of polycrystals compared to single crystals, the discrepancy between the values of the critical concentration for the polycrystalline and single crystal samples is not clearly understood. However, the two phase boundaries for polycrystalline and single crystal samples of URu2-xOsxSi2 are qualitatively similar with the phase boundary for single crystals being shifted toward higher Os concentration .
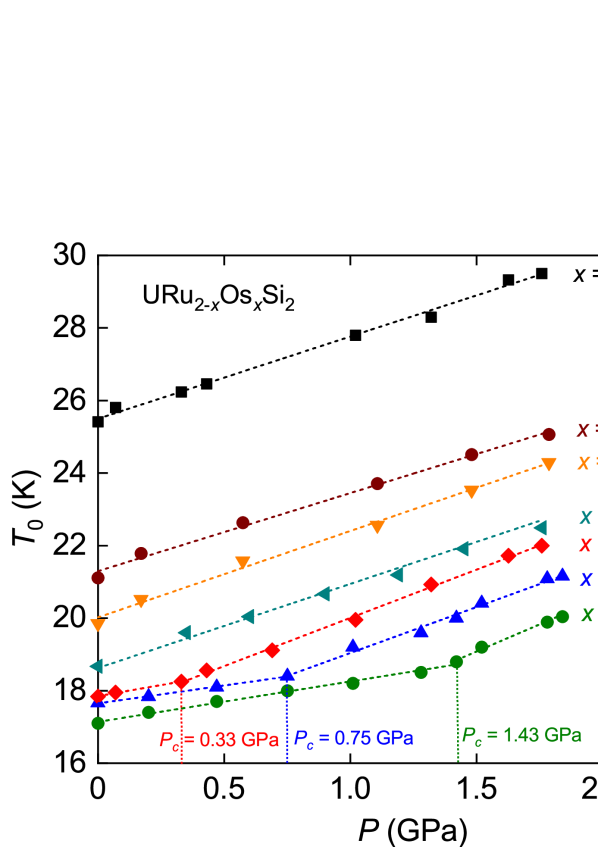
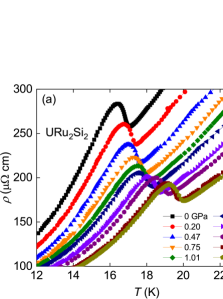
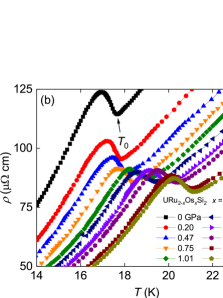
Figure 3 displays the temperature dependence of the electrical resistivity near for the URu2-xOsxSi2 system under applied pressure . Figure 3(a) displays for pure URu2Si2 as a function of pressure up to 1.9 GPa. As pressure is increased, the feature in shifts to higher temperature similar to what is observed with an increase in . Furthermore, the feature in appears to migrate more quickly with pressure above some critical pressure near 1.4 GPa. Figures 3(b) and (c) display in the vicinity of as a function of applied pressure for samples at = 0.07 and 0.16, respectively. The sample with = 0.07 (Fig. 3(b)) is at an Os concentration well below the critical concentration 0.14 and therefore exhibits the HO phase up to some critical pressure. As with the pure compound URu2Si2, the pressure dependence of the feature in increases above some critical pressure near 0.8 GPa. In contrast, for the sample with an Os concentration = 0.16 (Fig. 3(c)) greater than , the pressure dependence of the feature in is constant up to 2 GPa suggesting the sample is likely already homogenous in the LMAFM phase at ambient pressure.
The behavior for all seven single crystal samples from the URu2-xOsxSi2 system (at = 0, 0.07, 0.08, 0.15, 0.16, 0.18, and 0.28) is plotted in the “composite” vs phase diagram shown in Fig. 4. The phase boundaries for samples with = 0, 0.07, and 0.08 exhibit the characteristic discontinuity or “kink”, which is indicative of the first-order HOLMAFM phase transition. The slopes of the phase boundaries in the HO phase, prior to the discontinuities, for the = 0, 0.07, and 0.08 samples are d/d = 1.11, 0.99, and 1.21 K GPa-1, respectively. In the LMAFM phase, the slopes are significantly higher at d/d = 2.99, 2.53, and 2.66 K GPa-1, respectively. There is no discontinuity in the slope of the phase boundaries for the Os-substituted samples with higher Os concentrations of = 0.15, 0.16, 0.18, and 0.28 that are above , where the slopes were determined to be d/d = 2.31, 2.42, 2.15 and 2.27 K GPa-1, respectively. Note the equivalence between the values of the pressure dependence in both the HO phase (averaged at d/d 1.10 K GPa-1) and the LMAFM phase (averaged at d/d = 2.47 K GPa-1) across all of the samples. The values of all slopes were determined by linear fits (solid lines in Fig. 4) to the data in the HO or LMAFM phases and are in very good agreement with hydrostatic pressure coefficients reported in other investigations.Jeffries et al. (2007); Butch et al. (2010); Kambe et al. (2013); Wolowiec et al. (2016)
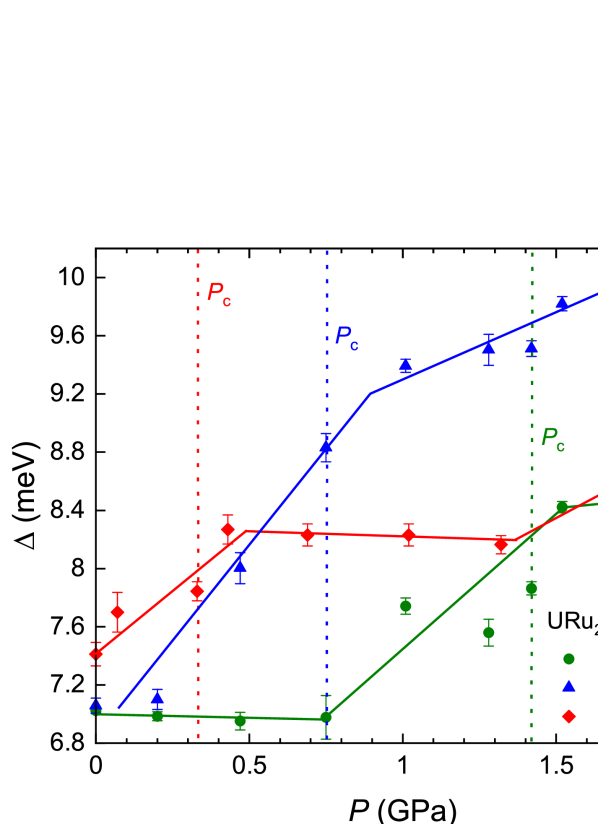
The pressure dependence of the charge gap that opens up over the Fermi surface during its reconstruction at the PMHO/LMAFM phase transition may serve as another measure of the critical pressure . Namely, the critical pressure can be taken as the value of where there is a change in the pressure dependence of that occurs at the first-order phase transition from HO to LMAFM. Figure 5 displays a plot of the energy gap as a function of pressure for single crystal samples of URu2-xOsxSi2 with = 0, 0.07, 0.08. The values of were extracted from fits of a theoretical model Fontes et al. (1999) of electrical resistivity to the data in the low temperature region below the feature in electrical resistivity (where d/d 0) as described in Ref. Wolowiec et al., 2016. From the vs. plots for each of the = 0, 0.07, 0.08 samples, there is a flattening of the pressure coefficient d/d at pressures of 1.55, 0.90, and 0.50 GPa that are consistent with the critical pressures = 1.43, 0.75, 0.33 GPa determined from the phase boundaries in Fig. 4. Interestingly, the “kinks” in vs. data occur at pressures that are consistently 0.15 GPa higher than the values. Low values of 7.2 meV correspond to transitions into the HO phase. Higher values of 8.5 meV correspond to transitions into the LMAFM phase. Intermediate values of preceding the plateau in the () curves suggest inhomogeneity and a percolation of the LMAFM phase as pressure is increased.
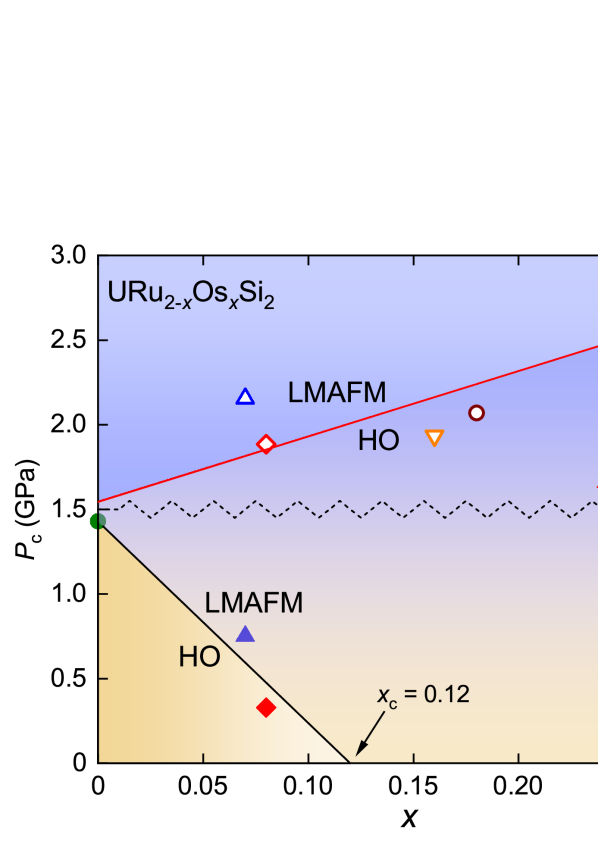
Of central importance to the current report is the reduction of the critical pressure with increasing Os concentration , as illustrated in Fig. 4. The vertical dashed lines locate decreasing values of = 1.43, 0.75, and 0.33 GPa for samples in order of increasing Os concentration = 0, 0.07, and 0.08. This is reminiscent of the reduction of with increasing Fe concentration for the URu2-xFexSi2 system.Wolowiec et al. (2016) Based on the results of the Fe-substituted system, in which lower values of were required to induce the HOLMAFM transition according to the additive relation: + 1.5 GPa, one would expect that (rather than lower) values of are required to induce the HOLMAFM transition for Os-substituted URu2Si2, which is biased with an effective chemical pressure ( 0). However, this is not what we observed. The discrepancy between the expected increase in and the reduction in that was observed experimentally, is illustrated in the plot of vs. as shown in Fig. 6. The solid black line with a negative slope is a linear fit to the experimentally determined values of (filled symbols) and represents the phase boundary between the HO and LMAFM phases for the URu2-xOsxSi2 system. The extrapolation of the fit to zero pressure yields a critical Os concentration of = 0.12, which is comparable to the value of = 0.14 determined from the ”kink” in vs phase diagram displayed in Fig. 2. The open symbols in Fig. 6 represent the expected values of critical pressure , which were determined by first converting the Os concentration to a negative chemical pressure and then using the additive property of chemical and applied pressure: + 1.5 GPa. The solid red line with positive slope is a linear fit to these expected values of and represents the expected phase boundary between the HO and LMAFM phases for the URu2-xOsxSi2 system.
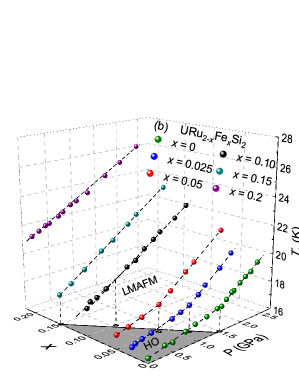
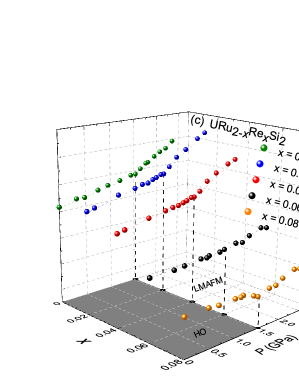
Other than pure URu2Si2, Fe-substituted URu2Si2, and Os-substituted URu2Si2, the only known URu2Si2-based system measured under pressure is Re-substituted URu2Si2.Jeffries et al. (2007) At ambient pressure, the effect of Re substitution is to rapidly suppress HO toward an emergent itinerant ferromagnetic phase. Interestingly, as pressure is applied to samples from the URu2-xRexSi2 system, the HO phase is enhanced toward the same HOLMAFM phase transition. However, as the Re concentration is increased in URu2-xRexSi2 under pressure, the “kink” in the vs. “composite” phase diagram persists at a critical pressure of = 1.5 GPa. This difference is emphasized in Fig. 7 which displays –– phase diagrams for each of the URu2-xOsxSi2, URu2-xFexSi2 and URu2-xRexSi2 systems. The data for the URu2-xRexSi2 system was taken from Ref. Jeffries et al., 2007. (Due to the fact that the HO transition temperature is suppressed with increasing Re concentration, the values along the concentration () axis in Fig. 7(c) have been reversed for clarity.) Note the difference in the HO/LMAFM phase boundary in the – plane for the Re-substituted system in Fig. 7(c). The HO/LMAFM phase boundary is constant at = 1.5 GPa for all Re concentrations up to = 0.08 in URu2-xRexSi2, while the boundary is suppressed to = 0 GPa as is increased in the URu2-xFexSi2 and URu2-xOsxSi2 systems.
IV Discussion
Investigations of URu2Si2 under applied uniaxial and/or hydrostatic pressure show that an increase in pressure enhances HO (with an increase in ) and drives the system toward a pressure-induced antiferromagnetic phase (LMAFM) at a critical pressure of 1.5 GPa at the bicritical point (or at 0.5 GPa as 0).Amitsuka et al. (1999); Matsuda et al. (2001); Nakashima et al. (2003); Jeffries et al. (2007); Villaume et al. (2008); Butch et al. (2010); Niklowitz et al. (2010); Bourdarot et al. (2011); Kambe et al. (2013); Williams et al. (2017) Recently, a related investigation of Fe-substituted URu2Si2 under applied pressure established a quantitative equivalence between positive chemical pressure to external pressure in affecting the phase behavior in URu2Si2.Wolowiec et al. (2016) The equivalence between and is reflected in the consistent “additive” relationship + 1.5 GPa, where the critical pressure necessary to drive the HOLMAFM phase transition in URu2-xFexSi2 decreases with increasing Fe concentration . The relevance of pressure- and chemical-induced changes to the lattice and how they relate to hybridization between - and -electron states is discussed in more detail below.
The results presented here for the effect of increasing Os concentration on the enhancement of HO in URu2-xOsxSi2, as well as the reduction of the critical pressure that induces the HOLMAFM transition, are remarkably similar to the phase behavior reported for Fe-substituted URu2Si2.Wolowiec et al. (2016) However, the isoelectronic substitutions of Fe and Os have contrasting effects on the body-centered-tetragonal (bct) lattice. Substitution of smaller Fe ions at the Ru site leads to a contracted lattice and a positive chemical pressure in URu2-xFexSi2, while substitution of larger Os ions at the Ru site leads to an expanded lattice and a negative chemical pressure in URu2-xOsxSi2 (The effect of Os substitution on the lattice is given in Sec. VI.) This complicates the view of a reduction in the unit-cell volume through applied or chemical pressure as a necessary condition for the enhancement of HO in URu2Si2.
Here we suggest an increase in the hybridization of the uranium 5-electron states and transition metal -electron states as the cause for the enhancement of HO toward the HOLMAFM phase transition in URu2Si2. High-resolution angle-resolved photoemission spectroscopy (ARPES) and scanning-tunneling microscropy (STM) measurements show directly that the HO phase emerges from a paramagnetic (PM) Kondo phase that has clear signatures of hybridization (i.e., Kondo screening) between the localized 5- and itinerant -electron states, with the onset of hybridization forming at a coherence temperature 70 K.Santander-Syro et al. (2009); Yoshida et al. (2010); Schmidt et al. (2010); Aynajian et al. (2010); Boariu et al. (2013) At lower temperatures close to the HO transition temperature , there is an increase in the 5--electron hybridization leading to a Fermi surface instability as more U-5 electrons dissolve into the FS.Santander-Syro et al. (2009); Yoshida et al. (2010); Schmidt et al. (2010); Aynajian et al. (2010); Boariu et al. (2013); Chatterjee et al. (2013); Meng et al. (2013); Frantzeskakis et al. The degenerate crossing of hybridized 5- bands at the Fermi energy create density of states “hot spots” or instabilities at the Fermi surface in the PM phase.Elgazzar et al. (2009); Oppeneer et al. (2010) Hence, small perturbations to the electronic structure in the PM phase may lift the degeneracy and remove the FS instability leading to the opening of a “hybridization gap” over roughly 70% of the FS in the HO and LMAFM phases and a “re-hybridization” of the 5- and -electron states. Such a topological reconstruction of the FS is observed during the second-order symmetry-breaking transition (or Lifshitz transition) from the PM phase to the HO (or LMAFM) phase.
In this report, we suggest that when URu2Si2 is tuned with pressure or with either of the isoelectronic substitutions of Fe or Os at the Ru site, subtle changes occur to the 5--electron hybridization near the Fermi level which favor the stability of the gapped FS of the HO (or LMAFM) phase over the instability of the FS in the Kondo-like PM phase. As a result, there is an observed increase in the transition temperature with increasing pressure or substituent concentration . This applies to the observed increase in for the PMLMAFM phase transition, during which the FS undergoes a similar reconstruction and gapping. Inelastic neutron scattering experiments performed on single crystals from the URu2-xFexSi2 system reveal similar interband correlations where enhanced local-itinerant electron hybridization also leads to the stability of the LMAFM phase.Butch et al. (2016) Below, we address the manner in which each of the three perturbations (pressure, Fe substitution, and Os substitution) independently favors the hybridization of the U-5- and -electron states. Hence, the additivity of and in enhancing HO and inducing the LMAFM phase in both the URu2-xFexSi2 and URu2-xOsxSi2 systems is also explained.
PRESSURE: Application of uniaxial and hydrostatic pressure both reveal that the pressure dependence of the HO transition temperature is anisotropic with respect to changes in the and lattice parameters of the tetragonal crystal. The lattice parameter (or the shortest U-U separation in the basal plane of the tetragonal lattice) appears to be important in affecting the magnetic properties of URu2Si2, as well as the transition to the LMAFM phase.Bourdarot et al. (2011); Kambe et al. (2013) Furthermore, it has been shown that it is not possible to induce the HOLMAFM phase transition with uniaxial stress along the axis.Bourdarot et al. (2011) Nor does the ratio of lattice parameters / appear to be important in governing the salient magnetic properties and phase behavior of URu2Si2.Bourdarot et al. (2011) These pressure-induced changes to the lattice are closely connected to spatial and energetic changes that may occur to the -, -, -, and -electronic orbitals. It is well known that the application of pressure reduces the interatomic distance within a crystal lattice leading to the delocalization and overlapping of electronic orbitals.Drickamer (1965); Drickamer and Frank (1973); Schilling (1979, 1981) As a consequence, applied pressure can lead to an increase in the hybridization between - and -electron states,Maple et al. (1969); Kim and Maple (1970); Maple (1976) which is important for the formation of the HO phase, and is now considered to be one of its defining characteristics.Santander-Syro et al. (2009); Chatterjee et al. (2013); Meng et al. (2013) Here, we suggest that the pressure-induced enhancement of hybridization in URu2Si2-based systems contributes to the instability at the FS that leads to the gapping of the FS and the second-order transition to the HO and LMAMF phases.
Fe-SUBSTITUTION: The remarkable agreement between and , and their effect on the HO and LMAFM phases is not a surprise, considering that Fe substitution results in an almost entirely uniaxial contraction along the parameter axis. Upon substitution of smaller Fe ions for Ru, it is suggested that the effective chemical pressure associated with the reduction in the interatomic spacing, favors increased overlap and hybridization of the U-5-electron states and -electron states in much the same way that applied pressure favors hybridization.Kanchanavatee et al. (2011); Wolowiec et al. (2016) Hence, the sum result for investigations of URu2Si2 under pressure and investigations of Fe substitution in URu2-xFexSi2 suggest that a contracted lattice in the direction of the axis is necessary for the enhancement of HO and a transition to LMAFM in URu2Si2.Kanchanavatee et al. (2011); Das et al. (2015); Wolowiec et al. (2016). In addition to the comparable effects of Fe substitution and pressure on the lattice, HO, and LMAFM, we discuss below the binding energy of the Fe-4 electrons as a relevant factor for the increase in 5- and -electron hybridization.
Os-SUBSTITUTION: In contrast, the effective “negative” chemical pressure associated with an expanded crystal lattice upon substitution of larger Os ions for Ru should not favor hybridization of the U-5- and -electron states in URu2-xOsxSi2. However, an increase in the hybridization may still occur if one considers one or both of the following: (1) The larger spatial extent of the 5-electron orbitals in osmium compared to that of the 4-electron orbitals in ruthenium where the change in the radius of the -electron wave functions is 0.639 Å for Ru ions to 0.706 Å for Os ions.Mann (1973); McLean and McLean (1981) In the tight-binding approximation, the overlap for a pair of orbitals is dominated by an exponential term which decays on a length scale given by the inverse sum of the radii of the two electronic orbitals.Papaconstantopoulos and Mehl (2003); Durgavich et al. (2016); Papaconstantopoulos (2015) The increase in the radius of the -electron wave functions when an Os ion replaces a Ru ion is significant and would considerably effect the overlap of the -electron wave functions and U-5-electron wave functions. (2) The stronger spin-orbit coupling that occurs in Os compared to that of Ru may lead to a broadening of the -electron energy bands and an increase in the number of electrons at the Fermi level.Oppeneer et al. (2010)
Calculations of - and -electron hybridization in USi2 with = (Fe, Ru, and Os)
In an effort to further understand the hybridization between the U 5-electron states and the transition metal -electron states in the USi2 series with = (Fe, Ru, and Os), we performed tight-binding calculations of the overlap of the U-5-electron states and -electron states of the Fe, Ru, and Os ions.
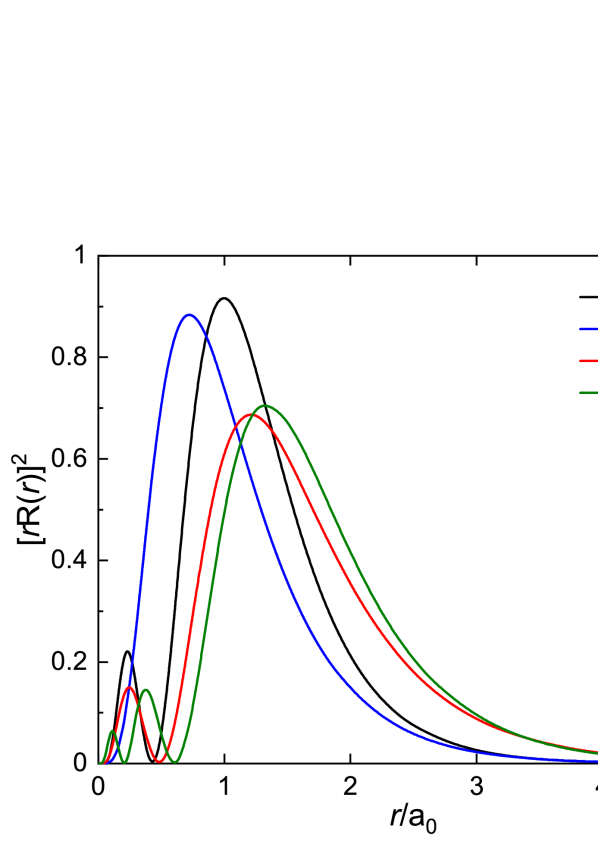
Preliminary calculations of Hartree-Fock wave-functions were made for the U-5-electron states, the partially-filled -electron shells of the transition metal ions Fe, Ru, and Os, as well as the 3-electron states of Si and 4-electron states of Ge. The radial probability distributions for the - and -electron states are displayed in Fig. 8. Relative to the 4-electron states of Ru, the 3-electron states of Fe are more localized, whereas the 5-electron states of Os are slightly more spatially extended.
Additionally, the Hartree-Fock binding energies for the - and -electron orbitals in U, Fe, Ru, and Os were calculated and are summarized in Table 1. Note that there is a non-monotonic trend in the binding energy for the transition metal ions (Fe, Ru, and Os) moving down the column in the periodic table with = 1.2157, 0.80244, and 1.0095 for the Fe 3, Ru 4, and Os 5 states, respectively. The anomalous electronic configuration of atomic Ru sets its binding energy much lower than that of the -electrons of Fe, Os. The binding energy of Ru is also much lower than that of the -electrons of U where = 1.2689 for U 5 state.
Element
Binding energy (Ry)
U 5
1.2689
Fe 3
1.2157
Ru 4
0.8024
Os 5
1.0096
Tight-binding energy matrix elements were calculated to determine the degree of overlap of the U-5-electron states with the Fe, Ru, and Os -electron states for atomic sites separated by a distance . Hybridization energies were estimated from the matrix elements and from the calculated Hartree-Fock binding energies for the U, Fe, Ru, and Os ions in URu2-xSi2 with = (Fe, Os) according to the expression:
| (1) |
where = 1.2689 is the binding energy for the U 5 state and = 1.2157, 0.8024, and 1.0095 are the binding energies for the Fe 3, Ru 4, and Os 5 states, respectively (see Table 1).
Table 2 contains the hybridization energies as a measure of the degree of hybridization between the U 5-electron states and the -electron states of Fe, Ru, and Os. The hybridization energies are smallest for the hybridization of Ru -electrons, which suggests a diminished hybridization for the electrons of the Ru ions compared to those of the Fe and Os ions. Hybridization of the Os -electron states with the U 5-electron states is largest, being only slightly larger than that of the Fe -electron states. This ordering of for Fe, Ru, and Os is attributed to both the increasing spatial extent of the -electron wave function down the column of the periodic table (Fig. 8) and also the non-monotonic variation in excitation energy (or binding energy). However, the non-monotonic variation in binding energy is the dominant effect, where the binding energy of the Ru -electrons is much lower than that of the Fe and Os -electrons and also the -electrons of U (see Table 1).
Similar trends in 4--electron hybridization are reported for the heavy-Fermion and Kondo-like systems of CeFe2Si2, CeRu2Si2, and CeRu2-xOsxSi2, where the strength of the hybridization of the Ce-4 electrons and the , , and conduction electrons can be characterized by the Kondo temperature .Regnault et al. (1988) CeFe2Si2 has a large Kondo temperature 103 K,Koterlyn et al. (2007) while the Kondo temperature for CeRu2Si2 is 10 to 25 K.Besnus et al. (1985); Umarji et al. (1986); Kitaoka et al. (1986); Regnault et al. (1988) As small amounts of Os are introduced into CeRu2-xOsxSi2, the Kondo temperature increases to 102 K for = 0.1.Umarji et al. (1986); Godart et al. (1986) These changes in the hybridization of the Ce-4 and , , and electrons across the CeFe2Si2, CeRu2Si2, and CeRu2-xOsxSi2 systems appear to be consistent with the changes in the 5--electron hybridization in other reports Amorese et al. (2020) and with our calculations across the USi2 series with = (Fe, Ru, and Os).
Fe (Ry)
Ru (Ry)
Os (Ry)
0.081
0.034
0.097
0.058
0.025
0.064
0.050
0.021
0.055
0.079
0.033
0.087
0.039
0.018
0.047
0.039
0.018
0.047
0.067
0.028
0.084
Hence, the enhancement of the HO phase in URu2-xOsxSi2 with increasing Os concentration is consistent with the greater degree of - and -electron hybridization as calculated for the Os ions. Similar reasoning may also explain the enhancement of HO in the case of URu2Si2 under applied pressure and the case of URu2-xFexSi2 with increasing Fe concentration . The reduction of the critical pressure , and the cooperative effects of and observed in URu2-xOsxSi2, may follow from the nature in which both the perturbations of and work together to foster hybridization: applied pressure favors delocalization of the U-5 electrons and the substitution of Os ions for Ru extends the electrons outward within the unit cell. Both of these effects together would favor overlap between the U-5- and -electron wave functions in URu2-xOsxSi2.
The increase in spin-orbit coupling may also help with hybridization of the U-5- and Os-5-electron states on account of the splitting of the -electron band, which brings the orbitals closer together in energy and slightly enhances the hybridization between the two orbital levels with = , where for U and for Os. The increase in hybridization between the U-5-electron states and the transition metal -electron states, caused by the larger spin-orbit coupling of Os, is estimated to be limited and less than 2 %.Papaconstantopoulos (2015)
The persistence of the critical pressure at = 1.5 GPa, with increasing rhenium (Re) concentration in URu2-xRexSi2, suggests that any doping which suppresses HO may not be “additive” with pressure, and, as such, is not a perturbation that favors hybridization. Indeed, for small Re concentration ( 0.1) in URu2-xRexSi2, the hidden order transition is rapidly reduced and for higher Re concentrations ( 0.1), the system enters a ferromagnetic state rather than the LMAFM phase.
Based on our hybridization calculations and previous reports of the trends in 5--electron hybridization for the 3-, 4-, and 5-electron orbitals, one might expect the same qualitative increase in hybridization (relative to the Ru4 electrons) for the Re-5-electron states as observed for the Os-5-electron states. However, the trends in 5--electron hybridization reported here for USi2 ( = Fe, Ru, and Os) and elsewhere for CeSi2 ( = Fe, Ru, and Os)Besnus et al. (1985); Umarji et al. (1986); Kitaoka et al. (1986); Godart et al. (1986); Regnault et al. (1988) are for systems that are isoelectronic. For these systems, there is little or no variation across the series in the number of -band electrons near the Fermi energy that are available for hybridization. The degree of --electron hybridization is largely dependent on the density of states at the Fermi level such that any significant variation in the number of electrons near would have an effect on the hybridization. Dalichaouch et al. (1990a); Amorese et al. (2020) Furthermore, substitutions for Ru such as Rh and Re that are effectively electron (or hole) doping would shift the Fermi energy away from the degenerate crossing of the hybridized bands thereby stabilizing the FS in the paramagnetic phase. In addition, any doping resulting from non-isoelectronic substitutions might also change the underlying band structure and shape of the FS, which experimentally is shown to disrupt HO and replace it with an un-ordered state.Oh et al. (2007); Jo et al. (2007)
Hence, there are competing effects on hybridization in moving from Ru to Re, where any increase in hybridization owing to the spatially extended character of Re-5 electrons is mitigated by the reduction in the number of electrons available near for hybridization and other deleterious effects to the FS. The orbital electronic configuration is 5 for Re compared to 5 for Os. In the case of Re substitution, the decrease in the density of -band electrons (or increase in hole concentration) may inhibit the 5--electron hybridization that is observed to increase in the case of Os substitution. In addition, the degree of hybridization between U-5 electrons and Re-5 electrons depends not only on the hybridization matrix elements but also largely on the binding energy of the Re-5 electrons (see Equation 1). Hence, a comparison of hybridization across systems that are not isoelectronic is more complicated and it is not unreasonable to assume that hybridization in the case of Re substitution would not increase as observed for the case of Os substitution. For systems in which the HO phase is suppressed with increasing substituent , as in Re-substituted URu2Si2, a determination of the hybridization between the U-5 and Re-5 electrons as a function of concentration should be investigated further.
V Conclusions
Early specific heat measurements of URu2Si2 in 1985 revealed an anomalous feature at = 17.5 K, reminiscent of a continuous mean-field type of phase transition.Maple et al. (1986) The use of a simple model for the analysis of the specific heat anomaly led to the notion of a partial gapping of the Fermi surface as the compound entered the hidden order (HO) phase, with the magnitude of the gap determined to be 11 meV.Maple et al. (1986) This simple yet powerful experimental technique was one of the first “probes” into the structure or “reconstruction” of the Fermi surface during the HO phase transition in URu2Si2. Over the last 20 years, advanced experimental techniques have yielded direct evidence and provided confirmation of the partial gapping of the Fermi surface, with gap values of 10 meV. We now have a detailed picture of the electronic structure in proximity to the hidden order transition at , whereby the onset of hybridization of 5 and electrons at 70 K leads to a degenerate crossing of 5--hybridized bands at the Fermi level and ultimately to an instability, reconstruction, and partial gapping of the Fermi surface at 17.5 K.
Currently, applied pressure, and the substitution of Fe and Os ions for Ru, are the only known perturbations to URu2Si2 that result in an enhancement of HO and a subsequent first-order transition to the LMAFM phase. Here, we explain the enhancement of HO as the result of an increase in the hybridization of the uranium 5- and transition metal (Fe, Ru, Os) -electron states, which leads to a Fermi surface instability that favors the HO phase over the PM phase. This causes the increase in the PMHO transition temperature .
The results from transport measurements for single crystals of URu2-xOsxSi2 under pressure presented here are used to construct the (, ) phase behavior. As the concentration of Os is increased, there is both an observed increase in and a reduction in the critical pressure necessary to induce the transition to the LMAFM phase. This is consistent with previously reported effects of applied pressure and Fe substitution on HO and in single crystals of URu2-xFexSi2. However, the expansion of the lattice with increasing Os concentration is anomalous in comparison to the lattice contraction observed in URu2Si2 with increasing pressure and in URu2-xFexSi2 with increasing Fe substitution.
Hence, the increase in the 5- and -electron hybridization appears to be dependent on various effects, both spatial and energetic. The contraction of the lattice with pressure or chemical pressure tends to favor both the overlap and hybridization of electronic orbitals, whereas the spatially extended -electron orbitals (as with Os 5 electrons) can also lead to an increase in their hybridization with the “localized” 5 electrons. In this report, results of tight-binding calculations show that the degree of hybridization between the U 5 electrons with the transition metal electrons is largely dependent on the difference in binding energy between the “localized ” 5 electrons and -band electrons. In general, it is noted that the trend in hybridization increases in moving away from the Ru 4 electrons to the Fe 3 and Os 5 electrons. This is true for other isoelectronic systems such as CeSi2 ( = Fe, Ru, and Os).
VI Appendix: Sample Quality
There are some differences among the single crystal samples in the temperature dependence of the electrical resistivity at ambient pressure at the PMHO/LMAFM transition (see Fig. 1). The features at the transition temperature are relatively sharp for the = 0, 0.07, 0.08, and 0.16 samples, whereas for = 0.15, 0.18, and 0.28 samples, the transition at is broadened. These differences in the behavior warrant some clarification and additional comments regarding the quality of the single crystal samples. We note that there will be some unavoidable and intrinsic broadening of the transition for larger concentrations of osmium. This type of broadening is also seen in the polycrystal data for Os concentrations larger than = 0.2 previously reported in Ref. Kanchanavatee et al., 2014 and also in other work reported in Ref. Hall et al., 2015, in which the feature in the data at is nearly non-existent for the = 0.1 sample. The broadening of the transition at may be attributed to inhomogeneity that arises when single crystals are grown out of melts in a tetra-arc furnace by the Czochralski method. As larger concentrations of Os are introduced into the melt, there is a larger chance of the occurrence of inhomogeneity across the sample.
The broadening of the transition at also occurs with increasing pressure. From the data displayed in Fig. 3(a), the degree of broadening appears to be monotonic with increasing pressure. This type of pressure-induced broadening of the PMHO transition has been previously reported for polycrystalline URu2Si2 (see Fig. 1 in Ref. McElfresh et al., 1987), where the broadening of the feature at may be associated with “different states of strain within the polycrystalline sample”.McElfresh et al. (1987) Similar broadening of the HO transition occurred in single crystals of URu2Si2 ( = 0) under applied hydrostatic pressure (see Ref. Jeffries et al., 2007). Broadening of the transition at is also seen in single crystal samples of URu2-xFexSi2 as a function of increasing Fe concentration (see Ref. Wolowiec et al., 2016). Hence, the broadening of the transition observed in the single crystal samples of URu2-xOsxSi2 with = 0.18 and 0.28 (see Fig. 1) is not to be unexpected. However, the broadening in the = 0.15 sample is somewhat anomalous and needs some clarification.
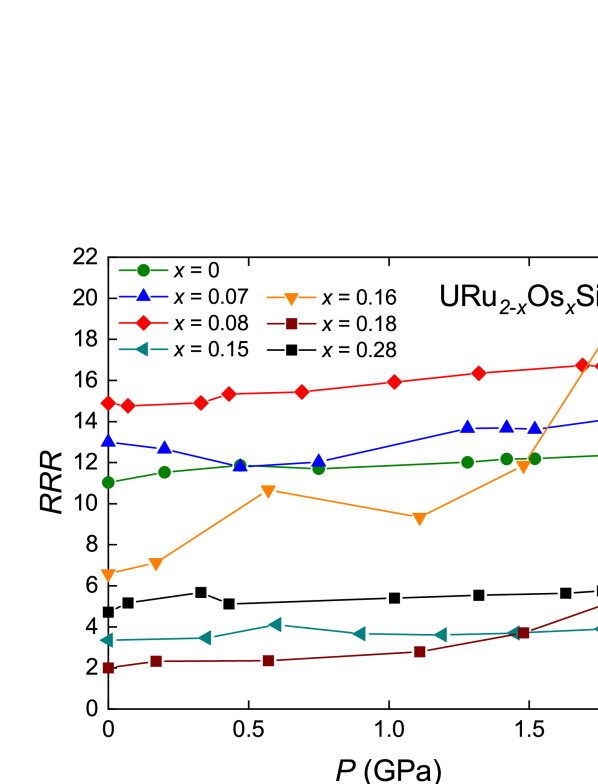
As a measure of sample quality, we determined the residual resistivity ratio (RRR), defined as , for each of the single crystal samples. Values of RRR as a function of pressure are displayed in Fig. 9 for single crystal samples with Os concentration = 0, 0.07, 0.08, 0.15, 0.16, 0.18, 0.28. Note that for all samples, RRR increases with , which is likely due to the improvement in the contact resistance between the leads and the sample as pressure is increased. At ambient pressure, the values of RRR are larger than 10 for those samples with lower Os concentration ( = 0, 0.07, 0.08). In comparison, significantly lower values of RRR = 3.3, 2, and 4.7 for the = 0.15, 0.18, and 0.28 samples suggest more inhomogeneity or the presence of impurity-induced electron scattering, which is likely to cause some broadening of the feature at the transition temperature .
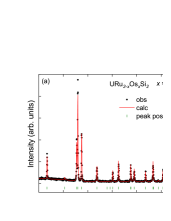
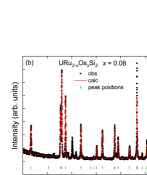
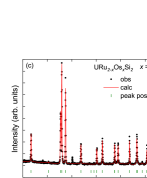
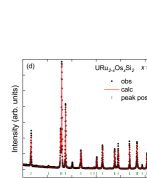
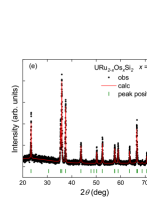
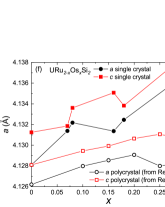
X-ray diffraction (XRD) patterns for single crystal samples of URu2-xOsxSi2 with Os concentrations = 0.07, 0.08, 0.16, 0.18, 0.28 are shown in Fig. 10(a)–(e). The black circles represent the data, the red line represents the fit results from Rietveld refinement to the data, and the green ticks indicate peak positions for the URu2Si2 crystal. The peaks in the data at 2 = 40∘ for = 0.08 in panel (b), = 0.16 in panel (c), and = 0.18 in panel (d) are Os impurities. The results from the fits of the Rietveld refinement to the XRD data were used to determine the lattice constants and for single crystal samples of URu2-xOsxSi2 with = 0.07, 0.08, 0.16, 0.18, 0.28. The lattice constants and for single crystals (filled symbols) as well as for polycrystalline samples (open symbols) are plotted in Fig. 10(f) as a function of osmium concentration up to = 0.3. (The polycrystal data was taken from Ref. Kanchanavatee et al., 2014.) For the single crystal samples, both lattice constants and are shown to increase by approximately 0.2% as Os concentration is increased in URu2-xOsxSi2. For the single crystal samples, there is some degree of scatter in the expansion of both and between = 0.08 and 0.18, which may be related to the presence of Os impurity peaks detected in the XRD patterns for the = 0.08, 0.16, and 0.18 samples (see Fig. 10).
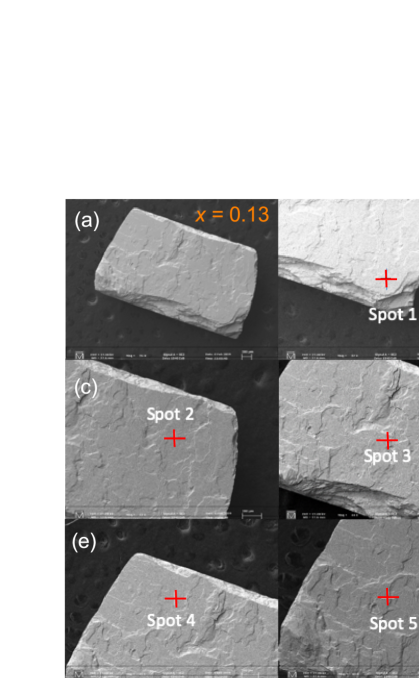
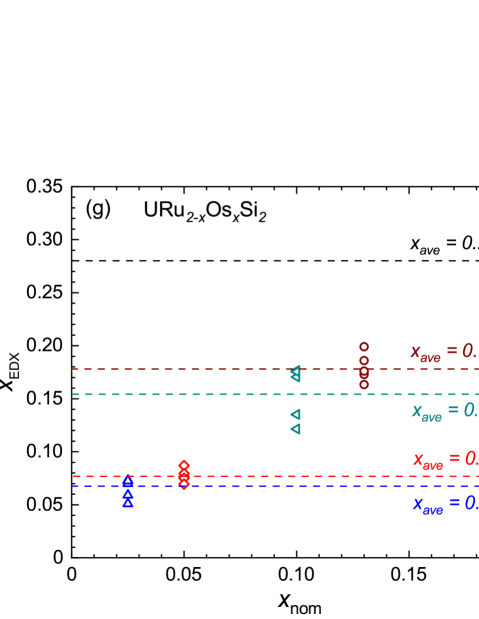
Single crystal samples of URu2-xOsxSi2 at nominal concentrations of = 0.025, 0.05, 0.10, 0.13, and 0.20 were measured for elemental composition using energy-dispersive X-ray spectroscopy (EDX). For each of these samples, EDX measurements were made at five different spots across the surface of the sample. As a representative example, an image of a sample from the = 0.13 single crystal is shown in Fig. 11(a) and the locations of the five different EDX measurement spots for this sample are shown in the images displayed in Fig. 11(b)–(f). The results of the EDX measurements for these samples are shown in Fig. 11(g), where the Os concentrations () determined from the five different EDX measurements on each sample are plotted (open symbols) versus the nominal Os concentration (). The horizontal dashed lines represent the average Os concentration of the five different EDX measurements for each sample, where is taken to be the actual osmium concentration for these single crystal samples. Based on the EDX measurements, the single crystal samples of URu2-xOsxSi2 with nominal concentrations of = 0.025, 0.05, 0.10, 0.13, and 0.20 were determined to have actual concentrations of = 0.07, 0.08, 0.15, 0.18, and 0.28, respectively. The error in the Os concentration for each sample is taken as the standard deviation of the five values and is represented by the error bars in the – phase diagram shown in Fig. 2. Note that for samples with larger concentrations of Os , there is an increase in the error of suggesting that the inhomogeneity across the sample increases as increases. For the sample that was unavailable for EDX measurement, with nominal Os concentration of = 0.16, the error in the Os concentration was taken as the average of the error for the samples with comparable Os concentration, namely = 0.15, 0.18, and 0.28.
Acknowledgements
Research at the University of California, San Diego was supported by the US Department of Energy (DOE), Office of Basic Energy Sciences, Division of Materials Sciences and Engineering, under Grant DE-FG02-04ER46105 (materials synthesis and characterization), the US National Science Foundation (NSF) under Grant DMR 1810310 (low-temperature measurements), and the National Nuclear Security Administration under the Stewardship Science Academic Alliance Program through the US DOE under Grant DE-NA0002909 (high-pressure measurements). Research at the National High Magnetic Field Laboratory (NHMFL) was supported by NSF Cooperative Agreement DMR-1157490, the State of Florida, and the DOE.
References
- Palstra et al. (1985) T. T. M. Palstra, A. A. Menovsky, J. van den Berg, A. J. Dirkmaat, P. H. Kes, G. J. Nieuwenhuys, and J. A. Mydosh, “Superconducting and Magnetic Transitions in the Heavy-Fermion System URu2Si2,” Phys. Rev. Lett. 55, 2727 (1985).
- Maple et al. (1986) M. B. Maple, J. W. Chen, Y. Dalichaouch, T. Kohara, C. Rossel, M. S. Torikachvili, M. W. McElfresh, and J. D. Thompson, “Partially Gapped Fermi Surface in the Heavy-Electron Superconductor URu2Si2,” Phys. Rev. Lett. 56, 185 (1986).
- Schlabitz et al. (1986) W. Schlabitz, J. Baumann, B. Pollit, U. Rauchschwalbe, H. M. Mayer, U. Ahlheim, and C. D. Bredl, “Superconductivity and Magnetic Order in a Strongly Interacting Fermi-System: URu2Si2,” Z. Phys. B - Condensed Matter 62, 171 (1986).
- Broholm et al. (1987) C. Broholm, J. K. Kjems, W. J. L. Buyers, P. Matthews, T. T. M. Palstra, A. A. Menovsky, and J. A. Mydosh, “Magnetic Excitations and Ordering in the Heavy-Electron Superconductor URu2Si2,” Phys. Rev. Lett. 58, 1467–1470 (1987).
- Schoenes et al. (1987) J. Schoenes, C. Schönenberger, J. J. M. Franse, and A. A. Menovsky, “Hall-effect and resistivity study of the heavy-fermion system URu2Si2,” Phys. Rev. B 35, 5375–5378 (1987).
- McElfresh et al. (1987) M. W. McElfresh, J. D. Thompson, J. O. Willis, M. B. Maple, T. Kohara, and M. S. Torikachvili, “Effect of pressure on competing electronic correlations in the heavy-electron system URu2Si2,” Phys. Rev. B 35, 43–47 (1987).
- Dawson et al. (1989) A. LeR Dawson, W. R. Datars, J. D. Garrett, and F. S. Razavi, “Electrical transport in uru2si2,” Journal of Physics: Condensed Matter 1, 6817 (1989).
- Mason and Buyers (1991) T. E. Mason and W. J. L. Buyers, “Spin excitations and the electronic specific heat of URu2Si2,” Phys. Rev. B 43, 11471 (1991).
- Broholm et al. (1991) C. Broholm, H. Lin, P. T. Matthews, T. E. Mason, W. J. L. Buyers, M. F. Collins, A. A. Menovsky, J. A. Mydosh, and J. K. Kjems, “Magnetic excitations in the heavy-fermion superconductor URu2Si2,” Phys. Rev. B 43, 12809 (1991).
- Santini and Amoretti (1994) P. Santini and G. Amoretti, “Crystal Field Model of the Magnetic Properties of URu2Si2,” Phys. Rev. Lett. 73, 1027 (1994).
- Buyers et al. (1994) W. J. L. Buyers, Z. Tun, T. Petersen, T.E. Mason, J.-G. Lussier, B.D. Gaulin, and A. A. Menovsky, “Spin wave collapse and incommensurate fluctuations in URu2Si2,” Physica B: Condensed Matter 199-200, 95 (1994).
- Escudero et al. (1994) R. Escudero, F. Morales, and P. Lejay, “Temperature dependence of the antiferromagnetic state in URu2Si2 by point-contact spectroscopy,” Phys. Rev. B 49, 15271 (1994).
- Amitsuka et al. (1999) H. Amitsuka, M. Sato, N. Metoki, M. Yokoyama, K. Kuwahara, T. Sakakibara, H. Morimoto, S. Kawarazaki, Y. Miyako, and J. A. Mydosh, “Effect of Pressure on Tiny Antiferromagnetic Moment in the Heavy-Electron Compound URu2Si2,” Phys. Rev. Lett. 83, 5114–5117 (1999).
- Chandra et al. (2002) P. Chandra, P. Coleman, J. A. Mydosh, and V. Tripathi, “Hidden orbital order in the heavy fermion metal URu2Si2,” Nature 417, 831 (2002).
- Bourdarot et al. (2003) F. Bourdarot, B. Fåk, K. Habicht, and K. Prokeš, “Inflection Point in the Magnetic Field Dependence of the Ordered Moment of URu2Si2 Observed by Neutron Scattering in Fields up to 17 T,” Phys. Rev. Lett. 90, 067203 (2003).
- Wiebe et al. (2004) C. R. Wiebe, G. M. Luke, Z. Yamani, A. A. Menovsky, and W. J. L. Buyers, “Search for hidden orbital currents and observation of an activated ring of magnetic scattering in the heavy fermion superconductor URu2Si2,” Phys. Rev. B 69, 132418 (2004).
- Behnia et al. (2005) K. Behnia, R. Bel, Y. Kasahara, Y. Nakajima, H. Jin, H. Aubin, K. Izawa, Y. Matsuda, J. Flouquet, Y. Haga, Y. Ōnuki, and P. Lejay, “Thermal Transport in the Hidden-Order State of URu2Si2,” Phys. Rev. Lett. 94, 156405 (2005).
- Jeffries et al. (2007) J. R. Jeffries, N. P. Butch, B. T. Yukich, and M. B. Maple, “Competing Ordered Phases in : Hydrostatic Pressure and Rhenium Substitution,” Phys. Rev. Lett. 99, 217207 (2007).
- Wiebe et al. (2007) C. R. Wiebe, J. A. Janik, G. J. MacDougall, G. M. Luke, J. D. Garrett, H. D. Zhou, Y.-J. Jo, L. Balicas, Y. Qiu, J. R. D. Copley, Z. Yamani, and W. J. L. Buyers, “Gapped itinerant spin excitations account for missing entropy in the hidden-order state of URu2Si2,” Nat. Phys 3, 96 (2007).
- Elgazzar et al. (2009) S. Elgazzar, J. Rusz, M. Amft, P. M. Oppeneer, and J. A. Mydosh, “Hidden order in URu2Si2 orginates from Fermi surface gapping induced by dynamic symmetry breaking,” Nat. Mat 8, 337 (2009).
- Janik et al. (2009) J. A. Janik, H. D. Zhou, Y. J. Jo, L. Balicas, G. J. MacDougall, G. M. Luke, J. D. Garrett, K. J. McClellan, E. D. Bauer, J. L. Sarrao, Y. Qiu, J. R. D Copley, Z. Yamani, W. J. L. Buyers, and C. R. Wiebe, “Itinerant spin excitations near the hidden order transition in URu2Si2,” Journal of Physics: Condensed Matter 21, 192202 (2009).
- Santander-Syro et al. (2009) Andrés F. Santander-Syro, Markus Klein, Florin L. Boariu, Andreas Nuber, Pascal Lejay, and Friedrich Reinert, “Fermi-surface instability at the ‘hidden-order’ transition of URu2Si2,” Nat. Phys. 5, 637 (2009).
- Haule and Kotliar (2010) K. Haule and G. Kotliar, “Complex Landau-Ginzburg theory of the hidden order in URu2Si2,” EPL (Europhysics Letters) 89, 57006 (2010).
- Yoshida et al. (2010) Rikiya Yoshida, Yoshiaki Nakamura, Masaki Fukui, Yoshinori Haga, Etsuji Yamamoto, Yoshichika Ōnuki, Mario Okawa, Shik Shin, Masaaki Hirai, Yuji Muraoka, and Takayoshi Yokoya, “Signature of hidden order and evidence for periodicity modification in URu2Si2,” Phys. Rev. B 82, 205108 (2010).
- Schmidt et al. (2010) A. R. Schmidt, M. H. Hamidian, P. Wahl, F. Meier, A. V. Balatsky, J. D. Garrett, T. J. Williams, G. M. Luke, and J. C. Davis, “Imaging the Fano lattice to ‘hidden order’ transition in URu2Si2,” Nature 465, 570 (2010).
- Aynajian et al. (2010) Pegor Aynajian, Eduardo H. da Silva Neto, Colin V. Parker, Yingkai Huang, Abhay Pasupathy, John Mydosh, and Ali Yazdani, “Visualizing the formation of the Kondo lattice and the hidden order in ,” Proc. Nat. Acad. Sci. 107, 10383 (2010).
- Oppeneer et al. (2010) P. M. Oppeneer, J. Rusz, S. Elgazzar, M.-T. Suzuki, T. Durakiewicz, and J. A. Mydosh, “Electronic structure theory of the hidden-order material URu2Si2,” Phys. Rev. B 82, 205103 (2010).
- Oppeneer et al. (2011) P. M. Oppeneer, S. Elgazzar, J. Rusz, Q. Feng, T. Durakiewicz, and J. A. Mydosh, “Spin and orbital hybridization at specifically nested Fermi surfaces in URu2Si2,” Phys. Rev. B 84, 241102 (2011).
- Kawasaki et al. (2011) Ikuto Kawasaki, Shin-ichi Fujimori, Yukiharu Takeda, Tetsuo Okane, Akira Yasui, Yuji Saitoh, Hiroshi Yamagami, Yoshinori Haga, Etsuji Yamamoto, and Yoshichika Ōnuki, “Band structure and Fermi surface of URu2Si2 studied by soft x-ray angle-resolved photoemission spectroscopy,” Phys. Rev. B 83, 235121 (2011).
- Dakovski et al. (2011) Georgi L. Dakovski, Yinwan Li, Steve M. Gilbertson, George Rodriguez, Alexander V. Balatsky, Jian-Xin Zhu, Krzysztof Gofryk, Eric D. Bauer, Paul H. Tobash, Antoinette Taylor, John L. Sarrao, Peter M. Oppeneer, Peter S. Riseborough, John A. Mydosh, and Tomasz Durakiewicz, “Anomalous femtosecond quasiparticle dynamics of hidden order state in URu2Si2,” Phys. Rev. B 84, 161103 (2011).
- Dubi and Balatsky (2011) Yonatan Dubi and Alexander V. Balatsky, “Hybridization Wave as the “Hidden Order” in ,” Phys. Rev. Lett. 106, 086401 (2011).
- Haraldsen et al. (2011) J. T. Haraldsen, Y. Dubi, N. J. Curro, and A. V. Balatsky, “Hidden-order pseudogap in URu2Si2,” Phys. Rev. B 84, 214410 (2011).
- Pépin et al. (2011) C. Pépin, M. R. Norman, S. Burdin, and A. Ferraz, “Modulated Spin Liquid: A New Paradigm for URu2Si2,” Phys. Rev. Lett. 106, 106601 (2011).
- Riseborough et al. (2012) Peter S. Riseborough, B. Coqblin, and S. G. Magalhães, “Phase transition arising from the underscreened Anderson lattice model: A candidate concept for explaining hidden order in URu2Si2,” Phys. Rev. B 85, 165116 (2012).
- Mydosh and Oppeneer (2011) J. A. Mydosh and P. M. Oppeneer, “Colloquium : Hidden order, superconductivity, and magnetism: The unsolved case of URu2Si2,” Rev. Mod. Phys. 83, 1301–1322 (2011).
- Meng et al. (2013) J.-Q. Meng, P. M. Oppeneer, J. A. Mydosh, P. S. Riseborough, K. Gofryk, J. J. Joyce, E. D. Bauer, Y. Li, and T. Durakiewicz, “Imaging the Three-Dimensional Fermi-Surface Pairing near the Hidden-Order Transition in Using Angle-Resolved Photoemission Spectroscopy,” Phys. Rev. Lett. 111, 127002 (2013).
- Boariu et al. (2013) F. L. Boariu, C. Bareille, H. Schwab, A. Nuber, P. Lejay, T. Durakiewicz, F. Reinert, and A. F. Santander-Syro, “Momentum-Resolved Evolution of the Kondo Lattice into “Hidden Order” in URu2Si2,” Phys. Rev. Lett. 110, 156404 (2013).
- Bareille et al. (2009) C. Bareille, F. L. Boariu, H. Schwab, P. Lejay, F. Reinert, and A. F. Santander-Syro, “Momentum-resolved hidden-order gap reveals symmetry breaking and origin of entropy loss in URu2Si2,” Nat. Commun. 5, 637 (2009).
- Mydosh and Oppeneer (2014) J. A. Mydosh and P. M. Oppeneer, “Hidden order behaviour in URu2Si2 (A critical review of the status of hidden order in 2014),” Philos. Mag. 94, 3642–3662 (2014).
- Butch et al. (2015) Nicholas P. Butch, Michael E. Manley, Jason R. Jeffries, Marc Janoschek, Kevin Huang, M. B. Maple, Ayman H. Said, Bogdan M. Leu, and Jeffrey W. Lynn, “Symmetry and correlations underlying hidden order in URu2Si2,” Phys. Rev. B 91, 035128 (2015).
- Ran et al. (2016) Sheng Ran, Christian T. Wolowiec, Inho Jeon, Naveen Pouse, Noravee Kanchanavatee, Benjamin D. White, Kevin Huang, Dinesh Martien, Tyler DaPron, David Snow, Mark Williamsen, Stefano Spagna, Peter S. Riseborough, and M. Brian Maple, “Phase diagram and thermal expansion measurements on the system URu2-xFexSi2,” Proc. Nat. Acad. Sci. 113, 13348 (2016).
- Kung et al. (2016) H.-H. Kung, S. Ran, N. Kanchanavatee, V. Krapivin, A. Lee, J. A. Mydosh, K. Haule, M. B. Maple, and G. Blumberg, “Analogy Between the “Hidden Order” and the Orbital Antiferromagnetism in URu2-xFexSi2,” Phys. Rev. Lett. 117, 227601 (2016).
- Ran et al. (2017) Sheng Ran, Inho Jeon, Naveen Pouse, Alexander J. Breindel, Noravee Kanchanavatee, Kevin Huang, Andrew Gallagher, Kuan-Wen Chen, David Graf, Ryan E. Baumbach, John Singleton, and M. Brian Maple, “Phase diagram of URu2-xFexSi2 in high magnetic fields,” Proc. Nat. Acad. Sci. 114, 9826–9831 (2017).
- Dalichaouch et al. (1989) Y. Dalichaouch, M. B. Maple, M. S. Torikachvili, and A. L. Giorgi, “Ferromagnetic instability in the heavy-electron compound URu2Si2 doped with Re or Tc,” Phys. Rev. B 39, 2423 (1989).
- Dalichaouch et al. (1990a) Y. Dalichaouch, M. B. Maple, J. W. Chen, T. Kohara, C. Rossel, M. S. Torikachvili, and A. L. Giorgi, “Effect of transition-metal substitutions on competing electronic transitions in the heavy-electron compound URu2Si2,” Phys. Rev. B 41, 1829 (1990a).
- Dalichaouch et al. (1990b) Y. Dalichaouch, M. B. Maple, R. P. Guertin, M.V. Kuric, M. S. Torikachvili, and A. L. Giorgi, “Ferromagnetism and heavy electron behavior in URu2-xMxSi2(M = Re, Tc and Mn),” Physica B: Condensed Matter 163, 113 (1990b).
- Butch and Maple (2010) N. P. Butch and M. B. Maple, “The suppression of hidden order and the onset of ferromagnetism in URu2Si2 via Re substitution,” Journal of Physics: Condensed Matter 22, 164204 (2010).
- Yokoyama et al. (2004) Makoto Yokoyama, Hiroshi Amitsuka, Seiichiroh Itoh, Ikuto Kawasaki, Kenichi Tenya, and Hideki Yoshizawa, “Neutron Scattering Study on Competition between Hidden Order and Antiferromagnetism in U(Ru1-xRhx)2Si2 ( 0.05),” J. Phys. Soc. Japan 73, 545 (2004).
- Lopez de la Torre et al. (1992) A. Lopez de la Torre, P. Visani, Y. Dalichaouch, B. W. Lee, and M. B. Maple, “Th-doped URu2Si2: influence of Kondo holes on coexisting superconductivity and magnetism,” Physica B: Condensed Matter 179, 208 (1992).
- Park and Coles (1994) J. G. Park and B. R. Coles, “Studies of alloying effects on URu2(Si,X)2; X=Al or Ge,” Journal of Physics: Condensed Matter 6, 1425 (1994).
- Zwirner et al. (1997) S. Zwirner, J. C. Waerenborgh, F. Wastin, J. Rebizant, J. C. Spirlet, W. Potzel, and G. M. Kalvius, “Anisotropic magnetic coupling in NpxU1-xPd2Al3, NpxU1-xRu2Si2,” Physica B: Condensed Matter 230-232, 80 (1997), Proc. Intl. Conf. Strongly Correlated Electron Systems.
- Gallagher et al. (2016) A. Gallagher, K. W. Chen, C. M. Moir, S. K. Cary, F. Kametani, N. Kikugawa, D. Graf, T. E. Albrecht-Schmitt, S. C. Riggs, A. Shekhter, and R. E. Baumbach, “Unfolding the physics of URu2Si2 through silicon to phosphorus substitution,” Nature Comm. 7, 10712 (2016).
- Butch et al. (2010) N. P. Butch, J. R. Jeffries, S. Chi, J. B. Leão, J. W. Lynn, and M. B. Maple, “Antiferromagnetic critical pressure in URu2Si2 under hydrostatic conditions,” Phys. Rev. B 82, 060408 (2010).
- Jeffries et al. (2008) J. R. Jeffries, N. P. Butch, B. T. Yukich, and M. B. Maple, “The evolution of the ordered states of single-crystal URu2Si2 under pressure,” J. of Phys.: Condens. Matter 20, 095225 (2008).
- Bourdarot et al. (2004) F. Bourdarot, B. Fåk, V. P. Mineev, M. E. Zhitomirsky, N. Kernavanois, S. Raymond, F. Lapierre, P. Lejay, and J. Flouquet, “Pressure dependence of magnetic transitions in URu2Si2,” Physica B 350, E179 – E181 (2004), Proceedings of the Third European Conference on Neutron Scattering.
- Amitsuka et al. (2007) H. Amitsuka, K. Matsuda, I. Kawasaki, K. Tenya, M. Yokoyama, C. Sekine, N. Tateiwa, T.C. Kobayashi, S. Kawarazaki, and H. Yoshizawa, “Pressure-temperature phase diagram of the heavy-electron superconductor URu2Si2,” J. of Magn. and Magn. Mater. 310, 214 – 220 (2007).
- Kanchanavatee et al. (2011) N. Kanchanavatee, M. Janoschek, R. E. Baumbach, J. J. Hamlin, D. A. Zocco, K. Huang, and M. B. Maple, “Twofold enhancement of the hidden-order/large-moment antiferromagnetic phase boundary in the URu2-xFexSi2 system,” Phys. Rev. B 84, 245122 (2011).
- Das et al. (2015) P. Das, N. Kanchanavatee, J. S. Helton, K. Huang, R. E. Baumbach, E. D. Bauer, B. D. White, V. W. Burnett, M. B. Maple, J. W. Lynn, and M. Janoschek, “Chemical pressure tuning of via isoelectronic substitution of Ru with Fe,” Phys. Rev. B 91, 085122 (2015).
- Wolowiec et al. (2016) C. T. Wolowiec, N. Kanchanavatee, K. Huang, S. Ran, and M. B. Maple, “Evolution of critical pressure with increasing Fe substitution in the heavy-fermion system ,” Phys. Rev. B 94, 085145 (2016).
- Wilson et al. (2016) M. N. Wilson, T. J. Williams, Y.-P. Cai, A. M. Hallas, T. Medina, T. J. Munsie, S. C. Cheung, B. A. Frandsen, L. Liu, Y. J. Uemura, and G. M. Luke, “Antiferromagnetism and hidden order in isoelectronic doping of URu2Si2,” Phys. Rev. B 93, 064402 (2016).
- Kanchanavatee et al. (2014) N. Kanchanavatee, B. D. White, V. W. Burnett, and M. B. Maple, “Enhancement of the hidden order/large moment antiferromagnetic transition temperature in the URu2-xOsxSi2 system,” Philos. Mag. 94, 3681 (2014).
- Hall et al. (2015) Jesse S. Hall, M. R. Movassagh, M. N. Wilson, G. M. Luke, N. Kanchanavatee, K. Huang, M. Janoschek, M. B. Maple, and T. Timusk, “Electrodynamics of the antiferromagnetic phase in URu2Si2,” Phys. Rev. B 92, 195111 (2015).
- Denlinger et al. (2001) J.D Denlinger, G.-H Gweon, J.W Allen, C.G Olson, M.B Maple, J.L Sarrao, P.E Armstrong, Z Fisk, and H Yamagami, “Comparative study of the electronic structure of XRu2Si2: probing the Anderson lattice,” Journal of Electron Spectroscopy and Related Phenomena 117-118, 347 (2001), strongly correlated systems.
- Toby and Von Dreele (2013) Brian H. Toby and Robert B. Von Dreele, “GSAS-II: the genesis of a modern open-source all purpose crystallography software package,” Journal of Applied Crystallography 46, 544 (2013).
- Kambe et al. (2013) S. Kambe, D. Aoki, B. Salce, F. Bourdarot, D. Braithwaite, J. Flouquet, and J.-P. Brison, “Thermal expansion under uniaxial pressure in URu2Si2,” Phys. Rev. B 87, 115123 (2013).
- Fontes et al. (1999) M. B. Fontes, J. C. Trochez, B. Giordanengo, S. L. Bud’ko, D. R. Sanchez, E. M. Baggio-Saitovitch, and M. A. Continentino, “Electron-magnon interaction in ( Ho, Dy, Tb, and Gd) series of compounds based on magnetoresistance measurements,” Phys. Rev. B 60, 6781–6789 (1999).
- Matsuda et al. (2001) K. Matsuda, Y. Kohori, T. Kohara, K. Kuwahara, and H. Amitsuka, “Spatially Inhomogeneous Development of Antiferromagnetism in URu2Si2: Evidence from 29Si NMR under Pressure,” Phys. Rev. Lett. 87, 087203 (2001).
- Nakashima et al. (2003) M. Nakashima, H. Ohkuni, Y. Inada, R. Settai, Y. Haga, E. Yamamoto, and Y. Onuki, “The de Haas-van Alphen effect in URu2Si2 under pressure,” J. of Phys.: Condens. Matter 15, S2011 (2003).
- Villaume et al. (2008) A. Villaume, F. Bourdarot, E. Hassinger, S. Raymond, V. Taufour, D. Aoki, and J. Flouquet, “Signature of hidden order in heavy fermion superconductor URu2Si2: Resonance at the wave vector ,” Phys. Rev. B 78, 012504 (2008).
- Niklowitz et al. (2010) P. G. Niklowitz, C. Pfleiderer, T. Keller, M. Vojta, Y.-K. Huang, and J. A. Mydosh, “Parasitic Small-Moment Antiferromagnetism and Nonlinear Coupling of Hidden Order and Antiferromagnetism in URu2Si2 Observed by Larmor Diffraction,” Phys. Rev. Lett. 104, 106406 (2010).
- Bourdarot et al. (2011) Frederic Bourdarot, Nicolas Martin, Stephane Raymond, Louis-Pierre Regnault, Dai Aoki, Valentin Taufour, and Jacques Flouquet, “Magnetic properties of uru2si2 under uniaxial stress by neutron scattering,” Phys. Rev. B 84, 184430 (2011).
- Williams et al. (2017) T. J. Williams, H. Barath, Z. Yamani, J. A. Rodriguez-Riviera, J. B. Leão, J. D. Garrett, G. M. Luke, W. J. L. Buyers, and C. Broholm, “Gapped excitations in the high-pressure antiferromagnetic phase of URu2Si2,” Phys. Rev. B 95, 195171 (2017).
- Chatterjee et al. (2013) S. Chatterjee, J. Trinckauf, T. Hänke, D. E. Shai, J. W. Harter, T. J. Williams, G. M. Luke, K. M. Shen, and J. Geck, “Formation of the Coherent Heavy Fermion Liquid at the Hidden Order Transition in ,” Phys. Rev. Lett. 110, 186401 (2013).
- (74) E. Frantzeskakis, J. Dai, T. C. Rödel, M. G”uttler, C. Bareille, S. Ran, N. Kanchanavatee, K. Huang, N. Pouse, C. T. Wolowiec, E. D. L. Rienks, P. Lejay, T. Durakiewicz, F. Fortuna, Maple M. B., and Andrés F. Santander-Syro, “From hidden-order to antiferromagnetism: electronic structure reconstruction in Fe-doped URu2Si2,” Submitted.
- Butch et al. (2016) Nicholas P. Butch, Sheng Ran, Inho Jeon, Noravee Kanchanavatee, Kevin Huang, Alexander Breindel, M. Brian Maple, Ryan L. Stillwell, Yang Zhao, Leland Harriger, and Jeffrey W. Lynn, “Distinct magnetic spectra in the hidden order and antiferromagnetic phases in URu2-xFexSi2,” Phys. Rev. B 94, 201102 (2016).
- Drickamer (1965) H.G. Drickamer, “The Effect of High Pressure on the Electronic Structure of Solids,” Solid State Physics 17, 1 – 133 (1965).
- Drickamer and Frank (1973) H. G. Drickamer and C. W. Frank, Electronic Transitions and the High Pressure Chemistry and Physics of Solids, ed., Studies in Chemical Physics (Springer Netherlands, Netherlands, 1973).
- Schilling (1979) James S. Schilling, “Pressure as a parameter in the study of dilute magnetic alloys,” Adv. Phys. 28, 657 (1979).
- Schilling (1981) James S. Schilling, “Some Recent Results in Magnetism under High Pressure,” in Physics of Solids under High Pressure, edited by James S. Schilling and Robert S. Shelton (North-Holland Publishing Company, Amsterdam, 1981) pp. 345–356.
- Maple et al. (1969) M. B. Maple, J. Wittig, and K. S. Kim, “Pressure-Induced Magnetic-Nonmagnetic Transition of Ce Impurities in La,” Phys. Rev. Lett. 23, 1375 (1969).
- Kim and Maple (1970) K. S. Kim and M. B. Maple, “Kondo Effect in Alloys under Pressure,” Phys. Rev. B 2, 4696 (1970).
- Maple (1976) M. B. Maple, “Superconductivity - a probe of the magnetic state of local moments in metals,” Applied physics 9, 179 (1976).
- Mann (1973) J. B. Mann, “SCF Hartree-Fock results for elements with two open shells and the elements francium to nobelium,” Atomic Data and Nuclear Data Tables 12, 1 (1973).
- McLean and McLean (1981) A. D. McLean and R. S. McLean, “Roothaan-Hartree-Fock atomic wave functions Slater basis-set expansions for Z = 55-92,” Atomic Data and Nuclear Data Tables 26, 197 (1981).
- Papaconstantopoulos and Mehl (2003) D. A. Papaconstantopoulos and M. J. Mehl, “The Slater-Koster tight-binding method: a computationally efficient and accurate approach,” J. Phys.: Conden. Matt. 15, R413 (2003).
- Durgavich et al. (2016) J. Durgavich, S. Sayed, and D. Papaconstantopoulos, “Extension of the NRL tight-binding method to include f orbitals and applications in Th, Ac, La and Yb,” Comp. Mater. Sci. 112, 395 (2016).
- Papaconstantopoulos (2015) D. A. Papaconstantopoulos, Handbook of the Band Structure of Elemental Solids, 2nd ed. (Springer US, New York, NY, 2015).
- Regnault et al. (1988) L. P. Regnault, W. A. C. Erkelens, J. Rossat-Mignod, P. Lejay, and J. Flouquet, “Neutron scattering study of the heavy-fermion compound ,” Phys. Rev. B 38, 4481 (1988).
- Koterlyn et al. (2007) M. Koterlyn, I. Shcherba, R. Yasnitskii, and G. Koterlyn, “Peculiarities of the intermediate valence state of Ce in Ce2Si2 (=Fe, Co, Ni) compounds,” Journal of Alloys and Compounds 442, 176 (2007), proceedings of the 15th International Conference on Solid Compounds of Transition Elements.
- Besnus et al. (1985) M.J. Besnus, J.P. Kappler, P. Lehmann, and A. Meyer, “Low temperature heat capacity, magnetization, resistivity of , with Y or La substitution,” Solid State Communications 55, 779 (1985).
- Umarji et al. (1986) A Umarji, Godart Claude, L Gupta, and R Vijayaraghavan, “Spin fluctuation effects in substituted CeRu2Si2 and YbPd2Si2 alloys,” Pramana 27, 321 (1986).
- Kitaoka et al. (1986) Yoshio Kitaoka, Koh-ichi Ueda, Kenji Fujiwara, Hironobu Arimoto, Haruhisa Iida, and Kunisuke Asayama, “NMR Investigation of Superconductivity and Kondo-Coherency in CeCu2Si2,” Journal of the Physical Society of Japan 55, 723 (1986).
- Godart et al. (1986) C. Godart, A. M. Umarji, L. C. Gupta, and R. Vijayaraghavan, “Magnetism and spin fluctuation effects in heavy-fermion induced by partial substitution of Ru and Si,” Phys. Rev. B 34, 7733 (1986).
- Amorese et al. (2020) Andrea Amorese, Martin Sundermann, Brett Leedahl, Andrea Marino, Daisuke Takegami, Hlynur Gretarsson, Andrei Hloskovsky, Christoph Schlüter, Maurits W. Haverkort, Yingkai Huang, Maria Szlawska, Dariusz Kaczorowski, Sheng Ran, M. Brian Maple, Eric D. Bauer, Andreas Leithe-Jasper, Peter Thalmeier, Liu Hao Tjeng, and Andrea Severing, “Dual nature of 5 electrons in the isostructural UM2Si2 family: from antiferro- to Pauli paramagnetism via hidden order,” arXiv: 2004.13419 (2020), arXiv:2004.13419 [cond-mat.str-el] .
- Oh et al. (2007) Y. S. Oh, Kee Hoon Kim, P. A. Sharma, N. Harrison, H. Amitsuka, and J. A. Mydosh, “Interplay between Fermi Surface Topology and Ordering in URu2Si2 Revealed through Abrupt Hall Coefficient Changes in Strong Magnetic Fields,” Phys. Rev. Lett. 98, 016401 (2007).
- Jo et al. (2007) Y. J. Jo, L. Balicas, C. Capan, K. Behnia, P. Lejay, J. Flouquet, J. A. Mydosh, and P. Schlottmann, “Field-Induced Fermi Surface Reconstruction and Adiabatic Continuity between Antiferromagnetism and the Hidden-Order State in URu2Si2,” Phys. Rev. Lett. 98, 166404 (2007).