Mapping the ionized gas of the metal-poor HII galaxy PHL 293B with MEGARA††thanks: Based on observations collected with GTC at the Roque de los Muchachos Observatory
Abstract
Here we report the first spatially resolved spectroscopic study for the galaxy PHL 293B using the high-resolution GTC/MEGARA integral field unit (IFU). PHL 293B is a local, extremely metal-poor, high ionization galaxy. This makes PHL 293B an excellent analogue for galaxies in the early Universe. The MEGARA aperture ( 12.5” 11.3”) covers the entire PHL 293B main body and its far-reaching ionized gas. We created and discussed maps of all relevant emission lines, line ratios and physical-chemical properties of the ionized ISM. The narrow emission gas appears to be ionized mainly by massive stars according to the observed diganostic line ratios, regardless of the position across the MEGARA aperture. We detected low intensity broad emission components and blueshifted absorptions in the Balmer lines (H,H) which are located in the brightest zone of the galaxy ISM. A chemically homogeneity, across hundreds of parsecs, is observed in O/H. We take the oxygen abundance 12+log (O/H) = 7.64 0.06 derived from the PHL 293B integrated spectrum as the representative metallicity for the galaxy. Our IFU data reveal for the first time that the nebular HeII4686 emission from PHL 293B is spatially extended and coincident with the ionizing stellar cluster, and allow us to compute its absolute HeII ionizing photon flux. Wolf-Rayet bumps are not detected excluding therefore Wolf-Rayet stars as the main HeII excitation source. The origin of the nebular HeII4686 is discussed.
keywords:
HII regions — galaxies: dwarf — galaxies: individual: PHL 293B — galaxies: ISM — galaxies: starburst1 Introduction
HII galaxies are the most metal-poor starbursts in the local Universe (e.g., Westera et al., 2004; Kehrig et al., 2006; Izotov, Thuan, & Guseva, 2012; James et al., 2017). These galaxies present intense star-formation rates, and they usually have low masses and blue optical colours. The hot, luminous massive stars present in HII galaxies give off vast quantities of high-energy UV photons which ionize the gas producing strong nebular emission-line spectra (e.g., Kehrig, Telles, & Cuisinier, 2004; Cairós et al., 2009, 2010).
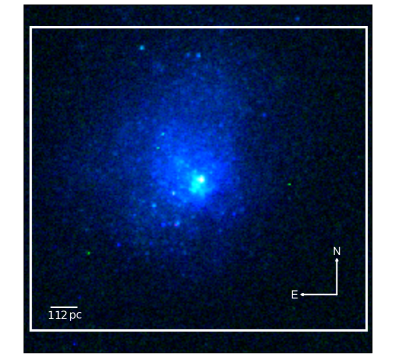
PHL 293B is a very compact HII galaxy (effective radius of its star-forming component 0.7”; e.g., Papaderos et al., 2008) which belongs to the “Palomar-Haro-Luyten” survey of faint galaxies (see French, 1980; Kinman & Davidson, 1981). The ionized gas of PHL 293B presents a very low oxygen abundance of 12+log(O/H) 7.6-7.7 [ 1/10 solar metallicity111assuming a solar abundance 12+log(O/H)⊙ = 8.69 (Asplund et al., 2009); e.g., French (1980); Kinman & Davidson (1981); Papaderos et al. (2008); Izotov et al. (2011); Fernández et al. (2018)]. Moreover, PHL 293B shows ultra-high excited gas indicated by the presence of the nebular HeII4686 emission (e.g., French, 1980; Izotov, Thuan & Guseva, 2007), and its very high specific star formation rate (sSFR = SFR/M⋆ 6 Gyr-1; see table 4 from Filho, et al., 2013) is comparable to those found in the high-redshift Universe (e.g., Stark, 2016). These features are more commonly observed and predicted in distant star-forming galaxies in comparison with local starbusrst (e.g., Lehnert, et al., 2015; Mainali, et al., 2018; Izotov, Thuan & Guseva, 2019; Sobral, et al., 2019). This makes PHL 293B a remarkable place nearby that allows us to study in detail physical conditions which may be predominant in primeval starbursts (see also Kehrig, et al., 2016; Guseva, et al., 2017; Izotov, et al., 2018; Kehrig, et al., 2018; Senchyna, et al., 2019). The optical spectrum of PHL 293B shows the typical strong narrow emission lines normally seen in the spectra of HII galaxies. Besides, its spectrum exhibits other features as low-intensity broad wings and blueshifted narrow absorptions in the hydrogen recombination lines (e.g., Izotov & Thuan, 2009; Terlevich et al., 2014, and references therein). Table 1 lists other general properties of PHL 293B. Fig. 1 shows a three-colour composite image of PHL 293B from the Hubble Space Telescope (HST)/WFC3 which reveals an extended gaseous nebulae and star-forming activity mainly present in the southern zone of the galaxy (see also Papaderos et al., 2008).
In the last years, spatially resolved spectroscopy has opened a new window onto our understanding of the ionized gas in low-redshift SF galaxies, preventing us from an over-simplified view of it (e.g., Kehrig et al., 2008, 2013; Duarte Puertas, et al., 2019; Ucci, et al., 2019; Sánchez, 2020). In this work, we present the first 2D spectroscopic study of PHL 293B based on commissioning observations with the Multi Espectrógrafo en GTC de Alta Resolución para Astronomía (MEGARA; see next section). Our MEGARA data provide a detailed scanning of the structure and properties of the PHL 293B ionized gas. Moreover, we derive the first integrated spectrum and total HeII-ionizing photon flux from PHL 293B.
The paper is organized as follows. In Section 2, we report observations and data reduction. Flux measurements and emission line intensity maps are presented in Section 3. In Section 4 we show the 2D view of the ionization structure and nebular properties. In Section 5, we present the integrated properties from selected regions of PHL 293B. Section 6 discusses the spatially resolved HeII4686-emitting region and the origin of the HeII excitation. Finally, Section 7 summarizes the main conclusions derived from this work.
| Parameter | PHL 293B |
|---|---|
| Alternate names | Kinman Dwarf, A2228-00 |
| R.A. (J2000.0) | 22h 30m 36.8s |
| DEC. (J2000.0) | -00∘ 06’ 37” |
| redshift | 0.0051 |
| Da(Mpc) | 23.1 |
| HTypeb | Im? |
| Scale (pc/) | 112 |
| (B-V)c | 0.56 0.05 |
| (V-R)c | 0.27 0.04 |
| MBc(mag) | -14.37 |
| AVd(mag) | 0.193 |
2 Observations and data reduction
The data of PHL 293B were obtained with MEGARA (see Gil de Paz et al., 2018; Carrasco et al., 2018), attached to the 10.4m GTC telescope at the Roque de los Muchachos Observatory. Observations were taken during the second commissioning run in 2017 July 25th and 29th, using the Large Compact Bundle (LCB) IFU mode which provides a field of view (FOV) of 12.511.3 arcsec2 ( 1.4 kpc 1.3 kpc at the distance of 23.1 Mpc; see Fig. 1), with a spaxel222Individual elements of IFUs are usually named “spatial pixels” (so-called “spaxel”); the term is used to distinguish a spatial element on the IFU from a detector pixel. diameter of 0.62 arcsec. In order to cover the main optical emission-lines, the observations were carried out with three gratings; we used the “blue” VPH405-LR (centered at 4025 Å) and “green” VPH480-LB (centered at 4785 Å) gratings which give spectral ranges ()/dispersions ( pix-1) of 3653-4386/0.17 and 4332-5196/0.20, respectively. On the red side, the VPH665-HR (centered at 6602 Å) was utilized, providing a spectral range from 6445-6837 and 0.09 /pix. The resolving power of the gratings are 6000 in case of LR VPHs and 20000 for VPH665-HR.
We observed a total of 2.25 hours on the galaxy, with the integration time split into three exposures for each VPH: s for VPH665-HR and VPH480-LR each, and s for VPH405-LR. The seeing was about 1 arcsec and 0.5 arcsec during the first and second observing nights, respectively. All science frames were observed at airmasses 1.2 to minimize the effects due to differential atmospheric refraction. Additionally, all necessary calibration frames (exposures of arc lamps and of continuum lamps) were obtained.
The data reduction and sky subtraction were carried out using the MEGARA Pipeline as described in Pascual et al. (2019). Due to severe haze throughout the observing run, we did not flux-calibrate the data using standard stars. Instead, we flux-calibrated our spectra using the Sloan Digital Sky Survey (SDSS) spectrum of PHL 293B. First, we co-added the spaxels within a 3 arcsec-diameter aperture (i.e., the same size of the SDSS fiber), centered at the brightest spaxel of the LCB IFU, to create a 1D spectrum called the “SDSS-like” MEGARA spectrum. We then measured the flux of the emission lines present in both the SDSS and SDSS-like MEGARA spectra. We compared these flux measurements by performing a third order logarithm polynomial fit to obtain the sensitivity function which was applied to the science frames. Given that the SDSS spectrum (spectral range 3800-9000 Å) of PHL 293B does not cover our bluest emission lines [Oii]3727,3729Å, the sensitivity function was extrapolated to allow for their relative flux calibration.
3 Flux measurements and emission line intensity maps
Here we measure emission line fluxes from individual spaxels based on our own IDL scripts. On top of a linear flat continuum, we fit a Gaussian profile to each emission line using the IDL based routine MPFIT (Markwardt, 2009); the peak intensity, the line width and the central wavelength for each line are kept as free parameters. Note that, due to the high spectral resolution of MEGARA we were able to resolve the [OII] doublet and, consequently, measure its individual lines at 3726 Å and 3729 Å. In the case of the H+[Nii] lines, we perform a simultaneous fit keeping a nitrogen [Nii]6584/[Nii]6548 line ratio of 3. Previous work, based on single-aperture/long-slit spectroscopy of the central star-forming (SF) knot of PHL 293B, have detected the presence of several components for the H, H lines (e.g., Izotov & Thuan, 2009; Terlevich et al., 2014; Fernández et al., 2018). Following these authors, we fit these Balmer lines assuming three Gaussian components: narrow + broad emission, and one absorption component. Errors in the derived parameters (line flux, peak intensity, line width , central wavelength ) are estimated by using the bootstrap method.
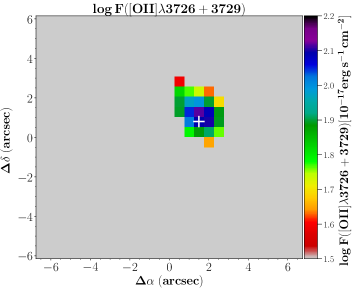
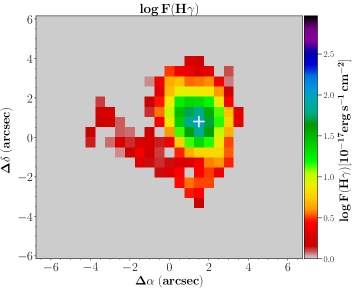
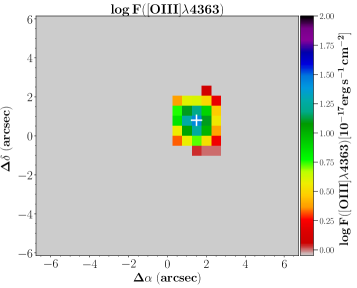
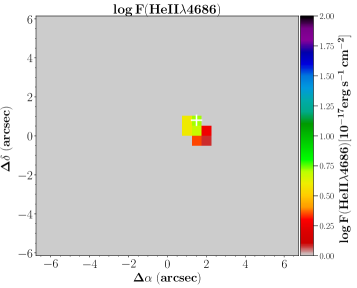
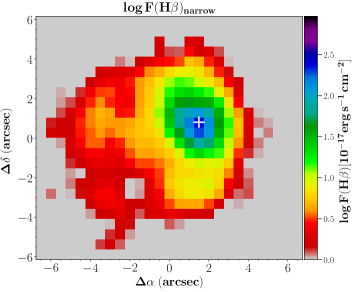
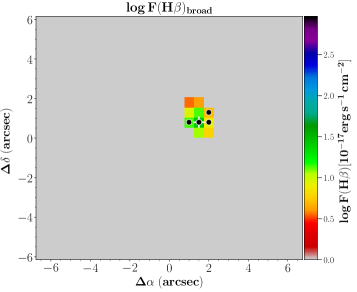
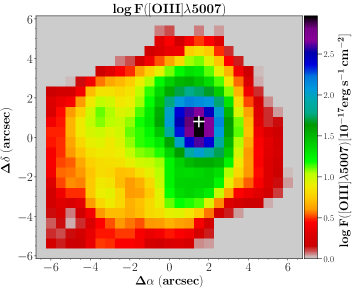
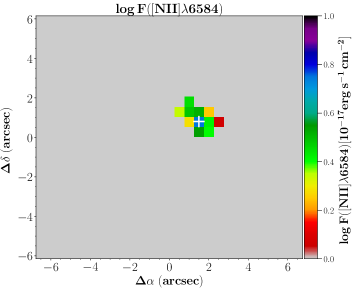
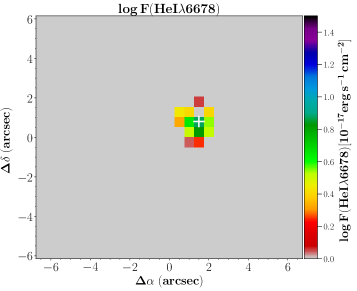
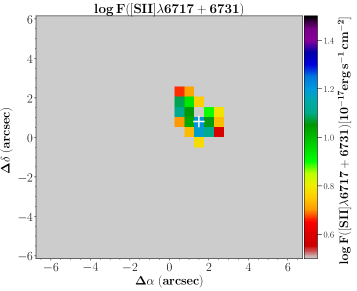
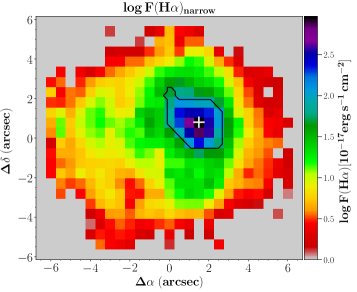
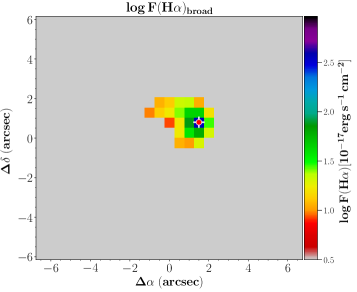
By combining the line fluxes with the position of the spaxels on the sky, we create all maps presented in this paper. Figure 2 exposes the intensity maps for several emission lines; only fluxes with S/N 3 are displayed.333Here the S/N is defined as the ratio between the peak intensity of the emission line and the standard deviation of its underlying continnum. We show for the first time the spatial distribution for the broad H,H components for PHL 293B. The global spatial structure of the brightest lines (narrow H, [Oiii]5007, and narrow H) is similar, with [Oiii]5007 and narrow H emission covering almost the entire FOV. The spatial distribution of the fainter lines (e.g., [Oiii]4363, HeII4686, [Nii]6584, [Sii]6717+6731), and the broad H and H are restricted to the inner parts of the galaxy.
When comparing the [Oii] emission distribution to that for other relatively bright lines as H, we find the former to be more compact. This could be related partially to the fact that the [Oii] lines lie at the blue edge of the spectra (i.e. 3750 Å) where we not only observe lower S/N but also expect less accuracy of the flux calibration (see Section 2 for details; see e.g., Sánchez, et al., 2012; Yan, et al., 2016; López-Sanjuan, et al., 2019). However, we highlight that the PHL 293B ionization structure which seems to be dominated by high excitation should also plays an important role; e.g., the [Oiii]5007 emission is spatially wide-ranging as long as the [Oii]3726,3729, [Nii]6584 and [Sii]6717,6731 lines extend over a much smaller area (see Fig. 2). The likeness between the maps of [Oii], [Nii] and [Sii] is generally expected due to their similar ionization potential, albeit [Nii] and [Sii] lines sit at the red part of the spectra where S/N and flux calibration effects mentioned above should be minor.
The emission of both, the high and low intensity lines, are peaked on the southern HII region where the star formation is mostly concentrated (the bright blue knot in Fig. 1; see also Papaderos et al., 2008). In agreement with previous work (e.g., Izotov & Thuan, 2009; Terlevich et al., 2014) we were able to detect H and H P Cygni-like profiles in some integrated spectra (see Section 5 for details) and in a few individual spaxels which are indicated in the map of the H and H broad emission components (see Fig. 2). P Cygni-like profiles are displayed in Figs. 3 and 4.


4 Spatially Resolved Properties of the ionized gas
4.1 Ionization Structure
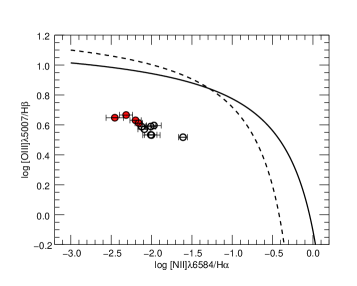
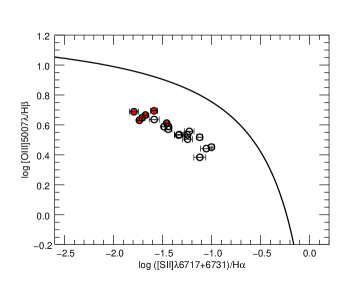
Baldwin-Phillips-Terlevich (BPT) diagrams (Baldwin, Phillips, & Terlevich, 1981) are a powerful tool, widely used to separate star-forming galaxies and AGN. The spatially-resolved BPT diagrams for PHL 293B are shown in Fig. 5: [Oiii]5007/H vs. [Nii]6584/H, [Sii]6717,6731/H. These line ratios are not corrected for extinction, but reddening effects must be minor since these ratios involve lines which are close in wavelength. Each circle plotted in Fig. 5 corresponds to a line ratio obtained from a single spaxel, where the red circles show the HeII4686-emitting spaxels. Based on stellar population synthesis and photoionization models, Kewley et al. (2001) proposed a theoretical demarcation curve that isolates galaxies with line ratios which are due to excitation by massive stars within HII regions from those where other ionizing source is needed. An empirical curve that differentiates between AGNs and HII-like systems was later derived by Kauffmann et al. (2003); both demarcation lines are plotted in Fig. 5. For all positions in PHL 293B our emission-line ratios fall in the general locus of SF objects, i.e., below and to the left of the separation lines in the two BPT diagrams. This suggests that photoionization from hot massive stars appears to be the dominant excitation mechanism within PHL 293B.
The spatial distribution for the BPT line ratios are displayed in Fig 6. While highest and lowest values of [Oiii]5007/H are found at the most inner and external zones of PHL 293B respectively, a reverse trend is observed in the [Nii]6584/H and [Sii]6717,6731/H maps, indicating the presence of higher excited gas inward. The [Oiii]5007/H map clearly shows larger values spatially coincident with the southern HII region (i.e., the bright blue knot in Fig. 1) which also comprises the HeII zone (see also the HeII4686 map in Fig. 2). Additionally, in Fig. 5 we see that the HeII-emitting spaxels tend to have higher [Oiii]5007/H ratio in comparison to the other spaxels. Shall we note that despite this correlation, the hard HeII-ionizing radiation (E 4 Ryd) does not have to be necessarily the main responsible for the brighter [Oiii] emission since the the [Oiii] lines can be excited by softer energies (E 2.5 Ryd) (see e.g., Thuan & Izotov, 2005).
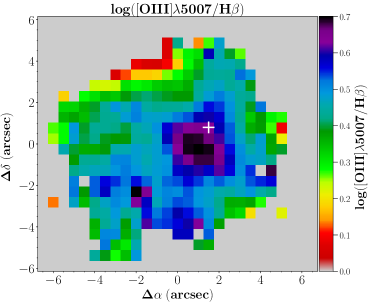
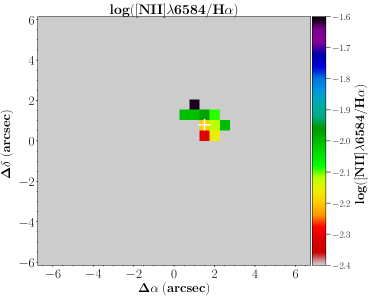
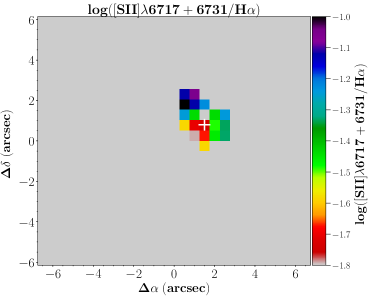
Fig. 2.
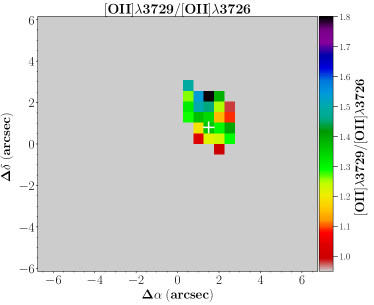
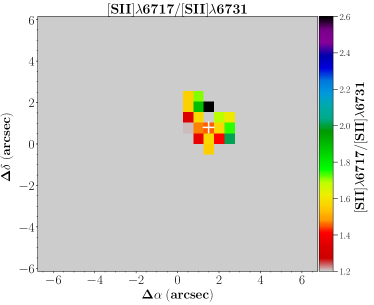
Fig. 2.
4.2 Nebular physical-chemical properties on a spaxel-by-spaxel basis
We have used the expressions from Pérez-Montero (2017) to compute the physical properties and ionic abundances of the PHL 293B ionized gaseous nebulae. These expressions are derived from the PyNEB tool (Luridiana, Morisset & Shaw, 2015).
In Fig. 7 we show the maps for the [Oii]3729/3726 and [Sii]6717/6731 line ratios which are good indicators of the average electron density () in a nebula (Osterbrock & Ferland, 2006). For most of the spectra, the observed [Oii] ([Sii]) line ratios correspond to values 300 cm-3 ( 100 cm-3), indicating a relatively low-density ionized gas in the central parts of PHL 293B.
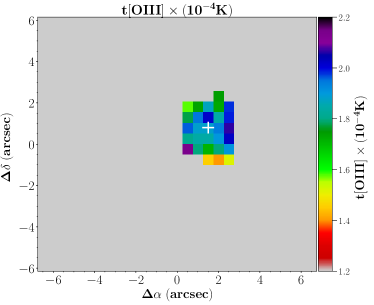
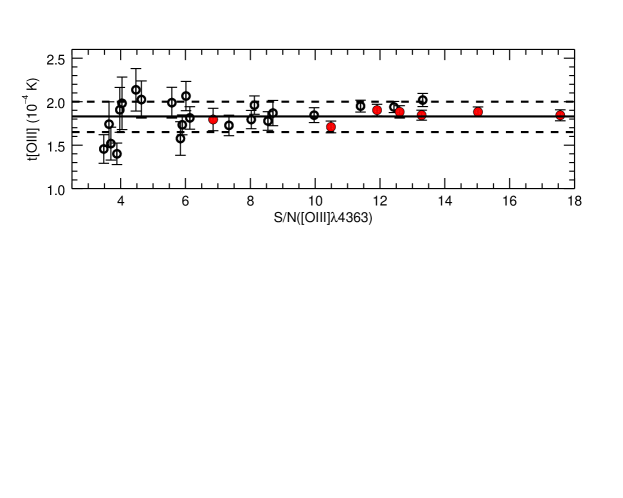
For the [Oiii]4363-emitting spaxels, we have computed the electron temperature [Oiii] values from the reddening corrected [Oiii]4363/[Oiii]5007 line ratio. We have measured the weak [Oiii]4363 line above 3 for 29 spaxels which extend to an area of around 9.6 arcsec2 equivalent to 0.12 kpc2 (see Fig. 2). The top-left panel of Fig. 8 presents the map of the [Oiii] which reveales values going from 14,000 K to near 20,000 K, with a good fraction of the points clustering around the average value of 18,300 K. The relation between [Oiii] and the S/N measured for the [Oiii]4363 line is plotted in the bottom panel of Fig. 8 where no systematic effects are observed. This is an evidence that the largest values of [Oiii] that we derive are not an effect of overestimated [Oiii]4363 flux measurements. We have used the [Oii]-[Oiii] empirical relantionship from Pilyugin et al. (2006) to determine the [Oii] values since no low-excitation auroral line (e.g., [Nii]5755) has been detected in any spaxel.
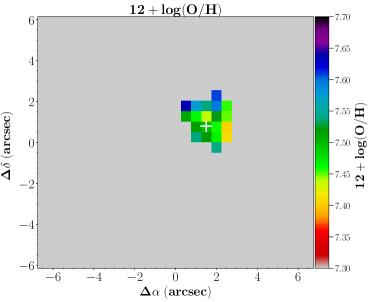
The O+/H+ and O2+/H+ ionic abundance ratios, were computed from the [Oii]3726,29 and [Oiii]5007 lines, respectively using the corresponding electron temperatures. A tiny fraction of the unseen O3+ ion is expected to be present in high-ionizing SF regions as the ones showing HeII emission. Based on the photoionization models from Izotov et al. (2006a), the O3+/O ratio is 1 only in the highest-excitation HII regions whose O+/(O+ + O2+) is lower than 10. We have checked that for all [OIII]4363-emitting spaxels (including non-HeII4686 and HeII4686 emitting spaxels), O+/(O+ + O2+) is 10; therefore the total O/H is assumed to be O+/H+ + O2+/H+. The spatial distribution of the derived 12+log(O/H) is displayed in the top-right panel of Fig. 8 with most of the spaxels (80) showing oxygen abundance in the range of –. Our results, thus, indicate that the warm gas-phase O/H in PHL 293B stands largely constant beyond hundreds of parsecs. This agrees with the absence of significant abundance gradient commonly observed in the ionized gas of HII galaxies (e.g., Kobulnicky & Skillman, 1996; Izotov, et al., 1999; Thuan, Izotov & Foltz, 1999; Izotov, Chaffee & Green, 2001; Izotov, et al., 2004, 2006b; Papaderos, et al., 2006; Kehrig et al., 2008, 2013; Kehrig, et al., 2016; Pérez-Montero et al., 2009, 2011).
5 Integrated spectra across the MEGARA FOV of PHL 293B
Based on our IFU data we integrated individual spectra of selected galaxy regions. We created for the first time the integrated spectrum of PHL 293B by adding the flux in all the spaxels with H S/N (per spaxel) 3; this matches an area of 194 arcsec2 ( 2.4 kpc2) enclosing basically all the nebular emission across our FOV. In addition, by summing the emission from the spaxels with H S/N 100 ( 11.5 arcsec2), we simulate the spectrum of the brightest region of the galaxy (hereafter H-HSN region444HSN from High Signal to Noise ratio.), and whose boundary is shown overplotted on the map of H (see Fig. 2). Finally, we obtained the spectrum of the region that we name PHL 293B-HeII. To do so we have integrated all HeII-emitting spaxels which covers 3.5 arcsec2 (see the HeII map in Fig. 2).
The 1D spectra mentioned above are presented in Fig. 9. We derive the fluxes of the emission-lines and associated uncertainties for these spectra using the same method as for individual spaxels (see Section 3). We computed the logarithmic reddening coefficient, C(H), by performing a least square fit to the ratio of the measured-to-theoretical Balmer decrements as a function of the Miller & Mathews (1972) galactic reddening law (see also Hägele, et al., 2008). The uncertainty of the fit is adopted as the error in C(H). The narrow component of the four strongest Balmer emission lines (H, H, H, H) have been used. Intrinsic Balmer line ratios were taken from Osterbrock & Ferland (2006) assuming case B recombination with electron temperature Te=2104K: (H/H)theo=0.26, (H/H)theo=0.47, (H/H)theo=2.75. Some issues were found concernig the C(H) computation. The blue grating covers the H and H, and the green spectra include both H and H, while H is measured in the red grating (see Section 2). We match the blue and green spectra by using the H line as reference which is measurable in both. We could not connect the green and red spectra since they share no lines. Thus, to minimize errors in the de-reddened ratios between a certain emission line and H, we always take first its ratio in relation to the closest hydrogen emission line (i.e. H in the case of [Oii]3726, [Oii]3729 and [NeIII]3868; H in the case of [Nii], HeI6678 and [Sii]) and then we renormalize it using the corresponding theoretical Balmer ratio (e.g., Pérez-Montero et al., 2009, 2011; Kehrig et al., 2011).
Table 2 presents the relative fluxes of the de-reddened narrow emission lines measured from the integrated spectra; fluxes are normalized to the H flux = 1000. We note that the values of C(H) obtained here are in agreement with values derived for PHL 293B in the past (e.g., Izotov, Thuan, & Guseva, 2012; Terlevich et al., 2014). Also, the listed H/H and H/H ratios acceptably match their theoretical recombination values; the H/H ratio shown in Table 2 makes use of the green-H flux, and is about 10-15 smaller than the theoretical one. We verify that using the blue-H flux instead, the ratio between the de-reddened and theoretical H/H lowers down to 3-5. The line ratios uncertainties consider error flux measurements and the error in C(H), but do not take systematic uncertainties, e.g., due to the blue-green match. We note that the effects of these uncertainties on the line ratios upon which oxygen abundance and [Oiii] estimates are based should be marginal since we obtain values in accord with other authors (see below). Since the [Oii] lines are the most affected by extinction in our spectra, as a further check, we also corrected for reddening [Oii]3726,3729/H using only the green-H-to-H ratio. We found that the variations in [Oii]3726,3729/H are within the quoted uncertainties in Table 2.
For our three selected galaxy regions (PHL 293B integrated, PHL 293B-HeII, H-HSN), we calculated physical properties and oxygen abundances as explained in Section 4 for single spaxel spectra. We calculated the nitrogen ionic abundance ratio, N+/H+, from the PYNEB-based expression from Pérez-Montero (2017), using the [Nii]6584 emission line and assuming Te[Nii] Te[Oii]; we derived the N/O ratio under the premise that N/O=N+/O+, based on the similitude of the ionization potentials of the ions N+ and O+. Table 2 also lists the values of C(H) and physical-chemical properties obtained for each spectrum region.
By looking at Table 2 and Fig. 5, we find that the measurements of the integrated line-ratios [Oiii]5007/H, [Nii]6584/H, [Sii]6717,6731/H for the three selected regions are located below the demarcation lines in the BPT diagrams which implies an HII region-like ionization.
The comparison among the integrated electron temperature values from Table 2 shows similar [Oiii], considering the uncertainties. Concerning the oxygen abundances, we also find that the spectra of the regions PHL 293B-HeII, H-HSN, and PHL 293B-integrated yield equivalent values within the corresponding error bars. This is telling us that the metallicity obtained from the PHL 293B-integrated spectrum matches the O/H from the other two (physically smaller) selected zones. Therefore, according to our MEGARA data, the gas metallicity of PHL 293B is not only spatially homogenous (see previous section), but also independent of the aperture applied. Here, we take the O/H abundance of the integrated-spectrum [12+log (O/H)=7.64 0.06 8 solar metallicity] as the representative metallicity of PHL 293B. This value is consistent, within the errors, with those reported in previous work (e.g., Kinman & Davidson, 1981; Izotov, Thuan & Guseva, 2007; Papaderos et al., 2008; Guseva, et al., 2009).
Regarding the nitrogen abundance, we find that the H-HSN and PHL 293B-HeII regions present similar N/O ratios within the uncertainties (see Table 2). The N/O values derived here are in agreement with the typical value of Log(N/O) -1.5 to -1.6 characteristic for the plateau in the 12+Log(O/H) vs. Log(N/O) relation observed for low-metallicity systems (e.g., Garnett, 1990; Thuan, Izotov & Lipovetsky, 1995; Izotov & Thuan, 1999; van Zee & Haynes, 2006; Mollá et al., 2006; Pérez-Montero et al., 2011). Moreover, we confirm that the N/O ratios for these two regions match those obtained in earlier studies of PHL 293B (e.g., French, 1980; Izotov, Thuan & Guseva, 2007).
In Table 3 we list the observed fluxes and dispersion of the broad and narrow emission components of H and H lines for the three integrated spectra described in this section. The origin of the broad emission and P Cygni-like features in the Balmer lines seen in the spectra of PHL 293B has been debated for many years. Discrepant scenarios involving a luminous blue variable star eruption, an expanding supershell or a stationary wind driven by a young cluster wind, and strongly-radiative stationary cluster wind have been proposed (e.g., Izotov & Thuan, 2009; Terlevich et al., 2014; Tenorio-Tagle, et al., 2015). Burke, et al. (2020) review the previous interpretations for the nature of PHL 293B including new 2019 Gemini data, and find a recent fading of broad H emission (see also Allan et al., 2020); a broad to narrow H flux ratio (H B/N) of 0.41 from 2001 SDSS data and 0.10 from 2019 Gemini data are reported by Burke, et al. (2020). Here we find H B/N 0.10 for all the three integrated regions indicating that the dissipation of the broad H emission might have begun in 2017 when our observations were performed (see Table 3). However, while our data reveal P Cygni-like features in H and H (see Figs. 3 and 4), P Cygni profile in H is not visible in the 2019 Gemini spectra according to Burke, et al. (2020)555Gemini spectra from Burke, et al. (2020) cover from 5500 - 7500 Å.. A long-lived Type IIn supernova (SN IIn) is proposed to be the most likely explanation for the optical and spectral variability of PHL 293B by Burke, et al. (2020). However, the lack of X-rays ( 3 1038 erg s-1; e.g., Prestwich, et al., 2013; Terlevich et al., 2014) in PHL 293B remains the big challenge to the SN IIn scenario. Larger timescales spectroscopic follow-up should be necessary to clarify the variable spectral features of PHL 293B, but this is outside the scope of our study.


| Selected regions | |||
| Wavelength (Å) | PHL 293B-Integratedb | H-HSNc | PHL 293B-HeIId |
| 3726 [O II] | 585 168 | 464 46 | 296 32 |
| 3729 [O II] | 760 118 | 544 42 | 340 27 |
| 3868 [NeIII] | 417 30 | 418 7 | 407 6 |
| 4100 H | 286 16 | 277 5 | 271 4 |
| 4340 H | 390 18 | 417 10 | 412 9 |
| 4363 [O III] | 84 14 | 106 6 | 113 5 |
| 4686 He II | — | 20 2 | 26 2 |
| 4714 [Ar IV] | — | 21 2 | 24 3 |
| 4740 [Ar IV] | — | 14 2 | 16 2 |
| 5007 [O III] | 3568 38 | 4068 44 | 4406 32 |
| 6563 H (Narrow) | 2717 55 | 2831 39 | 2804 28 |
| 6584 [N II] | — | 20 3 | 16 4 |
| 6678 HeI | — | 24 1 | 23 1 |
| 6717 [S II] | 82 10 | 54 2 | 36 1 |
| 6731 [S II] | — | 36 2 | 27 2 |
| c(H) | 0.11 0.02 | 0.14 0.01 | 0.30 0.01 |
| F(H) (erg s-1 cm-2) | 4.28 | 2.74 | 1.86 |
| F(HeII) (erg s-1 cm-2) | — | 5.41 | 4.76 |
| L(HeII)(erg s-1)e | — | 3.45 | 3.04 |
| Q(HeII)(photon s-1)f | — | 4.16 | 3.66 |
| log ([N II]6584/H) | — | -2.16 | -2.25 |
| log ([S II]6717+6731/H) | — | -1.50 | -1.66 |
| log ([O III]5007/H) | 0.55 | 0.61 | 0.64 |
| ([O III]) (K) | 16,335 1500 | 17,243 548 | 17,089 450 |
| ([O II])g (K) | 14,361 1080 | 15,015 394 | 14,904 324 |
| 12+log() | 7.08 0.11 | 6.90 0.04 | 6.71 0.04 |
| 12+log() | 7.50 0.07 | 7.51 0.02 | 7.55 0.02 |
| 12+log(O/H)h | 7.64 0.06 | 7.60 0.02 | 7.61 0.02 |
| 12+log() | — | 5.21 0.07 | 5.12 0.11 |
| log(N/O) | — | -1.68 0.08 | -1.59 0.11 |
(a) In all cases, the reddening correction for each line flux was performed relative to the closest Balmer recombination line (see text for details)
(b) PHL 293B-integrated spectrum obtained by co-adding all spaxels with H S/N 3
(c) Spectrum created by adding all spaxels with H S/N 100
(d) Spectrum obtained by summing all HeII-emitting spaxels
(e) HeII luminosity at the distance of 23.1 Mpc
(f) Number of ionizing photons shortward of the He+ edge (see the text for details)
(g) [Oii] = 0.72 [Oiii] + 0.26 (Pilyugin et al., 2006)
(h) O/H = O+/H+ + O2+/H+
| Regiona | Property | H Narrow | H Broad | H Narrow | H Broad |
|---|---|---|---|---|---|
| PHL 293B-Integrated | Fluxb | 3296 32 | — | 9720 61 | 1005 79 |
| (Å)c | 0.50 | — | 0.46 | 2.3 | |
| (Km/s)d | 31 | — | 21 | 105 | |
| H-HSN | Fluxb | 1978 16 | 103 21 | 6203 15 | 589 31 |
| (Å)c | 0.49 | 2.22 | 0.46 | 3.17 | |
| (Km/s)d | 30 | 137 | 21 | 145 | |
| PHL 293B-HeII | Fluxb | 933 5 | 65 9 | 3247 7 | 375 19 |
| (Å)c | 0.50 | 2 | 0.46 | 3.8 | |
| (Km/s)d | 31 | 123 | 21 | 174 |
(a) Regions as defined in Table 2.
(b) Observed fluxes in units of 10-17 erg s-1 cm-2.
(c) and (d) Observed (= FWHM/2.35) in units of Angstrom and Km/s, respectively
6 The nebular HeII4686 in PHL 293B
Photons with energy beyond 54 eV are needed to ionize He twice, so HeII-emitting objects should host a relatively hard radiation field. While nebular HeII emitters are atypical of nearby galaxies, they are expected to be usual at high-z (z 6) due to the predicted harder UV-ionizing spectra at the lower metallicities typical in the far-away Universe (e.g., Smith, et al., 2015; Stark, 2016; Stanway & Eldridge, 2019). Next generation telescopes (e.g., JWST, ELT) are expected to detect the rest-frame UV of thousands of high-ionizing galaxies in the reionization era. Therefore, studying the HeII-ionization in metal-poor local objects is crucial to illuminate the properties of these reionization-epoch systems.
It is to be noted that the fraction of HeII-emitting systems among metal-poor objects tend to be larger than that for higher metallicity galaxies observed in the local Universe (e.g., Kehrig et al., 2011; Shirazi & Brinchmann, 2012). Ultra luminous X-ray binaries (ULXB), hot massive stars and shocks are among the leading candidate sources discussed in the literature to explain the nebular HeII excitation in nearby SF galaxies (e.g., Garnett, et al., 1991; Kehrig et al., 2011; Shirazi & Brinchmann, 2012; Szécsi, et al., 2015; Senchyna, et al., 2020). However, despite observational and theoretical efforts, the origin of the He+ ionization is far to be a settled matter in several cases (e.g., Garnett, et al., 1991; Kehrig et al., 2015; Kehrig, et al., 2018; Plat, et al., 2019; Kubátová, et al., 2019; Zackrisson & Vikaeus, 2020). Current stellar models keep failing to reproduce the total emergent flux beyond 54 eV, specially in metal-poor galaxies (e.g., Kehrig et al., 2015; Kehrig, et al., 2018; Stanway & Eldridge, 2019).
The existence of narrow HeII4686 emission in PHL 293B has been noted before from long-slit spectroscopy (e.g., Izotov, Thuan & Guseva, 2007; Papaderos et al., 2008; Guseva, et al., 2009; Izotov et al., 2011). Here, we produce the first HeII4686 spectral map of PHL 293B using MEGARA (see Fig. 2). From our data, we checked that the FWHM of the HeII4686 line matches that of other nebular emission lines like the strong [Oiii]5007. The measured values of the mean and standard deviation for the FWHM(HeII)/FWHM([Oiii]5007) ratio are 1.10 and 0.10, respectively. The narrow line profile for the HeII4686 emission and its spatial extent are evidence of its nebular origin (see also Shirazi & Brinchmann, 2012).
PHL 293B was observed with the Chandra X-ray Observatory on 2009 September for a total exposure time of 7.7 ks using the ACIS-S3 detector. There is no detection of X-ray emission up to an upper limit of 31038 erg s-1 (Prestwich, et al., 2013; Terlevich et al., 2014). This indicates that X-ray sources are unlikely to be the main responsible for the He ii ionization in PHL 293B. On the other hand, the BPT line-ratios measured both from the single HeII-emitting spaxels and integrated spectra show values typical of HII region-like ionization (see Fig. 5 and Table 2) indicating hot massive stars as the dominant excitation source. This agrees with Burke, et al. (2020) who claim that the narrow emission gas in PHL 293B is likely the HII region ionized primarily by stellar emission. Wolf-Rayet (WR) emission bumps are not detected in the spectra of PHL 293B. This means that different types of hot stars other than WRs should be contributing to the HeII excitation. This result agrees with the studies of the HeII-emitting extremely metal-poor (XMP) galaxies IZw18 and SBS 0335-052E (see Kehrig et al., 2015; Kehrig, et al., 2018). A detailed comparison of our observations to model predictions would be needed to constrain the hot ionizing stellar population in PHL 293B, but this exercise is beyond the scope of this paper.
For the PHL 293B-HeII spectrum (obtained by adding all the HeII-emitting spaxels; see Fig. 2 and Section 5), we computed the HeII ionizing photon flux, Q(HeII) = 3.661049 photons s-1 (see Table 2), from the corresponding reddening-corrected luminosity L(HeII) using the relation Q(HeII)=L(HeII)/[j(4686)/(HeII)] (assuming case B recombination, and ([Oiii]=2104 K; Osterbrock & Ferland 2006). Applying the same method for the H-HSN region, whose area includes the PHL 293B-HeII region (see Fig. 2 and Section 5 for details) we find that the H-HSN region produces Q(HeII)= 4.161049 photon s-1 (see Table 2). This is 14 higher than Q(HeII) which indicates that some small fraction of gas beyond the PHL 293B-HeII region is also emitting He+-ionizing photons. The PHL 293B-HeII and H-HSN regions, together produce a total Q(HeII) = 7.82 1049 photons s-1 which can be taken as the HeII ionizing budget measured for PHL 293B. It is worth noticing that the PHL 293B-integrated spectrum, created by summing almost all the emission across the MEGARA FOV, does not show the HeII line (see Table 2). In this regard one should bear in mind that searches for reionization-era HeII-emitters, for which only the total integrated spectra will be available, might be biased in the sence shown here,i.e., that a non-detection of the HeII line does not necessarily mean the intrinsic absence of HeII emission.
Using integral field spectroscopy (IFS), we also studied the spatial distribution of the nebular HeII emission for the XMPs SBS 0335-052E and IZw18 (Kehrig et al., 2015; Kehrig, et al., 2016, 2018). When comparing the observed Q(HeII) for different regions across SBS 0335-052E and IZw18, we find, for both objects, that the highest absolute HeII flux and maximum Q(HeII) values correspond to the integrated spectrum of the galaxy, contrary to what we see in PHL 293B. This could suggest that the fraction of HeII-ionizing hot stars, with respect to the total massive stellar content, should be higher in SBS 0335-052E and IZw18 in comparison to the that of PHL 293B, and that a higher amount of He+-ionizing photons is reaching larger distances from the central star clusters in both SBS 0335-052E and IZw18. This might be related to the fact that, although the three objects are very low-Z, the specific star formation rate (sSFR) of SBS 0335-052E and IZw18 (170 Gyr-1 and 166 Gyr-1, respectively; Schneider, Hunt & Valiante, 2016) is 20 times that of PHL 293B sSFR 6 Gyr-1 (Filho, et al., 2013). Of course, higher statistics is necessary to make stronger statements on which properties can be dominant factors to determine the HeII emitting nature of a galaxy.
All the results described above testify the importance of IFS for this kind of analysis, which allows us to collect all HeII emission, and therefore deriving the absolute HeII ionization budget.
7 Summary and conclusions
We have analysed MEGARA observations of the nearby, very metal-deficient galaxy PHL 293B. This kind of objects constitute excellent laboratories for probing the conditions of galaxies in the early universe. The data cover the optical wavelength range ( 3700-6800 Å) within a field-of-view of 12.5 11.3 arcsec2. MEGARA-IFU scans the entire spatial extent of the PHL 293B main body providing us with a new 2D view of the ionized ISM in this galaxy. Maps for the spatial distribution of relevant emission lines, line-ratios and physical-chemical properties for the ionized gas have been discussed. We were able to detect low intensity broad components and P Cygni-like profiles in the Balmer lines in agreement with previous work. We have checked that such components coincide spatially with the brightest star-forming cluster of the galaxy.
The BPT-line ratios ([Oiii]5007/H, [Nii]6584/H, [Sii]6717,6731/H) measured both from individual spaxels and integrated spectrum regions agree with HII-like ionization. We measured the [Oiii]4363 line flux over the central parts of the galaxy covering an area of 0.12 kpc2. For this zone, we measured O/H directly from the derived electron temperature Te[OIII], and we find no significant variations in oxygen abundance; most of spaxels have 12+log(O/H) values spanning around 7.5–7.6. For the first time, we derive the PHL 293B integrated spectrum by summing the spaxels with H S/N 3. We take the O/H abundance of the PHL 293B integrated spectrum, 12+log (O/H)=7.64 0.06 8 solar metallicity, as the representative metallicity of the galaxy. Such value concurs with the ones on a spaxel-by-spaxel basis, and it also matches with those found in the literature.
Here, we derive the first spectral map for the nebular HeII4686 line and compute the HeII ionization budget in PHL 293B. Our observations together with data from the literature indicate that neither Wolf-Rayet stars nor X-ray binaries are the main responsible for the HeII ionization in PHL 293B. This is in the line of our studies on the two XMPs SBS 0335-052E and IZw18 based on IFS. Additional IFS studies of large samples of very metal-deficient and nebular HeII-emitters are needed to better understand the nature of these objects.
Acknowledgements
Based on observations made with the Gran Telescopio Canarias (GTC), instaled in the Spanish Observatorio del Roque de los Muchachos of the Instituto de Astrofísica de Canarias, in the island of La Palma. This work is (partly) based on data obtained with MEGARA instrument, funded by European Regional Development Funds (ERDF), through Programa Operativo Canarias FEDER 2014-2020. We thank the referee for a helpful report and thank M.A. Guerrero for useful disussion. We acknowledge financial support from the Spanish Ministry of Economy and Competitiveness under grant AYA2016-75808-R, which is partly funded by the European Regional Development Fund, and from the Excellence Network MagNet (AYA2017-90589-REDT). This work has been partially funded by research project AYA2016-79724-C4-4-P from the Spanish PNAYA. CK, JIP, JVM, SDP and EPM acknowledge financial support from the State Agency for Research of the Spanish MCIU through the ”Center of Excellence Severo Ochoa” award to the Instituto de Astrofísica de Andalucía (SEV-2017-0709)
Data Availability
The data underlying this article are part of the MEGARA commissioning observations and are available in the article.
References
- Allan et al. (2020) Allan A., et al., 2020, arXiv:2003.02242
- Asplund et al. (2009) Asplund M., et al., 2009, ARA&A, 47, 481
- Baldwin, Phillips, & Terlevich (1981) Baldwin J. A., Phillips M. M., Terlevich R., 1981, PASP, 93, 5
- Burke, et al. (2020) Burke C. J., et al., 2020, arXiv:2002.12369
- Cairós et al. (2001) Cairós L. M., et al., 2001, ApJS, 136, 393
- Cairós et al. (2009) Cairós L. M., et al., 2009, A&A, 507, 1291
- Cairós et al. (2010) Cairós L. M., et al., 2010, A&A, 520, A90
- Carrasco et al. (2018) Carrasco E. et al., 2018, Proceedings of the SPIE, Volume 10702, p.1070216
- Duarte Puertas, et al. (2019) Duarte Puertas S., et al., 2019, A&A, 629, A102
- Fernández et al. (2018) Fernández V., et al., 2018, MNRAS, 478, 5301
- Filho, et al. (2013) Filho M. E., et al., 2013, A&A, 558, A18
- French (1980) French H. B., 1980, ApJ, 240, 41
- Garnett (1990) Garnett D. R., 1990, ApJ, 363, 142
- Garnett, et al. (1991) Garnett D. R., et al., 1991, ApJ, 373, 458
- Gil de Paz et al. (2018) Gil de Paz A. et al., 2018, Proceedings of the SPIE, Volume 10702, p.1070217
- Guseva, et al. (2017) Guseva N. G., et al., 2017, A&A, 599, A65
- Guseva, et al. (2009) Guseva N. G., et al., 2009, A&A, 505, 63
- Hägele, et al. (2008) Hägele G. F., et al., 2008, MNRAS, 383, 209
- Izotov & Thuan (1999) Izotov Y. I., Thuan T. X., 1999, ApJ, 511, 639
- Izotov, et al. (1999) Izotov Y. I., et al., 1999, ApJ, 527, 757
- Izotov, Chaffee & Green (2001) Izotov Y. I., Chaffee F. H., Green R. F., 2001, ApJ, 562, 727
- Izotov, et al. (2004) Izotov Y. I., et al., 2004, A&A, 421, 539
- Izotov et al. (2006a) Izotov Y. I., et al., 2006a, A&A, 448, 955
- Izotov, et al. (2006b) Izotov Y. I., et al., 2006b, A&A, 459, 71
- Izotov, Thuan & Guseva (2007) Izotov Y. I., Thuan T. X., Guseva N. G., 2007, ApJ, 671, 1297
- Izotov et al. (2011) Izotov Y. I., et al., 2011, A&A, 533, A25
- Izotov & Thuan (2009) Izotov Y. I., Thuan T. X., 2009, ApJ, 690, 1797
- Izotov, Thuan, & Guseva (2012) Izotov Y. I., Thuan T. X., Guseva N. G., 2012, A&A, 546, A122
- Izotov, et al. (2018) Izotov Y. I., et al., 2018, MNRAS, 473, 1956
- Izotov, Thuan & Guseva (2019) Izotov Y. I., Thuan T. X., Guseva N. G., 2019, MNRAS, 483, 5491
- James et al. (2017) James B. L., et al., 2017, MNRAS, 465, 3977
- Kauffmann et al. (2003) Kauffmann G., et al., 2003, MNRAS, 346,1055
- Kehrig, Telles, & Cuisinier (2004) Kehrig C., Telles E., Cuisinier F., 2004, AJ, 128, 1141
- Kehrig et al. (2006) Kehrig C., et al., 2006, A&A, 457, 477
- Kehrig et al. (2008) Kehrig C., et al., 2008, A&A, 477, 813
- Kehrig et al. (2011) Kehrig C.,Oey M. S., Crowther P. A. et al., 2011, A&A, 526, A128
- Kehrig et al. (2013) Kehrig C., et al., 2013, MNRAS, 432, 2731
- Kehrig et al. (2015) Kehrig C., et al., 2015, ApJ, 801, L28
- Kehrig, et al. (2016) Kehrig C., et al., 2016, MNRAS, 459, 2992
- Kehrig, et al. (2018) Kehrig C., et al., 2018, MNRAS, 480, 1081
- Kewley et al. (2001) Kewley L.J., et al., 2001, ApJ, 556, 121
- Kobulnicky & Skillman (1996) Kobulnicky H. A., Skillman E. D., 1996, ApJ, 471, 211
- Kinman & Davidson (1981) Kinman T. D., Davidson K., 1981, ApJ, 243, 127
- Kubátová, et al. (2019) Kubátová B., et al., 2019, A&A, 623, A8
- Lehnert, et al. (2015) Lehnert M. D., van Driel W., Le Tiran L., Di Matteo P., Haywood M., 2015, A&A, 577, A112
- López-Sanjuan, et al. (2019) López-Sanjuan C., et al., 2019, A&A, 631, A119
- Luridiana, Morisset & Shaw (2015) Luridiana V., Morisset C., Shaw R. A., 2015, A&A, 573, A42
- Mainali, et al. (2018) Mainali R., et al., 2018, MNRAS, 479, 1180
- Markwardt (2009) Markwardt, C. B., 2009, Astronomical Data Analysis Software and Systems XVIII, 411, 251
- Miller & Mathews (1972) Miller J. S., Mathews W. G., 1972, ApJ, 172, 593
- Osterbrock & Ferland (2006) Osterbrock D. E., Ferland G. J., 2006, Astrophysics of Gaseous Nebulae and Active Galactic Nuclei (CA: University Science Books)
- Papaderos, et al. (2006) Papaderos P., et al., 2006, A&A, 454, 119
- Papaderos et al. (2008) Papaderos P., et al., 2008, A&A, 491, 113
- Mollá et al. (2006) Mollá M., et al., 2006, MNRAS, 372, 1069
- Pascual et al. (2019) Pascual S., et al., 2019, Highlights on Spanish Astrophysics X, Salamanca, Spain, p.227
- Pérez-Montero et al. (2009) Pérez-Montero E., et al., 2009, A&A, 497, 53
- Pérez-Montero et al. (2011) Pérez-Montero E., et al., 2011, A&A, 532, A141
- Pérez-Montero (2017) Pérez-Montero E., 2017, PASP, 129, 043001
- Pilyugin et al. (2006) Pilyugin L. S., et al., 2006, MNRAS, 370, 1928
- Plat, et al. (2019) Plat A., et al., 2019, MNRAS, 490, 978
- Prestwich, et al. (2013) Prestwich A. H., et al., 2013, ApJ, 769, 92
- Sánchez, et al. (2012) Sánchez S. F., et al., 2012, A&A, 538, A8
- Sánchez (2020) Sánchez S. F., 2010, ARA&A, 58, annurev
- Schneider, Hunt & Valiante (2016) Schneider R., Hunt L., Valiante R., 2016, MNRAS, 457, 1842
- Schlafly & Finkbeiner (2011) Schlafly E. F., Finkbeiner D. P., 2011, ApJ, 737, 103
- Senchyna, et al. (2019) Senchyna P., et al., 2019, MNRAS, 488, 3492
- Senchyna, et al. (2020) Senchyna P., et al., 2020, MNRAS, 494, 941
- Shirazi & Brinchmann (2012) Shirazi M., Brinchmann J., 2012, MNRAS, 421, 1043
- Smith, et al. (2015) Smith A., et al., 2015, MNRAS, 449, 4336
- Sobral, et al. (2019) Sobral D., et al., 2019, MNRAS, 482, 2422
- Stanway & Eldridge (2019) Stanway E. R., Eldridge J. J., 2019, A&A, 621, A105
- Stark (2016) Stark D. P., 2016, ARA&A, 54, 761
- Szécsi, et al. (2015) Szécsi D., et al., 2015, A&A, 581, A15
- Tenorio-Tagle, et al. (2015) Tenorio-Tagle G., et al., 2015, ApJ, 800, 131
- Terlevich et al. (2014) Terlevich R., et al., 2014, MNRAS, 445, 1449
- Thuan, Izotov & Lipovetsky (1995) Thuan T. X., Izotov Y. I., Lipovetsky V. A., 1995, ApJ, 445, 108
- Thuan, Izotov & Foltz (1999) Thuan T. X., Izotov Y. I., Foltz C. B., 1999, ApJ, 525, 105
- Thuan & Izotov (2005) Thuan T. X., Izotov Y. I., 2005, ApJS, 161, 240
- Ucci, et al. (2019) Ucci G., et al., 2019, MNRAS, 483, 1295
- van Zee & Haynes (2006) van Zee L., Haynes M. P., 2006, ApJ, 636, 214
- Westera et al. (2004) Westera P., et al., 2004, A&A, 423, 133
- Yan, et al. (2016) Yan R., et al., 2016, AJ, 151, 8
- Zackrisson & Vikaeus (2020) Zackrisson E., Vikaeus A., 2020, IAUS, 341, 187