The dynamics of the broad-line region in NGC 3227
Abstract
Archival Hubble Space Telescope (HST) observations of the Seyfert 1 nucleus of NGC 3227 obtained with the Space Telescope Imaging Spectrograph (STIS) are re-examined in order to constrain a viable photoionization model for the broad-line region (BLR). The results imply that the BLR is a partially ionized, dust-free, spherical shell that is collapsing, supersonically, at the free-fall velocity due to its proximity to a supermassive black hole. The BLR is ionization bounded at the outer radius, coincident with the dust reverberation radius, and transforms into an X-ray emitting plasma inside the Balmer reverberation radius as the central UV–X-ray source is approached. Only 40 M☉ of Hydrogen are required to explain the Balmer emission line luminosity, but it is compressed by gravity into a column measuring 5.5 1024 atoms cm-2. Assuming radiatively inefficient accretion, the X-ray luminosity requires 10-2 M☉ yr-1. However, the mass inflow rate required to explain the luminosity of the broad H emission line is 1 M☉ yr-1. The very large disparity between these two estimates indicates that 99% of the inflowing gas must be re-directed into an outflow, and on a very short timescale corresponding to 40 years. Alternatively, the radiative efficiency of the inflow has been overestimated, or the X-ray luminosity has been underestimated; a distinct possibility if the BLR is indeed Compton thick.
keywords:
galaxies: Seyfert, galaxies: individual (NGC3227)1 Introduction
Fortuitously, nature has provided a relatively unobscured view of the Seyfert 1 nucleus in the spiral galaxy NGC 3227, at least at visible wavelengths (Crenshaw et al., 2001). This circumstance is afforded by the favourable inclination of both the host galaxy and the unresolved dust torus (Alonso-Herrero et al., 2011). Consequently, observations obtained with the Space Telescope Imaging Spectrograph (STIS) aboard the Hubble Space Telescope (HST) reveal the emergent visible spectrum of the nucleus with unprecedented clarity and at an angular resolution that effectively excludes the galaxy starlight with an efficacy that is presently unmatched by any other telescope on or off the planet (Devereux, 2013, hereafter D13).
According to Rubin & Ford (1968), who published the first visible spectrum, NGC 3227 was among the original group of objects identified by Seyfert, but it was not included in Seyfert (1943). Subsequently, it became apparent that the broad Balmer emission lines are time-variable (Pronik, 2009; Rosenblatt et al., 1992, 1994, and references therein). Modern measurements of the time-delay between correlated changes in the brightness of the broad H emission line and the adjacent continuum led to a measure of physical size corresponding to 1 light-day (Rosa et al., 2018). However, because only 10% of the broad H line flux actually varies, it is not clear what this size refers to exactly. Besides, there are other physical properties that remain to be established such as gas density, volume filling factor, metallicity, and geometry, parameters that are central to understanding the current dynamical state of the BLR, its origin and subsequent evolution.
Broad emission lines are a defining characteristic of active galactic nuclei (AGN), and a considerable literature has evolved over the past several decades identifying them, in particular, with dense broad-line clouds. Intriguingly, dense clouds do appear to be present in the BLR of NGC 3227, but they are not as dense as previously imagined, and they are few in number, at least along our line of sight to the central X–ray source (Lamer et al., 2003; Beuchert et al., 2015; Turner et al., 2018). Consequently, an alternative explanation is explored here whereby the broad Balmer emission lines are identified with an H+ region that is photoionized by the central UV–X-ray source, akin to the H ii regions commonly observed in association with planetary nebulae, supernova remnants and massive star forming regions, but with a much higher ionization parameter.
HST observations reveal a distinctly triangular shape for the broad H emission line (D13) that has apparently persisted for three decades since the first published spectrum (Rubin & Ford, 1968). The shape represents the convolution of the Balmer emissivity with a velocity field and a geometry for the ionized gas, none of which are presently known. This is because the BLR is unresolved (< 17 10-3 arc sec ) and is likely to remain so for many decades to come. However, some useful constraints can be deduced from existing observations. Firstly, most, if not all, of the H ionizing photons produced by the central UV-X–ray source are accounted for by the broad Balmer emission line luminosity. Therefore, the H+ region producing the broad Balmer emission lines seen in NGC 3227 has a very high covering factor, suggesting an approximately spherical distribution for the ionized gas (D13). Secondly, the inner radius of the H+ region emitting the Balmer emission lines coincides with the Balmer reverberation radius 1 light-day (Rosa et al., 2018), whereas the outer radius of the H+ region is coincident with the dust reverberation radius corresponding to 20 light-day (Suganuma et al., 2006; Koshida et al., 2014). Thus, the BLR in NGC 3227 is essentially a photoionized dust-free spherical shell of H+ gas with filling factor 1 (D13). Insofar as the outer boundary of the H+ region in NGC 3227 is coincident with the dust reverberation radius, the BLR model is similar to that proposed by Netzer & Laor (1993), but differs with respect to the notion of clouds.
Estimates for the central black hole (BH) mass based on reverberation mapping have been steadily declining in recent years to a value M∙ = 4 106 M☉ (Rosa et al., 2018; Peterson et al., 2004, and references therein), similar to that obtained using the prescription of Greene & Ho (2005) but smaller than prior estimates based on stellar and gas kinematics (Davies et al., 2006; Hicks & Malkan, 2008). Nevertheless, combining the most recent BH mass estimate together with the bolometric luminosity, Lbol = 1.9 1043 erg/s (Winter et al., 2012), corrected for the slightly larger distance of 20.8 Mpc adopted here (Tully, 1988), leads to an Eddington luminosity ratio Lbol/LEdd 4 10-2. The diminutive value for this ratio implies that any matter divested of angular momentum will inevitably fall inwards, supersonically, at the free-fall velocity, because the radiation force is too small, by over one order of magnitude, to withstand the gravitational force of the central BH. Observationally, the luminosity of the central UV–X-ray source implies a ballistic mass inflow rate 10-2 M☉/yr assuming radiatively inefficient accretion (D13).
High angular resolution (0.2 arc sec) spectroscopy of the BLR in NGC 3227 has been obtained with STIS on two separate occasions (D13). The first in 1999 used the G750M grating to obtain a well sampled (0.56 Å pixel-1) spectrum of the broad H emission line. On the second occasion in 2000, STIS was used to obtain a less well sampled (4.92 Å pixel-1) spectrum using the G750L grating, in addition to contemporaneous spectra with the G430L, G230L and G140L gratings. NGC 3227 is just one of a few AGN with HST spectra spanning the visible to the UV (Spinelli et al., 2006).
This paper reports the results of using the computer code XSTAR (Kallman & Bautista, 2001) to model photoionization of the H+ region in an effort to constrain the physical and dynamical state of the BLR gas. Of particular interest is whether the combination of outward radiation pressure and gas pressure is sufficient to overcome the inward gravitational force given the proximity of the BLR to a several million solar mass BH. The present analysis involves modelling the shape and luminosity of the broad H emission line with two important refinements on the previous work (D13). First, rather than assuming a Balmer emissivity, it is calculated explicitly using the photoionization code XSTAR for a parameter space defined by a variety of densities and radial distributions for the ionized gas. Secondly, the analysis explores two plausible kinematic models for the BLR gas that can potentially be distinguished, namely randomly oriented circular orbits and radial motion at the escape velocity. On the one hand, inferences regarding the kinematic state of the BLR gas that are based on reverberation mapping studies are inconclusive (Rosa et al., 2018). On the other hand, one would expect a measurable, factor of , difference in the full-width at half-maximum (FWHM) of emission lines produced by BLR gas that is distributed in randomly oriented circular orbits versus radial motion at the escape velocity, with the former narrower than the latter, all other parameters being equal. An objective of the present work, therefore, is to explore to what extent the distinctive shape observed for the broad H emission line seen in NGC 3227 can distinguish between different kinematic models for the BLR gas.
The outline for the paper is as follows. In the next section, a model for the emergent spectrum of the H+ region, synonymous now with the BLR, is computed using the photoionization code XSTAR. The emergent spectrum depends in large part on the shape and amplitude of the unobservable H ionizing continuum, models for which can be constrained using prior HST observations (D13), as explained in Section 2.1. The dust extinction to the intrinsic continuum can be inferred by comparing it with the emission-line-free continuum observed with HST, as explained in Section 2.2. It is demonstrated in Section 2.3 that the H/H emission line ratio observed with HST is consistent with little or no visible dust extinction to, or within, the BLR. Consequently, the shape and luminosity of the bright H emission line can be used to constrain XSTAR photoionization models as explained in Section 2.4. Having determined the overall geometry and ionization structure for the BLR allows the dynamics to be explored as discussed in Section 3. Conclusions follow in Section 4.
2 Photoionization modelling
2.1 The intrinsic ionizing continuum
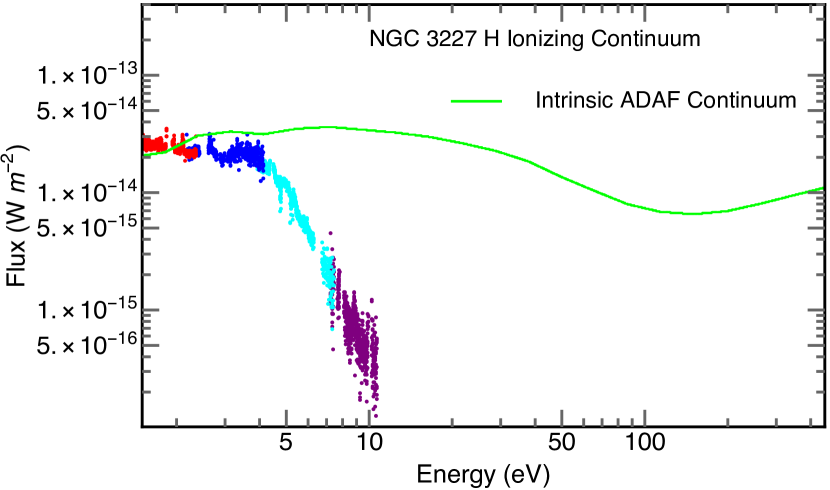
Regrettably, the intrinsic H ionizing continuum is unobservable due to the large column of intervening neutral H gas. However, the shape and amplitude can be constrained because it must connect sensibly with the observed visible continuum and produce enough ionizing photons to explain the broad H emission line luminosity (see equation 1 in D13). Vasudevan & Fabian (2009) proposed a H ionizing continuum for NGC 3227 consisting of a modified blackbody and a power law. But, numerically integrating that continuum produces about a factor of 6 too few H ionizing photons to explain the broad Balmer emission line luminosity, and so it was not considered further. Naively fitting a power law of the form to the emission-line-free visible continuum observed with the G750L and G430L gratings (see Fig. 1) yields = 1.3, and a factor of 3 too few H ionizing photons. One can therefore infer that the intrinsic ionizing continuum must have a shallower slope, similar to that produced by an advection dominated accretion flow (ADAF), a possibility anticipated by Markowitz et al. (2009). Computing an ADAF continuum explicitly for NGC 3227 is beyond the scope of the present paper. Instead, the ADAF continuum computed for NGC 3998 by Nemmen et al. (2014)111https://figshare.com/articles/Spectral_models_for_low-luminosity_active_galactic_nuclei_in_LINERs/4059945 was adopted to represent the shape of the H ionizing continuum in NGC 3227. The spectrum was subsequently scaled by a factor of 6.31 to produce an ionizing luminosity, = 5.67 1042 erg s-1, integrated between 1 and 1000 Ryd, yielding 4.76 1052 H ionizing photons s-1, superseding a prior estimate (D13). Figure 1 illustrates the intrinsic H ionizing continuum in the context of the emission-line-free visible–UV continuum of NGC 3227 observed with STIS. The intrinsic and observed continua intersect at visible wavelengths but deviate systematically at shorter wavelengths indicative of significant reddening.
2.2 UV dust extinction to the central continuum source
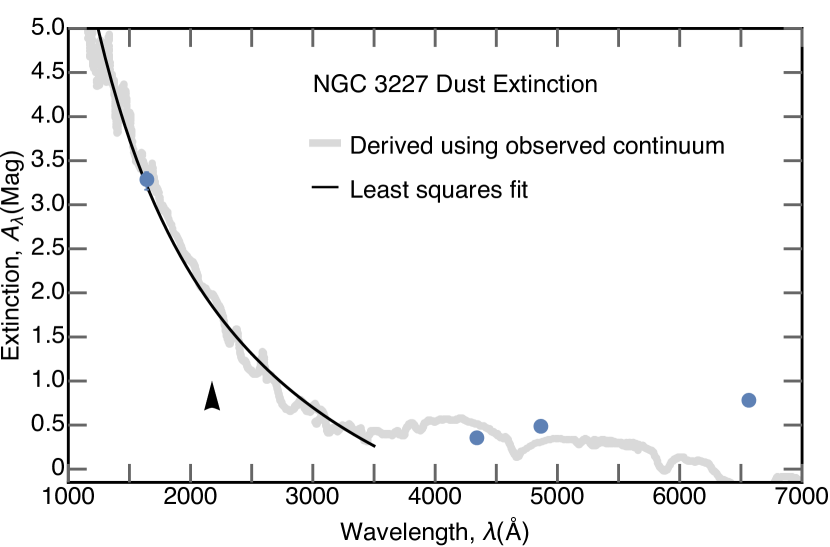
The dust extinction Aλ, illustrated in Fig. 2 as a function of wavelength , was derived by comparing the visible–UV emission line-free continuum observed with HST to the incident ADAF continuum described in the previous section. Aλ is represented by a function defined most recently by Devereux (2019). As Fig. 2 illustrates, the dust extinction exhibits a steep inverse dependence on wavelength in the UV. A least squares fit to the extinction derived using just the emission-line-free continua observed with the G140L and G230L gratings yields
| (1) |
The rest-frame dust extinction described by equation 1 is not quite as steep in the UV compared to a prior and independent determination by Crenshaw et al. (2001), but there is agreement on the conspicuous absence of the 2175 Å feature seen in Galactic extinction curves (Cardelli et al., 1989). Fig. 2 indicates that the observed visible continuum is dominated by starlight at the longest wavelengths and therefore provides an increasingly unreliable measure of the dust extinction to the central continuum source at 3500 Å.
2.3 Dust extinction to the broad Balmer emission lines
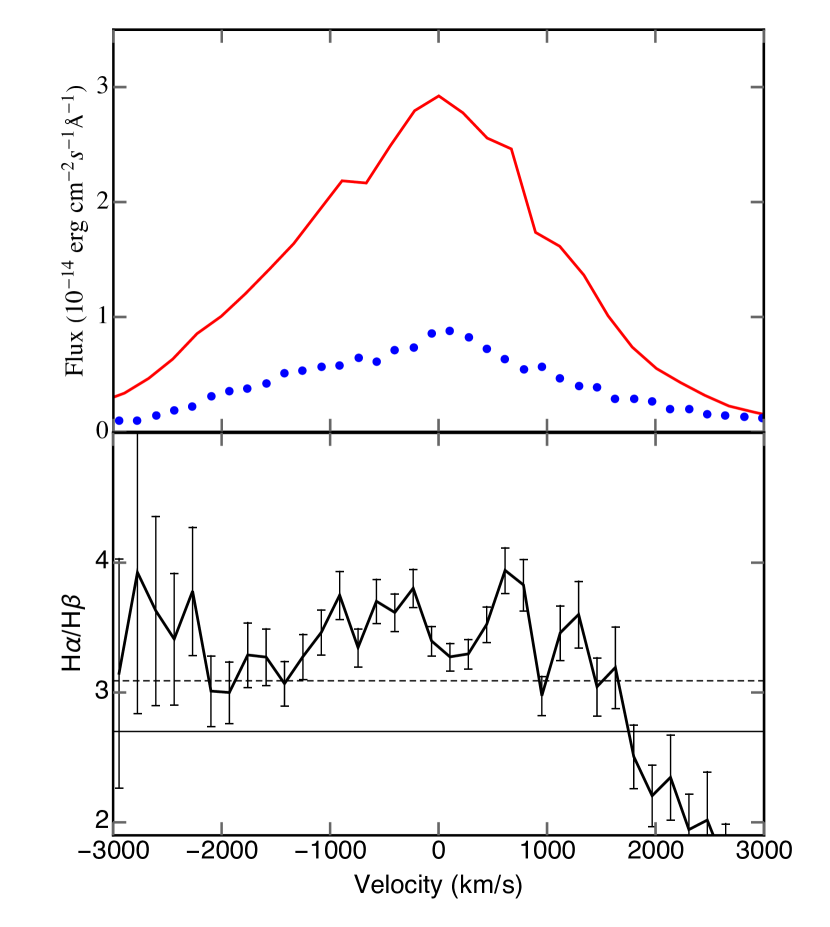
Comparing contemporaneous observations of the H and H emission lines, described previously in D13, potentially reveals the dust extinction to the H+ region from which the lines originate. Furthermore, the Balmer lines are broad and sufficiently resolved to examine the dust extinction within the H+ region by adopting velocity as a proxy for radial distance from the central BH. The lower panel in Figure 3 illustrates that the observed mean H/H ratio, computed by interpolating the H flux to the same velocities at which the H flux was measured, is 3.1 0.7 and not statistically significantly different from the ratio of 2.7 expected for a low density 104 cm-3 H+ region, and is consistent, to first order, with an insignificant colour excess corresponding to 0.2 mag. Thus, both the shape and luminosity of the broad H emission line are, to first order, unaffected by dust extinction. That makes them useful observational constraints with which to distinguish between various XSTAR photoionization models.
2.4 XSTAR photoionization modelling results
XSTAR is a computer code that predicts the emergent spectrum for a photoionized gas.222https://heasarc.gsfc.nasa.gov/xstar/docs/html/xstarmanual.html Version 2.39 of XSTAR was used to simulate the effect of photoionizing spherically symmetric balls of neutral H gas with various radial number density distributions described by = where is the number density at an inner radius , and is the radial distance from the photoionizing source. The inner radius is parameterized within XSTAR in terms of the ionization parameter at the inner radius, = /() with defined in Section 2.1. Physically, the inner radius represents the transition from a photoionized gas to an X-ray emitting plasma as the central UV–X-ray source is approached. Empirically, has been found to coincide with the Balmer reverberation radius (D13).
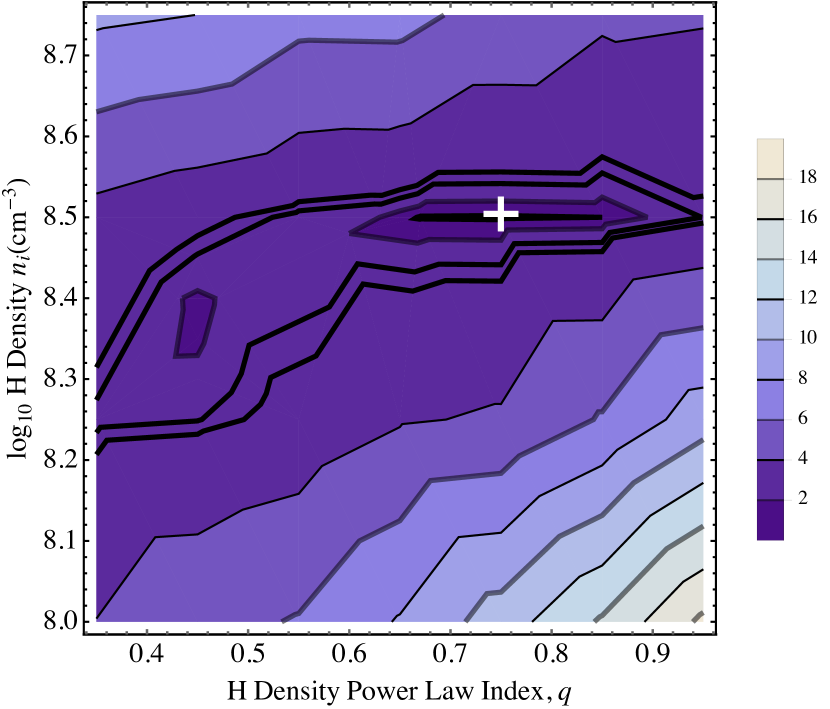
Figure 4 presents a grid of models spanning 0.35 0.95 and 8 log10 (cm-3) 8.75 at = 10-3 pc. All of the models considered are ionization bounded with unity covering and filling factors. No constraint was imposed on the gas pressure, the gas temperature or the H column density. Each photoionization model employs solar abundances limited to H, He, C, N, O, Ne, Mg, S and Fe, elements for which emission lines are seen in the HST spectra. Limiting the number of elements hastens the computations with no significant difference in results compared to those obtained using the complete suite.
Each photoionization model produces a unique radial dependence for the Balmer emissivity that serves as a probability distribution for computing a model H emission line. Briefly, the collective H emission expected from a spherical distribution of points was created by sampling the probability distribution at a variety of random radii, , that, assuming Newtonian kinematics, translates into a number distribution of velocities which is subsequently projected into a spherical coordinate system by randomly sampling azimuth angles 0 2 in the plane and elevation angles -/2 /2 measured from the plane to the -axis. All the points were then binned into a histogram of radial velocities at the same velocity resolution as the HST observations.
A spherically symmetric model that is randomly sampled in results in a uniform surface density of points producing broad emission lines that are rectangular in shape (Devereux & Shearer, 2007; Pancoast et al., 2011). However, when observed at the highest spectral resolution with HST, the broad H emission line appears to be distinctly triangular in shape which, as demonstrated previously (D13), can be replicated by randomly sampling rather than . This causes points to congregate at the poles of the sphere resulting in an order of magnitude higher surface density compared to the equator. In the context of radial motion, points located near the poles are moving essentially perpendicular to the line-of-sight, producing a peak in the histogram of radial velocities at 0 kms-1. The height of the peak, equivalent to the intensity of the emission line at zero velocity, is determined by the outer radius of the spherical volume containing the points. Since the XSTAR photoionization models are ionization bounded, the outer radius is marked by a sharp decline in the Balmer emissivity coincident with the Strömgren radius (Strömgren, 1939; Osterbrock, 1989). Similarly, the inner radius is caused by a downturn in the Balmer emissivity caused by an increase in ionization as the central UV–X-ray source is approached. Thus, the inner and outer radii are not free parameters as they are in most other BLR models in the published literature. Consequently, there are just three free parameters; , , and to be constrained by comparing the observed broad H emission line, shape and luminosity, with model ones using the statistic.
The photoionization modelling results are summarized in Fig. 4 which displays contours of the reduced statistic
| (2) |
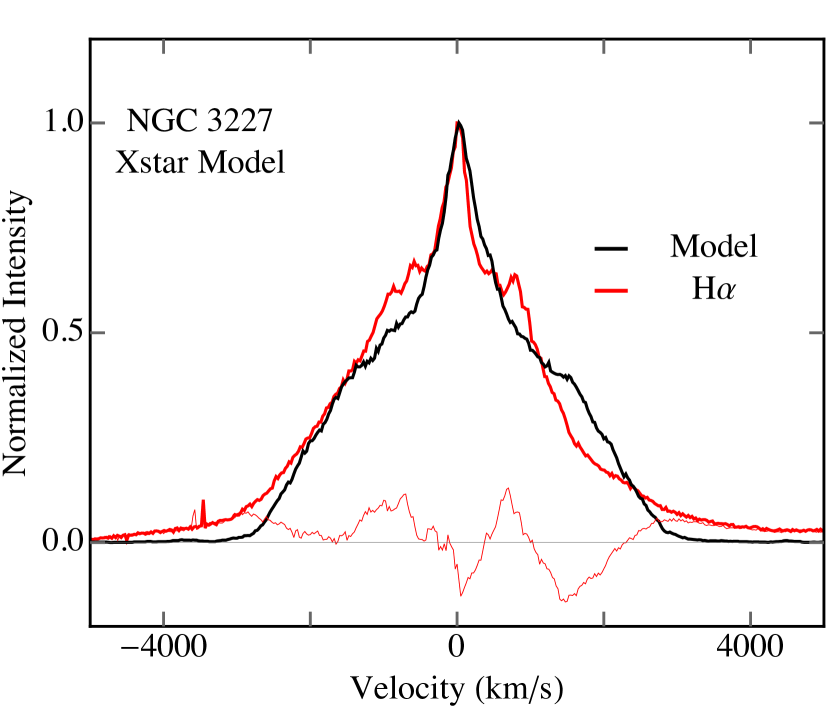
which was computed by comparing the normalized shape of the model H emission line, , with the observed one, at each of = 471 data points. The uncertainty, , in the observed normalized line profile intensities is estimated to be 4% based on noise in the spectrum. Collectively, there are three parameters of interest ( , , ) and degrees of freedom where = 471 data points - 3 parameters - 1. The summation was performed over the velocity span of the broad H line depicted in Figure 5.
2.4.1 Radial motion at the escape velocity
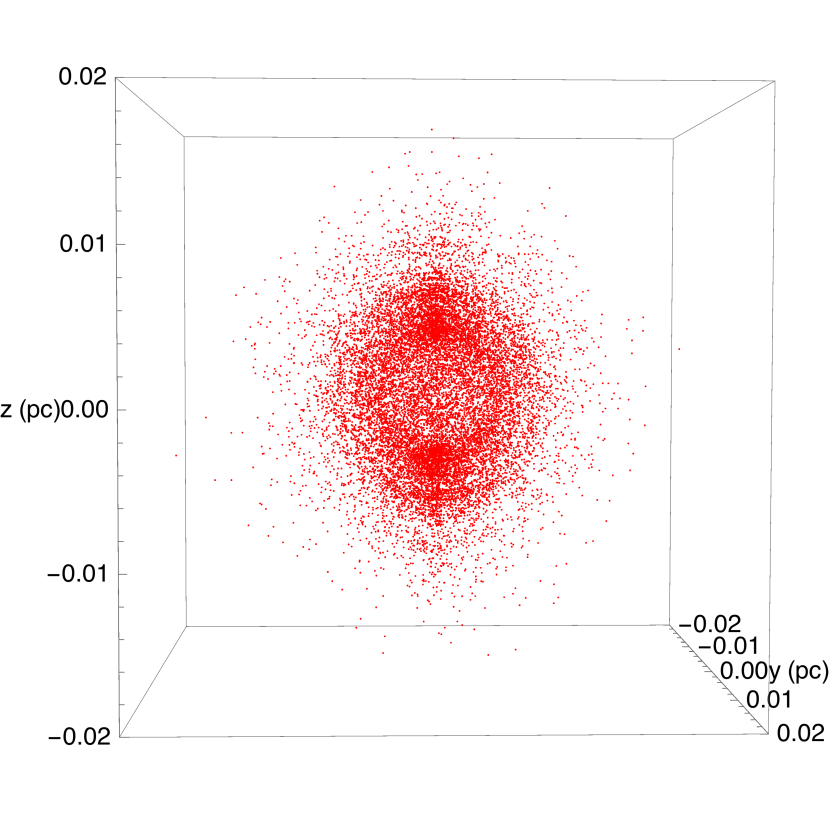
The XSTAR photoionization model that best reproduces the triangular shape observed for the H emission line is defined by the XSTAR parameters log10 (cm-3) = 8.5, log10 (erg cm s-1) = 3.3, = 0.75 corresponding to the location of minimum =1.5 in Fig. 4. The resulting model H emission line shape (Fig. 5) depicts the line-of-sight velocity for 20458 points moving radially at the escape velocity
| (3) |
where is the sum of the BH mass and the surrounding stars (D13), interior to an ionization bounded spherical volume that has an outer radius 0.02 pc. Visually, the resulting distribution of points looks rather like the Greek symbol as illustrated in Fig. 6. The Balmer emissivity determines most of the visible structure, including the radial extent of the points and the bright ring, whereas the linear feature illustrates the crowding of points at the poles, a consequence of heuristically distributing the points randomly in , as opposed to in order to obtain a triangular emission line profile shape. A symmetric emission line results from a bi-symmetry in the line-of-sight velocity, depicted for a subset of the points in Fig. 7, and described by
| (4) |
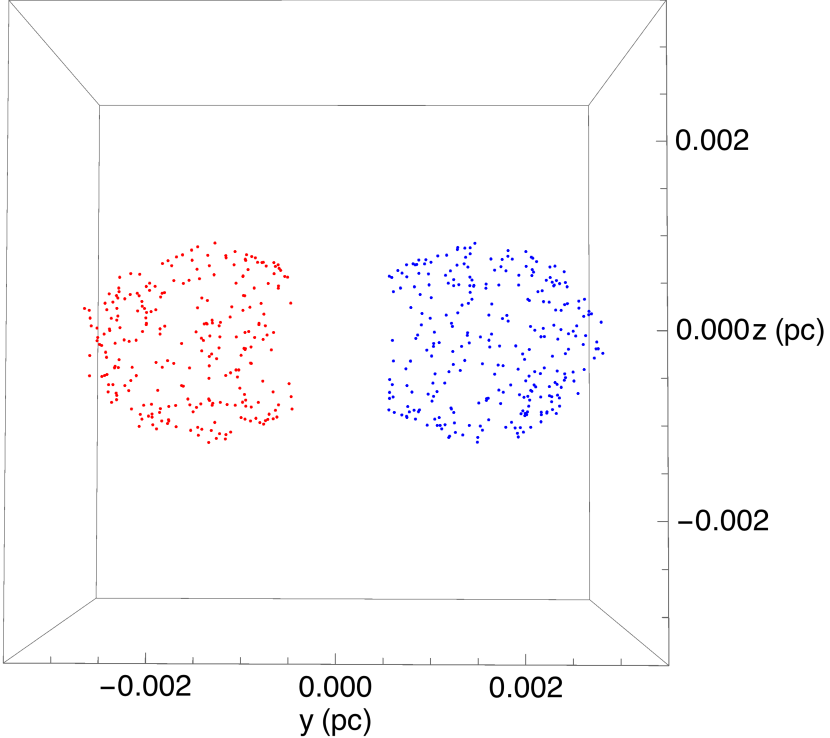
Isovelocity contours manifest as double lobes when viewed along an axis that is perpendicular to the line-of-sight, one lobe is redshifted and the other blueshifted. However, when viewed along the line-of-sight, the two lobes appear to be superimposed with the red-lobe nearest the observer for an inflow, and vice-versa for an outflow. The model H emission line illustrated in Fig. 5 represents the superposition of many such lobes, or more precisely, nested isovelocity surfaces that span the full range of observed velocities.
2.4.2 Dust extinction to the BLR
The XSTAR photoionization model described above also predicts the emergent luminosities for numerous emission lines including H, H, H and He ii 1640, which can be directly compared with HST observations to infer dust extinction to the BLR (Table 1). Including only the bright H and He lines and excluding several bright metal lines is a hedge against the unknown metallicity for the BLR gas. Besides, the bright permitted UV emission lines, Mg ii 2798, C iv 1548 and Ly are too strongly self-absorbed to be of any use for quantitative analysis. The results, illustrated in Fig. 2, show that at the wavelength of He ii 1640, the dust extinction to the BLR gas is 3.3 mag, identical to that inferred using the ADAF continuum (Section 2.2). The extinction diminishes considerably to an average 0.5 0.2 mag in the visible based on the broad H, H, H emission lines. H was not included in the analysis because it is faint and potentially blended with (D13). Overall, the dust extinction to the broad emission lines in the visible is consistent with being independent of wavelength with the remaining uncertainty due to the model not reproducing the extinction corrected Balmer emission line luminosities to an accuracy better than 15%.
| Linea | Observed | XSTAR | Extinction |
|---|---|---|---|
| 1040 erg s-1 | 1040 erg s-1 | mag | |
| (1) | (2) | (3) | (4) |
| H 6564 | 9.54 | 19.74 | 0.79 |
| H 4862 | 2.40 | 3.70 | 0.47 |
| H 4341b | 0.76 | 1.04 | 0.34 |
| He ii 1640 | 0.06 | 1.38 | 3.27 |
-
a
Quoted wavelengths are rest-frame vacuum in Å
-
b
H is blended with 4364 the incomplete subtraction of which may bias the extinction estimate.
2.4.3 Randomly oriented circular orbits
For the purposes of comparison, another grid of model H emission line profiles was computed covering the same (, , ) parameter space as illustrated in Fig. 4 but employing a different kinematic law, one that describes randomly oriented circular orbits. Comparing each model H emission line with the observed one yielded a minimum = 1.5 corresponding to the XSTAR model parameters log10 (cm-3) = 8.75, log10 (erg cm s-1) = 3.05, and = 0.35. By comparison with radial motion at the escape velocity, randomly oriented circular orbits require an H+ region with a combination of higher density and smaller radius to widen the model H emission lines sufficiently to compensate for the factor of intrinsically smaller FWHM. Although the higher density model produced an H emission line shape that is statistically indistinguishable from the observed one illustrated in Fig. 5, XSTAR also predicts luminosities for the H, H, H and He ii 1640 emission lines that, by comparison with the HST/STIS observations, imply a shape for the dust extinction curve that is steep in the visible and flat in the UV. Such an unusual shape for the dust extinction curve has been inferred for other AGN (Gaskell et al., 2004). However, the predicted reddening in the visible, corresponding to = 0.75 mag, is inconsistent with the observed H/H ratio (Fig. 3, Section 2.3). Consequently, this higher density XSTAR model involving randomly oriented circular orbits is not considered further.
3 Discussion
Analysis of the broad H emission line in NGC 3327 (Section 2.4) suggests that the BLR has little angular momentum. This is because the kinematic model that best describes the broad H emission line shape involves radial motion at the escape velocity. The question as to whether the radial motion represents an inflow or an outflow can be addressed using the equation of hydrostatic equilibrium, which entails understanding the physical conditions inside the H+ region.
3.1 Physical conditions within the H+ region
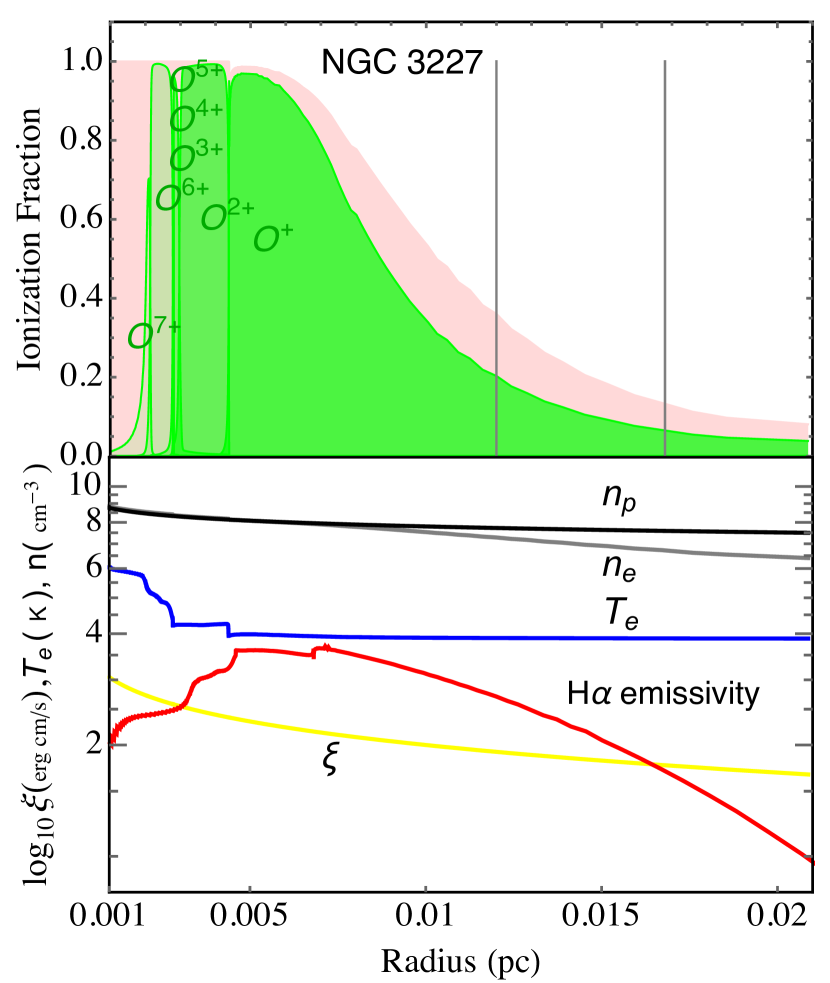
The broad H emission line has a full-width at zero-intensity (FWZI) corresponding to 7000 km/s rest-frame (Fig. 5). This finite width can be understood in terms of a precipitous decline in the Balmer emissivity that is caused by an equally dramatic increase in the electron temperature as the central UV–X-ray source is approached. These trends are illustrated in Fig. 8 along with the radial dependence for several other important physical parameters.
The inner radius of the H+ region is coincident with the empirically determined Balmer reverberation radius (Rosa et al., 2018), corresponding to a physical size of 10-3 pc. At this radius H is fully ionized with an electron temperature of 106 K and a number density of 3 108 cm-3, but the ionization fraction decreases dramatically with increasing radius. As a result the H+ region is partially ionized over 98% of its volume, a phenomenon caused by the large H column, NH = 5.5 1024 atoms cm-2, which presents a formidable opacity to H ionizing photons. Empirically, the inverse correlation between radius and filling factor for H ii regions reported by Cedrés et al. (2013) indicates a filling factor of unity for nebulae with radii smaller than 1 pc which, with an outer radius of 0.02 pc, would include the BLR in NGC 3227.
The dust reverberation radius has been measured to be in the range 14 to 20 light-day (Suganuma et al., 2006; Koshida et al., 2014), placing the onset of dust at the periphery of the partially ionized zone (Fig. 8). Evidently, the dust must be distributed in a low inclination ring so as to not affect the Balmer emission lines (Fig. 3, Section 2.3). Evidence that dust is severely depleted inside the H+ region, presumably by sublimation (Barvainis, 1987), is provided by the modest dust extinction. Compared to the large H column, the dust extinction, corresponding to 0.5 mag in the visible (Fig. 2), is about five orders of magnitude smaller than would be expected for a Galactic gas to dust mass ratio of 100 (Spitzer, 1978).
XSTAR predicts O to be progressively ionized through all its possible ionization stages as the central UV–X-ray source is approached providing a natural explanation for the absence of broad forbidden emission lines. No 3727, 3729 emission lines appear in the HST spectra, consistent with the XSTAR model. Furthermore, both the observed reddening-insensitive ratio 4960 and the value predicted by XSTAR are consistent with the theoretical value (Dimitrijevic et al., 2007). However, there are two notable discrepancies between the HST observations and the XSTAR model pedictions. The first is that the 5008 emission line is observed to be 230% brighter than predicted by XSTAR. This excess emission could be attributed to the extended source of 5008 seen in the nucleus of NGC 3327 (Arribas & Mediavilla, 1994; Mundell et al., 1995; Delgado & Perez, 1997; García-Lorenzo et al., 2001; Walsh et al., 2008). However, the second discrepancy, that XSTAR predicts the 4364 emission line to be 25 times brighter than the upper limit estimated in D13, is not as easily addressed as the first. On the one hand the 5008/4364 ratio produced by XSTAR is entirely consistent with that expected (Osterbrock, 1989) given the temperature 104 K and electron density 108 cm-3 in the O++ region. On the other hand, the observed 4364 emission line would have to be as bright as H in order to match the XSTAR prediction. Observationally, this seems unlikely, but the resolution of the observations is insufficient to adequately resolve the two lines in question (D13). Equally disconcerting, however, is that contrary to commonly accepted wisdom, XSTAR predicts the 4364 emission line to be bright even though the electron density in the O++ region exceeds the critical density of the level responsible for the transition by about one order of magnitude.
X-ray observations reported by Markowitz et al. (2009) reveal the He-like O vii emission line triplet, but ratios of the line strengths are unable to distinguish between photoionization and collisional excitation. XSTAR predicts the forbidden line to be the brightest, as would be expected in a photoionized gas, but about a factor of 3 brighter than observed. XSTAR further predicts the intercombination line to be the same brightness as observed, and the resonance line, for which the measurement uncertainty is large, to be about a factor of 4 brighter than observed.
3.2 Dynamics of the H+ region
The BLR dynamics can be explored by establishing whether or not the gas and radiation pressure gradients, , are sufficient to maintain hydrostatic equilibrium according to the relation,
| (5) |
where is the gravitational constant, is the sum of the BH mass plus the mass of surrounding stars (D13), is the radial distance from the central BH, and is the gas volume density (Fig. 8). The condition for hydrostatic equilibrium is illustrated in Fig. 9.
The gradient in the gas pressure is
| (6) |
where and represent the radial dependence of the electron temperature and number density illustrated in Fig. 8. The gradient was calculated by numerically differentiating the XSTAR gas pressure. The result, shown in Fig. 9, is not smooth because the finite resolution of the XSTAR computations causes the gas pressure to exhibit occasional step functions which transform into delta functions when differentiated.
The gradient in the ionizing radiation pressure is
| (7) |
with representing the speed of light.
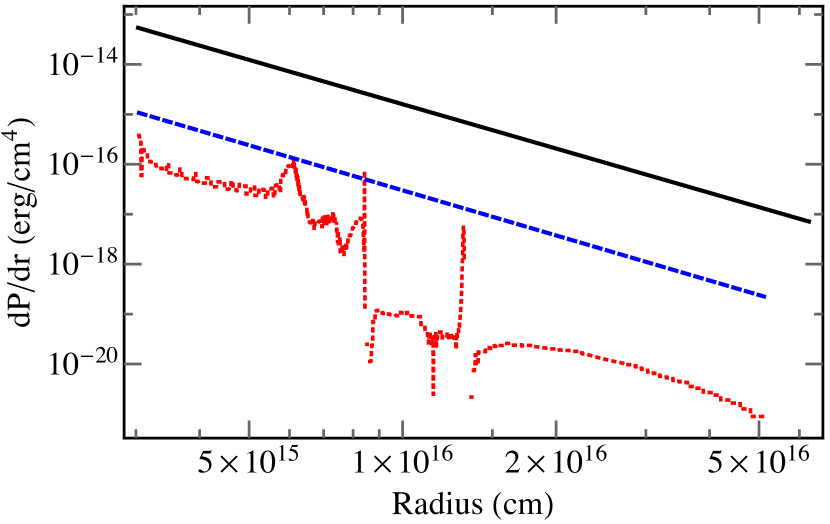
Fig. 9 shows that neither the gas or radiation pressure gradients, nor their sum, is sufficient to maintain hydrostatic equilibrium in such close proximity to the BH. This statement is likely to be true even allowing for the force generated by line-absorption of radiation. The calculations of Stevens & Kallman (1990) predict that the radiation force multiplier will be less than unity in X-ray illuminated stellar winds with 2 log10 3, ionization parameters that overlap the range inferred for the BLR of NGC 3227 (Fig. 8). Consequently, inflow of the BLR gas at the free-fall velocity is inevitable.
Assuming spherical symmetry, integrating the H column reveals that the BLR contains a mass = 40 M☉ of partially ionized H gas. The mass inflow rate can be estimated by integrating the equation of continuity
| (8) |
where the filling factor = 1, and the proton number density = 5.62 108 cm-3 at the inner radius, = 10-3 pc, where = 5966 km/s. The proton mass = 1.67 10-27 kg leading to = 1 M☉/yr, superseding a prior estimate in D13. Assuming radiatively inefficient accretion, the X-ray luminosity requires 10-2 M☉ yr-1 (D13). Thus, if one assumes steady-state mass conservation, 99% of the inflowing gas must be re-directed into an outflow (Barbosa et al., 2009; Alonso-Herrero et al., 2019), and on a very short timescale indeed corresponding to 40 years. Alternatively, the X-ray luminosity has been underestimated which is a distinct possibility if the BLR is indeed Compton thick as implied in Section 3.1. Another potential resolution of the apparent discrepancy between the inflow and BH accretion rate is that the radiative efficiency of the ADAF has been overestimated by one or two orders of magnitude (Blandford & Begelman, 1999). Regardless, radial inflow provides a straightforward way out of the angular momentum conundrum that has stymied our understanding of AGN fueling for several decades (Begelman, 1994; Hobbs et al., 2011, and references therein).
Geometrically, the BLR in NGC 3227 is bisymmetric, exhibiting two hemispheres of inflowing gas (Fig. 6) with the redshifted one, depicted in Fig. 7, facing the observer. This combination of kinematic bisymmetry and orientation causes the triangular shape observed for the broad H emission line. The low inclination inferred for the dust torus (Alonso-Herrero et al., 2011) and the spectroscopic designation as a Seyfert 1 suggest an almost face-on aspect. In this context, the double radio source identified by Mundell et al. (1995) may actually be the combination of a core and Doppler-boosted one-sided jet pointing roughly in our direction.
3.3 X-ray emission versus absorption
On the one hand, the implication that the BLR of NGC 3227 is Compton-thick (Section 3.1) is not supported by observations of high energy X-ray absorption (Panessa et al., 2006). On the other hand, comparing the FWHM of the Fe K emission line reported by Markowitz et al. (2009) to the FWZI of the broad H line (Section 3.1) indicates that much of the Fe K emitting region lies inside the Balmer reverberation radius. Although the physical properties of that X-ray emitting region are not described specifically by the XSTAR modelling reported here, one can infer, by extrapolating the electron density inward from the Balmer reverberation radius, that the requisite column needed to produce the Fe K line should exist, corresponding to 1023 atoms cm-2.
4 Conclusion
The XSTAR photoionization modelling results reported here reveal the physical properties of the BLR in NGC 3227. Given the small emitting volume 10-6 pc3, the 107 L☉ broad H emission line requires 40 M☉ of H gas with a density 108 cm-3 and a filling factor of unity. Additionally, the bisymmetric shell of dust-free photoionized gas is compressed, by gravity, into a Compton thick column that is dynamically unstable to infall. In conclusion, the Seyfert 1 nucleus of NGC 3227 appears to represent the epitome of the situation described by Pringle & King (2007) whereby the gravitational force overwhelms the thermal and radiation pressure forces, allowing gas to free-fall supersonically onto the central supermassive BH.
Acknowledgements
I am very grateful to several of my colleagues for help along the way. In particular, Dr. Steven Willner for insight, advice, and for carefully editing the manuscript. Prof. Ski Antonucci for kindly critiquing, with surgical precision, my “radical ideas" expressed in said manuscript. Last, but not least, Prof. Matt Malkan for an interesting and charitable referee report. STSDAS was a product of the Space Telescope Science Institute, which is operated by AURA for NASA. Based on observations made with the NASA/ESA Hubble Space Telescope, obtained from the data archive at the Space Telescope Science Institute. STScI is operated by the Association of Universities for Research in Astronomy, Inc. under NASA contract NAS 5-26555.
5 Data Availability Statement
The datasets underlying this article are listed in D13 and available in the Mikulski Archive for Space Telescopes (MAST) which is the primary archive and distribution center for HST data, distributing science, calibration, and engineering data to HST users and the astronomical community at large (https://archive.stsci.edu/hst/).
References
- Alonso-Herrero et al. (2011) Alonso-Herrero A., et al., 2011, The Astrophysical Journal, 736, 82
- Alonso-Herrero et al. (2019) Alonso-Herrero A., et al., 2019, Astronomy & Astrophysics, 628, A65
- Arribas & Mediavilla (1994) Arribas S., Mediavilla E., 1994, The Astrophysical Journal, 437, 149
- Barbosa et al. (2009) Barbosa F. K. B., Storchi-Bergmann T., Fernandes R. C., Winge C., Schmitt H., 2009, Monthly Notices of the Royal Astronomical Society, 396, 2
- Barvainis (1987) Barvainis R., 1987, The Astrophysical Journal, 320, 537
- Begelman (1994) Begelman M. C., 1994, in Shlosman I., ed., Mass-Transfer Induced Activity in Galaxies. p. 23
- Beuchert et al. (2015) Beuchert T., et al., 2015, Astronomy & Astrophysics, 584, A82
- Blandford & Begelman (1999) Blandford R. D., Begelman M. C., 1999, Monthly Notices of the Royal Astronomical Society, 303, L1
- Cardelli et al. (1989) Cardelli J. A., Clayton G. C., Mathis J. S., 1989, The Astrophysical Journal, 345, 245
- Cedrés et al. (2013) Cedrés B., Beckman J. E., Bongiovanni Á., Cepa J., Ramos A. A., Giammanco C., Cabrera-Lavers A., Alfaro E. J., 2013, The Astrophysical Journal, 765, L24
- Crenshaw et al. (2001) Crenshaw D. M., Kraemer S. B., Bruhweiler F. C., Ruiz J. R., 2001, The Astrophysical Journal, 555, 633
- Davies et al. (2006) Davies R. I., et al., 2006, The Astrophysical Journal, 646, 754
- Delgado & Perez (1997) Delgado R. M. G., Perez E., 1997, Monthly Notices of the Royal Astronomical Society, 284, 931
- Devereux (2013) Devereux N., 2013, The Astrophysical Journal, 764, 79
- Devereux (2019) Devereux N., 2019, Monthly Notices of the Royal Astronomical Society, 488, 1199
- Devereux & Shearer (2007) Devereux N., Shearer A., 2007, The Astrophysical Journal, 671, 118
- Dimitrijevic et al. (2007) Dimitrijevic M. S., Popovic L. C., Kovacevic J., Dacic M., Ilic D., 2007, Monthly Notices of the Royal Astronomical Society, 374, 1181
- García-Lorenzo et al. (2001) García-Lorenzo B., Mediavilla E., Arribas S., 2001, Astrophysics and Space Science, 276, 1121
- Gaskell et al. (2004) Gaskell C. M., Goosmann R. W., Antonucci R. R. J., Whysong D. H., 2004, The Astrophysical Journal, 616, 147
- Greene & Ho (2005) Greene J. E., Ho L. C., 2005, The Astrophysical Journal, 630, 122
- Hicks & Malkan (2008) Hicks E. K. S., Malkan M. A., 2008, The Astrophysical Journal Supplement Series, 174, 31
- Hobbs et al. (2011) Hobbs A., Nayakshin S., Power C., King A., 2011, Monthly Notices of the Royal Astronomical Society, 413, 2633
- Kallman & Bautista (2001) Kallman T., Bautista M., 2001, The Astrophysical Journal Supplement Series, 133, 221
- Koshida et al. (2014) Koshida S., et al., 2014, The Astrophysical Journal, 788, 159
- Lamer et al. (2003) Lamer G., Uttley P., McHardy I. M., 2003, Monthly Notices of the Royal Astronomical Society, 342, L41
- Markowitz et al. (2009) Markowitz A., Reeves J. N., George I. M., Braito V., Smith R., Vaughan S., Arévalo P., Tombesi F., 2009, The Astrophysical Journal, 691, 922
- Mundell et al. (1995) Mundell C. G., Holloway A. J., Pedlar A., Meaburn J., Kukula M. J., Axon D. J., 1995, Monthly Notices of the Royal Astronomical Society, 275, 67
- Nemmen et al. (2014) Nemmen R. S., Storchi-Bergmann T., Eracleous M., 2014, Monthly Notices of the Royal Astronomical Society, 438, 2804
- Netzer & Laor (1993) Netzer H., Laor A., 1993, The Astrophysical Journal, 404, L51
- Osterbrock (1989) Osterbrock D. E., 1989, Astrophysics of Gaseous Nebulae and Active Galactic Nuclei. University Science Books, Mill Valley, Calif
- Pancoast et al. (2011) Pancoast A., Brewer B. J., Treu T., 2011, The Astrophysical Journal, 730, 139
- Panessa et al. (2006) Panessa F., Bassani L., Cappi M., Dadina M., Barcons X., Carrera F. J., Ho L. C., Iwasawa K., 2006, Astronomy & Astrophysics, 455, 173
- Peterson et al. (2004) Peterson B. M., et al., 2004, The Astrophysical Journal, 613, 682
- Pringle & King (2007) Pringle J. E., King A., 2007, Astrophysical Flows. Cambridge University Press (CUP), doi:10.1017/cbo9780511802201
- Pronik (2009) Pronik 2009, Astronomy & Astrophysics, 496, 299
- Rosa et al. (2018) Rosa G. D., et al., 2018, The Astrophysical Journal, 866, 133
- Rosenblatt et al. (1992) Rosenblatt E. I., Malkan M. A., Sargent W. L. W., Readhead A. C. S., 1992, The Astrophysical Journal Supplement Series, 81, 59
- Rosenblatt et al. (1994) Rosenblatt E. I., Malkan M. A., Sargent W. L. W., Readhead A. C. S., 1994, The Astrophysical Journal Supplement Series, 93, 73
- Rubin & Ford (1968) Rubin V. C., Ford W. K., 1968, The Astrophysical Journal, 154, 431
- Seyfert (1943) Seyfert C. K., 1943, The Astrophysical Journal, 97, 28
- Spinelli et al. (2006) Spinelli P. F., Storchi-Bergmann T., Brandt C. H., Calzetti D., 2006, The Astrophysical Journal Supplement Series, 166, 498
- Spitzer (1978) Spitzer L., 1978, Physical processes in the interstellar medium. New York: Wiley-Interscience (Wiley), doi:10.1002/9783527617722
- Stevens & Kallman (1990) Stevens I. R., Kallman T. R., 1990, The Astrophysical Journal, 365, 321
- Strömgren (1939) Strömgren B., 1939, The Astrophysical Journal, 89, 526
- Suganuma et al. (2006) Suganuma M., et al., 2006, The Astrophysical Journal, 639, 46
- Tully (1988) Tully R. B., 1988, Nearby galaxies catalog. Cambridge: Cambridge Univ. Press, https://ui.adsabs.harvard.edu/abs/1988ngc..book.....T
- Turner et al. (2018) Turner T. J., Reeves J. N., Braito V., Lobban A., Kraemer S., Miller L., 2018, Monthly Notices of the Royal Astronomical Society, 481, 2470
- Vasudevan & Fabian (2009) Vasudevan R. V., Fabian A. C., 2009, Monthly Notices of the Royal Astronomical Society, 392, 1124
- Walsh et al. (2008) Walsh J. L., Barth A. J., Ho L. C., Filippenko A. V., Rix H.-W., Shields J. C., Sarzi M., Sargent W. L. W., 2008, The Astronomical Journal, 136, 1677
- Winter et al. (2012) Winter L. M., Veilleux S., McKernan B., Kallman T. R., 2012, The Astrophysical Journal, 745, 107