Virus-host interactions shape viral dispersal giving rise to distinct classes of travelling waves in spatial expansions
Abstract
Reaction-diffusion waves have long been used to describe the growth and spread of populations undergoing a spatial range expansion. Such waves are generally classed as either pulled, where the dynamics are driven by the very tip of the front and stochastic fluctuations are high, or pushed, where cooperation in growth or dispersal results in a bulk-driven wave in which fluctuations are suppressed. These concepts have been well studied experimentally in populations where the cooperation leads to a density-dependent growth rate. By contrast, relatively little is known about experimental populations that exhibit density-dependent dispersal.
Using bacteriophage T7 as a test organism, we present novel experimental measurements that demonstrate that the diffusion of phage T7, in a lawn of host E. coli, is hindered by steric interactions with host bacteria cells. The coupling between host density, phage dispersal and cell lysis caused by viral infection results in an effective density-dependent diffusion coefficient akin to cooperative behavior. Using a system of reaction-diffusion equations, we show that this effect can result in a transition from a pulled to pushed expansion. Moreover, we find that a second, independent density-dependent effect on phage dispersal spontaneously emerges as a result of the viral incubation period, during which phage is trapped inside the host unable to disperse. Additional stochastic agent-based simulations reveal that lysis time dramatically affects the rate of diversity loss in viral expansions. Taken together, our results indicate both that bacteriophage can be used as a controllable laboratory population to investigate the impact of density-dependent dispersal on evolution, and that the genetic diversity and adaptability of expanding viral populations could be much greater than is currently assumed.
I Introduction
Spatial range expansions are ubiquitous in nature, from the expansion of invasive plant species, through the migration of ancient human populations, to the range shifts of many organisms to higher altitudes and latitudes due to climate change [1, 2, 3, 4, 5, 6, 7, 8]. One of the hallmarks of spatial expansions is the rapid loss of genetic diversity due to the enhanced fluctuations at the front [9, 10]. This effect can, however, be significantly mitigated in the presence of density-dependent growth [11, 12], such as an Allee effect [13], or density-dependant dispersal, where individuals in highly dense patches tend to disperse more quickly [14]. In particular, it has recently been shown theoretically that the ratio between the deterministic velocity of the front and that of its linearised approximation is sufficient to classify the expansions in three distinct types of travelling waves, nominally pulled, semi-pushed and fully-pushed, which respectively exhibit qualitatively distinct behaviors in the decay of heterozygosity, the stochastic wandering of the front position, and the probability distribution of the most recent common ancestor [15, 14].
Because density-dependent growth can play such a crucial role in the evolutionary dynamic of a population, it has been extensively investigated in both naturally occurring range expansions in animals, such as the invasions of both Eurasian gypsy moths and house finches in North America [16, 17], and in laboratory microbial model systems, where the expansion dynamics in populations of the budding yeast Saccharomyces cerevisae transition from pulled to pushed as growth becomes more cooperative [18], with a corresponding preservation of genetic diversity [19]. In comparison, relatively little is known about the population dynamic of experimental systems that exhibit density-dependant dispersal, even if it has been documented in several natural populations [20] and the transition to pushed waves has been theoretically predicted [14].
One laboratory system that has been hypothesized to undergo density-dependent dispersal is bacteriophage expanding in a bacterial lawn. The crowded bacterial environment is thought to hinder phage diffusion because of steric interactions, resulting in a density-dependent diffusion coefficient due to the coupling between the host and the viral population densities [21]. Direct experimental quantification of this density-dependent diffusion is, however, limited [22], and its consequence on the front population dynamic mostly unknown.
Here, we address the open questions of (i) whether and how the rate of phage diffusion depends on the density of surrounding bacteria, (ii) under what conditions transitions to semi-pushed and fully-pushed expansions can occur, and (iii) what role density-dependent diffusion plays in this. We first design an experimental protocol to measure the effect of steric interactions between phage and the surrounding bacteria on phage dispersal. We then construct a system of reaction-diffusion equations to determine the phage front velocity, demonstrating that transitions to both semi-pushed and fully-pushed waves can occur. We find that the presence and location of these transitions are controlled by two independent effects that alter the density-dependent diffusion of the virus: the first is associated with the excluded-volume interactions with the surrounding bacteria, while the second spontaneously emerges from the viral infection dynamic, which prevents a viral particle from diffusing during infection of the host. Using stochastic agent-based simulations, we show that even the second effect alone, which applies to viruses beyond phage, can lead to a significant reduction in the rate of diversity loss in the viral population.
Taken together, our results identify bacteriophages as a controllable laboratory model system to investigate the role of density-dependent dispersal in evolution and provide a quantitative explanation of the physical mechanisms that control the phage population dynamic during a range expansion. Going beyond phages, our findings suggest that a broad range of viruses may expand via pushed travelling waves and, consequently, may be much more adaptable then previously thought.
II Experimental Measurements of Density-Dependent Dispersal in Coliphage T7
Starting with Yin and McCaskill [21], it is usually recognized that bacteria can act as a barrier to phage diffusion, resulting in a diffusion coefficient that depends on the bacterial density. This dependence is indeed necessary in phage expansion models to correctly reproduce the non-monotonicity of front velocity observed as a function of bacterial density [21, 23, 24, 25]. While it has been shown that phage diffuses faster in the bulk of a plaque than at the edge [22], the dependence of phage diffusion coefficient on bacterial density has never been quantitatively measured.
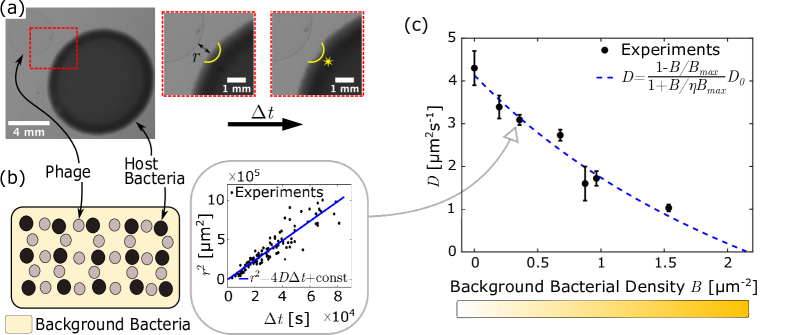
To address this need, we designed an experimental setup where (i) host density can be quantified and maintained uniform in space and constant in time, and (ii) the effect of steric interactions is decoupled from the viral infection dynamic. To this end, we moved away from classic plaque-in-agar assay, which exhibit a fragmented host distribution at the microscopic level, and built a uniform bacterial lawn by directly pouring an E. coli liquid culture of known density on top of 2% agar LB plates containing chloramphenicol (background bacteria in Fig. 1b, Methods). These bacteria are susceptible to the antibiotic, which prevents their growth ensuring a constant host density during the experiment, and are engineered to prevent phage adsorption [26, 27], so as to serve as passive barrier to phage dispersal. Phage droplets were then inoculated across the lawn (grey in Fig. 1b) at different distances from droplets of a second E. coli strain, susceptible to phage and resistant to chloramphenicol (black in Fig. 1b). The time required by the phage to travel the distance between a viral droplet and a close-by susceptible bacteria droplet was monitored in vivo by tracking the appearance of clearings in the susceptible droplets (Fig. 1a and b).
By gathering statistics over many droplet-droplet pairs, we were able to first confirm that the relationship between distance travelled and mean first passage time is consistent with diffusive behavior for the whole range of background densities tested (Fig. 1b), and then calculate the rate of phage diffusion as a function of background bacterial density (Fig. 1c). Additional tests were also performed to confirm that phage did not significantly diffuse out of the plane and into the agar during the course of the experiment (Appendix A).
Building on previous efforts to account for density-dependence in plaque models [21], we fit our data using Fricke’s Law [24, 28], which describes the diffusion of a solute through a suspension of spheroids [29]:
| (1) |
where indicates the fraction of bacteria relative to a maximum value and accounts for the shape of the cells: spherical cells correspond to =2, while E. coli cells have previously been determined to correspond to =1.67 [24]. Our experimental data allow for the first time to estimate the two fitting parameters required by Frickes’s law in this context: the free diffusion coefficient (i.e. the diffusion coefficient in the absence of surrounding bacteria), and the bacterial density at which diffusion is expected to be completely halted. We estimate , which is in good agreement with the rate of 4 previously determined by Ouchterlony double immunodiffusion in 10 g/l agar of phage P22 (similar size and shape of T7) [30, 31]; and , which is consistent with the typical dimensions of an E. coli cell (assuming E. coli cells are approximately 0.5 2 m, we would expect a 1 m2 cross section to contain between 1 and 4 closely packed cells, depending on their orientation and deformation). Note that while we will use the expression in Eq. 1 to account for the effect of steric interactions in phage dispersal on a uniform bacterial lawn, this relationship can be applied to any scenario in which the bacterial density distribution is known, even if it is non-uniform.
III Modelling Plaque Growth: Density-Dependent Diffusion and Adsorption to Infected Cells
To investigate whether the phage expansion on a bacterial lawn occurs as a pulled or a pushed wave, and to uncover the role of host density-dependence, we compare the actual front velocity with the velocity of the corresponding linearised system, as their ratio has been shown to be sufficient to determine the wave class in single species range expansions [15]. To this end, we develop a mathematical model that accommodates the density-dependent diffusion we have experimentally measured.
We model the spatial dynamics of bacteriophage plaque growth by considering the interactions between three populations: viruses (phage) , uninfected host bacteria and infected host bacteria , similar to [21, 24, 32, 23, 25, 33, 34, 35]. The process may be summarised as
| (2) |
where is the burst size, is the rate of adsorption, and is the lysis time.
As the model is deterministic, without loss of generality, we describe these populations with a set of reaction-diffusion equations in 1D, similar to those examined by Jones et al. [32]:
| (3a) | |||
| (3b) | |||
| (3c) |
where , and indicate the concentration of the population as a function of space and time. The subscript is used to indicate that those terms are evaluated at time . is the density-dependent diffusion coefficient of the phage, determined from fitting Fricke’s law to experimental results in the previous section (Eq. 1). or , depending on whether adsorption to previously infected hosts is allowed or prevented, respectively. We assume that the host bacteria are motionless and that adsorption to uninfected hosts always leads to successful infection while neglecting desorption.
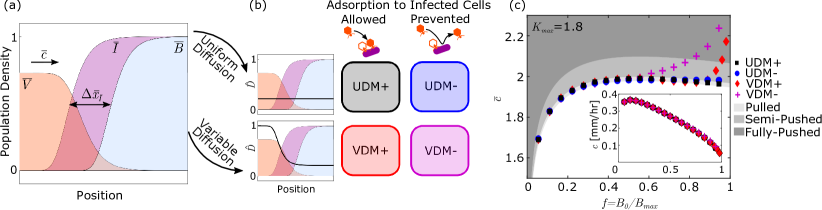
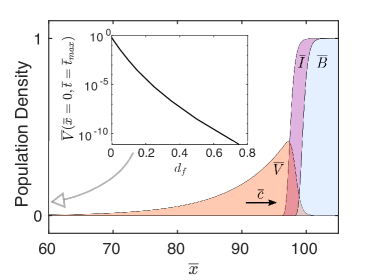
Our model introduces two ingredients that are biologically and physically relevant, and that are expected to affect the front dynamic. First, in contrast to previous work [21, 24, 23, 25, 33, 34, 35], where the diffusion coefficient only depends on the initial bacterial density ( in Eq. 1), we allow to vary in time and space according to the local bacterial density ( in Eq. 1), resulting in faster diffusion inside the phage clearing (Fig. 2a,b). Secondly, we allow for the possibility that phage can adsorb to previously infected cells ( term in Eq. 3c), as is the case for phage T7. The presence or absence of these two effects generates four model variants that are summarized in Fig. 2b: Uniform vs. Variable Diffusion model (UDM vs. VDM), and adsorption vs. non-adsorption to infected cells (+ vs. -).
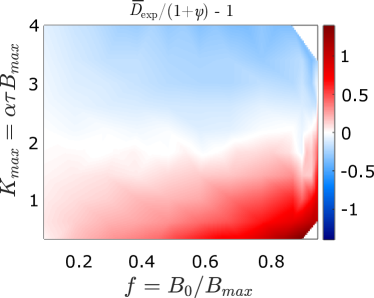
In line with previous studies, we cast the equations using dimensionless variables. We measure concentrations in terms of the initial bacterial density , time in units of , and length in units of (spatial scale of diffusion at the front within the lysis time). This results in the following set of dimensionless variables: , , , , and . Consequently, , where and are the dimensionless and dimensional velocity of the expansion front, respectively (Fig. 2a).
In these units, the UDMs are characterized by a constant dimensionless diffusion coefficient by definition, while the VDMs exhibit a dimensionless density-dependent diffusion coefficient of the form:
| (4) |
where is the initial fraction of bacteria. Note that corresponds to the phage diffusion coefficient relative to the diffusion coefficient at the very front of the expansion, where host density is maximal. As a consequence, from Eq. 4 is always greater than or equal to 1, and can therefore be interpreted as a “boost” in diffusion that the VDMs exhibit in the bulk of the plaque in comparison to the corresponding UDMs. This boost mathematically describes the decrease in steric interactions between phage and bacteria due to the lysis of the host as the viral infection proceeds (black line in Fig. 2b).
As our goal is to determine whether the travelling waves are either pulled or pushed, we will require the solution to the linearised approximation of the model. To achieve this we expand the model (Eqs. 5) about the tip of the front where (, , ) (0, 1, 0), keeping only linear terms. This results in the following set of equations:
| (6a) | |||
| (6b) | |||
| (6c) |
From Eqs. 5 three natural parameters emerge: the dimensionless adsorption coefficient , the burst size and the dimensionless diffusion coefficient . In the UDMs, , leaving and as the only two parameters of the model. By contrast, in the VDMs, is a function of (Eq. 4), which entangles the effect of initial bacterial density on and . To decouple adsorption and diffusion, we define a set of three new independent parameters that we will use in the following to analyse the model variants: the initial fraction of bacteria , the maximum dimensionless adsorption coefficient (), and the burst size . In the linearised approximation (Eqs. 6) is the same for all four model variants and, therefore, depends only on the dimensionless adsorption coefficient and the burst size - see Methods.
IV From Pulled, to Semi-Pushed to Fully Pushed
By numerically solving the PDE system in Eqs. 5, we obtain the front velocity and compare it with the velocity of the linearised model (Eqs. 6, see Methods for details). In addition to front velocity, we also determine the characteristic width of the infection region (Fig. 2a), which we will discuss in Appendix H.
The transitions between different types of travelling wave are then determined from the ratio according to Ref. [15]: (i) pulled waves for , (ii) semi-pushed wave for , (iii) fully pushed waves for (see Methods). We point out here that the transition between semi-pushed and fully pushed waves has been uncovered and investigated only for single species range expansions, so far. The viral model presented here is more complex because of the coupling between the dynamics of different populations (bacterial and viral) and because of the presence of a time delay. As a result, the demographic noise in our model may differ from that in Ref. [15]. While this does not affect the transition between pulled and pushed waves, the distinction between semi-pushed and fully pushed waves might, in principle, be different.
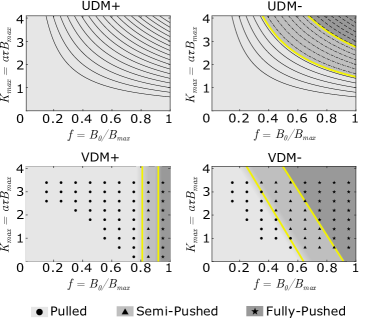
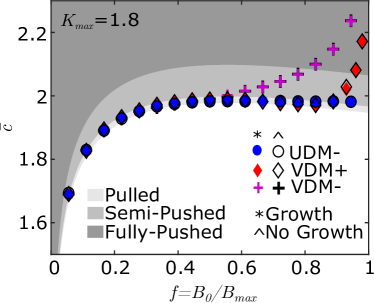
The location of these transitions in the different model variants for a set of infection parameters typical of T7 is shown in Fig. 2c. Under these conditions, we observe that the UDM+ exhibits a pulled wave for the full range of initial bacterial fraction, while the UDM-, the VDM+ and the VDM- waves become increasingly more pushed as increases. In terms of dimensional velocity, the difference between the model variants is minimal (inset in Fig. 2c), justifying why these effects have gone unnoticed in past theoretical work that aimed at predicting experimental phage front speeds.
IV.1 Wave Transitions are Very Sensitive to Virus-Host Interactions
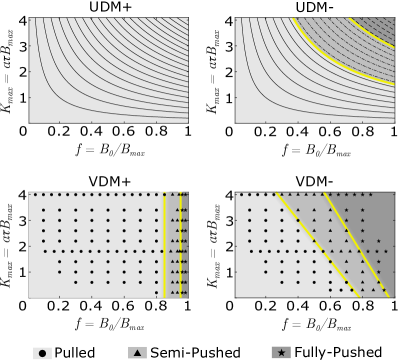
To generalise our findings and fully characterise the origin and nature of the transitions in front dynamic for the different model variants, we extend our investigation to a broader range of parameter values, by varying (and , see Appendix D) about the parameters used in Fig. 2c.
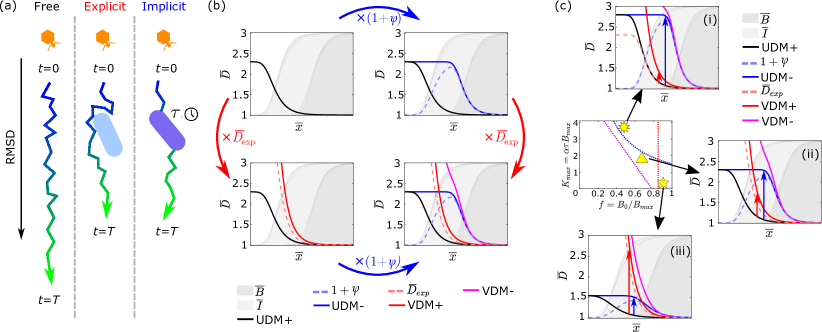
Fig. 3 shows the type of expansion that occurs in each of the models as a function of and . The results clearly indicate that the presence or absence of density-dependent diffusion and adsorption to infected cells can dramatically alter the type of travelling wave undergone by phage, with the UDM+ being the only model resulting in a pulled population wave for the whole range of parameters explored.
In the following, we will provide a physical interpretation for these observations, by identifying two independent mechanisms that alter phage dispersal in a density-dependent fashion. The first (Sec. IV.2), which we name the ‘explicit’ effect, is caused by steric interactions between phage and the bacterial host, and represents the effect measured in our experiments (Fig. 1). The second (Sec. IV.3), which we name the ‘implicit’ effect, arises spontaneously from the infection dynamic due to the fact that during incubation, phage are trapped inside the host cells, unable to diffuse, thereby resulting in a density-dependent effect on phage diffusion.
IV.2 Decreased Steric Effects due to Host Lysis Promote the Transition to Pushed Waves at High Bacterial Densities
The effect of virus-host steric interactions can be best appreciated by comparing the phase diagram of the UDM+ to that of the VDM+, and is a direct consequence of the variable diffusion coefficient that our model explicitly introduces in Eq. 4.
In the VDM+, transitions to semi-pushed and fully pushed waves occur at high values of with very weak dependence on . This results from the boost in phage diffusion that occurs in the bulk of the plaque as host cells lyse and steric effects decrease. Because the boost increases with increasing difference in bacterial density between the front () and the back (), higher initial bacterial density will lead to a stronger boost. We find empirically that, beyond a given point controlled exclusively by , the phage behind the propagating front will disperse sufficiently fast to be able to catch up with the front and generate a semi-pushed or even a fully-pushed wave. For what follows, it is useful to name this explicit boost to diffusion , which is mathematically identical to the dimensionless diffusion coefficient in Eq. 4, and reaches its maximum in the bulk of the plaque where no bacteria are left (Fig. 2b and dashed red line in Fig. 4b).
IV.3 A Second “Implicit” Density-Dependent Diffusion Emerges from the Viral Infection Dynamics
Since the UDMs lack the explicit density-dependent diffusion, the appearance of transitions to pushed regimes in the UDM- may seem surprising (Fig. 3). To understand the origin of these transitions, it is helpful to consider the effects of the parameter that controls the transition. Adsorption and incubation (quantified by the parameter ) are not only key for the effective growth rate of the phage population, but also for the effective dispersal rate of the phage, as they control the time and the probability that phage particles are “trapped” in a host cell, unable to disperse. As increases, either more phage adsorb to host cells per unit of time (increased adsorption rate), or they are trapped in the host for longer (increased lysis time), resulting in a hampered dispersal of the phage (Fig. 4a). The strength of this effect, by which phage is kept prisoner by the host cell, has to depend on the number of host available to infect, and thus be the strongest at the edge of the expansion, where there is plenty of uninfected host, and the weakest in the bulk, where all the host has been removed. Beyond a certain point, we therefore expect phage diffusion to be sufficiently hindered at the front to allow the phage in the back to catch up and generate a pushed wave.
To quantify the reduced dispersal resulting from viral infection, we consider a system of point-like phage particles diffusing across a field of completely permeable “sticky” obstacles, mimicking host bacteria that trap phage for a time . A simple mean-field analytical argument (see Methods), supported by two-dimensional Monte Carlo simulations (Appendix B), demonstrates that the particles in this system exhibit a hindered diffusion compared to their free diffusion , such that
| (7) |
where is the local density of host that can be infected by phage relative to the density at which diffusion is completely prevented. We note here that, by definition, is the phage diffusion coefficient relative to the bulk of the expansion, in parallel to , defined earlier, which is the phage diffusion coefficient relative to the front of the expansion.
When adsorption to infected cells occurs (UDM+), infected cells trap phage as much as uninfected cells ( in Eq. 7) resulting in a diffusion coefficient in the dimensionless model of the form
| (8) |
Because of the shape of the bacterial density profile during the expansion, phage diffusion will then be highest in the bulk and slowest at the front (black line in Fig. 4b). Yet, fast diffusing phage appear too far from the front to contribute to the expansion, resulting in pulled waves across parameter space (Fig. 3).
By contrast, when adsorption to infected cells is prevented (UDM-), phage can no longer become trapped in the infected region behind the front ( in Eq. 7), so that
| (9) |
and fast diffusing phage emerge much closer to the expansion front (blue vs. black lines in Fig. 4b, Methods). Preventing adsorption to infected cells is therefore equivalent to a boost in implicit diffusion in the infected region just behind the front, which can be approximated to
| (10) |
(blue dashed line in Fig. 4b). This boost is sufficient to shift the fast diffusing phage closer to the expanding front and, if is sufficiently large, to generate a transition to pushed waves.
It is important to point out that this implicit density-dependent diffusion emerges spontaneously from the viral infection dynamics (common to most viruses), where infecting viruses trapped in the host cannot contribute to the advancement of the front until they are released from the host. As a consequence, unlike the explicit density-dependent diffusion, this effect cannot be easily accommodated into the diffusion coefficient of our model, as it does not act independently of the infection and growth processes. Indeed, an alternative interpretation for this mechanism can be provided by a density-dependent death rate. In our model, adsorption to previously infected hosts is equivalent to phage ‘death’, as it results in the permanent loss of these phage. Going from the case where adsorption to infected cells occurs to the case where it does not (from + to - models) will then lead to an increase in net growth rate in the region of infected cells, which lies at intermediate viral density (Fig. 2a). The result is a higher net growth rate at intermediate population densities similar to what an Allee effect would generate in a mono-species expansion [13, 12].
IV.4 Implicit and Explicit Density-Dependent Diffusions Act Independently with Multiplicative Effects
Because the implicit and explicit boosts to diffusion discussed above have different physical origins and are controlled by different parameters ( and , respectively), they play significant roles in different regions of parameter space. The implicit boost that results from a lack of adsorption to infected cells, encoded in (), is stronger at large , where more phages are trapped by hosts for a longer period of time. Instead, the explicit boost caused by steric interactions, encoded in , is dominant at low . The ratio of the two effects over parameter space is shown in Appendix C, Fig. 9.
Extending the analytical argument with which we defined the implicit boost to diffusion, we can show that, to a first approximation, explicit and implicit effects act independently over a basal diffusion coefficient (see Methods). As a consequence, preventing adsorption to infected cells corresponds to multiplying the diffusion coefficient by (from + to - models, blue arrows in Fig. 4). Similarly, including steric effects corresponds to multiplying the diffusion coefficient by (from UD to VD models, red arrows in Fig. 4). As a result, we can write the dimensionless diffusion coefficient of the VDM-, which exhibits both effects, as
| (11) |
where all the terms are calculated with respect to and from the VDM- simulations.
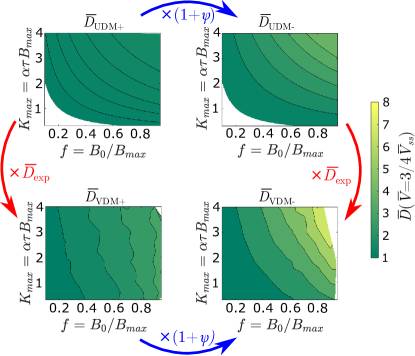
In contrast to the other models, this function depends non-trivially on and , making it challenging to find a simple parameter combination that controls the transitions to pushed waves. Nonetheless, we see that the diffusion coefficient determined at 3/4 times the steady state phage population is able to qualitatively capture the behavior of the transition lines in all models (Fig. 5) and it explains why the transition lines in the VDM- approaches the transition lines in the UDM- and the VDM+ at high and low , respectively, where either effects dominate (Fig. 3 and Fig. 4c). While the phage diffusion at a specific population density is, in principle, insufficient to predict whether the expansion is pushed, which by definition depends on the whole wave dynamic, Fig. 5 illustrates that regions in parameter space with similar effective diffusion within a model correspond to similar types of expansions. This supports the idea that the density-dependent diffusion, whether implicit or explicit, is the key ingredient that leads to transitions to pushed waves.
Further analyses indicate that our results are robust to (i) changes in burst size (Appendix D), (ii) inclusion of bacterial growth (Appendix E) and (iii) phage adsorption to cell debris in the plaque centre (Appendix F). In short, we find that changes in burst size do not qualitatively change the shape of the transitions (Fig. 10), but slightly alter their location (Fig. 11), with lower burst sizes facilitating the transition to pushed waves. We also find that the introduction of bacteria growth at a rate consistent with E. coli has no discernible effect (Fig. 13). Finally, the inclusion of adsorbing cell debris does not qualitatively change the behaviour of the model, but can narrow the region of parameter space where pushed waves are expected (Fig. 14a and b). This effect is, however, very limited for rates of adsorption to debris that can be considered physically realistic (Fig. 15).
IV.5 Lysis Time is the Main Determinant for the Rate of Genetic Diversity Loss
Single-species populations expanding via pushed waves have been theoretically and experimentally shown to retain genetic diversity much longer than their pulled counterparts [9, 12, 15, 19]. To test whether this property is maintained in viral populations and determine the effect of virus-host interactions on the rate of diversity loss, we developed an agent-based stochastic implementation of one of our numerical models and tracked the viral heterozygosity as a function of time (Fig. 6, Methods). The heterozygosity in a viral biallelic population is given by
| (12) |
where is the total number of demes in the simulation box, and the fraction of the two alleles in deme are and . We focus on the UDM- as it is the simplest of our models that exhibits pushed waves, and it is also relevant for viruses beyond phage T7.
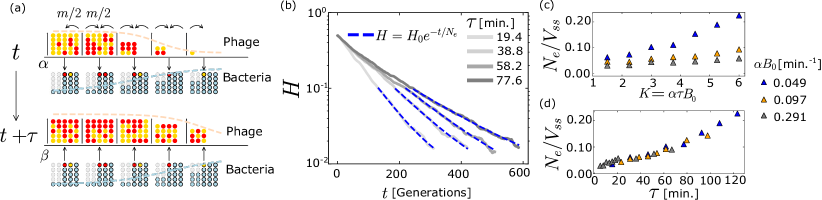
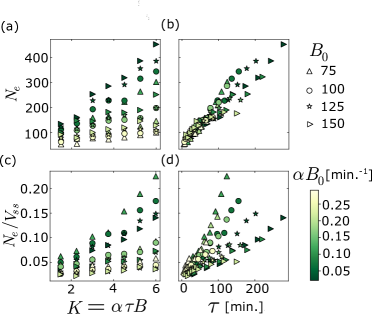
Analogously to previous studies on single-species, we find that the heterozygosity decays exponentially over time, so that we can define an effective population size as the inverse of the decay rate in units of generations (Fig. 6b, see Methods for details). To account for the fact that adsorption rate, lysis time and bacterial density also change the density profile of the viral population, we normalize the effective population size by the steady-state value of the viral population in the bulk of the wave . This normalization aims at providing a direct comparison between our system and previous theoretical studies where the carrying capacity of the population was held constant (see Appendix G for data without normalization).
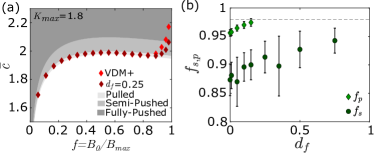
Our results show that the level of pushedness of the wave, controlled by in the UDM-, can signficantly increase the normalized effective population size (two-fold increase between a pulled wave, , and just above the pushed transition, , Fig. 6c). However, we also find that, not surprisingly, alone is not sufficient to determine the value of the effective population size of the expansion. Similar observations have been made before in single-species expansions, where distinct cooperativity models, all displaying transitions between pulled and pushed waves, were found to be characterised by different values of [14]. Remarkably, we find that an excellent predictor for the value of in the UDM- is the lysis time (collapse of datasets in Fig. 6d and Fig. 16). A possible reason behind this observation is the different effects that lysis time and adsorption rate have on the steady-state viral density profile (one broadens it, while the other narrows it), which, in turn, impacts [9, 15, 14]. Further analyses are necessary to pin-point the exact mechanisms that link virus-host interactions and viral diversity, urging for future theoretical work to investigate viral genetic diversity in spatial settings.
V Discussion
In this work, we first experimentally quantify how the diffusion of phage in a bacterial lawn is hindered by steric interactions with the host bacterial cells, resulting in a density-dependent diffusion coefficient. Going beyond current descriptions of plaque growth, which have considered host density-dependence only for setting a constant diffusion coefficient parameter, we construct a reaction-diffusion model of the phage-bacteria system that explicitly incorporates a diffusion coefficient that depends on local host density, and therefore varies in time and space. We show that, in contrast to current thinking which assumes that viral expansions are always pulled, this ‘explicit’ effect can lead to a transition from pulled to pushed waves at high host densities. We also show that a second, independent density-dependence in diffusion emerges implicitly from the underlying viral dynamics, whereby phage are unable to disperse during replication within the host. We find that when adsorption to infected host cells is prevented, this ‘implicit’ effect can also lead to the transition to pushed waves. Together, this indicates that bacteriophage offer an excellent experimental system to study the effect of density-dependent diffusion on expansion dynamics.
The transition from a pulled wave to a pushed wave has traditionally been associated with increased co-operativity between individuals, quantified by density-dependent growth, or more recently, density-dependent dispersal [13, 15, 14]. By analogy, the density-dependence in phage diffusion can be interpreted as an emergent co-operativity, which stems from the fact that as phage work together towards cell lysis, they remove bacterial obstacles, indirectly favouring the dispersal of neighboring phage. The fact that the diffusion is dynamically changed as phage replicate could lead to interesting ecological feedback. Ecological feedback on diffusion has been theoretically shown in other contexts to lead to pattern formation, and in some cases help maintain genetic diversity and mitigate the risk of extinctions [36]. Indeed, density-dependent dispersal has been identified as a key ingredient in a generic route to pattern formation in bacterial populations [37].
We find that the transition to a pushed wave can occur due to two separate effects: an explicit density-dependent diffusion coefficient, caused by steric interactions between the phage and the host bacteria, which is dominant in crowded host environments, and an implicit hindrance to the diffusion of the phage population at the front caused by the viral infection dynamics. We therefore expect that the pushed dynamics will be strongest in populations that experience both effects, and where adsorption to infected host is absent (VDM-). Some bacteriophage have mechanisms that prevent adsorption to already infected cells, usually by blocking receptor sites post-infection [38]. Bacteriophage T5 produces a lipoprotein (Llp) that is expressed at the beginning of infection, preventing superinfection by blocking its own receptor site (FhuA protein), and protecting newly produced phage from inactivation by binding to free receptors released by lysed cells [39, 40]. Similar mechanisms are also well documented in several temperate phage. Phage V10 possesses an O-acetyltransferase that modifies the specific V10 receptor site (the O-antigen of E. coli O157:H7) to block adsorption [41]. Similarly, Pseudomonas aeruginosa prophage D3 modifies the O-antigen of LPS on the host surface to prevent adsorption of the many phage that bind to the O-antigen [42]. This is similar to other Pseudomonas prophage which encode for twitching-inhibitory protein (TiP) that modifies the type IV pilus on the P. aeruginosa, preventing further adsorption [43, 44].
Mechanisms that prevent superinfection by forbidding adsorption to infected cells have been observed in viruses beyond bacteriophage [45]. For instance, cells recently infected with Vaccinia virus VacV (the live vaccine used to eradicate smallpox) express two proteins that repel super-infecting virions, resulting in plaques that grow four-fold faster than predicted by replication kinetics alone [46]. Our results show that even in the absence of explicit steric effects, pushed expansions can occur if adsorption to infected hosts is prevented (UDM-), as is the case for VacV, simply due to the fact that viruses are unable to disperse during incubation, suggesting that pushed waves might be far more widespread than previously thought among different viral systems.
Pushed dynamics in range expansions have been shown to have significant consequences for the evolution of the population. In pulled expansions, the high susceptibility to stochastic fluctuations results in inefficient selection, as beneficial or deleterious mutations can effectively behave as neutral due to the small number of individuals contributing to the dynamics [47, 48, 49], and leading, for instance, to the accumulation of deleterious mutations, known as expansion load [50, 51]. In fully pushed waves, stochastic fluctuations are much weaker as more individuals contribute to the advancement of the population, allowing beneficial mutations to establish more easily and deleterious mutations to be purged [12, 14]. Our stochastic simulations show that even the implicit density-dependent diffusion alone can slow down the rate of diversity loss up to 5-fold under reasonable phage infection parameters (Fig. 6). Remarkably, we find that the rate of diversity loss strongly depends on the lysis time, but only weakly on adsorption (), even if the two parameters are expected to contribute equally to the level of “pushedness” of the wave. This observation reveals a rich and non-trivial evolutionary dynamic displayed by our viral model that distinguishes it from classic mathematical descriptions of pushed waves, where dispersal, growth and cooperativity are controlled by independent parameters.
Going forward, three clear avenues emerge as a result of our work. Firstly, the complex dependence of the expansion dynamics on the infection parameters that we observe indicates that viral expansions offer a currently untapped ground for further theoretical studies. Our model provides a framework to investigate the evolutionary dynamics of an expanding viral population in terms of the realistic processes that occur therein. Within this framework, future work is required to fully characterise the complex interplay that each of the infection processes exhibit, and ultimately determine what impact they have on the viral evolutionary dynamics.
Secondly, while this work provides theoretical predictions and physical insights regarding the transition from pulled to pushed waves in viral expansions, it also points at phage plaques as a well-controlled model system to experimentally investigate these theories in a laboratory setting. We have shown (Fig. 2c and Fig. 3) that pushed waves can occur during plaque growth in conditions easily achievable in the laboratory. While it is challenging in a laboratory setting to fully replicate the complex environments found in nature, we believe that plaques offer an alternative and possibly more realistic environment to study these dynamics than the environments typically used thus far, such as cultures in a 96-well plate, where dispersal is achieved by artificial migration schemes [52, 18, 19].
Lastly, our experiments have shown that the rate of phage diffusion strongly depends on the host environment and, in particular, can dramatically differ from liquid culture measurements, where even at high overnight densities of cells/ml, the volume fraction occupied by the cells is , and so diffusion is effectively unhindered. This realisation raises the more general question of whether other phage life history parameters, such as lysis time (Appendix H), also depend strongly on the surrounding host environment. Traditionally, these parameters are determined by experiments carried out in a well mixed liquid culture [53, 24]. It is perfectly possible that these parameters could take significantly different values when the infection occurs in different spatially structured environments and varying metabolic states of the host cells [54]. Moreover, it is possible that these parameters are not only different on solid media when compared to liquid, but may also vary across the expansion in a similar fashion to the diffusion coefficient. For instance, upon lysis, release of cytoplasmic fluids could affect the infection or lysis of neighbouring cells, resulting in life-history parameters that vary with cell density.
VI Materials and Methods
Bacterial Strains
Five strains of E. coli were involved in this work. The first strain, E. coli BW25113 (CGSC# 7636), is susceptible to phage infection. This strain was transformed previously with a plasmid expressing Venus YFP to create the second strain, E. coli eWM43 [26]. This strain was further transformed with plasmid pAK501 (Addgene# 48107) [55], which confers resistance to chloramphenicol, to create the third strain, E. coli eMTH43. The fourth strain used, E. coli waaC, is resistant to phage infection through deletion of the waaC gene, the product of which is involved in the production of lipopolysaccharide, the recognition of which is essential for the adsorption of phage [27]. This strain was transformed previously with a plasmid expressing mCherry to yield the final strain E. coli eWM44 [26]. The strains eMTH43 and eWM44 were the two strains used respectively as the susceptible and resistant host in our experiments.
Bacteriophage T7
The phage used in the study is the obligately lytic bacteriophage T7. The phage was originally obtained as an aliquot from the wild-type stock of the Richardson lab (Harvard Medical School, Boston, MA). To prepare stocks of this phage, phage were added to an exponentially growing liquid culture of BW25113, and incubated at 37 °C until clear. The lysate was then mixed with NaCl to a final concentration of 1.4 M. This was then spun down to remove cell debris, and the resulting supernatant was stored at 4 °C.
Sample Preparation
To measure the diffusion coefficient of phage, 96 well plate sized omni-plates, containing 35 ml of 20 g/l agar (VWR Chemicals), with LB (Invitrogen) - NaCl concentration 10 g/l - and 15 g/ml chloramphenicol (Sigma-Aldrich) were prepared and kept at room temperature for 2 days. The presence of chloramphenicol in the plate prevents growth of the background strain eWM44, so to maintain its density constant over the course of the experiment. Plates were then refrigerated if they were to be used at a later date. Overnight liquid cultures of E. coli were grown from single colonies at 37 °C in LB with either 100 g/ml ampicillin (Sigma-Aldrich) or 15 g/ml chloramphenicol (Sigma-Aldrich) for eWM44 and eMTH43 respectively.
To create the background lawn of bacteria, the optical density at 600 nm (OD600) of the eWM44 culture was measured, and diluted into LB to obtain the desired density (calculated on the basis that OD equates to cells/ml). A 500 l droplet of this culture was then spread with glass beads (radius 4 mm) across the surface of the agar until dry. This process (a 500 l droplet spread with fresh beads) was repeated a further two times to achieve as uniform a distribution as possible. The plate was then left for a further 10 minutes before proceeding to the next step.
10 ml of eMTH43 overnight culture was spun down and re-suspended in fresh LB, so as to give an OD600 reading of 0.50 if diluted hundredfold. 2 l droplets of the concentrated culture were then pipetted onto the lawn of eWM44 in a grid like pattern, spaced approximately 1 cm apart, and left to dry (approximately 15 mins after the last droplet was pipetted). Each plate contained approximately 60 host droplets. The plate was then incubated at 37 °C for 1 hour.
10 l of stock T7 phage (107 pfu/ml) was diluted in 100 l of black food dye. 1 l droplets of this dilution were pipetted onto the surface of the agar, in the gaps between the previously pipetted droplets of eMTH43, and left to dry. A schematic of the resulting set-up can be seen in Fig. 1a.
Data Acquisition
The plates were imaged using a Zeiss Axio Zoom.V16 stereo microscope equipped with a Zeiss PlanApo Z 0.5x/0.125 FWD 114 mm objective. Images of the sample were taken every 20 minutes for a period of 24 hours. During the imaging period, the sample was kept with its lid on at 37 °C using an ibidi Multi-Well Plate Heating System.
Data Analysis
All of the images were analysed using Fiji (v1.52h), an open source distribution of ImageJ focused on scientific image analysis [56, 57].
The time necessary for a clearing to appear in the droplets of eMTH43, and the separation between the point at which a clearing forms and the nearest phage droplet was recorded (Fig. 1). By measuring and over many droplet-droplet pairs, one can measure the mean first-passage time (the mean time taken for the first phage to diffuse a fixed distance ), and calculate the rate of phage diffusion by fitting the relationship [58]:
| (13) |
where is the diffusion coefficient, and the constant arises due to the delay between the arrival of the phage and the formation of a visible plaque.
Numerical Solutions of Reaction-Diffusion Model
We consider the scaled equations (Eq. 5) on a finite interval of length with homogeneous Neumann boundary conditions. Throughout we used and a maximum possible time of . Initially, we set over the whole interval, for , and elsewhere. There are initially no infected bacteria (). Solutions are determined on a mesh of uniform space and time, with divisions of , and or to give the best balance between precision and compute time for a given parameter set.
A sketch of the fronts during the expansion can be seen in Fig. 2a. The dimensionless spreading velocity of the front is determined by tracking the midpoint of the bacterial wave (i.e. ) over time. For pulled fronts, the spreading velocity is known to demonstrate a power law convergence to an asymptotic value [59]. In the case where a steady spreading velocity was not reached, the spreading velocity was given by the asymptotic value which produced the best power law fit to the data.
The transitions between pulled, semi-pushed and fully pushed have been found to occur at specific wave velocities with respect to the linearised (Fisher) velocity - the velocity determined solely by the linear dynamics at the tip of the front [15]. Pulled expansions spread with a velocity equal to the velocity of the linearised model , while pushed expansions spread faster [11]. The transition between semi-pushed and fully pushed occurs at a velocity of , with waves below this velocity being semi-pushed, and above this velocity being fully pushed [15]. These thresholds have been shown to be robust to the details of the population dynamics [14], though their appropriateness for multi-species expansions requires further investigations. We here use the same values for illustration purposes.
Even though strictly speaking pulled expansions occur when the spreading velocity is equal to the velocity of the linearised model (), due to errors in determining the velocity over a finite time (i.e. errors due to the power law fit when determining the asymptotic velocity), we conservatively consider velocities within 1% of the linearised velocity as corresponding to pulled expansions.
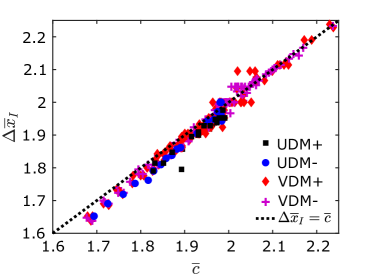
A length scale characterising the width of the infected region was also computed by tracking the separation between the midpoint on the wave of uninfected bacteria (), and the midpoint on the wave of infected bacteria () over time. An average was taken over the final 20 time points for the reported value of .
Linearised Solution of Reaction-Diffusion Model
To determine the transition between pulled, semi-pushed and fully pushed regimes, the solution to the linearised model is required. To achieve this, we first look for travelling wave solutions to Eq. 5 in the co-moving coordinate where is the dimensionless front velocity.
As the components approach their limiting concentrations at the leading edge of the front, the linearised form of the model becomes valid, and so, following previous work [21, 24], we assume the concentrations take the form , and where is a dimensionless width parameter, and , and are positive constants.
Substituting into the linearised version of the model (Eqs. 6) and writing in matrix notation yields:
| (14) |
To find non-trivial solutions the determinant of the matrix is set to zero, leading to the characteristic equation:
| (15) |
As we are assuming here that the front is pulled, the front propagates with the minimum possible velocity [59]:
| (16) |
By implicitly differentiating Eq. 15 with respect to , and setting according to Eq. 16, this leads to the second characteristic equation:
| (17) |
The dimensionless spreading velocity is given as the unique solution to both Eq. 15 and Eq. 17 which we solved numerically for each set of parameters.
Analytical Model of “Implicit” Density Dependence
To develop a simple mean-field analytical model to describe the effect of the underlying viral dynamics on the phage diffusion, we imagine phage diffusing across a lawn of “sticky” penetrable disks. These disks are used to represent host bacteria cells that are able to adsorb phage for a period equivalent to the lysis time, after which the phage desorb and continue to diffuse. The disks do not pose a hindrance to the phage through steric interactions.
In this set-up, phage diffuse through a series of discrete steps, where phage move a certain distance with each step. In any given step, the probability that a phage will become adsorbed to one of the host bacteria is , where represents the probability of adsorbing when a phage encounters a host, and represents the fraction of all space occupied by the host bacteria. This is analogous to a Poisson point process, where events (adsorption) occur continuously and independently. Therefore, the number of steps that a phage takes before becoming adsorbed to a host is exponentially distributed with mean . Consequently, over the period of time , where is the lysis time (in steps), the phage will only have on average actually moved for of that time.
For long times (over many adsorption/desorption events), this process can be thought of as a hindered diffusion process with relative diffusion coefficient equal to
| (18) |
where is the free diffusion coefficient, and is the relative density-dependent diffusion coefficient resulting from the hindrance posed by the underlying viral dynamics, which we have termed the “implicit” density-dependence.
This can be re-written in terms of the parameters used in the main text as
| (19) |
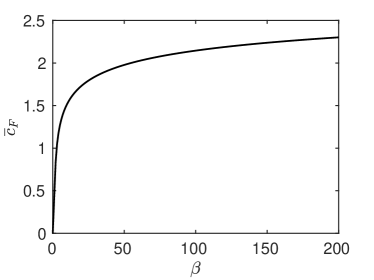
where is a scaling parameter given by:
| (20) |
To compare the parameters used in the two descriptions, we can consider that in our mean-field model . We can then use the fact that the term determines the rate at which phage are adsorbed when in contact with bacteria (as all space is filled with bacteria at ), and so, like , the term measures the total probability that phage will be adsorbed over a lysis time, assuming that the phage are always in contact with bacteria (i.e. ). This leads to a value for of:
| (21) |
Consequently, the implicit density dependence can be written equivalently in terms of either parameters as:
| (22) |
Analytical Model Predicts Multiplicative Effects of Steric Interactions and Infection Dynamic
The model introduced above can be modified to account for the presence of steric effects. In the absence of adsorption i.e., if excluded-volume interactions were the only hindrance to diffusion, the average fraction of steps successfully “jumped” by phage compared to the total attempted would be , and we can define a relative diffusion coefficient . Although this is an approximation as it does not take into account the fact that jumps may be correlated, which is why it deviates from the more precise Fricke’s equation, it helps extending the analytical model in the previous section.
If we now introduce adsorption, as explained in the previous section, the average number of steps taken by phage before adsorbing to an obstacle will be . In the presence of steric interactions, only a fraction of these steps will be successful, so that . Thus, on average, the success rate of jumping if both adsorption and steric interactions are taken into account will be:
| (23) |
which is equivalent to the product , indicating that when both implicit and explicit effects are present, the total behaviour can be expressed as the product of both effects individually. Because in our model the functional form is explicitly input into the PDE system, the same argument holds if we replace the simplified with the more precise Fricke’s law parameterised by our experiments, resulting in Eq. 11.
Implicit ‘Boost’ to Diffusion
This section will derive how the implicit diffusion coefficient in the UDM- can be thought of as a boost to the implicit diffusion coefficient in the UDM+. Here, let the implicit slow-down to diffusion in the UDM+ and UDM- be denoted by and , respectively. Following our previous derivations, these rates are given by:
| (24) |
where and , owing to the fact that infected cells are either adsorbing or non-adsorbing in the two models.
So as to compare to the dimensionless set of parameters used in the model (where at the expansion front), we re-scale the implicit coefficients as:
| (25) |
where and .
If we then compare the ratio of the two coefficients, it can be seen that
| (26) | ||||
| (27) | ||||
| (28) |
The approximation arises from the assumption that the bacterial curves and are the same in both expansions. This is supported by the observation that the density profiles for and are very similar when compared across models (Fig. 4b). Therefore we can see that we can write in terms of as
| (29) |
Diffusion Profiles
Fig. 4b shows the proxy diffusion coefficients of each of the model variants as a function of position across the expansion front. To generate this, the population profiles , and of each of the model variants were taken at the final time step of the numerical solution (so as to be as close to the steady state as possible), and then aligned so that the half max points of the density profiles of uninfected bacteria () coincide. These population curves were then used to determine the proxy dimensionless diffusion coefficients:
| (30a) | |||
| (30b) | |||
| (30c) | |||
| (30d) |
Stochastic Simulations
Our simulation algorithm is carried out on a one-dimensional lattice (Fig. 6a). A finite number of lattice sites (demes), denoted by , are distributed along a line, with each containing a fixed number of bacteria . Each deme is also initialized with phage. In each time step, there is: a migration step in which a proportion of phage from each deme , binomially sampled with trials and probability (), are exchanged with each of its neighbors; an adsorption step in which the number of adsorbing phage is sampled in each deme from a binomial distribution with number of trials, with success probability ; and a lysis step in which each infected bacteria’s state is advanced by one, and bacteria with state are labeled as lysed, and new phage are inserted into the deme. The simulation box is periodically shifted with uninfected bacteria placed ahead of the population and demes with a steady state number of phage omitted and recorded. In this way the simulation box stays in the co-moving frame of the population.
When the traveling wave is established, verified by convergence of the expansion velocity, all of the free and adsorbed phage are randomly labeled with one of two neutrals labels. The proportion of the population with each allele selected during the migration and adsorption step is found by binomial sampling with probability equal to the current allele fractions and the total number of events as described above. Upon lysis, all of the new phage released are labelled with the same marker as the phage which infected that bacteria.
Decay in Heterozygosity
The average heterozygosity in the simulation box is given by
| (31) |
where is the total number of demes in the simulation box, and the fraction of the two alleles in deme are and . Timesteps in our simulation are converted to generation time by noting that timesteps is equal to the average time for an individual virus to be adsorbed and the infected bacterial cell to lyse.
It is expected that heterozygosity decays due to genetic drift in our simulations [15, 14]. We expect that heterozygosity the , within a certain range of , will approximately satisfy the relation , where , , and are constants. With variable transient periods, and are unknown, but we assume to be 0 (the heterozygosity will always decay to 0 as one of the alleles fixes). To estimate , we simply take the natural log of our data, which we expect to be approximated by . Combining constant terms, we can find by simply performing a linear fit to :
| (32) |
We can alternatively express in terms of an effective population size, , where [9]. Following [15, 14], the fit was performed for the average of 1000 simulations, with chosen such that was as close to 0.1 as possible, and was chosen such that at least 5% of simulations had non-zero values of (Fig. 6b). Calculated was normalized by the measured average steady state viral population per deme in the bulk of the established traveling waves to account for variable carrying capacity.
Time- and Length-Scales in Stochastic Simulations
To express the and in our stochastic simulations in terms of real time units, we defined a spatial scale in our model such that , where and is the initial bacterial density in the simulations and in our experimental data, respectively. With the spatial scale fixed, we can find the equivalence between simulation timesteps and minutes using the viral diffusion constant in our simulations and our experimental data, and respectively. We first note that which is in all our simulations, and is function of , in accordance to our fitted values in (Fig. 1c). We then have that
| (33) |
where is in units of . Given a value of , we can use this equivalence to convert and to minutes.
Acknowledgements.
We acknowledge help from R. Majed in performing bacterial transformations. DF thanks Kirill Korolev and Oskar Hallatschek for helpful discussions. MH acknowledges studentship funding from EPSRC under grant number EP/R513180/1. NK acknowledges funding from the Gates Cambridge Scholarship. TL acknowledges college grant from St Edmund Hall. This work was performed using resources provided by the Cambridge Service for Data Driven Discovery (CSD3) operated by the University of Cambridge Research Computing Service, provided by Dell EMC and Intel using Tier-2 funding from the Engineering and Physical Sciences Research Council (capital grant EP/P020259/1), and DiRAC funding from the Science and Technology Facilities Council.Appendix A Phage Remain On Agar Surface
To verify that phage are not diffusing out of the approximately 2D plane and into the agar during the course of the diffusion experiments, additional tests were carried out. If significant diffusion into the agar was occurring, we would expect the number of phage at the surface to be reduced over time. As with the measurements of diffusion coefficient (see Methods), 35 ml omni-plates of 20 g/l (2%) agar, with LB and 15 g/ml chloramphenicol were prepared. Similarly, overnight liquid cultures of susceptible host (E. coli eMTH43) were grown from single colonies at 37 °C in LB with 15 g/ml chloramphenicol.
Then, 1.5 ml of stock bacteriophage T7 diluted in LB was spread across the plate with glass beads, such that the plate should contain a countable (order of tens) number of phage.
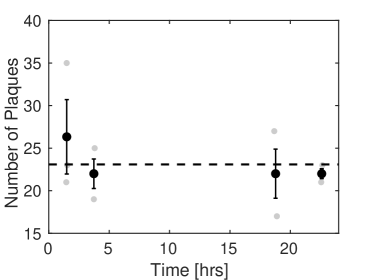
After a set time period (approximately 1.5, 4, 19 or 23 hours), 100 l of overnight eMTH43 was mixed with 10 ml of molten 7 g/l (0.7%) agar and poured over the surface of the plate and left on a lab bench overnight. Any phage that were located on the surface of the 2% agar at the time in which the 0.7% agar and susceptible eMTH43 was poured on top is expected to be able to infect the susceptible host and result in a plaque. By counting the number of plaques visible in the 0.7% agar the following morning, we are able to determine whether a signficant amount of phage diffuses into the 2% agar plate over a 24 hour period as these phage would not be able to form a plaque.
The results from this test (Fig. 7) clearly show that there is no significant reduction in the number of phage recovered from the surface of the plate over a roughly 24 hour period (the period over which diffusion measurements were gathered). We believe that this is because the pore size of our 2% agar is small enough to significantly limit diffusion. Indeed, similar 2% agarose substrates have been shown to have a pore size of under 80 nm [60], which is comparable with the size of T7.
Appendix B Monte Carlo Simulations of Diffusion
Monte Carlo simulations of point-like phage diffusing across a lawn of penetrable “sticky” disks, representing adsorbing host bacteria in the absence of steric effects were performed. The simulations are carried out in a 2D box with periodic boundary conditions, populated with circular obstacles of fixed diameter , representing a lawn of host bacteria cells. Obstacles are generated with random center co-ordinates within the boundary of the lawn until a fraction of the area of the lawn is occupied (obstacles may overlap). We use sticky penetrable obstacles to mimic the implicit hindrance to diffusion due to infection dynamics. A hundred of point-like tracers (representing phage) are placed on the lawn and diffuse in discrete steps. At each step, every free tracer proposes a new random co-ordinate within a circular region of radius of its current position. If there is no obstacle at the new co-ordinate, the tracer jumps to the new position. If, however, there is an obstacle at the new co-ordinate, the tracer jumps to the new position and, with probability , adsorbs to that obstacle. Upon successful adsorption, the tracer remains bound to the obstacle for a number of steps (representing the viral incubation period).
The size of the lawn is , and . We use 100 phages for each simulation, and run 100 simulations. The simulations are run for 3 million steps, to observe equilibration of the diffusive behavior. After a brief initial transient period, we plot the mean square displacement averaged over all tracer particles in each simulation as a function of time and fit a linear function. The slope of this function is equivalent to where is the diffusion coefficient. To randomise the position of the host, we run 100 independent simulations. The final diffusion coefficient is estimated by calculating the average and the standard deviation of the diffusion coefficients across these simulations. The relative diffusion coefficient is then determined by dividing this results with the theoretical free diffusion coefficient given by the simulation parameters.
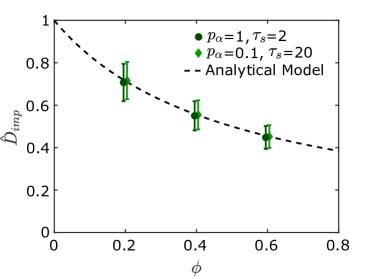
These results show that the hindrance posed by the underlying viral dynamic is equivalent to an “implicit” density-dependent reduction in diffusion (Fig. 8). We find quantitative agreement with the mean-field analytical model discussed in the main text (Eq. 7 and Methods), both in terms of the dependence on , and that the behaviour does not depend on and independently, but rather depends only on the product . This is in agreement with the fact that the behaviour in the UDMs depends only on .
Appendix C Ratio of Explicit to Implicit Effects
Here we present a plot of the ratio of the explicit boost to diffusion , when transitioning from UDM to VDM, to the implicit boost to diffusion when transitioning from UDM+ to UDM-, or from VDM+ to VDM-, as a function of and . This is obtained by determining the strength of each effect at the front position where the phage population is 3/4 times the steady state population . It can be seen in Fig. 9 that the implicit boost is dominant at large , while the explicit boost dominates at low .
Appendix D The Impact of Burst Size
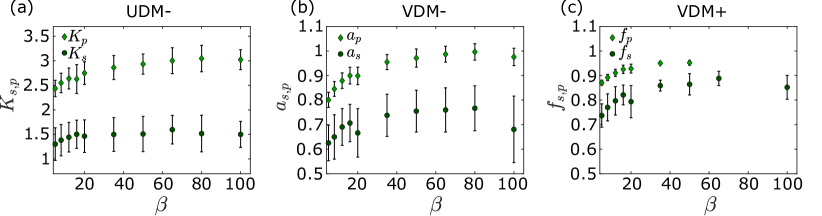
In Fig. 10 we present phase diagrams such as in Fig. 3, but for a burst size =20 instead of =50. It can be seen by comparing both Figures that the qualitative behaviour of the transitions remains unchanged: in the UDM-, transitions are characterised by constant values of and ; in the VDM-, transitions are approximately straight lines characterised by gradients and , and intercepts and (); in the VDM+, transitions are largely independent of , and occur at critical values and .
As it seems the behaviour can be characterised in the same manner when burst size is changed, we simplify our examination by focusing only on how the burst size alters these specific characteristic parameters. Rather than attempting to produce the whole phase diagram for each of the models at various , as this is very computationally intensive when is either small or large, we instead choose a specific value, and for various values of , we vary at this value. From this, the parameters and as a function of can be easily obtained (i.e. the parameters describing the UDM- and VDM+ transitions respectively).
To simplify our investigation of the behaviour in the VDM-, and limit the number of computationally intensive calculations required, we assume that are constant with burst size, and using data from one specific value we calculate how vary as a result. In the two cases where the full phase diagrams were computed, the transition gradients were calculated as and for , indicating agreement to within and respectively.
We find that while the general shape of the transitions for the model variants does not depend on (Fig. 10), the exact location of the transitions are affected (Fig. 11). The dependence of all of the transition parameters on is similar across models. Above 40, the parameters exhibit only a weak dependence on burst size, whereas when decreases below this value, the transition parameters also decrease, increasing the parameter range of and in which we observe a pushed wave.
This behaviour qualitatively matches the dependence of the spreading velocity of the linearised model on burst size (Fig. 12). While and determine the ability of phage in the bulk to catch up to the front and contribute to the dynamics, either due to explicit or implicit hindrance to diffusion, only contributes to the phage growth rate and, as a result, the velocity of the front. At lower values of , the spreading velocity is greatly reduced as the limited number of phage released at the tip after each lysis event struggle to clear the host cells around them. This allows the phage in the back to catch up more easily, regardless of the mechanism, and contribute to the expansion. As burst size is increased however, the opposite is true, although the velocity gains that come with increased become increasingly marginal, as the uninfected host within the vicinity of recently lysed cells become saturated with newly released phage.
Appendix E Bacterial Growth
The model we present in the main text assumes that the host bacteria are not growing. While this certainly can be the case, it is by no means always true, and so it is natural to ask how our results are affected by a growing host population. To this end, we modify our reaction-diffusion model to include a logistic growth term:
| (34a) | |||
| (34b) | |||
| (34c) |
where terms in bold indicate new terms, and is the growth rate of the bacteria at low densities. We estimate this growth rate by assuming a doubling time of bacteria equal to 30 mins (typical of T7 host E. coli), resulting in ln(2)/30 min-1. Note, that in each case the carrying capacity is equal to the initial bacterial density , meaning that growth only occurs across the front region. This represents the situation that would occur in natural environments where bacteria far from the front have grown to a stationary density (set by ) by the time the front arrives. Additionally, we assume that the replication of infected hosts is negligible due to the burden caused by producing new phage.
It can be seen in Fig. 13 that the introduction of this bacterial growth term has no discernible effect on the type of expansion that occurs in the parameter space describing typical T7 expansion through host E. coli.
Appendix F Cell Debris
Another aspect of the system which our model thus far neglects is the possibility that some of the debris from lysed cells could trigger phage adsorption. If this were the case, it would likely result in a reduction of the parameter space corresponding to pushed waves, as there would be fewer phage in the bulk that were able to catch up to the front. To explore this prospect further, we modify our reaction-diffusion model to account for this possibility:
| (35a) | |||
| (35b) | |||
| (35c) |
where terms in bold indicate new terms, and controls the fraction of lysed cells that are capable of adsorbing phage (or alternatively, how able the cell debris is to adsorb phage in comparison to the cells which generated it). Note that we have limited the model to the case where adsorption to infected hosts occurs, as it seems unlikely that phage would be unable to adsorb to infected hosts but would be able to adsorb to the debris from those hosts (VDM+).
It can be seen in Fig. 14a that while the introduction of adsorbing cell debris does not qualitatively change the behaviour of the model (i.e. that transitions to pushed waves occur at high bacterial fractions in the VDM+), it does have a slight impact on the location of these transitions (Fig. 14b). As the fraction of cell debris capable of adsorbing phage increases, the critical bacteria fractions and where transitions occur also increase. This result confirms our intuition: a larger will cause a greater reduction in free phage in the bulk of the plaque, thereby reducing the number of phage available to catch up to the front and contribute to the expansion dynamics.
While increasing the rate at which cell debris adsorbs phage does result in ‘less pushed’ expansions, we can see in Fig. 15 that the resulting depletion of free phage in the bulk of the expansion is even more significant. Indeed, after an expansion of 50 lysis times (15 hours if =18 mins) we find that there are approximately 105 fewer phage in the bulk than would be found at the expansion front when =0.25, and approximately 1010 when =0.6. These values are clearly unrealistic for T7, as in the laboratory phage can be easily recovered from the centre of a plaque by simply stabbing with a needle. Therefore, if we assume that the steady state phage population at the front is approximately =100 m-2 (=100, =1 m-2), and then very conservatively assume that easy recovery would require at least a phage density of 103 mm-2, then we can conclude that any leading to a central density reduction of more than 105 is physically unrealistic (i.e. ).
Given that transitions to both semi-pushed and fully-pushed waves occur in our model up to a debris fraction =0.25 (which we believe to be the very upper bound of physically realistic behaviour) with only a minor shift in the bacterial fractions where these transitions occur, we can conclude that this effect, should it occur, has only a minor impact on our results.
Appendix G Heterozygosity Decay Without Normalization
In addition to the results presented in the main text (Fig. 6), here we present the effective population size observed in our stochastic simulations for various values of , both before and after normalisation by the steady-state population size (Fig. 16). This normalisation aimed to facilitate a comparison with previous theoretical studies where the carrying capacity of the population was kept constant. As was discussed in the main text however, the parameters in those studies (including carrying capacity) could be independently controlled, whereas in our system the steady state population size is an emergent property that depends both on the phage infection parameters, and the given aspects of the model variant in question. It should therefore be noted that the phage population size behind the expansion front will not always be directly comparable to the carrying capacity as used in these previous studies - take for example the case where phage can adsorb to cell debris (Appendix F), resulting in the depletion of phage behind the front over time.
Appendix H Measuring Lysis Time on Solid Media
As discussed in the main text, our diffusion coefficient experiments raise the question of whether other life history parameters could also depend on the surrounding environment. With this in mind, our findings suggest a way to measure lysis time on solid media and over time during a plaque expansion. Lysis time is traditionally measured in liquid media, since it requires periodic and precise sampling of the phage population, which is challenging to perform on agar plates. The models presented in this paper, which assume a deterministic lysis time, produce a front which expands by the width of the infected region during one lysis time interval. As a result, the dimensionless infection region width is equivalent to the dimensionless velocity , as predicted in all the models and confirmed by the numerics (Fig. 17). By utilising phage engineered to result in fluorescent infected cells [61], imaging a growing plaque of such phage over time in both fluorescent and bright-field channels should yield information about the distributions of infected and uninfected bacteria (see Fig. 2a), and enable determination of the dimensional equivalent of . By simultaneously measuring the velocity of the expansion, the lysis time in solid media and its variation during the course of an expansion could be estimated.
References
- Colautti and Barrett [2013] R. I. Colautti and S. C. H. Barrett, Rapid adaptation to climate facilitates range expansion of an invasive plant., Science (New York, N.Y.) 342, 364 (2013).
- Cavalli-Sforza et al. [1993] L. L. Cavalli-Sforza, P. Menozzi, and A. Piazza, Demic expansions and human evolution, Science 259, 639 (1993).
- Rosenberg et al. [2002] N. A. Rosenberg, J. K. Pritchard, J. L. Weber, H. M. Cann, K. K. Kidd, L. A. Zhivotovsky, and M. W. Feldman, Genetic Structure of Human Populations, Science 298, 2381 LP (2002).
- Ramachandran et al. [2005] S. Ramachandran, O. Deshpande, C. C. Roseman, N. A. Rosenberg, M. W. Feldman, and L. L. Cavalli-Sforza, Support from the relationship of genetic and geographic distance in human populations for a serial founder effect originating in Africa., Proceedings of the National Academy of Sciences of the United States of America 102, 15942 (2005).
- Templeton [2002] A. R. Templeton, Out of Africa again and again, Nature 416, 45 (2002).
- Chen et al. [2011] I.-C. Chen, J. K. Hill, R. Ohlemüller, D. B. Roy, and C. D. Thomas, Rapid range shifts of species associated with high levels of climate warming., Science (New York, N.Y.) 333, 1024 (2011).
- Hewitt [1996] G. M. Hewitt, Some genetic consequences of ice ages, and their role in divergence and speciation, Biological Journal of the Linnean Society 58, 247 (1996).
- Hewitt [2000] G. Hewitt, The genetic legacy of the quaternary ice ages, Nature 405, 907 (2000).
- Hallatschek and Nelson [2008] O. Hallatschek and D. R. Nelson, Gene surfing in expanding populations, Theoretical Population Biology 73, 158 (2008).
- Klopfstein et al. [2006] S. Klopfstein, M. Currat, and L. Excoffier, The Fate of Mutations Surfing on the Wave of a Range Expansion, Molecular Biology and Evolution 23, 482 (2006).
- van Saarloos [2003] W. van Saarloos, Front propagation into unstable states, Physics Reports 386, 29 (2003).
- Roques et al. [2012] L. Roques, J. Garnier, F. Hamel, and E. K. Klein, Allee effect promotes diversity in traveling waves of colonization., Proceedings of the National Academy of Sciences of the United States of America 109, 8828 (2012).
- Allee [1931] W. C. Allee, Co-Operation Among Animals, American Journal of Sociology 37, 386 (1931).
- Birzu et al. [2019] G. Birzu, S. Matin, O. Hallatschek, and K. S. Korolev, Genetic drift in range expansions is very sensitive to density dependence in dispersal and growth, Ecology Letters 22, 1817 (2019).
- Birzu et al. [2018] G. Birzu, O. Hallatschek, and K. S. Korolev, Fluctuations uncover a distinct class of traveling waves, Proceedings of the National Academy of Sciences of the United States of America 115, E3645 (2018).
- Johnson et al. [2006] D. M. Johnson, A. M. Liebhold, P. C. Tobin, and O. N. Bjørnstad, Allee effects and pulsed invasion by the gypsy moth, Nature 444, 361 (2006).
- Veit and Lewis [1996] R. R. Veit and M. A. Lewis, Dispersal, population growth, and the allee effect: Dynamics of the house finch invasion of eastern North America, American Naturalist 148, 255 (1996).
- Gandhi et al. [2016] S. R. Gandhi, E. A. Yurtsev, K. S. Korolev, and J. Gore, Range expansions transition from pulled to pushed waves as growth becomes more cooperative in an experimental microbial population, Proceedings of the National Academy of Sciences 113, 6922 (2016).
- Gandhi et al. [2019] S. R. Gandhi, K. S. Korolev, and J. Gore, Cooperation mitigates diversity loss in a spatially expanding microbial population, Proceedings of the National Academy of Sciences of the United States of America 116, 23582 (2019).
- Matthysen [2005] E. Matthysen, Density-dependent dispersal in birds and mammals, Ecography 28, 403 (2005).
- Yin and McCaskill [1992] J. Yin and J. S. McCaskill, Replication of Viruses in a Growing Plaque - A Reaction-Diffusion Model, Biophysical Journal 61, 1540 (1992).
- Alvarez et al. [2007] L. J. Alvarez, P. Thomen, T. Makushok, and D. Chatenay, Propagation of fluorescent viruses in growing plaques, Biotechnology and Bioengineering 96, 615 (2007).
- You and Yin [1999] L. You and J. Yin, Amplification and Spread of Viruses in a Growing Plaque, Journal of Theoretical Biology 200, 365 (1999).
- Fort and Méndez [2002] J. Fort and V. Méndez, Time-delayed spread of viruses in growing plaques, Physical Review Letters 89, 10.1103/PhysRevLett.89.178101 (2002).
- Ortega-Cejas et al. [2004] V. Ortega-Cejas, J. Fort, V. Méndez, and D. Campos, Approximate solution to the speed of spreading viruses, Physical Review E 69, 031909 (2004).
- Möbius et al. [2015] W. Möbius, A. W. Murray, and D. R. Nelson, How Obstacles Perturb Population Fronts and Alter Their Genetic Structure, PLOS Computational Biology 11, e1004615 (2015).
- Qimron et al. [2006] U. Qimron, B. Marintcheva, S. Tabor, and C. C. Richardson, Genomewide screens for Escherichia coli genes affecting growth of T7 bacteriophage, Proceedings of the National Academy of Sciences 103, 19039 LP (2006).
- Fricke [1924] H. Fricke, A mathematical treatment of the electric conductivity and capacity of disperse systems I. The electric conductivity of a suspension of homogeneous spheroids, Physical Review 24, 575 (1924).
- Crank and Crank [1979] J. Crank and E. P. J. Crank, The Mathematics of Diffusion, Oxford science publications (Clarendon Press, 1979).
- Stollar and Levine [1963] D. Stollar and L. Levine, Two-dimensional immunodiffusion, Methods in Enzymology 6, 848 (1963).
- Ackermann [1976] H. W. Ackermann, Classification of tailed enterobacteria phages, Pathologie-biologie 24, 359 (1976).
- Jones et al. [2012] D. A. Jones, H. L. Smith, H. R. Thieme, and G. Röst, On spread of phage infection of bacteria in a petri dish, SIAM Journal on Applied Mathematics 72, 670 (2012).
- Amor and Fort [2010] D. R. Amor and J. Fort, Virus infection speeds: Theory versus experiment, Physical Review E 82, 061905 (2010).
- Amor and Fort [2014] D. R. Amor and J. Fort, Cohabitation reaction–diffusion model for virus focal infections, Physica A: Statistical Mechanics and its Applications 416, 611 (2014).
- de Rioja et al. [2015] V. de Rioja, J. Fort, and N. Isern, Front propagation speeds of T7 virus mutants, Journal of Theoretical Biology 385, 112 (2015).
- Park and Gokhale [2019] H. J. Park and C. S. Gokhale, Ecological feedback on diffusion dynamics, Royal Society Open Science 6, 181273 (2019).
- Cates et al. [2010] M. E. Cates, D. Marenduzzo, I. Pagonabarraga, and J. Tailleur, Arrested phase separation in reproducing bacteria creates a generic route to pattern formation, Proceedings of the National Academy of Sciences of the United States of America 107, 11715 (2010).
- Labrie et al. [2010] S. J. Labrie, J. E. Samson, and S. Moineau, Bacteriophage resistance mechanisms, Nature Reviews Microbiology 8, 317 (2010).
- Braun et al. [1994] V. Braun, H. Killmann, and C. Herrmann, Inactivation of FhuA at the cell surface of Escherichia coli K-12 by a phage T5 lipoprotein at the periplasmic face of the outer membrane, Journal of Bacteriology 176, 4710 (1994).
- Pedruzzi et al. [1998] I. Pedruzzi, J. P. Rosenbusch, and K. P. Locher, Inactivation in vitro of the Escherichia coli outer membrane protein FhuA by a phage T5-encoded lipoprotein, FEMS Microbiology Letters 168, 119 (1998).
- Perry et al. [2009] L. L. Perry, P. SanMiguel, U. Minocha, A. I. Terekhov, M. L. Shroyer, L. A. Farris, N. Bright, B. L. Reuhs, and B. M. Applegate, Sequence analysis of Escherichia coli O157:H7 bacteriophage v10 and identification of a phage-encoded immunity protein that modifies the O157 antigen, FEMS Microbiology Letters 292, 182 (2009).
- Newton et al. [2004] G. J. Newton, C. Daniels, L. L. Burrows, A. M. Kropinski, A. J. Clarke, and J. S. Lam, Three-component-mediated serotype conversion in Pseudomonas aeruginosa by bacteriophage D3, Molecular Microbiology 39, 1237 (2004).
- Bondy-Denomy et al. [2016] J. Bondy-Denomy, J. Qian, E. R. Westra, A. Buckling, D. S. Guttman, A. R. Davidson, and K. L. Maxwell, Prophages mediate defense against phage infection through diverse mechanisms, ISME Journal 10, 2854 (2016).
- van Houte et al. [2016] S. van Houte, A. Buckling, and E. R. Westra, Evolutionary Ecology of Prokaryotic Immune Mechanisms., Microbiology and molecular biology reviews : MMBR 80, 745 (2016).
- Walsh and Naghavi [2019] D. Walsh and M. H. Naghavi, Exploitation of Cytoskeletal Networks during Early Viral Infection, Trends in Microbiology 27, 39 (2019).
- Doceul et al. [2010] V. Doceul, M. Hollinshead, L. Van Der Linden, and G. L. Smith, Repulsion of superinfecting virions: A mechanism for rapid virus spread, Science 327, 873 (2010).
- Panja [2004] D. Panja, Effects of fluctuations on propagating fronts, Physics Reports 393, 87 (2004).
- Matsuyama et al. [1994] T. Matsuyama, K. Komatsu, A. Nakahara, and M. Matsushita, Experimental Investigation on the Validity of Population Dynamics Approach to Bacterial Colony Formation, Journal of the Physical Society of Japan 63, 1205 (1994).
- Giometto et al. [2014] A. Giometto, A. Rinaldo, F. Carrara, and F. Altermatt, Emerging predictable features of replicated biological invasion fronts, Proceedings of the National Academy of Sciences of the United States of America 111, 297 (2014).
- Peischl et al. [2015] S. Peischl, M. Kirkpatrick, and L. Excoffier, Expansion load and the evolutionary dynamics of a species range., The American naturalist 185, 81 (2015).
- Bosshard et al. [2017] L. Bosshard, I. Dupanloup, O. Tenaillon, R. Bruggmann, M. Ackermann, S. Peischl, and L. Excoffier, Accumulation of Deleterious Mutations During Bacterial Range Expansions, Genetics 207, 669 (2017).
- Kerr et al. [2006] B. Kerr, C. Neuhauser, B. J. M. Bohannan, and A. M. Dean, Local migration promotes competitive restraint in a host-pathogen ‘tragedy of the commons’, Nature 442, 75 (2006).
- Yin [1993] J. Yin, Evolution of bacteriophage T7 in a growing plaque., Journal of Bacteriology 175, 1272 LP (1993).
- Choua and Bonachela [2019] M. Choua and J. A. Bonachela, Ecological and evolutionary consequences of viral plasticity, American Naturalist 193, 346 (2019).
- Kaczmarczyk et al. [2013] A. Kaczmarczyk, J. A. Vorholt, and A. Francez-Charlot, Cumate-inducible gene expression system for sphingomonads and other Alphaproteobacteria, Applied and Environmental Microbiology 79, 6795 (2013).
- Schindelin et al. [2012] J. Schindelin, I. Arganda-Carreras, E. Frise, V. Kaynig, M. Longair, T. Pietzsch, S. Preibisch, C. Rueden, S. Saalfeld, B. Schmid, J.-Y. Tinevez, D. J. White, V. Hartenstein, K. Eliceiri, P. Tomancak, and A. Cardona, Fiji: an open-source platform for biological-image analysis, Nature Methods 9, 676 (2012).
- Rueden et al. [2017] C. T. Rueden, J. Schindelin, M. C. Hiner, B. E. DeZonia, A. E. Walter, E. T. Arena, and K. W. Eliceiri, ImageJ2: ImageJ for the next generation of scientific image data, BMC Bioinformatics 18, 529 (2017).
- Klein [1952] G. Klein, Mean first-passage times of Brownian motion and related problems, Proceedings of the Royal Society of London. Series A. Mathematical and Physical Sciences 211, 431 (1952).
- Ebert and Van Saarloos [2000] U. Ebert and W. Van Saarloos, Front propagation into unstable states: Universal algebraic convergence towards uniformly translating pulled fronts, Physica D: Nonlinear Phenomena 146, 1 (2000).
- Narayanan et al. [2006] J. Narayanan, J. Y. Xiong, and X. Y. Liu, Determination of agarose gel pore size: Absorbance measurements vis a vis other techniques, Journal of Physics: Conference Series 28, 83 (2006).
- Vidakovic et al. [2018] L. Vidakovic, P. K. Singh, R. Hartmann, C. D. Nadell, and K. Drescher, Dynamic biofilm architecture confers individual and collective mechanisms of viral protection, Nature Microbiology 3, 26 (2018).