Screening Effects on Electron Capture Rates and Type Ia Supernova Nucleosynthesis
Abstract
Type Ia supernovae (SNe Ia) are believed to be a thermonuclear explosion of a white dwarf, but the mass of their progenitors is still an open problem. In near-Chandrasekhar-mass (near-) models of SNe Ia, the central density reaches . The electron chemical potential becomes higher than the -values of electron capture (EC) transitions between -shell nuclei, so a portion of the available electrons is captured by iron group elements and thus neutron-rich isotopes are formed. Since EC reaction rates are sensitive to the density, the degree of neutronization is a key to distinguish near- and sub- models. In order to compare observations and theoretical models, an accurate treatment of EC reactions is necessary. In previous theoretical works, however, effects of electron screening on ECs are ignored. Screening lowers EC rates and thus leads to a higher electron fraction. We implement electron screening on ECs to calculate explosive SN Ia nucleosynthesis in a near- single degenerate model. It is found that some of neutron-rich nuclear abundances, namely those of 46, 48Ca, 50Ti, 54Cr, 58Fe, 64Ni and 67, 70Zn, decrease when screening effects on ECs are considered. Of these, 50Ti, 54Cr and 58Fe are particularly interesting because a significant portion of the solar abundance of these nuclei is presumed to originate from SNe Ia. We conclude that implementing the screening effect on ECs in modern SN Ia models is desirable to precisely calculate abundances of neutron-rich nuclides.
1 Introduction
Explosive nucleosynthesis in Type Ia supernovae (SNe Ia) is a major source of iron group elements in the Galaxy, but the nature of their progenitor is still under debate. Proposed models of SN Ia progenitors are classified into two regimes. In near-Chandrasekhar-mass (near-) models (e.g. Whelan & Iben, 1973; Iben & Tutukov, 1984), carbon fusion is ignited in a white dwarf (WD) when its mass gets close to . On the other hand, in sub- models (e.g. Woosley & Weaver, 1994; Guillochon et al., 2010), a SN explosion is triggered even if a WD is lighter than .
Electron capture (EC) reactions play a key role in each model. In near -models, more neutron-rich isotopes are produced because of the high central density . Abundances of neutron-excess isotopes have been measured in astronomical observations. X-ray observations of SN Ia remnants Kepler (Park et al., 2013), Tycho (Yamaguchi et al., 2014), and 3C 397 (Yamaguchi et al., 2015) have been performed to estimate the nickel and manganese abundances. Also, late-time light curves of SN 2011fe (Shappee et al., 2017; Dimitriadis et al., 2017), 2012cg (Graur et al., 2016), 2013aa (Jacobson-Galán et al., 2018), 2014J (Yang et al., 2018; Li et al., 2019), and 2015F (Graur et al., 2018) can be used to estimate the abundances of 57Co and 55Fe, assuming that they are powered by the decay-chains of isobars mass numbers and (Seitenzahl, Taubenberger, & Sim, 2009). In order to understand the origin of SN Ia, it is necessary to accurately calculate abundances of neutron-rich nuclei and compare the models with the observations.
The measurement of EC rates of fully-stripped unstable nuclei is all but impossible, so nuclear shell models have been adopted to calculate them theoretically (Fuller, Fowler & Newman, 1982a, b; Dean et al., 1998; Langanke & Martínez-Pinedo, 2001; Honma et al., 2004, 2005). Although the shell models have gradually become more sophisticated, only bare EC rates have been used as an input to SN Ia models (e.g. Iwamoto et al., 1999; Brachwitz et al., 2000; Parikh et al., 2013; Mori et al., 2016, 2018; Bravo, 2019). However, since nuclear reactions in SNe occur in ionized plasma, electron screening changes effective nuclear reaction rates. Such effects have been considered only for thermonuclear charged particle reaction rates (Salpeter, 1954; Dewitt, Graboske & Cooper, 1973; Graboske et al., 1973; Famiano, Balantekin, & Kajino, 2016). Effects of screening on ECs have not been estimated in SNe Ia, though they have been explored in big bang nucleosynthesis (Luo et al., 2020) and SNe II (Famiano et al., 2020). These potentially affect neutronization in SNe Ia remarkably.
We therefore perform calculations of SN Ia nucleosynthesis with screened EC rates. This paper is organized as follows. In Section 2, we explain the method to calculate the effect of screening on ECs and the adopted SN Ia models. In Section 3, we compare the results of SN Ia nucleosynthesis calculations with and without electron screening with each other. These results are discussed and summarized in Section 4.
2 Method
2.1 Electron Capture Rates
The EC rates in stellar environments are evaluated as (Fuller, Fowler & Newman, 1982a, b; Langanke & Martínez-Pinedo, 2001; Suzuki et al., 2011)
| (1) |
where () is electron energy (momentum) in units of (), is the electron mass, and are nuclear masses of parent and daughter nuclei, respectively, and () is the excitation energy of initial (final) state. Here, and are Gamow-Teller and Fermi transition strengths, respectively, given by
| (2) |
where is the total spin of initial state and . is the Fermi function and is the Fermi-Dirac distribution for electrons, with the chemical potential determined at high densities, electron fraction, and temperature, indicated by , , and , respectively. The chemical potential is determined by,
| (3) |
where for electrons and for positrons and is the positron chemical potential.
Here, the Coulomb corrections on the transition rates due to the electron background are studied. The screening effects on both electrons and ions are taken into account for the Coulomb effects (Juodagalvis et al., 2010; Toki et al., 2013; Suzuki, Nomoto & Toki, 2016). The screening effects of electrons are evaluated by using the dielectric function obtained by relativistic random phase approximation (RPA) (Itoh et al., 2002). The effect is included by reducing the chemical potential of electrons by an amount equal to the modification of the Coulomb potential at the origin (Juodagalvis et al., 2010), where
| (4) |
Here, is the static longitudinal dielectric function at zero frequency, and with and the electron wave number and Fermi wave number, respectively. The modification to the Coulomb potential is tabulated in Itoh et al. (2002).
The other Coulomb effect is caused by the screening of the ions in the electron background. The threshold energy is modified by
| (5) |
where (Z) is the Coulomb chemical potential of the nucleus with charge number Z (Slattery, Doolen & DeWitt, 1982; Ichimaru, 1993). The Coulomb chemical potential in a plasma of electron number density and temperature is given by
| (6) |
with = Z5/3 , and = . The function for the strong-coupling regime, , is given by Equation (A.48) in Ichimaru (1993), while for the weak-coupling regime, , an analytic function given by Yakovlev & Shalybkov (1989) is used (see also Equation (A.6) in Juodagalvis et al., 2010). The threshold energy is enhanced for EC processes, and the EC (-decay) rates are reduced (enhanced) by the Coulomb effects.
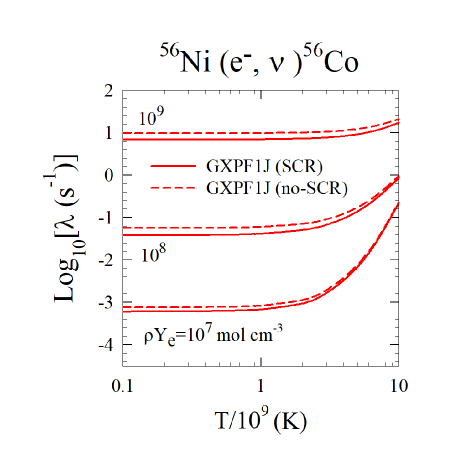
The EC rates for -shell in stellar environments are evaluated with the use of the shell-model Hamiltonian, GXPF1J (Honma et al., 2005), which is a modified version of GXPF1 (Honma et al., 2004). The quenching of the axial-vector coupling constant is taken to be = 0.74 (Caurier et al., 2005). Transitions from the states with excitation energies up to MeV are taken into account. Here, the experimental data such as excitation energies for excited states in both parent and daughter nuclei and values are taken into account when they are available in the online retrival system of National Nuclear Data Center111https://www.nndc.bnl.gov/. Calculated e-capture rates for 56Ni (e-, ) 56Co with and without the screening effects are shown in Fig. 1. The weak rates for the case with the screening effects are found to be reduced by about 20-40 compared with those without the screening effects.
2.2 Nucleosynthesis Calculation
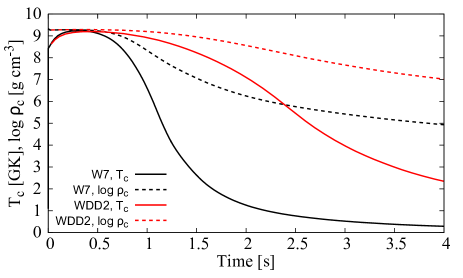
Because nucleosynthesis in sub- models is nearly as sensitive to EC rates (Bravo, 2019), we focus on near- models. Physical mechanism of propagation of the burning front in SNe Ia is still unclear (e.g. Niemeyer, 1999; Branch & Wheeler, 2017). We adopt two one-dimensional near- models with different burning schemes. One is W7 (Nomoto, Thielemann & Yokoi, 1984), which is a widely-used deflagration model, and the other is WDD2 (Iwamoto et al., 1999), which is a delayed-detonation model. These models adopt the equation of state in Slattery, Doolen & DeWitt (1982) and Slattery et al. (1980), which take the Coulomb correction into account. Since the critical density of the deflagration-detonation transition is not known (Niemeyer & Kerstein, 1997), it is assumed to be in WDD2. The time evolution of the central temperature and density of the models is shown in Fig. 2.
We performed nuclear reaction network calculations as a post process with W7 and WDD2 using libnucnet (Meyer & Adams, 2007). The initial composition is , , and , where is the mass fraction of each nucleus . The network calculation is performed until 100 s after the ignition at the WD center and after that unstable nuclei are forced to decay. The network includes 5441 nuclear species up to astatine. Thermonuclear reaction rates are taken from the JINA REACLIB v1.1 database (Cyburt et al., 2010). EC rates of -shell nuclei are calculated from the GXPF1J shell model (Honma et al., 2005). The EC rates of other nuclei are taken from Oda et al. (1994) and Fuller, Fowler & Newman (1982a, b). The treatment of electron screening for thermonuclear reactions is based on Wallace, Woosley & Weaver (1982). Screened EC rates for -shell nuclei are treated as we explain in Section 2.1, and the screening effect on EC rates for other nuclei is not considered. The EC rates are tabulated in a range mol cm-3 and K (Honma & Suzuki, 2020). The libnucnet calculates the effective -values (Fuller, Fowler & Newman, 1985) from the tabulated rates and interpolate as a linear function of and to perform the network calculation.
3 Results
Using the modifications to the EC capture rates previously computed, the W7 and WDD2 thermodynamic trajectories were used to compute the final nuclear abundances in each model.
3.1 W7 Model
The neutronization degree of plasma can be represented by the electron fraction , where is the atomic number and is the mole fraction of the -th nuclear species. Thus, for equal numbers of neutrons and protons, the is exactly 0.5. If the number of neutrons exceeds that of protons, the becomes lower than 0.5.
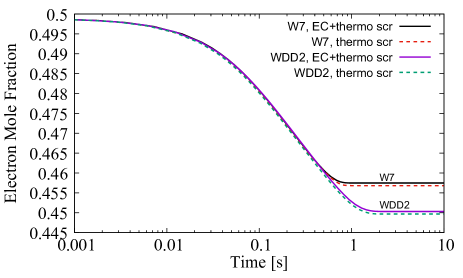
Fig. 3 shows the time evolution of at the center of the explosion. The solid lines indicate the results with the screening effect on both of ECs and thermonuclear reactions, while the broken lines indicate the results with the screening effect only on thermonuclear reactions.
In our models, the initial electron fraction is , which is slightly lower than 0.5 because of the abundance of the neutron-rich nucleus 22Ne in the initial composition. The EC reactions freeze out after s of the explosion. It is seen that the screened lower EC rates results in a higher . The electron fraction at 10 s is if screening on ECs is considered, while if screening only on thermonuclear reactions is considered.
It is known that neutronization in the central region of a WD is determined by the EC on protons (e.g. Bravo, 2019). Although the screening effect on the EC of protons is not considered in the present work, we checked that the change in the EC rate of protons is within . This is because the electric charge of protons is smaller than those of -shell nuclei. When we consider the screening effect on free protons, the central electron fraction is . This value is slightly higher than the one shown in the previous paragraph, but it does not lead to qualitative differences in abundances.
Fig. 4 shows a comparison of the nucleosynthetic yields in the cases with and without the screening effect on ECs. One can find that the abundances of neutron-rich isotopes are smaller when the screening effect on ECs is considered. Most notably, the abundances of 48Ca, 50Ti, 54Cr, 58Fe, 64Ni and 70Zn are 30-50% smaller.
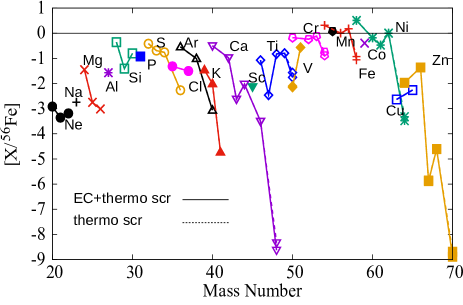
Fig. 5 shows the SN Ia yields normalized to the solar abundances. The normalized abundance for a nuclide is defined as
| (7) |
where and are respectively the number abundances in the SNe Ia models and in the Solar System of species (Lodders, 2020). The solid lines show the result in the case with the screening effect on ECs, while the dashed lines indicate results without EC screening. In a SN Ia, as much as of iron group elements can be produced, while only is produced in a core-collapse SN. For a Galactic SNe Ia event rate of () /century and a core-collapse SNe event rate of () /century (Li et al., 2011), it is expected that of the iron group elements originates from SNe Ia. For the neutron-rich nuclides, production is affected by screening of ECs. The contribution of SNe Ia to the Solar abundance of 48Ca, 50Ti, 64Ni and 70Zn is negligible. However, and reach . This implies that the contribution of SNe Ia for these nuclei can be as high as 5-10%. The contribution of SNe Ia to the Solar abundances of these nuclei is summarized in Table 1. The abundances of 54Cr and 58Fe are significantly affected by screening of ECs. It is therefore remarkably important to consider its effect in discussing the origins of these nuclei.
| 50Ti | 54Cr | 58Fe | |
|---|---|---|---|
| EC+thermo scr | |||
| thermo scr |
3.2 WDD2 Model
The qualitative effect of screening on the WDD2 model is similar to that of the W7 model. Fig. 3 shows the time evolution of . As seen in W7, the resultant is higher as a result of EC screening. The electron fraction at s is if screening effects on ECs and thermonuclear reactions are considered and if screening only on thermonuclear reactions is considered.
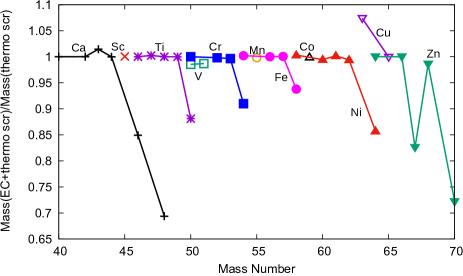
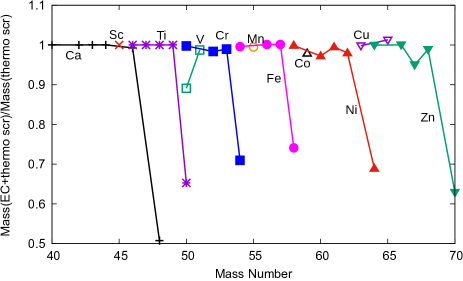
Fig. 6 shows the abundance ratio for cases with and without screening on ECs. It is seen that the abundances of neutron-rich isotopes tend to be smaller if screening on ECs is considered. In particular, the abundances of 46Ca, 48Ca, 50Ti, 54Cr, 58Fe, 64Ni, 67Zn and 70Zn are 10-30% smaller.
While the final abundances of almost all nuclei are not affected by the suppressed EC rates, the abundance of 63Cu increases by 7% when screening on ECs is considered. Half of 63Cu is formed by the -decay of 63Zn whose life-time is 38 min. Because excess of proton number of 63Zn is larger than any stable isotopes of zinc, its abundance increases by the suppressed EC rates. As a result, the abundance of 63Cu becomes higher.
| 50Ti | 54Cr | 58Fe | |
|---|---|---|---|
| EC+thermo scr | |||
| thermo scr |
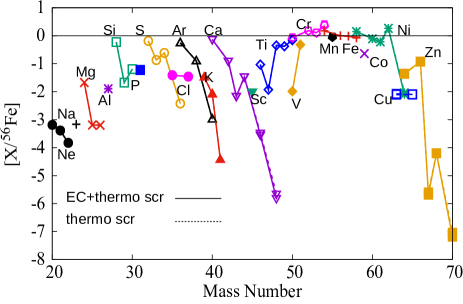
Fig. 7 shows the abundances normalized to Solar values. The solid lines indicate results corresponding to the case with EC screening, and the dashed lines correspond to screening of thermonuclear reactions only. For the nuclides affected by EC screening, the contribution of SNe Ia to the Solar abundances for 46, 48Ca, 64Ni, and 67, 70Zn is negligibly small. However, the abundances of 50Ti, 54Cr, and 58Fe reach , , and , where screening on ECs is considered. The SN Ia contribution to the Solar abundances can be as high as for 50Ti and 58Fe, and for 54Cr. The overproduction of 54Cr has been reported by previous works (Iwamoto et al., 1999; Mori et al., 2016; Leung & Nomoto, 2018) as well. The contribution of SNe Ia for these nuclei is summarized in Table 2.
4 Discussion
In this study, we calculate EC rates of -shell nuclei and apply them to SN Ia nucleosynthesis. The suppressed EC rates result in smaller values in SN ejecta and thus smaller abundances of neutron-rich nuclei. The abundances of 46, 48Ca, 50Ti, 54Cr, 58Fe, 64Ni and 67, 70Zn are most prominently affected, although the details of the abundance pattern and sensitivity to the EC rates depend on the explosion models. This result is consistent with previous works (Brachwitz et al., 2000; Bravo, 2019) which point out strong sensitivity of these nuclei to EC rates.
Screening of ECs does not affect the abundances of isobars with mass numbers of and 57, which are estimated from late-time light curves of SNe Ia. The effect on the elemental abundances of nickel and manganese, which are estimated in SN remnants, are for nickel and for manganese.
Of the neutron-rich nuclei that are affected by screening on ECs, 50Ti, 54Cr and 58Fe are particularly interesting because SNe Ia can significantly contribute to their Solar abundances. Since the production of these nuclei depends on the central density (Seitenzahl et al., 2013; Leung & Nomoto, 2018), they are a good indicator of the mass of SN Ia progenitors. Hence the information of SN Ia models can be imprinted in the Solar abundance patterns of titanium, chromium, and iron. In order to compare the SN Ia models and the observed abundance patterns of these nuclei, we recommend implementing the screened EC rates in modern multi-dimensional SN Ia models (Maeda et al., 2010; Jackson et al., 2010; Krueger et al., 2012; Seitenzahl et al., 2013; Leung & Nomoto, 2018).
The post-processing technique adopted in this study decouples hydrodynamics from detailed nucleosynthesis. However, since the electron pressure depends on , changes in EC rates can significantly affect overall dynamics of SN Ia. For example, incinerated bubbles around the WD center float outwards in three-dimensional models, and their motion is dependent on EC rates (Bravo, 2019). Also, the spatial extent of the density inversion behind the deflagration front is dependent on EC rates (Timmes & Woosley, 1992). These interplays between dynamics and nuclear reactions are not taken into account in the current post-process calculation for one-dimensional explosion models. It is hence desirable to couple hydrodynamics and the updated EC rates and consider multi-dimensionality in future studies.
References
- Brachwitz et al. (2000) Brachwitz, F., Dean, D. J., Hix, W. R., et al. 2000, ApJ, 536, 934
- Branch & Wheeler (2017) Branch, D., & Wheeler, J. C. 2017, Supernova Explosions: Astronomy and Astrophysics Library
- Bravo (2019) Bravo, E. 2019, A&A, 624, A139
- Caurier et al. (2005) Caurier, E., Martínez-Pinedo, G., Nowacki, F., Poves, A., & Zuker, A. P. 2005, \rmp, 77, 427
- Cyburt et al. (2010) Cyburt, R. H., Amthor, A. M., Ferguson, R., et al. 2010, ApJS, 189, 240
- Dean et al. (1998) Dean, D. J., Langanke, K., Chatterjee, L., et al. 1998, Phys. Rev. C, 58, 536
- Dewitt, Graboske & Cooper (1973) Dewitt, H. E., Graboske, H. C., & Cooper, M. S. 1973, ApJ, 181, 439
- Dimitriadis et al. (2017) Dimitriadis, G., Sullivan, M., Kerzendorf, W., et al. 2017, MNRAS, 468, 3798
- Famiano, Balantekin, & Kajino (2016) Famiano, M.A., Balantekin, A.B., & Kajino, T. 2016 Phys. Rev. C, 93, 045804
- Famiano et al. (2020) Famiano, M., Balantekin, A. B., Kajino, T., et al. 2020, ApJ, 898, 163
- Fuller, Fowler & Newman (1982a) Fuller, G. M., Fowler, W. A., & Newman, M. J. 1982, ApJ, 252, 715
- Fuller, Fowler & Newman (1982b) Fuller, G. M., Fowler, W. A., & Newman, M. J. 1982, ApJS, 48, 279
- Fuller, Fowler & Newman (1985) Fuller, G. M., Fowler, W. A., & Newman, M. J. 1985, ApJ, 293, 1
- Graboske et al. (1973) Graboske, H. C., Dewitt, H. E., Grossman, A. S., et al. 1973, ApJ, 181, 457
- Graur et al. (2016) Graur, O., Zurek, D., Shara, M. M., et al. 2016, ApJ, 819, 31
- Graur et al. (2018) Graur, O., Zurek, D. R., Rest, A., et al. 2018, ApJ, 859, 79
- Guillochon et al. (2010) Guillochon, J., Dan, M., Ramirez-Ruiz, E., et al. 2010, ApJ, 709, L64
- Honma et al. (2004) Honma, M., Otsuka, T., Brown, B. A., et al. 2004, Phys. Rev. C, 69, 034335
- Honma et al. (2005) Honma, M., Otsuka, T., Mizusaki, T., et al. 2005, Journal of Physics Conference Series, 7
- Honma & Suzuki (2020) Honma, M. & Suzuki, T. 2020, https://www.phys.chs.nihon-u.ac.jp/suzuki/data5/, and supplementary data material
- Iben & Tutukov (1984) Iben, I., & Tutukov, A. V. 1984, ApJS, 54, 335
- Ichimaru (1993) Ichimaru, S. 1993, \rmp, 65, 255
- Itoh et al. (2002) Itoh, N., Tomizawa, N., Tamamura, M., & Wanajo, S. 2002, ApJ, 579, 380
- Iwamoto et al. (1999) Iwamoto, K., Brachwitz, F., Nomoto, K., et al. 1999, ApJS, 125, 439
- Jackson et al. (2010) Jackson, A. P., Calder, A. C., Townsley, D. M., et al. 2010, ApJ, 720, 99
- Jacobson-Galán et al. (2018) Jacobson-Galán, W. V., Dimitriadis, G., Foley, R. J., et al. 2018, ApJ, 857, 88
- Juodagalvis et al. (2010) Juodagalvis, A., Langanke, K., Hix, W. R., Martínez-Pinedo, G., & Sampaio, J. M. 2010, Nucl. Phys. A, 848, 454
- Krueger et al. (2012) Krueger, B. K., Jackson, A. P., Calder, A. C., et al. 2012, ApJ, 757, 175
- Langanke & Martínez-Pinedo (2001) Langanke, K., & Martínez-Pinedo, G. 2001, Atomic Data and Nuclear Data Tables, 79, 1
- Leung & Nomoto (2018) Leung, S.-C., & Nomoto, K. 2018, ApJ, 861, 143
- Li et al. (2011) Li, W., Chornock, R., Leaman, J., et al. 2011, MNRAS, 412, 1473
- Li et al. (2019) Li, W., Wang, X., Hu, M., et al. 2019, ApJ, 882, 30
- Lodders (2020) Lodders, K. 2020, Solar Elemental Abundances, in The Oxford Research Encyclopedia of Planetary Science, Oxford University Press
- Luo et al. (2020) Luo et al. 2020, Phys. Rev. D, 101, 083010
- Maeda et al. (2010) Maeda, K., Röpke, F. K., Fink, M., et al. 2010, ApJ, 712, 624
- Meyer & Adams (2007) Meyer, B. S., & Adams, D. C. 2007, Meteoritics and Planetary Science Supplement, 42, 5215
- Mori et al. (2016) Mori, K., Famiano, M. A., Kajino, T., et al. 2016, ApJ, 833, 179
- Mori et al. (2018) Mori, K., Famiano, M. A., Kajino, T., et al. 2018, ApJ, 863, 176
- Niemeyer & Kerstein (1997) Niemeyer, J. C., & Kerstein, A. R. 1997, New A, 2, 239
- Niemeyer (1999) Niemeyer, J. C. 1999, ApJ, 523, L57
- Nomoto, Thielemann & Yokoi (1984) Nomoto, K., Thielemann, F.-K., & Yokoi, K. 1984, ApJ, 286, 644
- Oda et al. (1994) Oda, T., Hino, M., Muto, K., et al. 1994, Atomic Data and Nuclear Data Tables, 56, 231
- Parikh et al. (2013) Parikh, A., José, J., Seitenzahl, I. R., et al. 2013, A&A, 557, A3
- Park et al. (2013) Park, S., Badenes, C., Mori, K., et al. 2013, ApJ, 767, L10
- Salpeter (1954) Salpeter, E. E. 1954, Australian Journal of Physics, 7, 373
- Seitenzahl, Taubenberger, & Sim (2009) Seitenzahl, I. R., Taubenberger, S., & Sim, S. A. 2009, MNRAS, 400, 531
- Seitenzahl et al. (2013) Seitenzahl, I. R., Ciaraldi-Schoolmann, F., Röpke, F. K., et al. 2013, MNRAS, 429, 1156
- Shappee et al. (2017) Shappee, B. J., Stanek, K. Z., Kochanek, C. S., et al. 2017, ApJ, 841, 48
- Slattery et al. (1980) Slattery, W. L., Doolen, G. D., & Dewitt, H. E. 1980, Phys. Rev. A, 21, 2087
- Slattery, Doolen & DeWitt (1982) Slattery, W. L., Doolen, G. D., & DeWitt, H. E. 1982, Phys. Rev. A, 26, 2255
- Suzuki et al. (2011) Suzuki, T., Honma, M., Mao, H., Otsuka, T., & Kajino, T. 2011, Phys. Rev. C, 83, 044619
- Suzuki, Nomoto & Toki (2016) Suzuki, T., Nomoto, K., & Toki, H. 2016, ApJ, 817, 163
- Timmes & Woosley (1992) Timmes, F. X. & Woosley, S. E. 1992, ApJ, 396, 649
- Toki et al. (2013) Toki, H., Suzuki, T., Nomoto, K, Jones, S., & Hirschi, R. 2013, Phys. Rev. C, 88, 015806
- Wallace, Woosley & Weaver (1982) Wallace, R. K., Woosley, S. E., & Weaver, T. A. 1982, ApJ, 258, 696
- Whelan & Iben (1973) Whelan, J., & Iben, I. 1973, ApJ, 186, 1007
- Woosley & Weaver (1994) Woosley, S. E., & Weaver, T. A. 1994, ApJ, 423, 371
- Yakovlev & Shalybkov (1989) Yakovlev, D. G. & Shalybkov, D. A. 1989, Astrophys. Space Phys. Res., 7, 311
- Yamaguchi et al. (2014) Yamaguchi, H., Eriksen, K. A., Badenes, C., et al. 2014, ApJ, 780, 136
- Yamaguchi et al. (2015) Yamaguchi, H., Badenes, C., Foster, A. R., et al. 2015, ApJ, 801, L31
- Yang et al. (2018) Yang, Y., Wang, L., Baade, D., et al. 2018, ApJ, 852, 89