Understanding the Enhancement of Scintillation Light in Xenon-Doped Liquid Argon
Abstract
Measuring the scintillation light in noble gases is an important detection technique in particle physics. Numerous rare event searches like neutrino beam experiments, neutrino-less double beta-decay, and dark matter searches use argon-based detectors. In liquid argon, the light yield can be enhanced by the addition of a small quantity of xenon, where ppm are added. The general enhancement mechanism and its pathway via an energy transfer between argon and xenon excimers is well known, however the importance of absorption of argon excimer emission by atomic xenon has not been fully appreciated. This absorption significantly reduces the light yield in commercially available argon (extracted from air) which contains trace amounts ( ppm) of xenon. The addition of a small xenon dopant of ppm recovers this lost light resulting in an increased light yield over un-doped argon of about a factor of two. In this paper we introduce a model for the light production in xenon doped argon, including absorption and re-emission, and compare it to the measured time dependence of light emission in xenon-doped argon.
keywords:
liquid argon , scintillation , xenon doping1 Introduction
The use of liquid noble gases in detectors in physics experiments has become a mainstay. In particular, liquid argon (LAr) has become widely used because of its low cost. A number of experiments use scintillation light in low rate, large volume/mass applications needed in dark sector searches[1],[2],[3] or neutrino detection[4], or as active shield detector for neutrino-less double beta decay experiments like GERDA[5] or LEGEND[6]. Due to the short wavelength of the argon scintillation light ( nm) and the low sensitivity of common light detectors at this range, LAr experiments generally require the use of a wavelength shifting material. Common materials like Tetraphenyl Butadiene, (TPB), have to be coated on detectors, light guides, or on the walls of the cryostats. The possibility of shifting the light within the LAr itself to a different wavelength is therefore intriguing. One possibility is the doping of LAr with xenon with the subsequent creation of xenon excimers which emit light at higher wavelength ( nm)[7]. Previous works have demonstrated that a small dopant concentration of ppm is sufficient to transfer a large portion of the argon scintillation to the xenon emission wavelength[8],[9].
When energy is deposited in pure LAr, argon excimers form which emit light at 128 nm. It is known that trace amounts ( ppm) of xenon remain in commercially available argon extracted from air, leading to absorption of the argon excimer light[10]. In this paper we present a model for this absorption that agrees with our measurement of the light emission as a function of time. This model explains changes in light yield as a function of xenon concentration in the LAr.
2 Light emission in xenon-doped argon
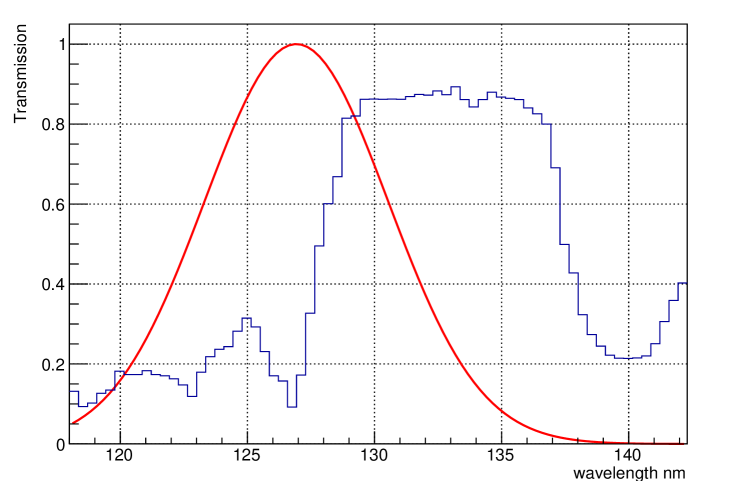
The existence of trapped exciton states of xenon in liquid argon was discovered by Raz and Jortner[11]. These states were observed in the absorption spectrum of liquid argon with ppm xenon[10]. The measured absorption of light through a path length of 11.6 cm liquid argon is shown in figure 1 together with the 128 nm argon excimer emission line superimposed.
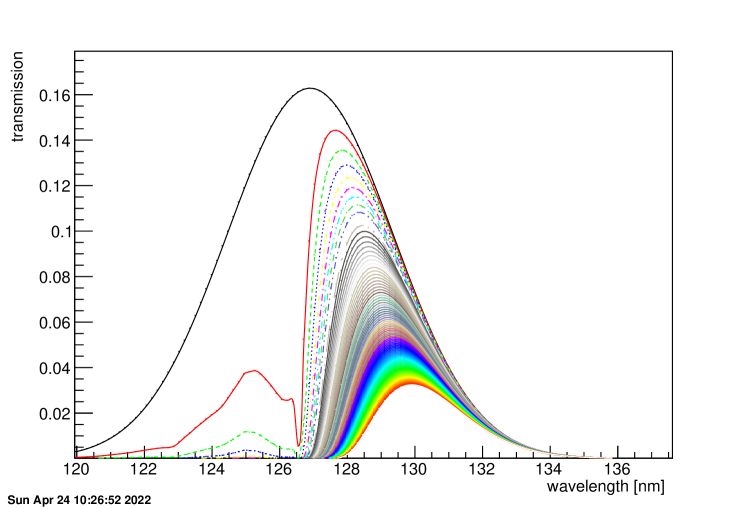
This absorption spectrum is convoluted with the argon excimer emission to obtain the results seen in figure 2, where it is clear that even at low levels of xenon (0.1 ppm) and relatively short distances (11.6 cm), more than half of the initial 128 nm light is absorbed.
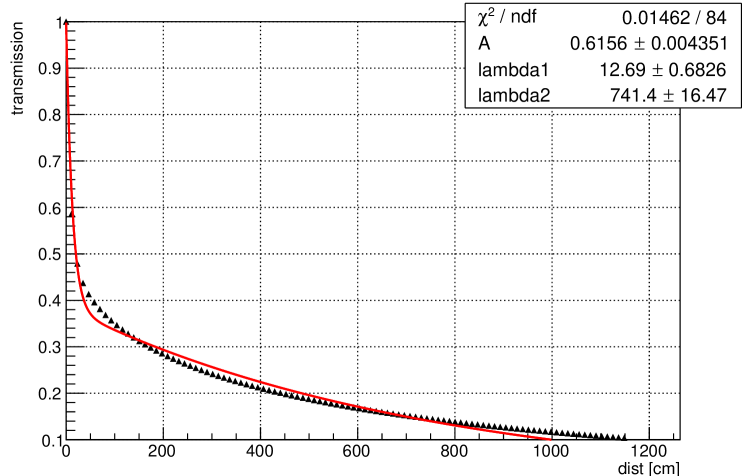
These curves are then integrated over wavelength to obtain the transmission as a function of distance shown in figure 3. This transmission curve is then fitted to the double exponential:
| (1) |
From the fit, for distances in the range from 10-100 cm, the effect is to absorb an approximately constant factor of of the total light, taken from the fit values. This is a key parameter in our model. The cross section for this absorption in liquid argon can be written as , where n is the atomic number density of liquid argon (), is the effective absorption length from the fit (, see fit value of in figure 3), and c is the concentration of xenon atoms in parts per million (0.1 ppm, as given in the reference for the xenon concentration for their data). The result is , in agreement with the result of Ref. [12]. It should be noted that the horizontal axis of the curve (and thus the fit parameters and ) of figure 3 can be scaled for different xenon concentrations by the factor (xenon concentration in ppm)/(0.1 ppm).
Argon excimers are created in singlet () or triplet () states with about 85% in the T state for gammas [13] 111The ratio of singlet to triplet states depends on the type of ionizing radiation, presence of an electric field, etc.. The argon excimer singlet has a lifetime of , whereas the triplet has a much longer lifetime of . As these excimers decay, xenon atoms absorb light and form an exciton state. This state immediately forms the mixed state [14] excimer. The lifetime of the mixed state is long, , and has a decay wavelength of 150 nm[15]. There is a competing process of collisional quenching of the excimer states at a rate of about [16] that contributes to total light loss. The mixed state can form a xenon excimer through diffusion to xenon at a rate which increases with the xenon dopant.
Our model consists of four coupled differential equations for the number of molecules as a function of time for the excimer states argon singlet , argon triplet , and the combined singlet and triplet states of the mixed and xenon :
| (2) |
| (3) |
| (4) |
| (5) |
In these equations, the lifetimes of the different states are labeled using in combination with the corresponding letter as index. We introduce collisional de-excitation factors due to quenching , and , as used in Ref. [16], although we note that the collisional quenching may be stronger for the more weakly bound M and X excimers.
We use [17].222This number appears without reference in [12]. It is close to the value of calculated from the diffusion limited reaction rate using Van der Walls values for the atomic radii[18]. The absorption of the argon excimer deexcitation light at 128nm is parameterized by the dimensionless constant which we take from the fit in figure 3. Although this number varies with dopant, especially at dopant levels less than 1 ppm, it is unknown what the xenon concentration was in the undoped LAr of our experiment, therefore we use the same absorption across all data sets.
Integrating these equations, the total emitted light yield as a function of time is given by,
| (6) |
where and are the number of initial singlet and triplet states, respectively. The decay constants are defined using the introduced half-lifes : , , , . The total number of mixed states as a function of time is
| (7) |
for .
Similarly, the number of xenon states can be described as with
| (8) |
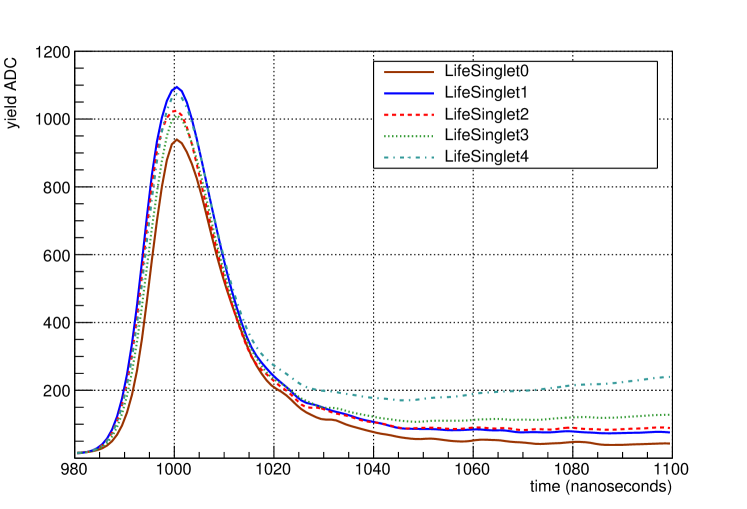
again for . When fitting this distribution to the data, one has to consider that the timing resolution of our detector smears out the exact distributions. We used the measured rise time of the singlet light emission (see figure 8 to determine the timing resolution of our setup, and fold this as a Gaussian distribution into the exponential decay.
3 Experimental Setup
The liquid argon test stand at UNM is described in detail in Ref. [9]. The same reference shows that the measured properties of the argon are in good agreement with previous measurements, and that the doping system is well understood. The apparatus is a 100L cylindrical liquid argon cryostat with a single PMT mounted on the bottom facing upwards. The 3′′ Hamamatsu R11065 Photomultiplier (PMT) has a TPB coated acrylic disk fixed to the front of the tube to shift the light to a wavelength with good detection efficiency.333It should be noted here that the wavelength dependence of TPB is essentially flat over the region 120 - 200 nm[19], so no additional correction is needed for this study The cryostat was filled with argon gas and liquefied using a CryoMech cold head. The amount of LAr in the cryostat was monitored by constantly measuring the weight of the cryostat. On top of the liquid phase, a gas phase is present due to boil-off. The argon gas was circulated through a SAES PS4-MT3/15-R getter, which purifies noble gasses to less than 1 PPB of: , , , , , prior to liquefaction[20]. The operation of the getter and the doping system was verified previously with the introduction of a known amount of nitrogen and monitoring the light yield initially decreasing and then recovering[9]. For the data sets presented in this work, xenon dopant was added to achieve the four concentrations of ppm, , ppm, ,ppm, and ppm. The concentration of the xenon is determined from the volume and pressure of xenon added, and the measured weight of liquid argon in the cryostat. The increase in uncertainty with dopant level is an accumulation of uncertainties in dopant as more xenon was added. Including the un-doped data then, we have a total of five data sets (referred to as sets 0,1,2,3, and 4 for the un-doped, 1 ppm, 2 ppm, 5 ppm, and 10 ppm respectively).
Some data was taken in coincidence with scintillator paddles located above and below the cryostat as a cosmic trigger, however, all data presented here was self-triggered data. Therefore, the events were caused by a mixture of cosmogenics and radiogenics.
4 Event selection and data set preparation
We modified the analysis algorithm used in Ref. [9] due to concerns about after-pulsing in the PMT as well as concerns about the pulse-finding efficiency immediately following the large singlet pulse due to overshoot in the AC coupled PMT (a remnant of this overshoot can be seen in the first two data sets, see Fig. 7). The previous analysis used a derivative-based pulse-finding algorithm. The new algorithm simply sums the event waveforms by run. Additionally, we removed events using data clean-up cuts described below. Because we do not do pulse finding, we are unable to recover the small signal above the noise for late () times.
During data taking, individual long waveforms are recorded. The data includes prior to the trigger from which a baseline is determined. We used a threshold trigger tuned to PE. This value was estimated by comparing the singlet peak of the waveforms to the individual small amplitude pulses in the late light. This threshold was introduced to reduce noise triggers while still remaining very efficient for ionization events. With this threshold, our data was virtually all due to cosmic rays. However, it should be noted for later reference that triggered events represent ionizing events from all orientations and distances to the PMT, and because of the effects of xenon doping, the subset of these cosmic rays may differ between dopant sets.
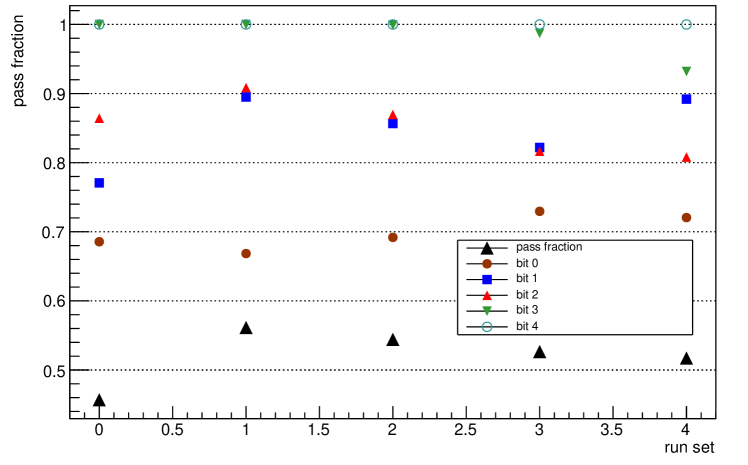
A series of cuts was applied to remove saturated and pile-up events (labeled as bits 0-4 in Figure 4). Saturated events, which come from high energy cosmic ray events, create a false singlet to non-singlet light ratio and are removed (bit 0). Individual waveforms which show either a pulse before the singlet peak (bit 1) or mismatch in baselines at the beginning and the end of the event (bit 2) are also removed from the data set. These cases do not allow for a correct estimate of the singlet value due to a disturbed baseline. Pile-up events and events with high noise can be identified by the presence of a second large peak after the singlet (bit 3). figure 4 shows the overall acceptance is and approximately constant across dopant sets. Individual waveforms have their baseline subtracted, and the peak of the singlet is aligned to 1000 ns to avoid additional smearing due to these time offsets. Additionally, a PMT after-pulsing artifact (due to presence of helium in the PMT) is removed by a simple linear interpolation algorithm (see figure 5.) All events which pass the data quality cuts are then summed by run.
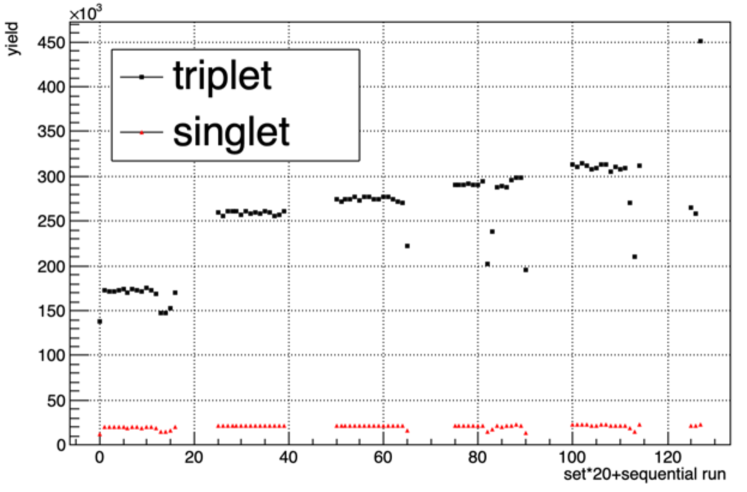
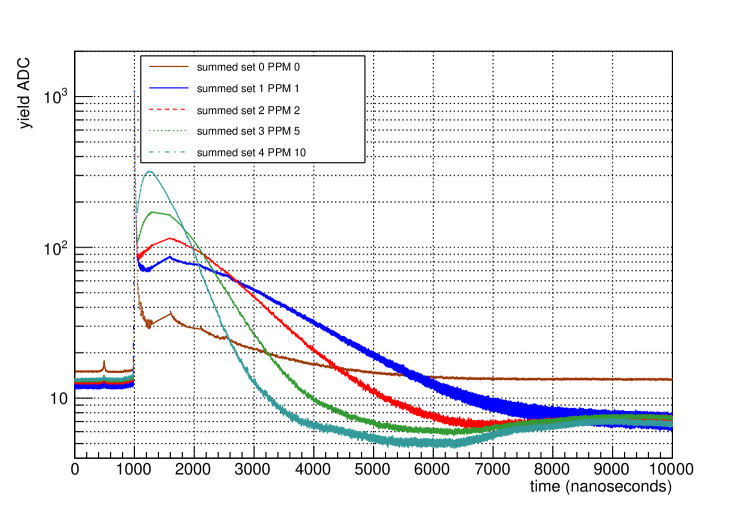
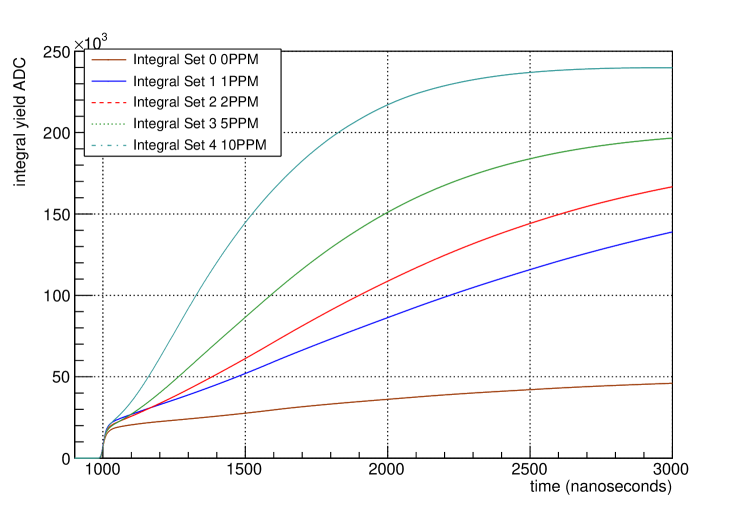
The integrated light from the singlet peak (900-1020 ns) and the late light region (1020-2030 ns) is shown run-by-run in figure 6. The late light region is defined to avoid late-time baseline shifts that we do not attempt to correct (see figure 7). A step-wise increase in the late light region with dopant is clearly apparent, with sets corresponding to 0,1,2,5 and 10 ppm, whereas the singlet light changes very little with dopant (see figure 8). A few obvious outlying runs are removed by hand in the further analysis. The waveforms are then summed by dopant sets and normalized to the number of events in each set (See figure 7). In total about 400000 events for each doping set allow an analysis of the light time distribution with negligible statistical uncertainty. The increase of light with dopant as well as the shift of the light to earlier times is apparent in the integral waveforms shown in figure 9.
5 Model fitting results
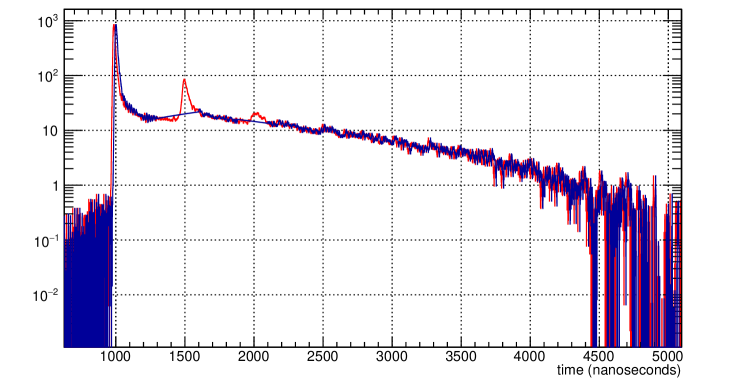
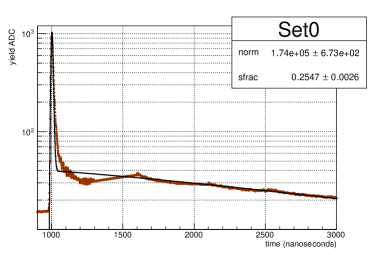
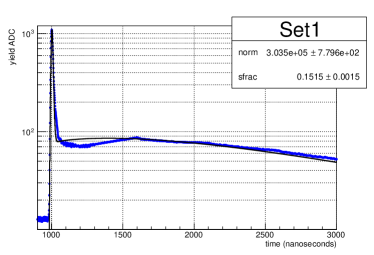
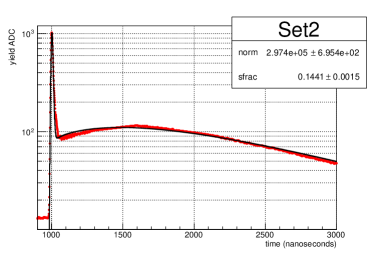
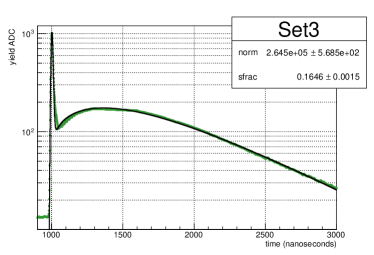
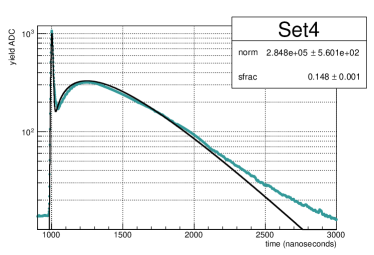
The time distribution of detected light from each set are fitted with the model for each level of doping with only two free parameters for each data set - the normalization (norm) and the fraction of singlet to triplet states (sfrac). The fit region was limited to the region between the trigger time of 980 ns and 3000 ns to avoid problems with the baseline and since the biggest impact of doping is seen in this region. Since we don’t have a measurement of the residual xenon in our undoped argon, we fit by hand the xenon concentration for that set, and used the resulting value (0.4 ppm) as an offset for the remaining sets. With this offset, the constant value of absorbtion, , used for all data sets is justified. The fits are shown in figure 10. All curves show good agreement with the measured light distribution in each data set.
The normalization can be thought of as the total number of initial singlet plus triplet argon excimers (after correction for acceptance and efficiency), and should not depend on doping levels. However, since the absorption of the 128nm light can affect the trigger bias, the relatively small variations seen in the normalization are not considered significant.
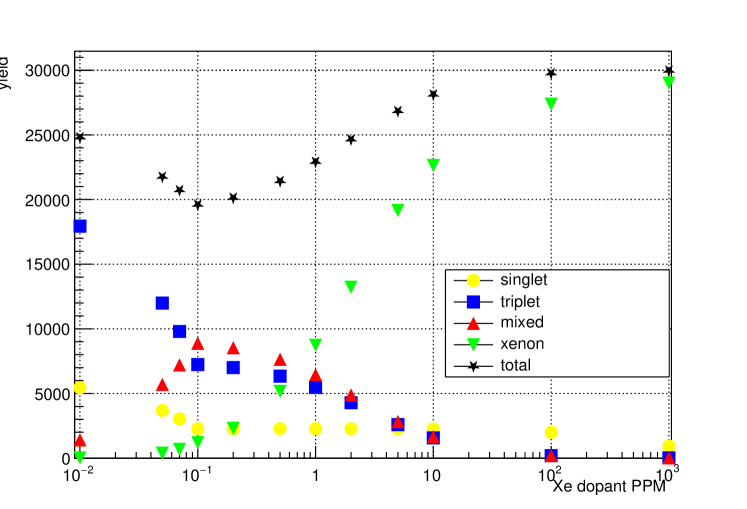
6 Discussion
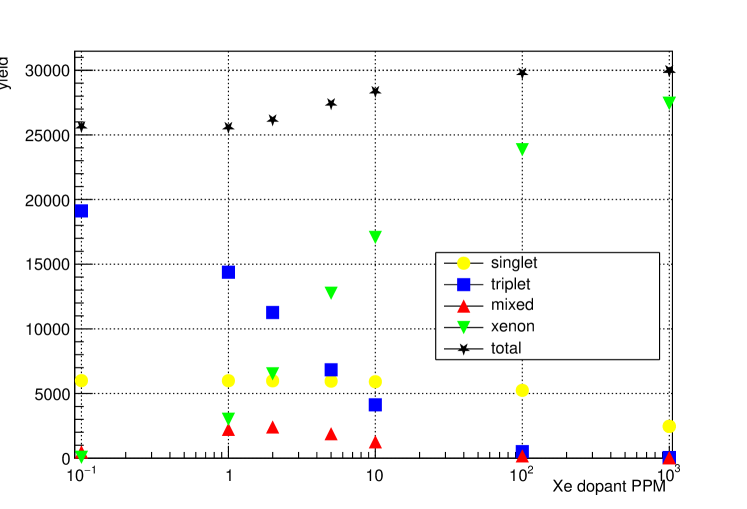
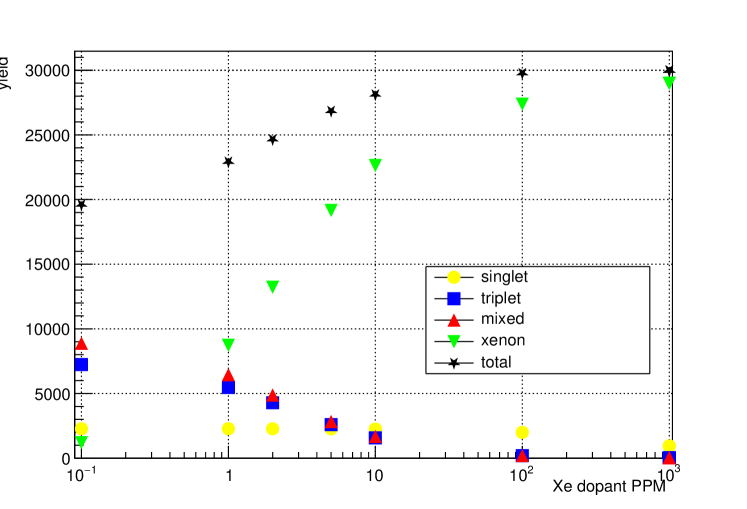
We can use our model to predict the light produced by the separate excimers as a function of dopant. These curves are shown in figure 11 and figure 12, which shows the time-integrated light yield of the individual components as a function of doping. If the absorption is set to zero (figure 11 ) the results are in good agreement with the model by Segreto [13] which indicates a 20% increase in total light yield from 0 ppm to 100 ppm xenon concentration, where we see a 15% increase from 0.1 ppm to 100 ppm without absorption. In our model (without absorption) this increase is due to the transfer of the argon excimer state to the mixed state with dopant, a process which competes with the quenching of the argon state. However, the model of that reference does not include absorption by atomic xenon which increases the rate of mixed state formation. Furthermore, that model doesn’t include quenching of the mixed state. With the inclusion of absorption ( figure 12), results from our data and the results from Ref.[10] are well described. The light yield without dopant is greatly suppressed by the large absorption and creation of mixed excimers with a long lifetime. Both the triplet excimers and the mixed excimers are quenched with the result that much of the light is lost. Addition of the xenon dopant increases the rate of transfer to the xenon excimer state and recovers this lost light.
To use this model at low xenon concentrations ( ppm), we can use the curve of figure 3 to determine the absorption factor corresponding to these low dopant levels. In this case the absorption decreases linearly from the constant A=0.62 to zero. Thus, at these very low xenon concentrations the light yield also increases (see figure 13).
Finally, there has been some concern with xenon doping that particle identification using the ratio of fast to slow light would be negatively impacted. However, as seen from our model, the singlet light yield is not significantly impacted at 10 ppm relative to the residual level of 0.4ṗpm, and while there is more light at earlier times (but after the singlet peak), it should not impact the uncertainty in the ratio of the “fast” to “slow” light, only the value of the ratio. This ratio for different primary ionization will still be determined by the relative strength of the initial singlet light, however, a tighter time window on the singlet peak will be necessary.
7 Summary and Outlook
In this work we presented a model for light produced by xenon doping that accurately describes the time development of the light as measured in our experiment. The increased light yield by a factor of at 10 ppm over the yield in argon with traces of Xenon up to a few ppm as reported in Ref. [9] is now understood as the release of the excimer trapped light with the addition of xenon. Thus, the addition of 10 ppm xenon to liquid argon detectors increases the light yield in our geometry and trigger set by a factor of two, as well as shifting the light to early times and to the more favorable 175 nm wavelength.
In future work, we will confirm our model by measuring the separate (128 and 175 nm) emission wavelengths as a function of distance and emission time. Additionally, by using a triggered source (design provided by Schönert’s group at TUM[21]), by doping in finer steps below 1 ppm and by measuring the light yield accurately out to 10 s we expect to extract values for the quenching rate and the absolute light yield in PE per deposited ionization.
8 Acknowledgements
We gratefully acknowledge the support of the U.S. Department of Energy through the LANL/LDRD Program and by the U.S. Department of Energy, Office of Science, Office of Nuclear Physics award LANL-EM78.
References
- Ajaj et al. [2019] R. Ajaj, et al. (DEAP), Search for dark matter with a 231-day exposure of liquid argon using DEAP-3600 at SNOLAB, Phys. Rev. D 100 (2019) 022004. doi:10.1103/PhysRevD.100.022004. arXiv:1902.04048.
- Louis and de Water [2020] W. C. Louis, R. G. V. de Water, Hidden neutrino particles may be a link to the dark sector, Scientific American 323 (2020) 46–53. doi:https://doi:10.1038/scientificamerican0720-46.
- Agnes et al. [2018] P. Agnes, et al., DarkSide-50 532-day dark matter search with low-radioactivity argon, Phys. Rev. D 98 (2018). URL: https://doi.org/10.1103. doi:10.1103/physrevd.98.102006.
- Akimov et al. [2021] D. Akimov, et al. (COHERENT), First measurement of coherent elastic neutrino-nucleus scattering on argon, Phys. Rev. Lett. 126 (2021) 012002. URL: https://link.aps.org/doi/10.1103/PhysRevLett.126.012002. doi:10.1103/PhysRevLett.126.012002.
- Agostini et al. [2020] M. Agostini, et al., Final results of GERDA on the search for neutrinoless double- beta decay, Phys. Rev. Lett. 125 (2020). URL: https://doi.org/10.1103. doi:10.1103/physrevlett.125.252502.
- Abgrall et al. [2017] N. Abgrall, et al. (LEGEND), The Large Enriched Germanium Experiment for Neutrinoless Double Beta Decay (LEGEND), AIP Conf. Proc. 1894 (2017) 020027. doi:10.1063/1.5007652. arXiv:1709.01980.
- Peiffer et al. [2008] P. Peiffer, T. Pollmann, S. Schonert, A. Smolnikov, S. Vasiliev, Pulse shape analysis of scintillation signals from pure and xenon-doped liquid argon for radioactive background identification, JINST 3 (2008) P08007. doi:10.1088/1748-0221/3/08/P08007.
- Neumeier et al. [2015] A. Neumeier, T. Dandl, T. Heindl, A. Himpsl, L. Oberauer, W. Potzel, S. Roth, S. Schönert, J. Wieser, A. Ulrich, Intense vacuum ultraviolet and infrared scintillation of liquid ar-xe mixtures, EPL (Europhysics Letters) 109 (2015) 12001. URL: http://dx.doi.org/10.1209/0295-5075/109/12001. doi:10.1209/0295-5075/109/12001.
- McFadden et al. [2021] N. McFadden, S. Elliott, M. Gold, D. Fields, K. Rielage, R. Massarczyk, R. Gibbons, Large-scale, precision xenon doping of liquid argon, Nucl.Instrum.Meth.A 1011 (2021) 165575. arXiv:2006.09780.
- Neumeier et al. [2015] A. Neumeier, T. Dandl, A. Himpsl, L. Oberauer, W. Potzel, S. Schönert, A. Ulrich, Attenuation of vacuum ultraviolet light in pure and xenon-doped liquid argon —An approach to an assignment of the near-infrared emission from the mixture, EPL 111 (2015) 12001. doi:10.1209/0295-5075/111/12001. arXiv:1511.07725.
- Raz and Jortner [1970] B. Raz, J. Jortner, Experimental Evidence for Trapped Exciton States in Liquid Rare Gases, Proceedings of the Royal Society of London Series A, Mathematical and Physical Sciences 317 (1970) 113–131.
- Calvo et al. [2018] J. Calvo, et al., Measurement of the attenuation length of argon scintillation light in the ArDM LAr TPC, Astroparticle Physics 97 (2018) 186 – 196. doi:https://doi.org/10.1016/j.astropartphys.2017.11.009.
- Segreto [2021] E. Segreto, Properties of Liquid Argon Scintillation Light Emission, Phys. Rev. D 103 (2021) 043001. doi:10.1103/PhysRevD.103.043001. arXiv:2012.06527.
- Kubota et al. [1993] M. Kubota, S. Hishida, J. Himi, J. Suzuki, J. Ruan, The suppression of the slow component inxenon-doped liquid argon scintillation, Nuclear Instruments and Methods in Physics ResearchSection A: Accelerators, Spectrometers, Detectors and Associated Equipment 327 (1993) 71–74.
- Soto-Oton [2021] J. Soto-Oton (DUNE), Impact of xenon doping in the scintillation light in a large liquid-argon TPC (2021). arXiv:2109.05858.
- Hitachi [1993] A. Hitachi, Photon-mediated and collisional processes in liquid rare gases, NIMA 327 (1993) 11–14.
- Wahl et al. [2014] C. G. Wahl, E. P. Bernard, W. H. Lippincott, J. A. Nikkel, Y. Shin, D. N. McKinsey, Pulse-shape discrimination and energy resolution of a liquid-argon scintillator with xenon doping, Journal of Instrumentation 9 (2014) P06013–P06013. URL: https://iopscience.iop.org/article/10.1088/1748-0221/9/06/P06013. doi:10.1088/1748-0221/9/06/p06013.
- Cini‐Castagnol [1960] G. Cini‐Castagnol, Self-diffusion in liquid argon, J. Chem. Phys. 32 (1960).
- Benson et al. [2018] C. Benson, G. Orebi Gann, V. Gehman, Measurements of the intrinsic quantum efficiency and absorption length of tetraphenyl butadiene thin films in the vacuum ultraviolet regime, Eur. Phys. J. C 78 (2018) 329. doi:https://doi.org/10.1140/epjc/s10052-018-5807-z.
- Saes Getter [2002] Saes Getter, Ps4-mt3/15-r/n specifications specification sheet, material reference, 2002.
- Stefan Schönert [2021] Stefan Schönert, private communication, 2021.