Rapidly Spinning Compact Stars with Deconfinement Phase Transition
Abstract
We study rapidly spinning compact stars with equations of state featuring a first order phase transition between strongly coupled nuclear matter and deconfined quark matter by employing the gauge/gravity duality. We consider a family of models, which allow purely hadronic uniformly rotating stars with masses up to approximately , and are therefore compatible with the interpretation that the secondary component () in GW190814 is a neutron star. These stars have central densities several times the nuclear saturation density so that strong coupling and non-perturbative effects become crucial. We construct models where the maximal mass of static (rotating) stars () is either determined by the secular instability or a phase transition induced collapse. We find largest values for in cases where the phase transition determines , which shifts our fit result to , a value slightly above the Breu-Rezzolla bound inferred from models without phase transition.
I Introduction
The LIGO/VIRGO collaboration recently announced the gravitational wave event GW190814 Abbott et al. (2020). This event was identified as the merger of a black hole and a object making it the detection of a binary merger with the most unequal mass ratio so far. While the primary component is conclusively a black hole, the nature of the lighter companion remains unclear. It falls into the so-called mass-gap region and is either the lightest black hole or the heaviest neutron star (NS) ever observed in a binary system. The secondary component is significantly heavier than the most massive known pulsars, including PSR J1614-2230 () Demorest et al. (2010); Arzoumanian et al. (2018), PSR J0348+0432 () Antoniadis et al. (2013) and MSP J0740+6620 () Cromartie et al. (2019). The mass of the secondary component is also well above the upper bound on the maximum mass of non-rotating NSs determined from the electromagnetic counterpart of GW170817 Rezzolla et al. (2018); Margalit and Metzger (2017); Shibata et al. (2019).
The possibility that the lighter companion could be a rapidly rotating NS, or a small black hole of that origin, was pointed out in Most et al. (2020) and used to determine a lower bound on the maximum mass of non-rotating stars.
There exist already a number of studies addressing the nature of the smaller companion of GW190814 and its compatibility with a rapidly rotating NS Dexheimer et al. (2020); Godzieba et al. (2020); Lim et al. (2020); Tews et al. (2020); Fattoyev et al. (2020); Safarzadeh and Loeb (2020); Zhang and Li (2020); Roupas (2020); Essick and Landry (2020). We argue that there is an important strong coupling aspect to this question. Namely, the maximal mass of rotating () and static () NSs is sensitive to the equation of state (EoS) at high density where effective nuclear theory models become unreliable and the gauge/gravity duality (or holography for short) may be better suited. The main purpose of this letter is to investigate compatibility of state-of-the-art holographic models for cold and dense QCD matter with the hypothesis that the smaller companion in GW190814 was a rapidly rotating NS. We also compare our results to the universal mass ratio proposed in Breu and Rezzolla (2016).
An interesting prediction of the holographic model we are using (V-QCD model Järvinen and Kiritsis (2012)) is the presence of a strong first order nuclear to quark matter phase transition. Therefore in this letter we, in particular, analyze how the phase transition affects the results derived from the data for GW190814. We remark that the V-QCD model is one of the very few models which is able to describe both the nuclear and quark matter phases and therefore the phase transition in a single framework.
The rest of the paper is structured as follows. In Sec. II we introduce the holographic EoSs we are studying. In Sec. III we discuss the model for rotating stars we are using and their stability. In Sec. IV we present results for the NS properties and mass-radius curves. Finally, in Sec. V we summarize and conclude. Unless stated otherwise we use units where .
II Equation of State
We follow an approach Ecker et al. (2020); Jokela et al. (2020) where the strongly coupled bulk of the NS is modeled by employing the gauge/gravity duality whereas a traditional field theory approach is used for the crust.
The holographic V-QCD model is a fusion of improved holographic QCD Gürsoy and Kiritsis (2008); Gürsoy et al. (2008) for the glue dynamics and an approach to include quarks based on brane actions Bigazzi et al. (2005); Casero et al. (2007). This approach is effective: the model contains a large number of parameters that must be determined by comparing to known properties of QCD, e.g., lattice data for the thermodynamics of QCD at finite temperature. We study three different versions of V-QCD, referred to as soft, intermediate, and stiff, obtained through different fits to lattice QCD data in Jokela et al. (2019)111The “soft” (“stiff”) variant is given by the fit 5b (8b) in Jokela et al. (2019). The intermediate EoS was obtained by interpolating between the soft and stiff EoSs, using the fit result 7a from Jokela et al. (2019) as a guiding point.. As an important constituent for the current study, nuclear matter was included in the model by using a simple approximation scheme in Ishii et al. (2019). This model has been employed previously in NS merger simulations Ecker et al. (2020), and to study the properties of QCD and static NSs based solely on predictions for the quark matter phase Jokela et al. (2019); Chesler et al. (2019); Hoyos et al. (2020) and including holographic nuclear matter Jokela et al. (2020).
To model the crust we use the Akmal-Pandharipande-Ravenhall (APR) Akmal et al. (1998) EoS up to number densities , where is the nuclear saturation density. The point , where we match the holographic model with the low density nuclear matter model, is our estimate for the density where the holographic approach becomes more reliable than the traditional (effective field theory) approach. NSs with high masses, which are the focus of this letter, are mostly sensitive to the high density regime described by holography in our approach. This has been shown in Jokela et al. (2020) by analyzing a larger set of “hybrid” EoSs of this kind, with various other nuclear models for the crust (in addition to APR) and spanning a wide range of values of . We will also verify this here by carrying out a scan of basic observables over such a set of EoSs. All EoSs in this work assume beta equilibrium and zero temperature.
In Fig. 1 we show the three EoSs together with theoretical uncertainties in nuclear theory Tews et al. (2013) (blue band) and perturbative QCD Kurkela et al. (2010) (orange band) at low and high density, respectively, and bounds from causality and current astrophysical observations in between. We show two different bands at intermediate density: The light blue band is spanned by quadrutropic interpolations (following Annala et al. (2018)) between the low and high density results which also satisfy the astrophysical bounds: the maximal mass of static NSs is at least and the tidal deformability (at NS mass ) is less than the bound 580 obtained from the analysis of GW170817 by LIGO/Virgo (low-spin prior at 90% confidence level) Abbott et al. (2017, 2018). The light red band is spanned by the aforementioned larger ensemble of V-QCD EoSs which satisfy the same bounds Jokela et al. (2020).
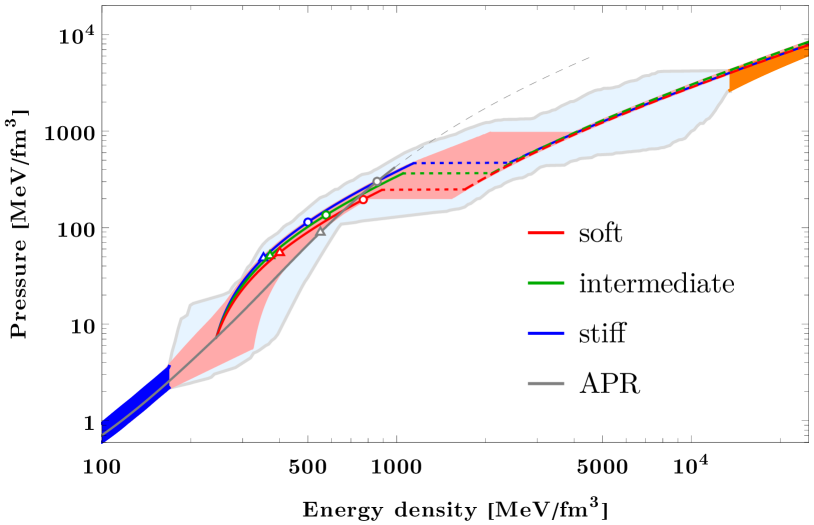
Red, green and blue curves are the V-QCD EoSs which are matched at to the APR curve shown in gray. Solid lines at low and intermediate densities correspond to the confined nuclear matter phase, dashed lines are in the deconfined quark matter phase and dotted horizontal lines are mixed phases between the two. The thin dashed part of the gray curve is where the APR model has speed of sound larger than the speed of light and therefore clearly is outside its range of applicability.
III Uniformly Rotating Stars
We study properties of cold relativistic non-rotating and uniformly rotating stars modeled as stationary, ideal fluid distributions in general relativity using the publicly available RNS code Cook et al. (1994); Stergioulas and Friedman (1995).
To estimate we construct sequences of uniformly rotating stars with different central number density and fixed angular momentum . These sequences are bounded from below by the so-called Keplerian or mass-shedding limit in which centrifugal and gravitational forces at the equator of the star exactly cancel. The upper bound of these sequences is determined by black hole collapse which in our setup is either induced by a secular instability or the abrupt softening of the EoS at the phase transition. The onset of the secular instability can be approximately determined with the turning-point criterion Friedman et al. (1988)
| (1) |
For non-rotating () stars (1) is necessary and sufficient to determine . For rotating stars the turning-point criterion is only sufficient, but not necessary, i.e., rotating stars that are stable according to (1) can still be dynamically unstable and the onset of instability can appear at densities slightly lower than the turning-point density Takami et al. (2011). In this work we neglect dynamical instabilities and approximate by intersecting the Keplerian sequence either with lines constructed from (1) or with the number density at the phase transition . In the next section we show examples where both possibilities are realized, including a “mixed” case where is determined by the phase transition and by the secular instability.
IV Results
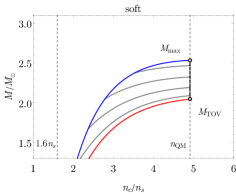
In Fig. 2 we show the masses of uniformly rotating NSs as function of the central baryon number density for the three variants of EoSs. For the soft EoS (left plot) the onset of instability (black dashed line) is due to the abrupt softening of the EoS as the nuclear to quark matter transition is reached, independently of the angular momentum of the star. In contrast to Paschalidis et al. (2018); Montana et al. (2019); Bozzola et al. (2019) the holographic model predicts no stable twin or hybrid star solutions.
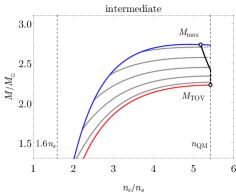
For the stiff EoS (right plot), however, the secular instability (black solid curve) is reached at densities below the transition density . The intermediate EoS shows the “mixed” behavior where the onset of instability is due to the phase transition (secular instability) for slowly (rapidly) rotating stars.
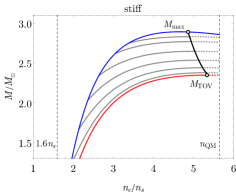
Super-Massive Neutron Stars (SMNS), i.e. axisymmetrically rotating NSs with mass , are expected to form in low and intermediate mass NS binary systems Baiotti and Rezzolla (2017). During its dynamic evolution a SMNS can lose angular momentum by a number of mechanisms (electromagnetic emission, neutrino losses, etc.) until it either ends up as stable, non-rotating NS or reaches a point of instability where it collapses into a black hole. In the later case the lifetime of the star depends strongly on the high density part of the EoS where non-perturbative effects such as the deconfinement phase transition are crucial. Our stars collapse because they reach the phase transition or the turning-point line. By monotonicity of the turning-point line, it is sufficient to check if is located at a turning-point to exclude the possibility of a phase transition induced collapse for all rotating NS, like it is for example the case in the stiff model shown in Fig. 2 (right).
The quadrants in Fig. 3 show the number density profile of a static star (left) and a star, spinning around the -axis at Keplerian, mass-shedding frequency (right) for two choices for the mass.
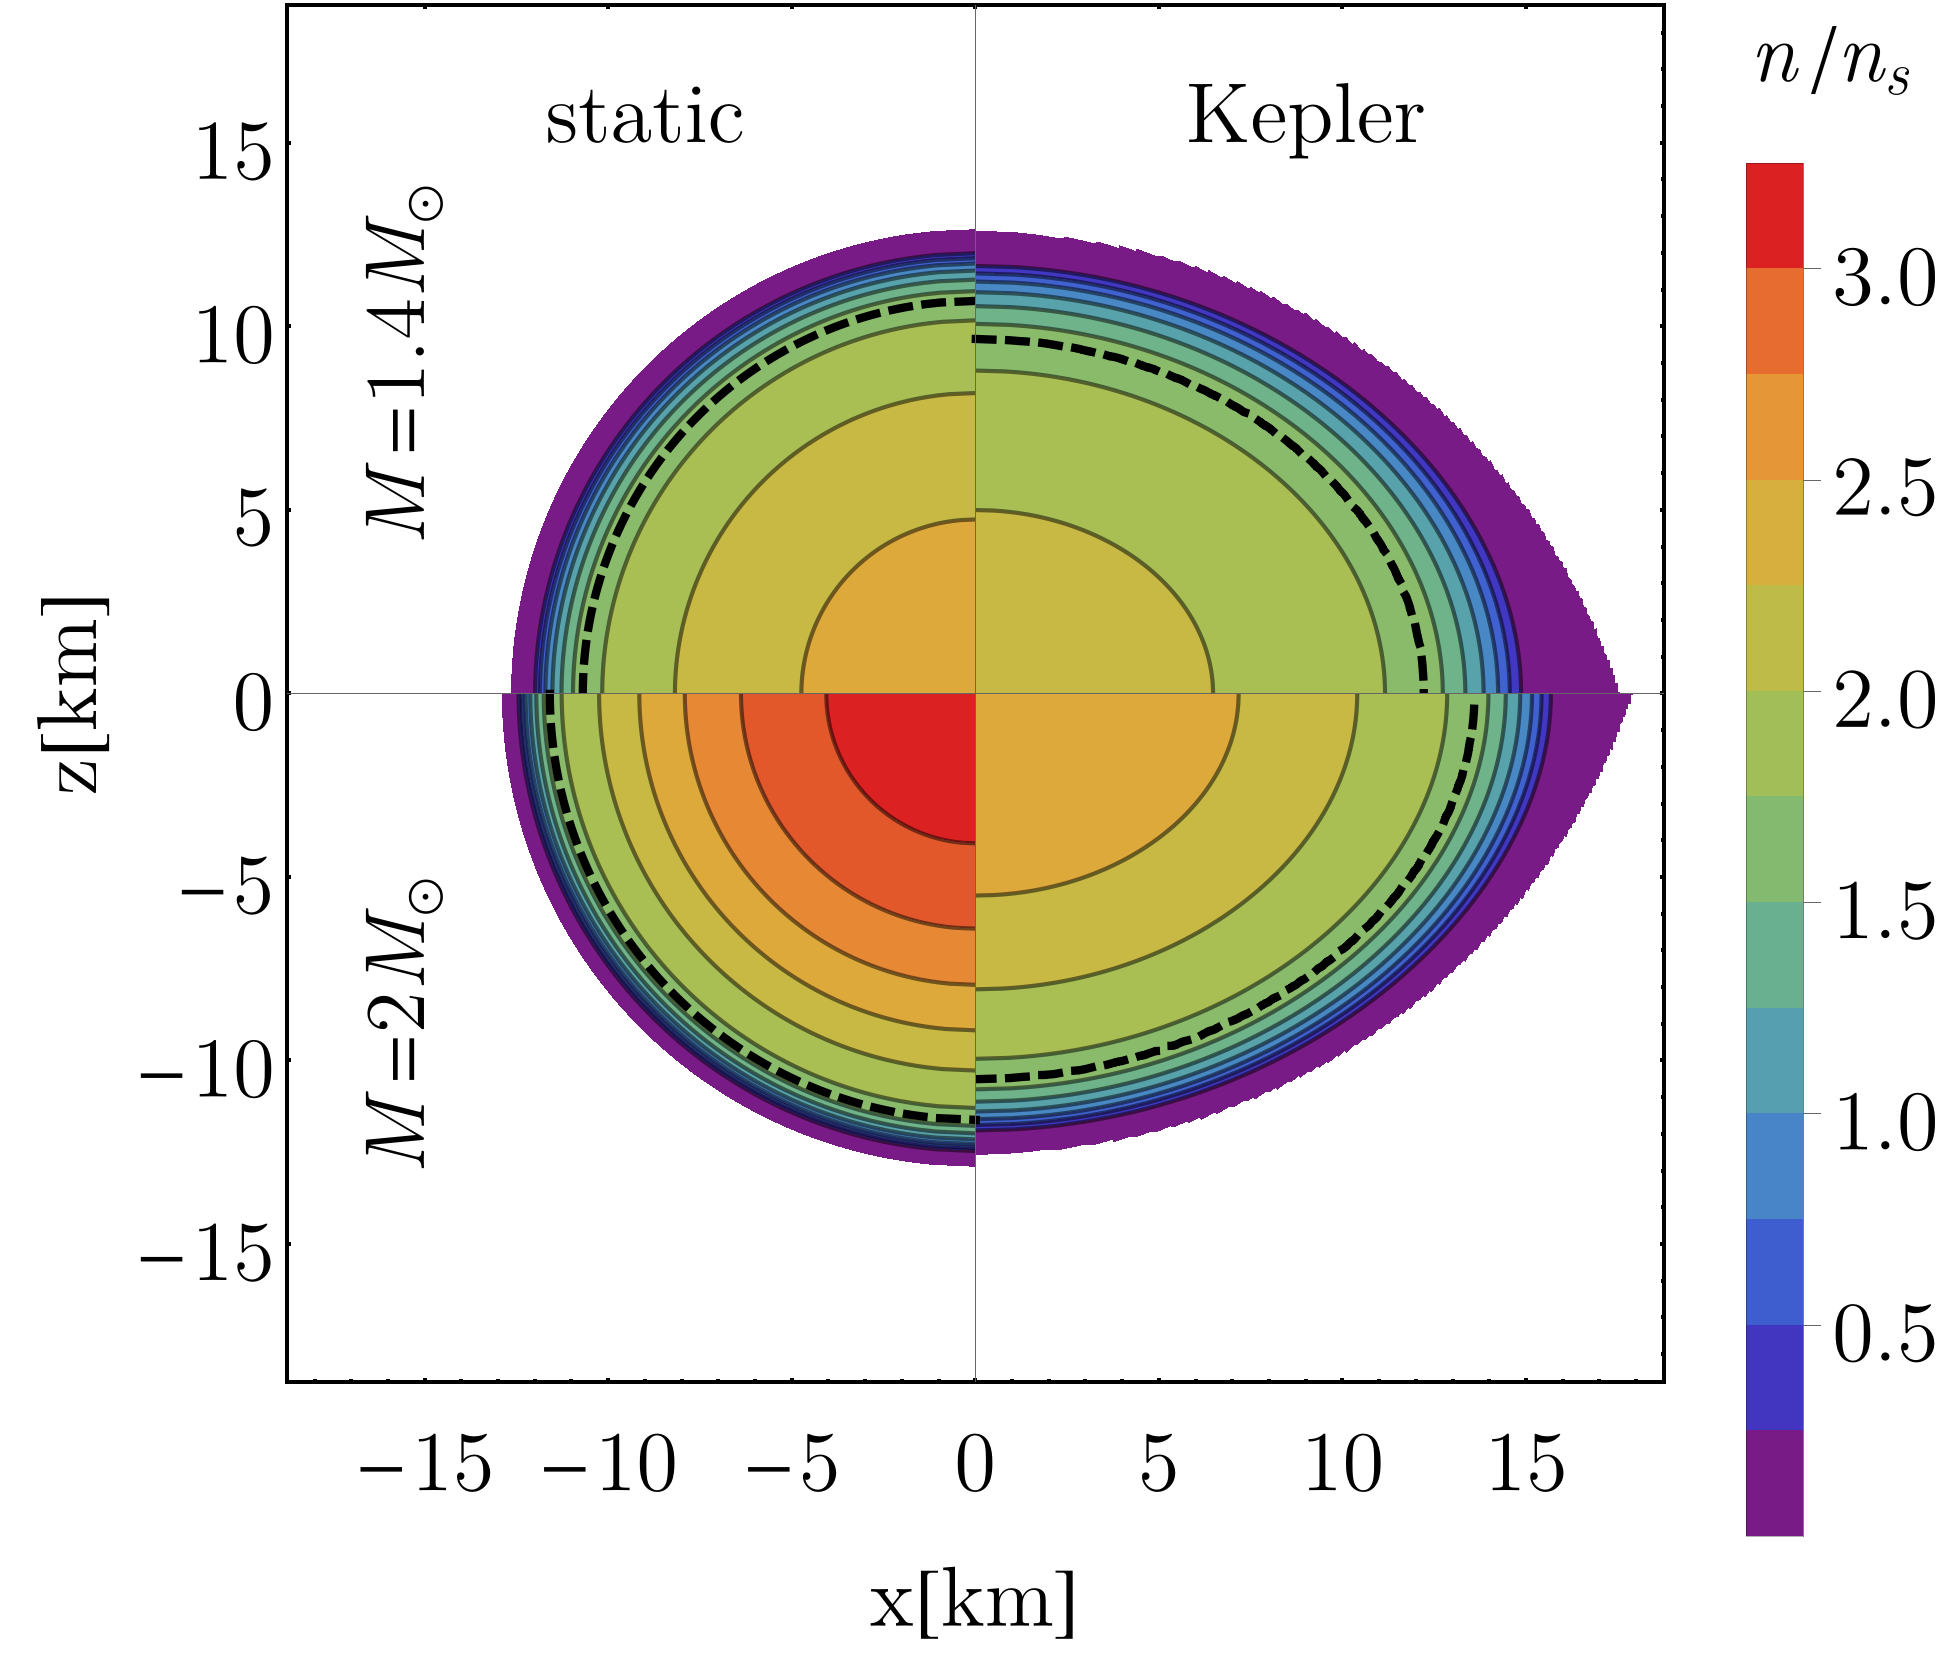
Notice that almost all matter in the cores of the stars is described by the holographic model; the dashed black line indicates the iso-number density surface at which APR transitions to the V-QCD EoS. In the non-rotating configuration with () (), where and are the maximal radius and the radius at matching density in the equatorial plane, respectively.
In Fig. 4 we show mass-radius relations for the three holographic EoSs and compare them to the results from GW190814 and a selection of other measurements of NS masses and radii.
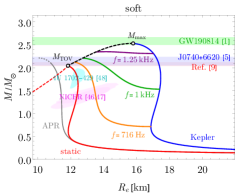
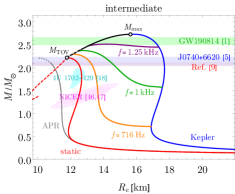
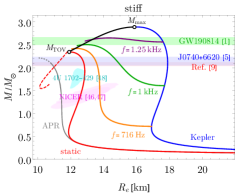
The static stars in the soft model (solid red curve in the right plot) reach the maximum mass , a value only barely consistent with direct mass measurements 222We show only the result from Cromartie et al. (2019). At 1- level the other measurements mentioned in the introduction do not affect the constraint on the maximum mass significantly. and the bound derived in Most et al. (2020) based on the GW190814 event, shown as light blue and light red bands, respectively. We also notice that all stable stars consistent with the GW190814 measurement (i.e., within the light green band) are almost maximally rotating. The other models (intermediate and stiff) satisfy these bounds easily, but even for the stiff model high rotation frequencies 1 kHz are required to reach the green band. This is well above the frequency of the fastest spinning pulsar observed so far, PSR J1748-2446ad Hessels et al. (2006).
There are also estimates for the radii of NSs using the X-ray channel. We show the results from the measurement of PSR J0030+0451 by the NICER collaboration Riley et al. (2019); Miller et al. (2019) as well as the measurements of the low-mass X-ray binary 4U 1702-429 obtained by the Rossi X-Ray Timing Explorer Nättilä et al. (2017). Our results for slowly rotating NSs agree well with these results for all three models.
In addition to the three holographic EoSs of Fig. 1, we have carried out a scan over all EoSs constructed in Jokela et al. (2020) which span the light red band in Fig. 1. Apart from APR, these additional EoSs use the following nuclear matter models at low density: the soft and intermediate variants of the Hebeler-Lattimer-Pethick-Schwenk (HLPS) Hebeler et al. (2013), Skyrme Lyon (SLy) Haensel and Pichon (1994); Douchin and Haensel (2001), and IUF Hempel and Schaffner-Bielich (2010); Fattoyev et al. (2010). We also allowed the matching density to vary within the range from to and required that the EoSs comply with the LIGO/Virgo bound Abbott et al. (2018). Our results for the distribution of the mass ratio and the maximum non-rotating mass are shown in Fig. 5. The mass ratios are mildly shifted upwards with respect to the fit for EoSs without a deconfinement transition (green dashed line and band) Breu and Rezzolla (2016). We stress that this happens even though our NSs are fully hadronic; for models admitting hybrid stars with quark matter cores, larger deviations are possible Bozzola et al. (2019). Consequently, some of the EoSs with the soft variant of V-QCD lie slightly below the estimate of the lowest possible (blue dashed line and band) from Most et al. (2020). Moreover we note that the stiffest holographic EoSs are able to produce stable NSs a bit above the bound of Rezzolla et al. (2018) (red dashed line and band) and the estimate of Shibata et al. (2019).
In order to compare directly to the result of Breu and Rezzolla (2016), we fitted the dependence of on the scaled angular momentum , where is the value of the mass at the onset of instability, given as the black curves in Fig. 2. We used the data for all EoSs shown with filled colored markers in Fig. 5. The fit to the formula Breu and Rezzolla (2016)
| (2) |
where is the value at the intersection with the Keplerian curve, gives and . Evaluating this fit at we obtain the estimate
| (3) |
where the error bars indicate the largest deviation from the fit.
In addition we estimate the average ratio of the maximum rest mass and for all our EoSs
| (4) |
where the error bars again indicate the largest deviation from the central value. Also here our value is slightly above the value (two sigma level) obtained in Rezzolla et al. (2018) for EoSs without phase transition.
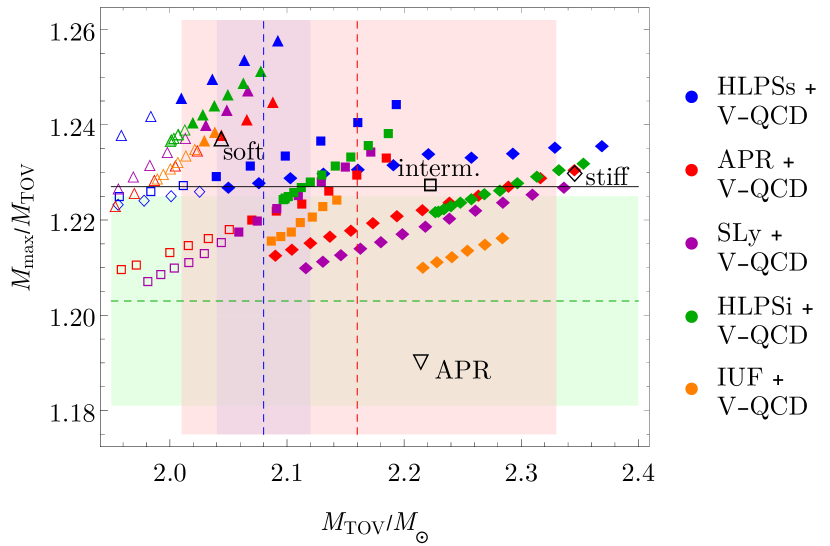
Table 1 summarizes salient features of rotating and non-rotating stars, such as number density at the deconfinement phase transition (), maximum mass of non-spinning () and spinning () stars, the maximum rest mass () of spinning stars, range of equatorial radii () and tidal deformability () of stars and maximum rotation frequency ().
| Model | |||||||
|---|---|---|---|---|---|---|---|
| soft | |||||||
| interm. | |||||||
| stiff | |||||||
| APR | – |
V Conclusion
In this letter, we analyzed spinning hadronic NSs with EoSs having a deconfinement transition from nuclear to quark matter. The analysis was made possible by using state-of-the-art holographic models for dense QCD which include both the nuclear and quark matter phases (V-QCD), and therefore give controlled predictions for the properties of the phase transition. The phase transition is strongly first order as the EoS in the NM (QM) phase is relatively stiff (soft). Interestingly, this picture is similar to what arises in another non-perturbative approach, i.e., the functional renormalization group method Drews and Weise (2017); Otto et al. (2020).
Apart from the phase transition, the holographic models predict that the nuclear matter EoSs is relatively stiff at high densities, making it easy to reach high masses for both non-rotating and rotating NSs. For stiff variants of the model, we find that the maximal masses of non-rotating (rotating) stars are around 2.35 (2.9) solar masses. Therefore these models are easily consistent with the interpretation Most et al. (2020); Dexheimer et al. (2020) that the secondary component of the binary merger event GW190814 is a rapidly spinning NS. However, even for the stiffest EoSs the frequencies required for this interpretation are high: we find that 1 kHz, which is close to the mass shedding limit ( 1.5 kHz) and clearly above the fastest pulsar rotation frequency observed so far, 716 Hz Hessels et al. (2006).
Curiously, in the three models considered in this work the maximal masses of rotating and non-rotating stars are determined in different ways. In the soft model, both and , are determined by the phase transition. In the intermediate model, is determined by the phase transition and of rapidly rotating stars by the secular instability. In the stiff model, both and are determined by the secular instability. We find it is sufficient to check if is located at a turning-point to exclude the possibility of a phase transition induced collapse for all rotating NS for a given EoS. Consequently, SMNSs formed in binary NS mergers with EoS satisfying this simple criterion will not produce any signatures of the phase transition in their gravitational wave signal.
Interestingly, we find the ratio of maximal masses of rotating vs. non-rotating models to be relatively high compared to models without deconfinement transition Breu and Rezzolla (2016); our fit result is shifted upwards with respect to their result, . This feature is pronounced for EoSs with the soft variant, which can reach . Notice that it is indeed the soft variants where both and are determined by the instability induced by the phase transition, which supports the interpretation that the large values for the ratio arise due to the transition.
In this letter, we neglected some well known effects due to computational simplicity. First, we used the turning-point criterion (1) to estimate the onset of the secular instability. To improve on this, we would need to study the impact of dynamical instabilities on our results by carrying out 3+1 dimensional simulations. We expect, however, that carrying out the full analysis would change our results very little, because the mass of the NS is insensitive to the exact value of the critical central density near the onset of the instability (see, e.g., Takami et al. (2011)). Second, we studied rigidly rotating stars only. It would be interesting to generalize our work to differentially rotating stars for which a similar universal ratio has been proposed Weih et al. (2018). We hope to return to this topic in future work.
Acknowledgements.
We thank Niko Jokela, Antonios Nathanail, Luciano Rezzolla and Lukas Weih for useful discussions and comments on the manuscript. TD was partially supported by the Israel Science Foundation (ISF) grant #1635/16 and the BSF grants #2015626 and #2018722. The work of MJ was supported in part by a center of excellence sup-ported by the ISF grant #2289/18. This research was also supported by an appointment to the JRG Program at the APCTP through the Science and Technology Promotion Fund and Lottery Fund of the Korean Government. In addition, the research was supported by the Korean Local Governments – Gyeongsangbuk-do Province and Pohang City.References
- Abbott et al. (2020) R. Abbott et al. (LIGO Scientific, Virgo), Astrophys. J. 896, L44 (2020), arXiv:2006.12611 [astro-ph.HE] .
- Demorest et al. (2010) P. Demorest, T. Pennucci, S. Ransom, M. Roberts, and J. Hessels, Nature 467, 1081 (2010).
- Arzoumanian et al. (2018) Z. Arzoumanian et al. (NANOGrav), Astrophys. J. Suppl. 235, 37 (2018), arXiv:1801.01837 [astro-ph.HE] .
- Antoniadis et al. (2013) J. Antoniadis et al., Science 340, 6131 (2013), arXiv:1304.6875 [astro-ph.HE] .
- Cromartie et al. (2019) H. T. Cromartie et al., Nature Astron. 4, 72 (2019), arXiv:1904.06759 [astro-ph.HE] .
- Rezzolla et al. (2018) L. Rezzolla, E. R. Most, and L. R. Weih, Astrophys. J. Lett. 852, L25 (2018), arXiv:1711.00314 [astro-ph.HE] .
- Margalit and Metzger (2017) B. Margalit and B. D. Metzger, Astrophys. J. Lett. 850, L19 (2017), arXiv:1710.05938 [astro-ph.HE] .
- Shibata et al. (2019) M. Shibata, E. Zhou, K. Kiuchi, and S. Fujibayashi, Phys. Rev. D 100, 023015 (2019), arXiv:1905.03656 [astro-ph.HE] .
- Most et al. (2020) E. R. Most, L. J. Papenfort, L. R. Weih, and L. Rezzolla, (2020), arXiv:2006.14601 [astro-ph.HE] .
- Dexheimer et al. (2020) V. Dexheimer, R. Gomes, T. Klähn, S. Han, and M. Salinas, (2020), arXiv:2007.08493 [astro-ph.HE] .
- Godzieba et al. (2020) D. A. Godzieba, D. Radice, and S. Bernuzzi, (2020), arXiv:2007.10999 [astro-ph.HE] .
- Lim et al. (2020) Y. Lim, A. Bhattacharya, J. W. Holt, and D. Pati, (2020), arXiv:2007.06526 [nucl-th] .
- Tews et al. (2020) I. Tews, P. T. Pang, T. Dietrich, M. W. Coughlin, S. Antier, M. Bulla, J. Heinzel, and L. Issa, (2020), arXiv:2007.06057 [astro-ph.HE] .
- Fattoyev et al. (2020) F. Fattoyev, C. Horowitz, J. Piekarewicz, and B. Reed, (2020), arXiv:2007.03799 [nucl-th] .
- Safarzadeh and Loeb (2020) M. Safarzadeh and A. Loeb, (2020), arXiv:2007.00847 [astro-ph.HE] .
- Zhang and Li (2020) N.-B. Zhang and B.-A. Li, (2020), arXiv:2007.02513 [astro-ph.HE] .
- Roupas (2020) Z. Roupas, (2020), arXiv:2007.10679 [gr-qc] .
- Essick and Landry (2020) R. Essick and P. Landry, (2020), arXiv:2007.01372 [astro-ph.HE] .
- Breu and Rezzolla (2016) C. Breu and L. Rezzolla, Mon. Not. Roy. Astron. Soc. 459, 646 (2016), arXiv:1601.06083 [gr-qc] .
- Järvinen and Kiritsis (2012) M. Järvinen and E. Kiritsis, JHEP 03, 002 (2012), arXiv:1112.1261 [hep-ph] .
- Ecker et al. (2020) C. Ecker, M. Järvinen, G. Nijs, and W. van der Schee, Phys. Rev. D 101, 103006 (2020), arXiv:1908.03213 [astro-ph.HE] .
- Jokela et al. (2020) N. Jokela, M. Järvinen, G. Nijs, and J. Remes, (2020), arXiv:2006.01141 [hep-ph] .
- Gürsoy and Kiritsis (2008) U. Gürsoy and E. Kiritsis, JHEP 02, 032 (2008), arXiv:0707.1324 [hep-th] .
- Gürsoy et al. (2008) U. Gürsoy, E. Kiritsis, and F. Nitti, JHEP 02, 019 (2008), arXiv:0707.1349 [hep-th] .
- Bigazzi et al. (2005) F. Bigazzi, R. Casero, A. L. Cotrone, E. Kiritsis, and A. Paredes, JHEP 10, 012 (2005), arXiv:hep-th/0505140 [hep-th] .
- Casero et al. (2007) R. Casero, E. Kiritsis, and A. Paredes, Nucl. Phys. B787, 98 (2007), arXiv:hep-th/0702155 [HEP-TH] .
- Jokela et al. (2019) N. Jokela, M. Järvinen, and J. Remes, JHEP 03, 041 (2019), arXiv:1809.07770 [hep-ph] .
- Note (1) The “soft” (“stiff”) variant is given by the fit 5b (8b) in Jokela et al. (2019). The intermediate EoS was obtained by interpolating between the soft and stiff EoSs, using the fit result 7a from Jokela et al. (2019) as a guiding point.
- Ishii et al. (2019) T. Ishii, M. Järvinen, and G. Nijs, JHEP 07, 003 (2019), arXiv:1903.06169 [hep-ph] .
- Chesler et al. (2019) P. M. Chesler, N. Jokela, A. Loeb, and A. Vuorinen, Phys. Rev. D 100, 066027 (2019), arXiv:1906.08440 [astro-ph.HE] .
- Hoyos et al. (2020) C. Hoyos, N. Jokela, M. Järvinen, J. G. Subils, J. Tarrio, and A. Vuorinen, (2020), arXiv:2005.14205 [hep-th] .
- Akmal et al. (1998) A. Akmal, V. Pandharipande, and D. Ravenhall, Phys. Rev. C 58, 1804 (1998), arXiv:nucl-th/9804027 .
- Tews et al. (2013) I. Tews, T. Krüger, K. Hebeler, and A. Schwenk, Phys. Rev. Lett. 110, 032504 (2013), arXiv:1206.0025 [nucl-th] .
- Kurkela et al. (2010) A. Kurkela, P. Romatschke, and A. Vuorinen, Phys. Rev. D 81, 105021 (2010), arXiv:0912.1856 [hep-ph] .
- Annala et al. (2018) E. Annala, T. Gorda, A. Kurkela, and A. Vuorinen, Phys. Rev. Lett. 120, 172703 (2018), arXiv:1711.02644 [astro-ph.HE] .
- Abbott et al. (2017) B. Abbott et al. (LIGO Scientific, Virgo), Phys. Rev. Lett. 119, 161101 (2017), arXiv:1710.05832 [gr-qc] .
- Abbott et al. (2018) B. Abbott et al. (LIGO Scientific, Virgo), Phys. Rev. Lett. 121, 161101 (2018), arXiv:1805.11581 [gr-qc] .
- Cook et al. (1994) G. B. Cook, S. L. Shapiro, and S. A. Teukolsky, Astrophys. J. 424, 823 (1994).
- Stergioulas and Friedman (1995) N. Stergioulas and J. Friedman, Astrophys. J. 444, 306 (1995), arXiv:astro-ph/9411032 .
- Friedman et al. (1988) J. L. Friedman, J. R. Ipser, and R. D. Sorkin, Astrophys. J. 325, 722 (1988).
- Takami et al. (2011) K. Takami, L. Rezzolla, and S. Yoshida, Mon. Not. Roy. Astron. Soc. 416, L1 (2011), arXiv:1105.3069 [gr-qc] .
- Paschalidis et al. (2018) V. Paschalidis, K. Yagi, D. Alvarez-Castillo, D. B. Blaschke, and A. Sedrakian, Phys. Rev. D 97, 084038 (2018), arXiv:1712.00451 [astro-ph.HE] .
- Montana et al. (2019) G. Montana, L. Tolos, M. Hanauske, and L. Rezzolla, Phys. Rev. D 99, 103009 (2019), arXiv:1811.10929 [astro-ph.HE] .
- Bozzola et al. (2019) G. Bozzola, P. L. Espino, C. D. Lewin, and V. Paschalidis, Eur. Phys. J. A 55, 149 (2019), arXiv:1905.00028 [astro-ph.HE] .
- Baiotti and Rezzolla (2017) L. Baiotti and L. Rezzolla, Rept. Prog. Phys. 80, 096901 (2017), arXiv:1607.03540 [gr-qc] .
- Riley et al. (2019) T. E. Riley et al., Astrophys. J. Lett. 887, L21 (2019), arXiv:1912.05702 [astro-ph.HE] .
- Miller et al. (2019) M. Miller et al., Astrophys. J. Lett. 887, L24 (2019), arXiv:1912.05705 [astro-ph.HE] .
- Nättilä et al. (2017) J. Nättilä, M. Miller, A. Steiner, J. Kajava, V. Suleimanov, and J. Poutanen, Astron. Astrophys. 608, A31 (2017), arXiv:1709.09120 [astro-ph.HE] .
- Note (2) We show only the result from Cromartie et al. (2019). At 1- level the other measurements mentioned in the introduction do not affect the constraint on the maximum mass significantly.
- Hessels et al. (2006) J. W. Hessels, S. M. Ransom, I. H. Stairs, P. C. C. Freire, V. M. Kaspi, and F. Camilo, Science 311, 1901 (2006), arXiv:astro-ph/0601337 .
- Hebeler et al. (2013) K. Hebeler, J. Lattimer, C. Pethick, and A. Schwenk, Astrophys. J. 773, 11 (2013), arXiv:1303.4662 [astro-ph.SR] .
- Haensel and Pichon (1994) P. Haensel and B. Pichon, Astron. Astrophys. 283, 313 (1994), arXiv:nucl-th/9310003 .
- Douchin and Haensel (2001) F. Douchin and P. Haensel, Astron. Astrophys. 380, 151 (2001), arXiv:astro-ph/0111092 .
- Hempel and Schaffner-Bielich (2010) M. Hempel and J. Schaffner-Bielich, Nucl. Phys. A 837, 210 (2010), arXiv:0911.4073 [nucl-th] .
- Fattoyev et al. (2010) F. Fattoyev, C. Horowitz, J. Piekarewicz, and G. Shen, Phys. Rev. C 82, 055803 (2010), arXiv:1008.3030 [nucl-th] .
- Drews and Weise (2017) M. Drews and W. Weise, Prog. Part. Nucl. Phys. 93, 69 (2017), arXiv:1610.07568 [nucl-th] .
- Otto et al. (2020) K. Otto, M. Oertel, and B.-J. Schaefer, Phys. Rev. D 101, 103021 (2020), arXiv:1910.11929 [hep-ph] .
- Weih et al. (2018) L. R. Weih, E. R. Most, and L. Rezzolla, Mon. Not. Roy. Astron. Soc. 473, L126 (2018), arXiv:1709.06058 [gr-qc] .