Computational capacity of pyramidal neurons in the cerebral cortex
Abstract
The electric activities of cortical pyramidal neurons are supported by structurally stable, morphologically complex axo-dendritic trees. Anatomical differences between axons and dendrites in regard to their length or caliber reflect the underlying functional specializations, for input or output of neural information, respectively. For a proper assessment of the computational capacity of pyramidal neurons, we have analyzed an extensive dataset of three-dimensional digital reconstructions from the NeuroMorpho.Org database, and quantified basic dendritic or axonal morphometric measures in different regions and layers of the mouse, rat or human cerebral cortex. Physical estimates of the total number and type of ions involved in neuronal electric spiking based on the obtained morphometric data, combined with energetics of neurotransmitter release and signaling fueled by glucose consumed by the active brain, support highly efficient cerebral computation performed at the thermodynamically allowed Landauer limit for implementation of irreversible logical operations. Individual proton tunneling events in voltage-sensing S4 protein -helices of Na+, K+ or Ca2+ ion channels are ideally suited to serve as single Landauer elementary logical operations that are then amplified by selective ionic currents traversing the open channel pores. This miniaturization of computational gating allows the execution of over 1.2 zetta logical operations per second in the human cerebral cortex without combusting the brain by the released heat.
keywords:
action potential, brain energetics, logical operation, morphometry, pyramidal neuron1 Introduction
The cerebral cortex is the seat of higher cognitive functions in mammals. Structurally, it is divided into neocortex, made up of six layers of neurons, and allocortex, made up of just three or four layers of neurons [Rockland & DeFelipe, 2018]. The neocortex forms the largest, outer layer of the cerebrum. In large mammals and primates, the neocortex is folded into grooves and ridges, which minimize the brain volume, and are pivotal for the wiring of the brain and its functional organization [Rakic, 2009]. The neocortex is involved in sensory perception, awareness, attention, motor control, working memory, thought, intelligence, and consciousness [Page, 1981]. The allocortex includes evolutionary older regions, such as the olfactory system and the hippocampus, which comprise the neural basis of emotion and play important roles in time ordering of memorized events or the consolidation of conscious memory from short-term to long-term memory [Fournier et al., 2015, Wible, 2013, Squire et al., 2015].
Excitatory, glutamatergic pyramidal neurons are the principal type of cell comprising over 70% of all cortical neurons [Nieuwenhuys, 1994]. Pyramidal neurons, referred to as the “psychic cells” of the brain by Ramón y Cajal [Goldman-Rakic, 2002], are organized in complex neuronal networks, which communicate by means of electric signals. Wiring of the corresponding neuronal networks requires individual neurons to support structurally stable, elongated cable-like projections referred to as neurites. Depending on their functional specialization, the neurites could be classified as dendrites, specialized in delivering inputs to the neuron, or axons, specialized in delivering outputs from the neuron to other neurons [Georgiev, 2017]. Dendrites deliver electric signals through activated synapses mainly formed onto spines of the dendritic tree [Eyal et al., 2018]. The post-synaptic electric currents propagate passively along the dendrites through an electrotonic mechanism that summates the electric signals spatially and temporally at the cell body (soma) of the neuron. Axons output electric spikes (action potentials) in an active fashion that consumes large amounts of biochemical energy in order to propagate the electric signals without attenuation at a distance to pre-synaptic axonal buttons whose release of neurotransmitter subsequently affects the electric properties of dendrites of target neurons.
The morphology of neurites is intimately related to their characteristic functional role [Mounier et al., 2015]. Dendrites achieve processing of received information through passive and lossy transmission. Consequently, the dendrites have shorter lengths and larger diameters in order to compensate for the electrotonic attenuation of currents with distance. Alternatively, axons are required to deliver output signals at large distances to target neurons through lossless transmission achieved at the expense of biochemical energy. To reduce energy expenditure, axons are thinner and insulated with myelin sheets. Thus, a detailed study of neuronal morphology is essential for better understanding of the neuronal hardware behind higher cognitive functions.
Here, we analyze a dataset of 749 three-dimensional neuronal reconstructions from NeuroMorpho.org 7.8 digital archive [Ascoli et al., 2007]. Then, with the use of morphometric, electrophysiological and biochemical data, we derive an upper bound on the computational capacity of pyramidal neurons in the cerebral cortex. Finally, we conclude with a theoretical discussion on the fundamental limitations imposed by energetics on possible subneuronal mechanisms for the processing of cognitive information.
2 Results
2.1 Dendrite morphometry
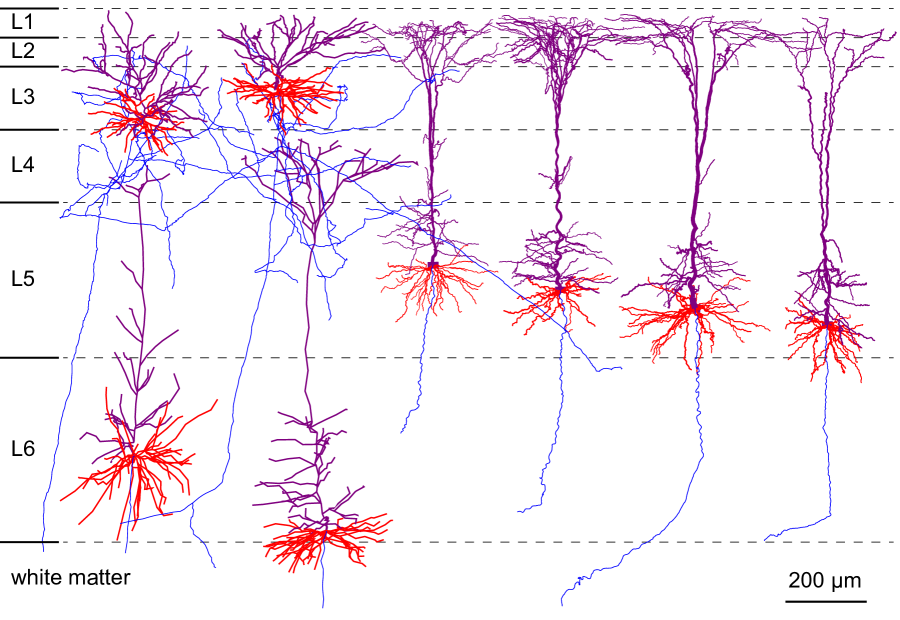
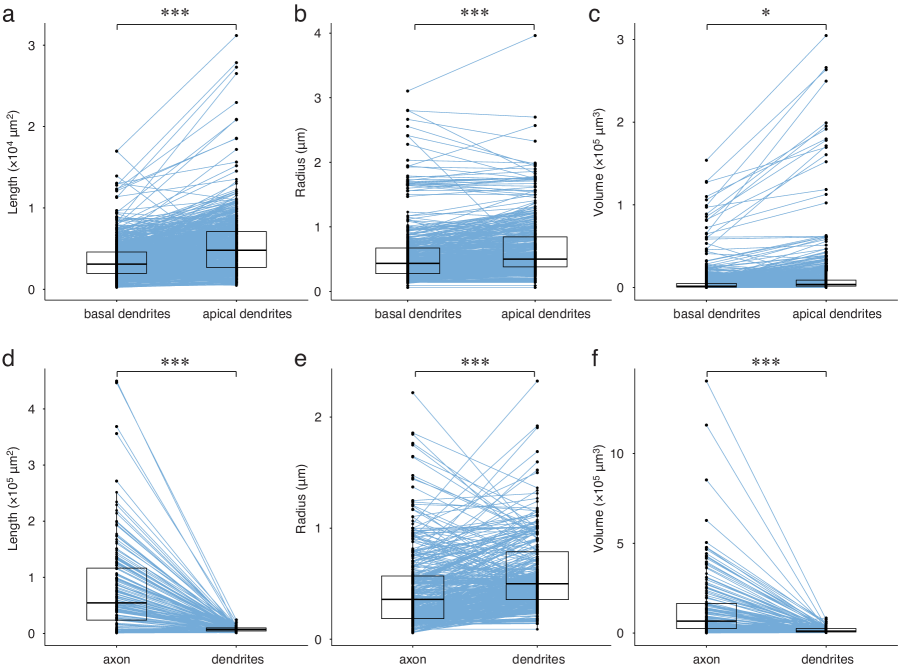
Pyramidal neurons are located within layers 2, 3, 5 and 6 of the neocortex [Shipp, 2007]. The cell body (soma) of pyramidal neurons has the shape of a pyramid with its base facing towards the deeper layers and its apex towards the superficial layers of the cerebral cortex [Bekkers, 2011]. Because the dendrites of pyramidal neurons from layers 2, 3 and 5 reach layer 1, the size and complexity of their dendritic trees increases with the depth of the neuron within the cortex. In contrast, the dendrites of layer 6 neurons reach only layer 4, which explain why their dendritic trees are smaller and less complex than layer 5 neurons (Figure 1). On average across all types of cortical pyramidal neurons, the basal dendrites have shorter total length ( m) in comparison to apical dendrites ( m) (, , Figure 2a). The mean radius of basal dendrites is also thinner ( m) compared to apical dendrites ( m) (, , Figure 2b), which results in lower total volume of basal dendrites ( m3) as opposed to apical dendrites ( m3) (, , Figure 2c). Detailed morphometric data for basal and apical dendrites in neocortex, subiculum or hippocampus of mouse, rat and human are presented in Table 1 and Table 2.
| Species | Brain region | Neuron type | # of cells | Total length (m) | Total volume (m3) | Mean radius (m) |
|---|---|---|---|---|---|---|
| Mouse | Neocortex | Layer 2-3 | 15 | |||
| Layer 5 | 156 | |||||
| Layer 6 | 37 | |||||
| Hippocampus | CA1 | 20 | ||||
| Subiculum | Principal | 24 | ||||
| Rat | Neocortex | Layer 2-3 | 125 | |||
| Layer 5 | 171 | |||||
| Layer 6 | 20 | |||||
| Hippocampus | CA1 | 113 | ||||
| CA3 | 62 | |||||
| Human | Neocortex | Layer 2-3 | 6 |
| Species | Brain region | Neuron type | # of cells | Total length (m) | Total volume (m3) | Mean radius (m) |
|---|---|---|---|---|---|---|
| Mouse | Neocortex | Layer 2-3 | 15 | |||
| Layer 5 | 81 | |||||
| Layer 6 | 37 | |||||
| Hippocampus | CA1 | 1 | ||||
| Subiculum | Principal | 24 |
2.2 Axon morphometry
Axons are specialized to deliver electric output to distant targets. The mean radius of axons ( m) is thinner compared to the mean radius of dendrites ( m) (paired -test, , , Figure 2e) estimated in a subset of 528 cells, which had either partial axonal arborizations in slices () or complete axonal arborizations in whole brain reconstructions (). The rationale for this analysis is that slicing does not affect the radii of neuronal projections. However, because the axonal arborizations are trimmed in slice sections, for the evaluation of total axonal length and total axonal volume, we have used only the subset of 158 automated whole brain reconstructions in mouse (Table 3). Axons of mouse projection neurons have greater total length ( m) and greater total volume ( m3) in comparison with dendrite total length ( m) (paired -test, , , Figure 2d) and total volume ( m3) (paired -test, , , Figure 2f).
2.3 Energetics of the cerebral cortex
Approximately 20% of resting oxygen consumption (i.e. in the absence of heavy physical work by skeletal muscles) is absorbed by the human brain [Laughlin et al., 1998]. Brain activity is fueled almost exclusively by glucose [Magistretti & Allaman, 2015]. Oxidative metabolism in mitochondria of 1 glucose molecule leads to the production of 32 ATP molecules [Mergenthaler et al., 2013], each of which releases eV of free energy upon hydrolysis [George et al., 1970, Scott, 2005]. Thus, the free energy available for utilization by neuronal activities from glucose is only kJ/mol, even though combustion of glucose in oxygen releases 2801 kJ/mol. From the speeds of glucose consumption [Herculano-Houzel, 2011] by the cerebral cortex of different species (Table 4), it can be estimated that the power of the mouse cortex is W, rat cortex is W, and human cortex is W. These cortical values comprise approximately half of the power of the whole brain (Table 5), namely, the power of the mouse brain is W, rat brain is W, and human brain is W. This modest consumption of energy points to highly efficient energy utilization, and miniaturization of the brain’s logical circuitry.
| Species | Cortical mass (gray + white matter) (g) | Glucose use per gram per minute (mol/gmin) | Total number of cortical neurons () | Energy use per neuron (pW) | Total energy use by cortex (W) |
| Mouse | |||||
| Rat | |||||
| Human |
| Species | Brain mass (g) | Glucose use per gram per minute (mol/gmin) | Total number of brain neurons () | Energy use per neuron (pW) | Total energy use by brain (W) |
| Mouse | |||||
| Rat | |||||
| Human |
2.4 Computational capacity of pyramidal neurons
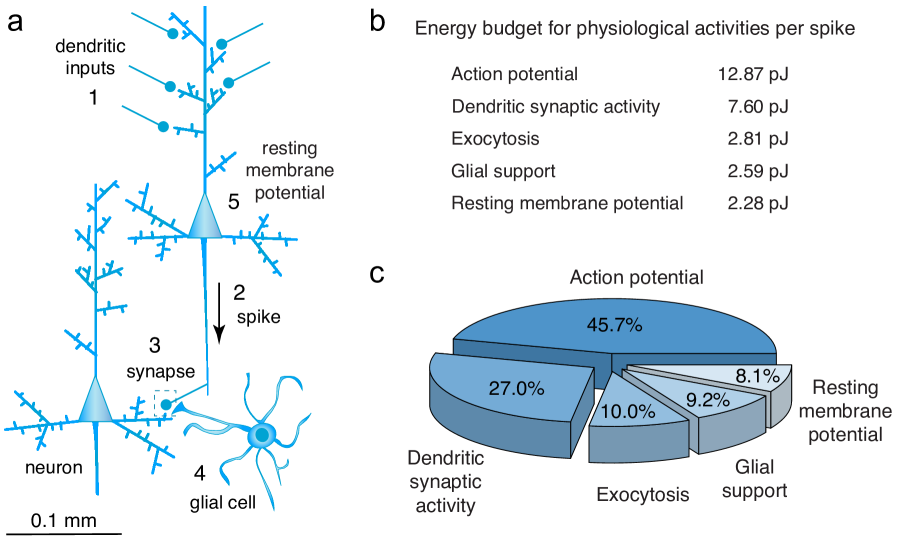
Pyramidal neurons input, process and output cognitive information with the use of electric spikes. There are five main physiological processes that support each spike (Figure 3a):
(1) Each neuron needs multiple excitatory dendritic inputs, which activate post-synaptic neurotransmitter receptors and generate excitatory post-synaptic potentials (EPSPs).
(2) EPSPs propagate towards the soma where they summate to reach a certain voltage threshold and trigger an action potential at the axonal hillock. The action potential then propagates to pre-synaptic axonal buttons that innervate target neurons.
(3) To excite the target neurons, the pre-synaptic electric spike is temporarily converted into chemical signal through exocytosis of synaptic vesicles that release excitatory neurotransmitter such as glutamate or aspartate.
(4) The excess neurotransmitter is recycled by glial cells. Glial cells also support neuronal homeostasis by controlling the chemical contents of the extracellular matrix.
(5) In between spikes, both pyramidal neurons and glial cells expend energy in order to maintain their resting membrane potentials and to restore the initial concentration gradients of Na+, K+ or Ca2+ ions.
The energy expenditure in vivo varies from neuron to neuron depending on the exact morphometric measures and physiological activities. However, it is possible to estimate the energy budget for an average cortical pyramidal neuron under the assumption that all of the energy released from glucose consumed by the brain cortex is used to fuel electric spiking with the underlying biomolecular processes. Because the maintenance of resting membrane potential by neurons, and the accompanying glial support could be viewed as continuous processes interspersed by discrete action potentials, the general outline of the calculation of the energy budget per spike is as follows: Firstly, from the total energy budget of the cerebral cortex, the energy needed for neuronal resting membrane potential and glial support is subtracted. Secondly, from the remaining energy, the maximal average frequency of firing electric spikes is computed. Thirdly, the maximal average firing frequency provides an estimate of the duration of the average interspike interval and the corresponding energy expenditure for the neuronal resting membrane potential and glial support per single spike. Finally, the data so obtained will be integrated for calculating the total energy expenditure to support a single spike together with its preceding interspike interval.
2.4.1 Resting membrane potential
Physiological electric activities are due to passage of metal ions across the plasma membrane. The resting membrane potential of neurons is approximately mV. The influx of Na+ ions leads to depolarization, whereas the efflux of K+ ions leads to hyperpolarization of the transmembrane voltage. Neurons use ATP molecules per second in order to keep steady their resting membrane potential [Attwell & Laughlin, 2001]. The power consumed by neurons in the human cerebral cortex [Herculano-Houzel, 2011] for their resting potential is W, which accounts for of the total cortical power.
2.4.2 Glial support
Glial cells also spend energy to sustain their resting membrane potential at about mV [McKhann et al., 1997]. Glial cells, which are more numerous than neurons in the cerebral cortex [Azevedo et al., 2009], consume ATP molecules per glial cell each second [Attwell & Laughlin, 2001]. For the human cerebral cortex, the energy consumption by glial cells is W, which constitutes of the total cortical power.
2.4.3 Action potentials
Neuronal dendrites are unmyelinated and leak-prone, but they need to be depolarized in their proximal part that is adjacent to soma, to a level slightly above a threshold of mV [Pathak et al., 2016] in order to trigger an action potential at the axonal hillock. To reduce leakage, and achieve efficient transport of the electric spike to distant targets, the axons are myelinated with the exception of the nodes of Ranvier, where upon electric stimulation, the membrane readily depolarizes to mV due to opening of voltage-gated Na+ channels. The number of Na+ ions entering into a cylindrical neurite segment is given by the capacitor charge formula
| (1) |
where is the radius, is the length, is the surface area, is the fraction of unmyelinated active membrane, is the voltage change, F/cm2 is the specific membrane capacitance, and zC is the elementary electric charge.
Dendrites are completely unmyelinated . They are depolarized by mV during the backpropagation of an action potential [Attwell & Laughlin, 2001]. Direct substitution in Eq. (1) establishes that, for each action potential, in the basal dendrites with mean total length m and average radius m enter Na+ ions, whereas in apical dendrites with mean total length m and average radius m enter Na+ ions.
Axons are heavily myelinated with as estimated from the mean length of unmyelinated nodes of Ranvier, which is m, and the internode mean distance of m [Arancibia-Cárcamo et al., 2017]. During an action potential, axons are depolarized by mV [Schwindt et al., 1997]. Again, direct substitution in Eq. (1) establishes that, for axonal trees with mean total length m and average radius m, enter Na+ ions per action potential.
For a pyramidal soma with surface area m2 [Zhu, 2000], and mV, direct substitution in Eq. (1) establishes that there is an additional load of Na+ ions.
For a realistic estimate of the total Na+ entry into a pyramidal neuron per action potential, the amount of Na+ ions computed from the capacitor charge formula should be multiplied by an overlap factor in order to account for simultaneous activation of Na+ and K+ channels with Hodgkin–Huxley kinetics
| (2) |
Computational simulations by Attwell & Laughlin [2001] have found that . The total sodium load in dendrites, soma and axon obtained from Eq. (2) amounts to Na+ ions. These Na+ ions need to be pumped out of the neuron by protein Na+/K+-ATPase, which exports 3 Na+ ions and imports 2 K+ ions for every ATP molecule that is consumed [Sengupta et al., 2013]. Thus, for each electric spike, to remove the load of Na+ ions each neuron needs ATP molecules, which amounts to 12.87 pJ of energy (Figure 3b).
2.4.4 Exocytosis of synaptic vesicles
Exocytosis with subsequent endocytosis of a single synaptic vesicle consumes ATP molecules [Attwell & Laughlin, 2001]. Recycling of glutamate neurotransmitter molecules released per vesicle, through glutamate uptake by glial cells, glial conversion to glutamine, export of glutamine to neurons, neuronal conversion to glutamate and re-packaging into synaptic vesicles, consumes another ATP molecules [Attwell & Laughlin, 2001]. Thus, the total energy consumption by a single synaptic vesicle is ATP molecules.
Axons of cortical pyramidal neurons form between and synapses onto target neurons [Braitenberg & Schüz, 1998]. The number of released synaptic vesicles is proportional to the total number of axonal synapses and the probability of release of a synaptic vesicle per action potential per synapse
| (3) |
Considering that the release probability of a synaptic vesicle is only per action potential per synapse [Georgiev & Glazebrook, 2018], each pyramidal neuron will release on average vesicles (for projection neurons most of the targets can be extracortical). Thus, for each electric spike, the exocytosis of synaptic vesicles consumes ATP molecules, which amounts to 2.81 pJ of energy (Figure 3b).
2.4.5 Synaptic activity in dendrites
Action potentials cannot be spontaneously generated by healthy pyramidal neurons from their resting state. Instead, a significant amount of preceding dendritic activity would be required to excite the neuron. An important factor in many related scenarios is the nature and effect of spatial compartmentalization. For instance, Polsky et al. [2004] observed that rat neocortical pyramidal neurons initially process their synaptic inputs within thin dendritic subunits regulated by a nonlinear sigmoidal-type threshold, and then at a second stage they are linearly combined to deliver the overall neuronal response.
Each excitatory synaptic input delivered at a dendrite spine-head depolarizes the soma by only mV [Kubota et al., 2015]. Thus, for a potential rise of 16 mV, from the resting membrane potential of mV to the spike threshold of mV, summation of at least 134 dendritic spine inputs would be needed. Indeed, based on detailed experimental electrophysiological data in vivo using two-photon activation of an intracellular caged NMDA receptor antagonist, it was confirmed that the dendrites of pyramidal neurons need to receive an excess of excitatory synaptic inputs (activating NMDA and AMPA receptors) in order to trigger an action potential [Palmer et al., 2014].
In the awake state characterized by -frequency electric oscillations, the activation of powerful perisomatic inhibition by fast-spiking interneurons [Hu et al., 2014, Georgiev et al., 2014], however, causes hyperpolarization or shunting that suppresses the effects of excitatory synaptic activation in pyramidal neurons. To take into account the effect of cortical inhibition in the presence of non-zero excitatory to inhibitory (E/I) ratio, the number of dendritic synaptic inputs can be modeled as
| (4) |
The E/I ratio at the soma of layer 2/3 pyramidal neurons is , whereas at the soma of layer 5 pyramidal neurons it is [Yang & Sun, 2018]. Direct substitution in Eq. (4) shows that, in the presence of active inhibitory interneurons, the generation of an electric spike would require 315 dendritic inputs for layer 2/3 pyramidal neurons and 840 dendritic inputs for layer 5 pyramidal neurons. For the estimation of the energy budget, we will take the average requirement of excitatory synaptic inputs delivered to the dendritic tree for triggering of an action potential in a single cortical pyramidal neuron.
The release of a single synaptic vesicle filled with glutamate leads to activation of post-synaptic NMDA and AMPA receptors whose opening lets Na+ ions and Ca2+ ions enter into the dendrite [Attwell & Laughlin, 2001]. Calcium signaling in dendrites leads to Ca2+ load that needs to be removed by Na+/Ca2+ exchanger, which exports 1 Ca2+ ion and imports 3 Na+ ions. The 3 Na+ ions are subsequently exported by Na+/K+-ATPase consuming 1 ATP molecule. For synaptic inputs per action potential, the extrusion of the Na+ and Ca2+ ion load requires ATP molecules. Recycling of the vesicles (discussed in the preceding subsection) further requires ATP molecules. The energy expenditure for Ca2+ signaling during backpropagation of the action potential from axonal hillock to dendrites adds another ATP molecules [Attwell & Laughlin, 2001]. Thus, for each electric spike, dendritic signaling consumes ATP molecules in total, which amounts to 7.60 pJ of energy (Figure 3b).
2.4.6 Rationing of the energy budget across physiological activities
Taking stock of matters so far, we see that neural information is indeed costly. The energy expenses by a single neuron to support the dendritic synaptic activity required to elicit an action potential, to sustain the propagation of the action potential towards pre-synaptic axonal buttons, and to execute the associated release of synaptic vesicles for neurotransmitter signaling, sum up to ATP molecules, which release pJ of free energy. For neurons in the human cerebral cortex (Table 4), the required energy to fire once is J. After subtraction from the total cortical budget of the energies spent on the resting membrane potential by neurons and glial cells, there is a remaining energy power of W that can be spent by the cerebral cortex on firing action potentials with an average frequency of Hz. This constitutes of the maximal firing frequency of Hz that can be attained by layer 5 pyramidal neurons [Schwindt et al., 1997]. For average spiking frequency of Hz, the duration of the interspike interval is ms. Thus, for each electric spike, the maintenance of neuronal resting membrane potential in the preceding interspike interval uses 2.28 pJ and the glial support uses 2.59 pJ of energy (Figure 3b).
The total energy budget for a single electric spike together with the preceding interspike interval amounts to 28.15 pJ. In summary, 45.7 % of the energy budget is dedicated for propagation of the action potential, 27.0 % for support of dendritic synaptic activity, 10.0 % for exocytosis of synaptic vesicles, 9.2 % for glial support, and 8.1 % for maintenance of the neuronal resting membrane potential in the interspike interval (Figure 3c).
Original estimates by Attwell & Laughlin [2001] pointed to ATP molecules (210.85 pJ) consumed by a neuron with a mean firing rate of 4 Hz. The energy budget stipulated 47% for the production of action potentials, 34% for the activity of dendritic post-synaptic receptors, 6% for presynaptic exocytosis including recycling of excess glutamate, and 13% for maintenance of the resting state of neurons and supporting glial cells. The main difference between that previous study and our present results stems from the precise morphometric data that we have used resulting in higher average spiking frequency by pyramidal neurons due to lower energy needs to support action potentials.
2.4.7 The Landauer limit
Moving a single elementary electric charge (electron, proton or monovalent ion) across the plasma membrane through a potential difference of mV dissipates eV of energy. The energy of pJ consumed per action potential is sufficient for the motion of elementary electric charges. The transport of an elementary electric charge across the plasma membrane, however, may not be the elementary bit of neuronal logical operation. Landauer’s limit asserts that the minimum possible amount of energy required by thermodynamics to erase one bit of information (e.g. through application of an irreversible gate such as AND gate or OR gate) is
| (5) |
recalling that J/K is Boltzmann’s constant and is the absolute temperature [Landauer, 1961]. Otherwise expressed, if denotes energy dissipated into the environment, and the thermodynamic entropy equivalent to information erased from the system memory, then
| (6) |
The total number of erased bits of information from the system is bounded by [Street, 2020, Bormashenko, 2019]
| (7) |
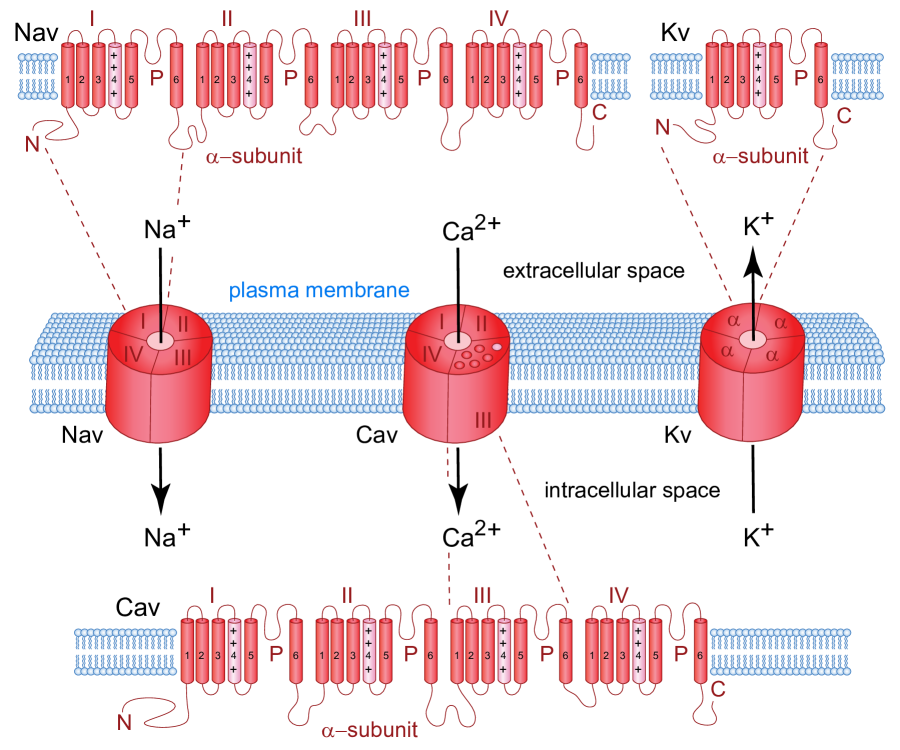
At physiological temperature of K, Landauer’s limit is zJ ( meV). Therefore, the energy of pJ consumed per action potential is sufficient for the execution of Landauer elementary logical operations. Noteworthy, the passage of a single elementary electric charge across the plasma membrane is equivalent to such elementary logical operations. Since each S4 protein -helix voltage-sensor in voltage-gated ion channels (Figure 4) usually contains 6 positively charged amino acid residues [Catterall, 1988], the proton tunneling between neighboring positively charged sites in the S4 voltage-sensor [Kariev et al., 2007, Kariev & Green, 2012, 2018, 2019] is ideally suited to represent a single Landauer elementary logical operation in cortical neural networks. Protons interact with water and biological matter, mainly in a non-classical manner including exchange-correlation effects, chemical bonding in hydronium-like complexes, and tunneling [Lobaugh & Voth, 1996]. Once the S4 protein -helix voltage-sensors adopt an open channel conformation, the subsequent flow of metal ions across the ion channel leads to amplification of individual events of proton quantum tunneling that occurred in the S4 voltage sensors [Kariev et al., 2007, Kariev & Green, 2012, 2018, 2019]. This is how nanoscale quantum events may be amplified to exert macroscopic effect on neuronal behavior and brain function [Georgiev, 2013, 2020]. If the energy power of W available for electric spiking is completely miniaturized at the Landauer limit of zJ, the human brain cortex will be able to execute the equivalent of over 1.2 zetta elementary logical operations per second.
3 Discussion
In this work, we have evaluated the cognitive computational capacity of the brain based on its experimentally measured glucose consumption [Herculano-Houzel, 2011]. The tightness of the bound is justified by two biomedical facts. Firstly, the brain does not have an internal store of glucose, but needs to rely on blood glucose level maintained by physiologically regulated release from the liver glycogen depot [Guyton & Hall, 2006]. Secondly, the brain does not have anything like a long-term energy battery capable of supporting cognitive computation in the absence of glucose, because loss of clinical consciousness (syncope) occurs within seconds of a sudden drop in blood glucose levels, or a brief cessation of cerebral blood flow [Kapoor, 2000]. This implies that the rate of glucose consumption indeed puts a tight upper bound on the brain’s capacity for cognitive computation.
In the awake state, the energy power of W consumed by the human cerebral cortex permits a maximal average spiking rate of Hz. This is consistent with the observed average spontaneous firing rate of Hz by neurons in the visual cortex of awake rhesus monkeys [Chen et al., 2009], albeit it is somewhat higher than the average spontaneous firing rates of Hz in rat [Aasebø et al., 2017] or Hz in mouse [Durand et al., 2016]. Evoked activity of neurons in primary visual cortex of awake mice in response to an optimal drifting grating, however, exhibited average firing rates that were strongly dependent on locomotion: Hz for stationary mice and Hz for mice running on a freely rotating spherical treadmill with their heads fixed [Niell & Stryker, 2010]. Thus, the estimated maximal average spiking rate of Hz might be reached by an active brain engaged in a complex problem-solving task that integrates multi-modal information from different senses.
Detailed analysis of neuronal morphology combined with energetics of electrophysiological and molecular processes support the highly efficient miniaturization of logical computational gates performed by pyramidal neurons in the cerebral cortex. The energy utilized for the generation of a single action potential is sufficient for the execution of elementary logical operations. The cerebral cortex appears to have attained the maximal computational efficiency allowed by Landauer’s thermodynamic limit: quantum tunneling of a proton between neighboring positively charged S4 sensor sites in voltage-gated ion channels constitutes a single Landauer elementary logical operation, whereas the transport of a monovalent metal ion through the open ion channel pore constitutes six such operations.
Landauer’s limit sets ultimate energy constrains on the functioning of physical computing devices in the presence of a thermal bath [Sagawa & Ueda, 2008, 2010, Hong et al., 2016, Gaudenzi et al., 2018, Lent et al., 2019]. The original formulation put forward by Landauer [1961] is motivated by consideration of the finite capacity of working memory of computing devices, namely the act of resetting of the working memory to its initial empty state requires compression of the phase space of the memory device, which will decrease its entropy. The second law of thermodynamics, however, requires that the total entropy of the memory device and its environment increases in time [Leff & Rex, 2002]. Therefore, resetting the working memory must be accompanied by a corresponding entropy increase in the environment, in the form of heat dissipation, which is at least joules per bit [Landauer, 1961]. The brain cortex, which is responsible for the stream of consciousness, allows us to store cognitive information only for short time periods before we forget it, or replace it with new sensory information. Thus, one interpretation of Landauer’s principle is that the working of the human mind spends energy to forget [Plenio & Vitelli, 2001], where the energy dissipation occurs in the act of irreversible resetting of the cortical working memory. An alternative formulation based on the theory of dissipative quantum channels, however, establishes that communication of classical information across a noisy quantum channel [Jagadish & Petruccione, 2018] that is immersed in a heat bath with effective temperature , also requires energy expenditure of at least joules per bit [Porod et al., 1984, Levitin, 1998]. Otherwise, the signal transmitted from the sender gate to the receiver gate could not be distinguished from the ambient thermal noise [Porod et al., 1984, Levitin, 1998]. Thus, another interpretation of Landauer’s principle is that the working of the human mind spends energy to transmit information between different noisy neuronal compartments (dendrites, soma, axon) or to communicate unambiguously with effector organs (e.g. muscles through intermediate extracortical centers such as -motor neurons in the spinal cord). It is likely that, in the course of an electric spike, cortical pyramidal neurons spend energy both for resetting their S4 voltage sensors in the resting ion channel state and for transmission of the electric signal from dendrites toward the axon terminals. Much related are implications of this neurophysiology together with Landauer’s principle for human cognition, as discussed in Collel & Fauquet [2015], Street [2016, 2020] with significant pointers towards variational free energy and its role in perceptual Bayesian inference [Friston, 2010, 2013].
Because physical dynamics at the nanoscale is able to manifest characteristic quantum mechanical effects, our results provide a rigorous foundation, as far as energy considerations are concerned, for future development of quantum models of the transmembrane electromagnetic field and its interaction with mobile electric charges inside protein voltage-gated ion channels [Georgiev, 2017, Kariev et al., 2007, Kariev & Green, 2012, 2018, 2019] or membrane-bound SNARE proteins whose zipping mechanism triggers neurotransmitter release [Georgiev & Glazebrook, 2018, 2019a, 2019b]. Technological advances in available supercomputers have already led to routine simulation of quantum dynamics of small biomolecules in electrolyte solution with the use of quantum chemistry software implementing density functional theory [Kolev et al., 2011, 2013, 2018]. Applications of recent theorems in quantum information, as based on generalized uncertainty relations [Carmi & Cohen, 2019] to quantum brain states [Georgiev, 2013, 2020] may further shed light on the perplexing open problems in the cognitive sciences.
To summarize, we have implemented fundamental physical principles, including the thermodynamically allowable Landauer’s limit of energy spent on elementary logical operations, to show that not all biomolecular processes may contribute to cognitive computation, but mainly those involving transmembrane proteins, such as voltage-gated or ligand-gated ion channels, integrated into the electrically excitable neuronal plasma membrane. Even though the human cerebral cortex may perform over 1.2 zetta logical operations per second, exceeding over four orders of magnitude the capacity of modern supercomputers, we expect the implementation of large-scale and ultra in-depth brain simulations to significantly advance in the foreseeable future.
4 Conflict of Interest
The authors certify that they have no affiliations with or involvement in any organization or entity with any financial interest, or non-financial interest in the subject matter or materials discussed in this work.
5 Methods and Materials
5.1 Selection criteria for the morphometric study
Morphometric parameters such as radii and lengths of neuronal projections constrain the electric performance of neurons and determine the number of physical charges that need to cross the plasma membrane in order to elicit a certain change in the transmembrane voltage. For accurate assessment of the average radii and total lengths of different neurites (basal dendrites, apical dendrites, and axons), we have analyzed the full collection of pyramidal neuronal reconstructions in rodent (mouse, rat) or human brain cortex from NeuroMorpho.org 7.8 digital archive [Ascoli et al., 2007] that pass the following selection criteria: Firstly, we have selected only control experimental conditions with animals that did not express genetically-engineered disease-related protein mutations and were not exposed to pharmacological agents or harmful stimuli (e.g. stress). Secondly, only animals whose age corresponds to human age of over 3 months old were included. The utilized piecewise linear conversion formulas into corresponding human age are given for mice by Sengupta [2013], and for rats by Dutta & Sengupta [2016]. Thirdly, to ensure minimal trimming of dendritic trees for analysis of apical and basal dendrites, we have included only reconstructions with minimal slice thickness of 300 m. Analysis of complete axonal arborizations was performed in neuronal reconstructions from brain-wide imaging data [Economo et al., 2016, Gerfen et al., 2018]. To verify the quality of all reconstructions, neurons were visualized in Neuromantic version 1.6.3 (https://www.reading.ac.uk/neuromantic/body_index.php) and .swc files with non-standard labeling of neurites or visually incomplete dendritic tree (e.g. apical dendrite was trimmed near its base) were excluded from further analysis. Standardized .swc files are tables with 7 columns of numerical data for cable-like cylindrical segments that comprise the neuronal reconstruction (Table 6). The lengths and volumes of neurite segments was quantified with the use of custom Excel macros fetching the cable radii and computing the Euclidean distances from the coordinates given in the .swc files. Morphometric data are reported as mean standard deviation.
| 1 | 2 | 3 | 4 | 5 | 6 | 7 |
|---|---|---|---|---|---|---|
| segment number | structure identifier | position | position | position | radius | parent segment |
| integer value starting from 1 |
1 - soma
2 - axon 3 - basal dendrite 4 - apical dendrite |
coordinate in m | coordinate in m | coordinate in m | segment radius in m |
parent segment number;
is used for lack of parent |
5.2 Neuronal reconstructions
Digital reconstructions of pyramidal neurons in control experimental conditions were selected from three animal species: mouse (252 neurons), rat (491 neurons) and human (6 neurons). This dataset of 749 neurons includes contributions from 32 labs: Amaral [Ishizuka et al., 1995], Arnold_Johnston [Arnold et al., 2019], Barrionuevo [Henze et al., 1996], Blackman [Blackman et al., 2014], Buchs [Larkum et al., 2004], Chandrashekar [Economo et al., 2016], Claiborne [Carnevale et al., 1997], De Koninck [Bories et al., 2013], Dendritica [Vetter et al., 2001], Feldmeyer [Marx & Feldmeyer, 2012, Marx et al., 2015], Groen [Groen et al., 2014], Hay [Hay et al., 2013], Helmstaedter [Helmstaedter et al., 2008], Hoffman [Hoffmann et al., 2015], Jaffe [Chitwood et al., 1999], Johnston [Dougherty et al., 2012, Malik et al., 2016], Kawaguchi [Hirai et al., 2012, Ueta et al., 2013], Kole [Hamada & Kole, 2015, Hamada et al., 2016, Hallermann et al., 2012, Kole et al., 2004, 2007, Kole, 2011], Korngreen [Bar-Yehuda & Korngreen, 2008], Krieger [Groh et al., 2009, Krieger et al., 2007], Luo [Gong et al., 2016], Markram [Anastassiou et al., 2015], Martina [Kelly et al., 2016], MouseLight [Gerfen et al., 2018], Orion [Santamaría-Pang et al., 2015], Segev [Eyal et al., 2016], Soltesz [Lee et al., 2014], Spruston [Golding et al., 2005], Staiger [Staiger et al., 2016], Storm [Hönigsperger et al., 2015], Topolnik [Tyan et al., 2014, Francavilla et al., 2018] and Urban [Zhou et al., 2015, Tripathy et al., 2015].
5.3 Modeling of cortical layers
Vector .svg images of individual neurons were rendered with HBP Neuron Morphology Viewer [Bakker & Tiesinga, 2016, Bakker et al., 2017] and scaling information was extracted with NeuroM, a Python-based toolkit for the analysis and processing of neuron morphologies developed by the Blue Brain Project (https://neurom.readthedocs.io/en/stable/). Modeling of the brain cortex in mouse was then performed in Adobe Illustrator based on measured thickness of cortical layers in Nissl stained coronal slices [Franklin & Paxinos, 2007, Georgiev et al., 2016]. All data from NeuroMorpho.Org digital archive was used in compliance with the online Terms of Use (http://neuromorpho.org/useterm.jsp). In particular, all original papers that describe the reconstructions are cited, the complete name of the digital archive is clearly stated, attribution to the developers of the archive is given [Ascoli et al., 2007], and specific reconstructions are referenced with their NeuroMorpho.Org ID numbers.
5.4 Statistical analysis
Statistical analysis of neuronal morphology was performed using SPSS ver. 23 (IBM Corporation, New York, USA). Comparison of morphometric measures for apical and basal dendrites was performed with repeated-measures analysis of variance (rANOVA) implemented as a general linear model in which within-subject variable was dendrite type, between-subject factors were animal species, brain region and neuronal type, and covariate was slice thickness. Comparison of axons with dendrites was performed with paired -tests for a subset of the neuronal reconstructions for which the axonal trees were complete. Paired box plots were created with the use of ggpubr library in R ver. 4.0.2 (R Foundation for Statistical Computing, Vienna, Austria, https://www.r-project.org/).
5.5 Energy consumption and energy units
The energy consumption by pyramidal neurons in different animal species (mouse, rat or humans) was estimated based on brain mass, glucose use per gram per minute, and total number of neurons in the brain or the cerebral cortex reported in Herculano-Houzel [2011]. For each molecule of glucose, oxidative metabolism in mitochondria produces 32 ATP molecules [Mergenthaler et al., 2013]. Hydrolysis of 1 ATP molecule releases eV of free energy [George et al., 1970, Scott, 2005], which is equivalent to 64.0872 zJ. Thus, the useable energy from 1 glucose molecule is 12.8 eV (2050.79 zJ). For molecular processes the energy consumption was reported in electron volts (eV), where 1 eV is the amount of energy required to move 1 electron across an electric potential difference of 1 V. For macroscopic processes the energy consumption was reported in joules (J), using a conversion formula where 1 eV equals to zJ. Brain power was reported in watts (W), where 1 W is defined to be the energy transfer at a rate of 1 J per second. For all reported quantities standard SI prefixes were used.
Acknowledgements
E.C. acknowledges support from the Israel Innovation Authority under project 70002 and from the Quantum Science and Technology Program of the Israeli Council of Higher Education.
References
- Aasebø et al. [2017] Aasebø, I. E. J., Lepperød, M. E., Stavrinou, M., Nøkkevangen, S., Einevoll, G., Hafting, T., & Fyhn, M. (2017). Temporal processing in the visual cortex of the awake and anesthetized rat. eNeuro, 4, eneuro.0059–17.2017. doi:10.1523/eneuro.0059-17.2017.
- Anastassiou et al. [2015] Anastassiou, C. A., Perin, R., Buzsáki, G., Markram, H., & Koch, C. (2015). Cell type- and activity-dependent extracellular correlates of intracellular spiking. Journal of Neurophysiology, 114, 608–623. doi:10.1152/jn.00628.2014.
- Arancibia-Cárcamo et al. [2017] Arancibia-Cárcamo, I. L., Ford, M. C., Cossell, L., Ishida, K., Tohyama, K., & Attwell, D. (2017). Node of Ranvier length as a potential regulator of myelinated axon conduction speed. eLife, 6, e23329. doi:10.7554/eLife.23329.
- Arnold et al. [2019] Arnold, E. C., McMurray, C., Gray, R., & Johnston, D. (2019). Epilepsy-induced reduction in HCN channel expression contributes to an increased excitability in dorsal, but not ventral, hippocampal CA1 neurons. eNeuro, 6, eneuro.0036–19.2019. doi:10.1523/eneuro.0036-19.2019.
- Ascoli et al. [2007] Ascoli, G. A., Donohue, D. E., & Halavi, M. (2007). NeuroMorpho.org: a central resource for neuronal morphologies. Journal of Neuroscience, 27, 9247–9251. doi:10.1523/jneurosci.2055-07.2007.
- Attwell & Laughlin [2001] Attwell, D., & Laughlin, S. B. (2001). An energy budget for signaling in the grey matter of the brain. Journal of Cerebral Blood Flow and Metabolism, 21, 1133–1145. doi:10.1097/00004647-200110000-00001.
- Azevedo et al. [2009] Azevedo, F. A. C., Carvalho, L. R. B., Grinberg, L. T., Farfel, J. M., Ferretti, R. E. L., Leite, R. E. P., Filho, W. J., Lent, R., & Herculano-Houzel, S. (2009). Equal numbers of neuronal and nonneuronal cells make the human brain an isometrically scaled-up primate brain. Journal of Comparative Neurology, 513, 532–541. doi:10.1002/cne.21974.
- Bakker et al. [2017] Bakker, R., García-Amado, M., Evangelio, M., Clascá, F., & Tiesinga, P. H. (2017). Workflow, data format and tools to register neuron morphologies to a reference brain atlas. BMC Neuroscience, 18, P271. doi:10.1186/s12868-017-0372-1.
- Bakker & Tiesinga [2016] Bakker, R., & Tiesinga, P. H. (2016). Web-based neuron morphology viewer as an aid to develop new standards for neuron morphology file formats. Frontiers in Neuroinformatics, . doi:10.3389/conf.fninf.2016.20.00079.
- Bar-Yehuda & Korngreen [2008] Bar-Yehuda, D., & Korngreen, A. (2008). Space-clamp problems when voltage clamping neurons expressing voltage-gated conductances. Journal of Neurophysiology, 99, 1127–1136. doi:10.1152/jn.01232.2007.
- Bekkers [2011] Bekkers, J. M. (2011). Pyramidal neurons. Current Biology, 21, R975. doi:10.1016/j.cub.2011.10.037.
- Blackman et al. [2014] Blackman, A. V., Grabuschnig, S., Legenstein, R., & Sjöström, P. J. (2014). A comparison of manual neuronal reconstruction from biocytin histology or 2-photon imaging: morphometry and computer modeling. Frontiers in Neuroanatomy, 8, 65. doi:10.3389/fnana.2014.00065.
- Bories et al. [2013] Bories, C., Husson, Z., Guitton, M. J., & De Koninck, Y. (2013). Differential balance of prefrontal synaptic activity in successful versus unsuccessful cognitive aging. Journal of Neuroscience, 33, 1344. doi:10.1523/jneurosci.3258-12.2013.
- Bormashenko [2019] Bormashenko, E. (2019). The Landauer principle: re-formulation of the second thermodynamics law or a step to great unification? Entropy, 21, 918. doi:10.3390/e21100918.
- Braitenberg & Schüz [1998] Braitenberg, V., & Schüz, A. (1998). Cortex: Statistics and Geometry of Neuronal Connectivity. (2nd ed.). Berlin: Springer. doi:10.1007/978-3-662-03733-1.
- Carmi & Cohen [2019] Carmi, A., & Cohen, E. (2019). Relativistic independence bounds nonlocality. Science Advances, 5, eaav8370. doi:10.1126/sciadv.aav8370.
- Carnevale et al. [1997] Carnevale, N. T., Tsai, K. Y., Claiborne, B. J., & Brown, T. H. (1997). Comparative electrotonic analysis of three classes of rat hippocampal neurons. Journal of Neurophysiology, 78, 703–720. doi:10.1152/jn.1997.78.2.703.
- Catterall [1988] Catterall, W. A. (1988). Structure and function of voltage-sensitive ion channels. Science, 242, 50. doi:10.1126/science.2459775.
- Chen et al. [2009] Chen, Y., Anand, S., Martinez-Conde, S., Macknik, S. L., Bereshpolova, Y., Swadlow, H. A., & Alonso, J.-M. (2009). The linearity and selectivity of neuronal responses in awake visual cortex. Journal of Vision, 9, 12–12. doi:10.1167/9.9.12.
- Chitwood et al. [1999] Chitwood, R. A., Hubbard, A., & Jaffe, D. B. (1999). Passive electrotonic properties of rat hippocampal CA3 interneurones. Journal of Physiology, 515, 743–756. doi:10.1111/j.1469-7793.1999.743ab.x.
- Collel & Fauquet [2015] Collel, G., & Fauquet, J. (2015). Brain activty and cognition: a connection from thermodynamics and information theory. Frontiers in Psychology, 6. doi:10.3389/fpsyg.2015.00818.
- Dougherty et al. [2012] Dougherty, K. A., Islam, T., & Johnston, D. (2012). Intrinsic excitability of CA1 pyramidal neurones from the rat dorsal and ventral hippocampus. Journal of Physiology, 590, 5707–5722. doi:10.1113/jphysiol.2012.242693.
- Durand et al. [2016] Durand, S., Iyer, R., Mizuseki, K., de Vries, S., Mihalas, S., & Reid, R. C. (2016). A comparison of visual response properties in the lateral geniculate nucleus and primary visual cortex of awake and anesthetized mice. Journal of Neuroscience, 36, 12144–12156. doi:10.1523/jneurosci.1741-16.2016.
- Dutta & Sengupta [2016] Dutta, S., & Sengupta, P. (2016). Men and mice: relating their ages. Life Sciences, 152, 244–248. doi:10.1016/j.lfs.2015.10.025.
- Economo et al. [2016] Economo, M. N., Clack, N. G., Lavis, L. D., Gerfen, C. R., Svoboda, K., Myers, E. W., & Chandrashekar, J. (2016). A platform for brain-wide imaging and reconstruction of individual neurons. eLife, 5, e10566. doi:10.7554/eLife.10566.
- Eyal et al. [2018] Eyal, G., Verhoog, M. B., Testa-Silva, G., Deitcher, Y., Benavides-Piccione, R., DeFelipe, J., de Kock, C. P. J., Mansvelder, H. D., & Segev, I. (2018). Human cortical pyramidal neurons: from spines to spikes via models. Frontiers in Cellular Neuroscience, 12, 181. doi:10.3389/fncel.2018.00181.
- Eyal et al. [2016] Eyal, G., Verhoog, M. B., Testa-Silva, G., Deitcher, Y., Lodder, J. C., Benavides-Piccione, R., Morales, J., DeFelipe, J., de Kock, C. P. J., Mansvelder, H. D., & Segev, I. (2016). Unique membrane properties and enhanced signal processing in human neocortical neurons. eLife, 5, e16553. doi:10.7554/eLife.16553.
- Fournier et al. [2015] Fournier, J., Müller, C. M., & Laurent, G. (2015). Looking for the roots of cortical sensory computation in three-layered cortices. Current Opinion in Neurobiology, 31, 119–126. doi:10.1016/j.conb.2014.09.006.
- Francavilla et al. [2018] Francavilla, R., Villette, V., Luo, X., Chamberland, S., Muñoz Pino, E., Camiré, O., Wagner, K., Kis, V., Somogyi, P., & Topolnik, L. (2018). Connectivity and network state-dependent recruitment of long-range VIP-GABAergic neurons in the mouse hippocampus. Nature Communications, 9, 5043. doi:10.1038/s41467-018-07162-5.
- Franklin & Paxinos [2007] Franklin, K. B. J., & Paxinos, G. (2007). The Mouse Brain in Stereotaxic Coordinates. Amsterdam: Academic Press.
- Friston [2010] Friston, K. J. (2010). The free-energy principle: A unified brain theory? Nature Reviews Neuroscience, 11, 127–138.
- Friston [2013] Friston, K. J. (2013). Life as we know it. Journal of The Royal Society Interface, 10, 20130475.
- Gaudenzi et al. [2018] Gaudenzi, R., Burzurí, E., Maegawa, S., van der Zant, H. S. J., & Luis, F. (2018). Quantum Landauer erasure with a molecular nanomagnet. Nature Physics, 14, 565–568. doi:10.1038/s41567-018-0070-7.
- George et al. [1970] George, P., Witonsky, R. J., Trachtman, M., Wu, C., Dorwart, W., Richman, L., Richman, W., Shurayh, F., & Lentz, B. (1970). “Squiggle-H2O”. An enquiry into the importance of solvation effects in phosphate ester and anhydride reactions. Biochimica et Biophysica Acta (BBA) - Bioenergetics, 223, 1–15. doi:10.1016/0005-2728(70)90126-X.
- Georgiev et al. [2014] Georgiev, D., Arion, D., Enwright, J. F., Kikuchi, M., Minabe, Y., Corradi, J. P., Lewis, D. A., & Hashimoto, T. (2014). Lower gene expression for KCNS3 potassium channel subunit in parvalbumin-containing neurons in the prefrontal cortex in schizophrenia. American Journal of Psychiatry, 171, 62–71. doi:10.1176/appi.ajp.2013.13040468.
- Georgiev et al. [2016] Georgiev, D., Yoshihara, T., Kawabata, R., Matsubara, T., Tsubomoto, M., Minabe, Y., Lewis, D. A., & Hashimoto, T. (2016). Cortical gene expression after a conditional knockout of 67 kDa glutamic acid decarboxylase in parvalbumin neurons. Schizophrenia Bulletin, 42, 992–1002. doi:10.1093/schbul/sbw022.
- Georgiev [2013] Georgiev, D. D. (2013). Quantum no-go theorems and consciousness. Axiomathes, 23, 683–695. doi:10.1007/s10516-012-9204-1.
- Georgiev [2017] Georgiev, D. D. (2017). Quantum Information and Consciousness: A Gentle Introduction. Boca Raton: CRC Press. doi:10.1201/9780203732519.
- Georgiev [2020] Georgiev, D. D. (2020). Inner privacy of conscious experiences and quantum information. Biosystems, 187, 104051. doi:10.1016/j.biosystems.2019.104051.
- Georgiev & Glazebrook [2018] Georgiev, D. D., & Glazebrook, J. F. (2018). The quantum physics of synaptic communication via the SNARE protein complex. Progress in Biophysics and Molecular Biology, 135, 16–29. doi:10.1016/j.pbiomolbio.2018.01.006.
- Georgiev & Glazebrook [2019a] Georgiev, D. D., & Glazebrook, J. F. (2019a). On the quantum dynamics of Davydov solitons in protein -helices. Physica A: Statistical Mechanics and its Applications, 517, 257–269. doi:10.1016/j.physa.2018.11.026.
- Georgiev & Glazebrook [2019b] Georgiev, D. D., & Glazebrook, J. F. (2019b). Quantum tunneling of Davydov solitons through massive barriers. Chaos, Solitons and Fractals, 123, 275–293. doi:10.1016/j.chaos.2019.04.013.
- Gerfen et al. [2018] Gerfen, C. R., Economo, M. N., & Chandrashekar, J. (2018). Long distance projections of cortical pyramidal neurons. Journal of Neuroscience Research, 96, 1467–1475. doi:10.1002/jnr.23978.
- Golding et al. [2005] Golding, N. L., Mickus, T. J., Katz, Y., Kath, W. L., & Spruston, N. (2005). Factors mediating powerful voltage attenuation along CA1 pyramidal neuron dendrites. Journal of Physiology, 568, 69–82. doi:10.1113/jphysiol.2005.086793.
- Goldman-Rakic [2002] Goldman-Rakic, P. S. (2002). The “psychic cell” of Ramón y Cajal. Progress in Brain Research, 136, 427–434.
- Gong et al. [2016] Gong, H., Xu, D., Yuan, J., Li, X., Guo, C., Peng, J., Li, Y., Schwarz, L. A., Li, A., Hu, B., Xiong, B., Sun, Q., Zhang, Y., Liu, J., Zhong, Q., Xu, T., Zeng, S., & Luo, Q. (2016). High-throughput dual-colour precision imaging for brain-wide connectome with cytoarchitectonic landmarks at the cellular level. Nature Communications, 7, 12142. doi:10.1038/ncomms12142.
- Groen et al. [2014] Groen, M. R., Paulsen, O., Pérez-Garci, E., Nevian, T., Wortel, J., Dekker, M. P., Mansvelder, H. D., van Ooyen, A., & Meredith, R. M. (2014). Development of dendritic tonic GABAergic inhibition regulates excitability and plasticity in CA1 pyramidal neurons. Journal of Neurophysiology, 112, 287–299. doi:10.1152/jn.00066.2014.
- Groh et al. [2009] Groh, A., Meyer, H. S., Schmidt, E. F., Heintz, N., Sakmann, B., & Krieger, P. (2009). Cell-type specific properties of pyramidal neurons in neocortex underlying a layout that is modifiable depending on the cortical area. Cerebral Cortex, 20, 826–836. doi:10.1093/cercor/bhp152.
- Guyton & Hall [2006] Guyton, A. C., & Hall, J. E. (2006). Textbook of Medical Physiology. (11th ed.). Philadelphia: Elsevier.
- Hallermann et al. [2012] Hallermann, S., de Kock, C. P. J., Stuart, G. J., & Kole, M. H. P. (2012). State and location dependence of action potential metabolic cost in cortical pyramidal neurons. Nature Neuroscience, 15, 1007–1014. doi:10.1038/nn.3132.
- Hamada et al. [2016] Hamada, M. S., Goethals, S., de Vries, S. I., Brette, R., & Kole, M. H. P. (2016). Covariation of axon initial segment location and dendritic tree normalizes the somatic action potential. Proceedings of the National Academy of Sciences, 113, 14841. doi:10.1073/pnas.1607548113.
- Hamada & Kole [2015] Hamada, M. S., & Kole, M. H. P. (2015). Myelin loss and axonal ion channel adaptations associated with gray matter neuronal hyperexcitability. Journal of Neuroscience, 35, 7272. doi:10.1523/jneurosci.4747-14.2015.
- Hay et al. [2013] Hay, E., Schürmann, F., Markram, H., & Segev, I. (2013). Preserving axosomatic spiking features despite diverse dendritic morphology. Journal of Neurophysiology, 109, 2972–2981. doi:10.1152/jn.00048.2013.
- Helmstaedter et al. [2008] Helmstaedter, M., Sakmann, B., & Feldmeyer, D. (2008). The relation between dendritic geometry, electrical excitability, and axonal projections of L2/3 interneurons in rat barrel cortex. Cerebral Cortex, 19, 938–950. doi:10.1093/cercor/bhn138.
- Henze et al. [1996] Henze, D. A., Cameron, W. E., & Barrionuevo, G. (1996). Dendritic morphology and its effects on the amplitude and rise-time of synaptic signals in hippocampal CA3 pyramidal cells. Journal of Comparative Neurology, 369, 331–334. doi:10.1002/(SICI)1096-9861(19960603)369:3<331::AID-CNE1>3.0.CO;2-6.
- Herculano-Houzel [2011] Herculano-Houzel, S. (2011). Scaling of brain metabolism with a fixed energy budget per neuron: implications for neuronal activity, plasticity and evolution. PLoS One, 6, e17514. doi:10.1371/journal.pone.0017514.
- Hirai et al. [2012] Hirai, Y., Morishima, M., Karube, F., & Kawaguchi, Y. (2012). Specialized cortical subnetworks differentially connect frontal cortex to parahippocampal areas. Journal of Neuroscience, 32, 1898–1913. doi:10.1523/jneurosci.2810-11.2012.
- Hoffmann et al. [2015] Hoffmann, J. H. O., Meyer, H. S., Schmitt, A. C., Straehle, J., Weitbrecht, T., Sakmann, B., & Helmstaedter, M. (2015). Synaptic conductance estimates of the connection between local inhibitor interneurons and pyramidal neurons in layer 2/3 of a cortical column. Cerebral Cortex, 25, 4415–4429. doi:10.1093/cercor/bhv039.
- Hong et al. [2016] Hong, J., Lambson, B., Dhuey, S., & Bokor, J. (2016). Experimental test of Landauer’s principle in single-bit operations on nanomagnetic memory bits. Science Advances, 2, e1501492. doi:10.1126/sciadv.1501492.
- Hönigsperger et al. [2015] Hönigsperger, C., Marosi, M., Murphy, R., & Storm, J. F. (2015). Dorsoventral differences in Kv7/M-current and its impact on resonance, temporal summation and excitability in rat hippocampal pyramidal cells. Journal of Physiology, 593, 1551–1580. doi:10.1113/jphysiol.2014.280826.
- Hu et al. [2014] Hu, H., Gan, J., & Jonas, P. (2014). Fast-spiking, parvalbumin+ GABAergic interneurons: from cellular design to microcircuit function. Science, 345, 1255263. doi:10.1126/science.1255263.
- Ishizuka et al. [1995] Ishizuka, N., Cowan, W. M., & Amaral, D. G. (1995). A quantitative analysis of the dendritic organization of pyramidal cells in the rat hippocampus. Journal of Comparative Neurology, 362, 17–45. doi:10.1002/cne.903620103.
- Jagadish & Petruccione [2018] Jagadish, V., & Petruccione, F. (2018). An invitation to quantum channels. Quanta, 7, 54–67. doi:10.12743/quanta.v7i1.77.
- Kapoor [2000] Kapoor, W. N. (2000). Syncope. New England Journal of Medicine, 343, 1856–1862. doi:10.1056/nejm200012213432507.
- Kariev & Green [2012] Kariev, A. M., & Green, M. E. (2012). Voltage gated ion channel function: gating, conduction, and the role of water and protons. International Journal of Molecular Sciences, 13, 1680–1709. doi:10.3390/ijms13021680.
- Kariev & Green [2018] Kariev, A. M., & Green, M. E. (2018). The role of proton transport in gating current in a voltage gated ion channel, as shown by quantum calculations. Sensors, 18, 3143. doi:10.3390/s18093143.
- Kariev & Green [2019] Kariev, A. M., & Green, M. E. (2019). Quantum calculation of proton and other charge transfer steps in voltage sensing in the Kv1.2 channel. Journal of Physical Chemistry B, 123, 7984–7998. doi:10.1021/acs.jpcb.9b05448.
- Kariev et al. [2007] Kariev, A. M., Znamenskiy, V. S., & Green, M. E. (2007). Quantum mechanical calculations of charge effects on gating the KcsA channel. Biochimica et Biophysica Acta (BBA) - Biomembranes, 1768, 1218–1229. doi:10.1016/j.bbamem.2007.01.021.
- Kelly et al. [2016] Kelly, C. J., Huang, M., Meltzer, H., & Martina, M. (2016). Reduced glutamatergic currents and dendritic branching of layer 5 pyramidal cells contribute to medial prefrontal cortex deactivation in a rat model of neuropathic pain. Frontiers in Cellular Neuroscience, 10, 133. doi:10.3389/fncel.2016.00133.
- Kole [2011] Kole, M. H. P. (2011). First node of Ranvier facilitates high-frequency burst encoding. Neuron, 71, 671–682. doi:10.1016/j.neuron.2011.06.024.
- Kole et al. [2007] Kole, M. H. P., Bräuer, A. U., & Stuart, G. J. (2007). Inherited cortical HCN1 channel loss amplifies dendritic calcium electrogenesis and burst firing in a rat absence epilepsy model. Journal of Physiology, 578, 507–525. doi:10.1113/jphysiol.2006.122028.
- Kole et al. [2004] Kole, M. H. P., Costoli, T., Koolhaas, J. M., & Fuchs, E. (2004). Bidirectional shift in the cornu ammonis 3 pyramidal dendritic organization following brief stress. Neuroscience, 125, 337–347. doi:10.1016/j.neuroscience.2004.02.014.
- Kolev et al. [2013] Kolev, S. K., Petkov, P. S., Rangelov, M., & Vayssilov, G. N. (2013). Ab initio molecular dynamics of Na+ and Mg2+ countercations at the backbone of RNA in water solution. ACS Chemical Biology, 8, 1576–1589. doi:10.1021/cb300463h.
- Kolev et al. [2018] Kolev, S. K., Petkov, P. S., Rangelov, M. A., Trifonov, D. V., Milenov, T. I., & Vayssilov, G. N. (2018). Interaction of Na+, K+, Mg2+ and Ca2+ counter cations with RNA. Metallomics, 10, 659–678. doi:10.1039/c8mt00043c.
- Kolev et al. [2011] Kolev, S. K., Petkov, P. S., Rangelov, M. A., & Vayssilov, G. N. (2011). Density functional study of hydrogen bond formation between methanol and organic molecules containing Cl, F, NH2, OH, and COOH functional groups. Journal of Physical Chemistry A, 115, 14054–14068. doi:10.1021/jp204313f.
- Krieger et al. [2007] Krieger, P., Kuner, T., & Sakmann, B. (2007). Synaptic connections between layer 5b pyramidal neurons in mouse somatosensory cortex are independent of apical dendrite bundling. Journal of Neuroscience, 27, 11473. doi:10.1523/jneurosci.1182-07.2007.
- Kubota et al. [2015] Kubota, Y., Kondo, S., Nomura, M., Hatada, S., Yamaguchi, N., Mohamed, A. A., Karube, F., Lübke, J., & Kawaguchi, Y. (2015). Functional effects of distinct innervation styles of pyramidal cells by fast spiking cortical interneurons. eLife, 4, e07919. doi:10.7554/eLife.07919.
- Landauer [1961] Landauer, R. (1961). Irreversibility and heat generation in the computing process. IBM Journal of Research and Development, 5, 183–191. doi:10.1147/rd.53.0183.
- Larkum et al. [2004] Larkum, M. E., Senn, W., & Lüscher, H.-R. (2004). Top-down dendritic input increases the gain of layer 5 pyramidal neurons. Cerebral Cortex, 14, 1059–1070. doi:10.1093/cercor/bhh065.
- Laughlin et al. [1998] Laughlin, S. B., de Ruyter van Steveninck, R. R., & Anderson, J. C. (1998). The metabolic cost of neural information. Nature Neuroscience, 1, 36–41. doi:10.1038/236.
- Lee et al. [2014] Lee, S.-H., Marchionni, I., Bezaire, M., Varga, C., Danielson, N., Lovett-Barron, M., Losonczy, A., & Soltesz, I. (2014). Parvalbumin-positive basket cells differentiate among hippocampal pyramidal cells. Neuron, 82, 1129–1144. doi:10.1016/j.neuron.2014.03.034.
- Leff & Rex [2002] Leff, H. S., & Rex, A. F. (2002). Maxwell’s Demon 2: Entropy, Classical and Quantum Information, Computing. Boca Raton: CRC Press. doi:10.1201/9781420033991.
- Lent et al. [2019] Lent, C. S., Orlov, A. O., Porod, W., & Snider, G. L. (2019). Energy Limits in Computation: A Review of Landauer’s Principle, Theory and Experiments. Cham, Switzerland: Springer. doi:10.1007/978-3-319-93458-7.
- Levitin [1998] Levitin, L. B. (1998). Energy cost of information transmission (along the path to understanding). Physica D: Nonlinear Phenomena, 120, 162–167. doi:10.1016/S0167-2789(98)00051-7.
- Lobaugh & Voth [1996] Lobaugh, J., & Voth, G. A. (1996). The quantum dynamics of an excess proton in water. Journal of Chemical Physics, 104, 2056–2069. doi:10.1063/1.470962.
- Magistretti & Allaman [2015] Magistretti, P. J., & Allaman, I. (2015). A cellular perspective on brain energy metabolism and functional imaging. Neuron, 86, 883–901. doi:10.1016/j.neuron.2015.03.035.
- Malik et al. [2016] Malik, R., Dougherty, K. A., Parikh, K., Byrne, C., & Johnston, D. (2016). Mapping the electrophysiological and morphological properties of CA1 pyramidal neurons along the longitudinal hippocampal axis. Hippocampus, 26, 341–361. doi:10.1002/hipo.22526.
- Marx & Feldmeyer [2012] Marx, M., & Feldmeyer, D. (2012). Morphology and physiology of excitatory neurons in layer 6b of the somatosensory rat barrel cortex. Cerebral Cortex, 23, 2803–2817. doi:10.1093/cercor/bhs254.
- Marx et al. [2015] Marx, M., Qi, G., Hanganu-Opatz, I. L., Kilb, W., Luhmann, H. J., & Feldmeyer, D. (2015). Neocortical layer 6b as a remnant of the subplate - a morphological comparison. Cerebral Cortex, 27, 1011–1026. doi:10.1093/cercor/bhv279.
- McKhann et al. [1997] McKhann, G. M., D’Ambrosio, R., & Janigro, D. (1997). Heterogeneity of astrocyte resting membrane potentials and intercellular coupling revealed by whole-cell and gramicidin-perforated patch recordings from cultured neocortical and hippocampal slice astrocytes. Journal of Neuroscience, 17, 6850–6863. doi:10.1523/jneurosci.17-18-06850.1997.
- Mergenthaler et al. [2013] Mergenthaler, P., Lindauer, U., Dienel, G. A., & Meisel, A. (2013). Sugar for the brain: the role of glucose in physiological and pathological brain function. Trends in Neurosciences, 36, 587–597. doi:10.1016/j.tins.2013.07.001.
- Mounier et al. [2015] Mounier, A., Georgiev, D., Nam, K. N., Fitz, N. F., Castranio, E. L., Wolfe, C. M., Cronican, A. A., Schug, J., Lefterov, I., & Koldamova, R. (2015). Bexarotene-activated retinoid X receptors regulate neuronal differentiation and dendritic complexity. Journal of Neuroscience, 35, 11862–11876. doi:10.1523/jneurosci.1001-15.2015.
- Niell & Stryker [2010] Niell, C. M., & Stryker, M. P. (2010). Modulation of visual responses by behavioral state in mouse visual cortex. Neuron, 65, 472–479. doi:10.1016/j.neuron.2010.01.033.
- Nieuwenhuys [1994] Nieuwenhuys, R. (1994). The neocortex. Anatomy and Embryology, 190, 307–337. doi:10.1007/bf00187291.
- Page [1981] Page, C. H. (1981). Higher functions of cerebral cortex. In P. D. Sturkie (Ed.), Basic Physiology (pp. 134–147). New York: Springer. doi:10.1007/978-1-4613-8081-8_9.
- Palmer et al. [2014] Palmer, L. M., Shai, A. S., Reeve, J. E., Anderson, H. L., Paulsen, O., & Larkum, M. E. (2014). NMDA spikes enhance action potential generation during sensory input. Nature Neuroscience, 17, 383. doi:10.1038/nn.3646.
- Pathak et al. [2016] Pathak, D., Guan, D., & Foehring, R. C. (2016). Roles of specific Kv channel types in repolarization of the action potential in genetically identified subclasses of pyramidal neurons in mouse neocortex. Journal of Neurophysiology, 115, 2317–2329. doi:10.1152/jn.01028.2015.
- Plenio & Vitelli [2001] Plenio, M. B., & Vitelli, V. (2001). The physics of forgetting: Landauer’s erasure principle and information theory. Contemporary Physics, 42, 25–60. doi:10.1080/00107510010018916.
- Polsky et al. [2004] Polsky, A., Mel, B. W., & Schiller, J. (2004). Computational subunits in thin dendrites of pyramidal cells. Nature Neuroscience, 7, 25–60. doi:10.1038/nn1253.
- Porod et al. [1984] Porod, W., Grondin, R. O., Ferry, D. K., & Porod, G. (1984). Dissipation in computation. Physical Review Letters, 52, 232–235. doi:10.1103/PhysRevLett.52.232.
- Rakic [2009] Rakic, P. (2009). Evolution of the neocortex: a perspective from developmental biology. Nature Reviews Neuroscience, 10, 724–735. doi:10.1038/nrn2719.
- Rockland & DeFelipe [2018] Rockland, K., & DeFelipe, J. (2018). Why Have Cortical Layers? What Is the Function of Layering? Do Neurons in Cortex Integrate Information Across Different Layers?. Lausanne: Frontiers Media. doi:10.3389/978-2-88945-660-4.
- Sagawa & Ueda [2008] Sagawa, T., & Ueda, M. (2008). Second law of thermodynamics with discrete quantum feedback control. Physical Review Letters, 100, 080403. doi:10.1103/PhysRevLett.100.080403.
- Sagawa & Ueda [2010] Sagawa, T., & Ueda, M. (2010). Generalized Jarzynski equality under nonequilibrium feedback control. Physical Review Letters, 104, 090602. doi:10.1103/PhysRevLett.104.090602.
- Santamaría-Pang et al. [2015] Santamaría-Pang, A., Hernandez-Herrera, P., Papadakis, M., Saggau, P., & Kakadiaris, I. A. (2015). Automatic morphological reconstruction of neurons from multiphoton and confocal microscopy images using 3D tubular models. Neuroinformatics, 13, 297–320. doi:10.1007/s12021-014-9253-2.
- Schwindt et al. [1997] Schwindt, P., O’Brien, J. A., & Crill, W. (1997). Quantitative analysis of firing properties of pyramidal neurons from layer 5 of rat sensorimotor cortex. Journal of Neurophysiology, 77, 2484–2498. doi:10.1152/jn.1997.77.5.2484.
- Scott [2005] Scott, A. C. (2005). Encyclopedia of Nonlinear Science. New York: Routledge. doi:10.4324/9780203647417.
- Sengupta et al. [2013] Sengupta, B., Stemmler, M. B., & Friston, K. J. (2013). Information and efficiency in the nervous system—a synthesis. PLOS Computational Biology, 9, e1003157. doi:10.1371/journal.pcbi.1003157.
- Sengupta [2013] Sengupta, P. (2013). The laboratory rat: relating its age with human’s. International Journal of Preventive Medicine, 4, 624–630.
- Shipp [2007] Shipp, S. (2007). Structure and function of the cerebral cortex. Current Biology, 17, R443–R449. doi:10.1016/j.cub.2007.03.044.
- Squire et al. [2015] Squire, L. R., Genzel, L., Wixted, J. T., & Morris, R. G. (2015). Memory consolidation. Cold Spring Harbor perspectives in biology, 7, a021766. doi:10.1101/cshperspect.a021766.
- Staiger et al. [2016] Staiger, J. F., Loucif, A. J. C., Schubert, D., & Möck, M. (2016). Morphological characteristics of electrophysiologically characterized layer Vb pyramidal cells in rat barrel cortex. PLOS ONE, 11, e0164004. doi:10.1371/journal.pone.0164004.
- Street [2016] Street, S. (2016). Neurobiology as information physics. Frontiers in Systems Neuroscience, 10. doi:10.3389/frsyns.2016.00090.
- Street [2020] Street, S. (2020). Upper limit on the thermodynamic information content of an action potential. Frontiers in Computational Neuroscience, 14. doi:10.3389/fncom.2020.00037.
- Tripathy et al. [2015] Tripathy, S. J., Burton, S. D., Geramita, M., Gerkin, R. C., & Urban, N. N. (2015). Brain-wide analysis of electrophysiological diversity yields novel categorization of mammalian neuron types. Journal of Neurophysiology, 113, 3474–3489. doi:10.1152/jn.00237.2015.
- Tyan et al. [2014] Tyan, L., Chamberland, S., Magnin, E., Camiré, O., Francavilla, R., David, L. S., Deisseroth, K., & Topolnik, L. (2014). Dendritic inhibition provided by interneuron-specific cells controls the firing rate and timing of the hippocampal feedback inhibitory circuitry. Journal of Neuroscience, 34, 4534. doi:10.1523/jneurosci.3813-13.2014.
- Ueta et al. [2013] Ueta, Y., Otsuka, T., Morishima, M., Ushimaru, M., & Kawaguchi, Y. (2013). Multiple layer 5 pyramidal cell subtypes relay cortical feedback from secondary to primary motor areas in rats. Cerebral Cortex, 24, 2362–2376. doi:10.1093/cercor/bht088.
- Vetter et al. [2001] Vetter, P., Roth, A., & Häusser, M. (2001). Propagation of action potentials in dendrites depends on dendritic morphology. Journal of Neurophysiology, 85, 926–937. doi:10.1152/jn.2001.85.2.926.
- Wible [2013] Wible, G. C. (2013). Hippocampal physiology, structure and function and the neuroscience of schizophrenia: a unified account of declarative memory deficits, working memory deficits and schizophrenic symptoms. Behavioral Sciences, 3, 298–315. doi:10.3390/bs3020298.
- Yang & Sun [2018] Yang, W., & Sun, Q.-Q. (2018). Circuit-specific and neuronal subcellular-wide E-I balance in cortical pyramidal cells. Scientific Reports, 8, 3971–3971. doi:10.1038/s41598-018-22314-9.
- Zhou et al. [2015] Zhou, P., Burton, S. D., Snyder, A. C., Smith, M. A., Urban, N. N., & Kass, R. E. (2015). Establishing a statistical link between network oscillations and neural synchrony. PLOS Computational Biology, 11, e1004549. doi:10.1371/journal.pcbi.1004549.
- Zhu [2000] Zhu, J. J. (2000). Maturation of layer 5 neocortical pyramidal neurons: amplifying salient layer 1 and layer 4 inputs by Ca2+ action potentials in adult rat tuft dendrites. Journal of Physiology, 526, 571–587. doi:10.1111/j.1469-7793.2000.00571.x.