Universal scaling behaviour near vortex-solid/glass to vortex-fluid transition in type-II superconductors in two- and three-dimensions
Abstract
In this article, we present evidence for the existence of vortex-solid/glass (VG) to vortex-fluid (VF) transition in a type-II superconductor (SC), NbN. We probed the VG to VF transition in both 2D and 3D films of NbN through studies of magnetoresistance and current-voltage characteristics. The dynamical exponents corresponding to this phase transition were extracted independently from the two sets of measurements. The - phase diagram for the 2D and 3D SC are found to be significantly different near the critical point. In the case of 3D SC, the exponent values obtained from the two independent measurements show excellent match. On the other hand, for the 2D SC, the exponents obtained from the two experiments were significantly different. We attribute this to the fact that the characteristic length scale diverges near the critical point in a 2D SC in a distinctly different way from its 3D counterpart form scaling behaviour.
A fundamental property of a superconductor – known as the Meissner effect – is its ability to expel a magnetic field from its interior Tinkham (2004). At high magnetic fields, this property is compromised in type-II superconductors and magnetic-flux threads in leading to the formation of topological defects known as vortices. Vortex dynamics lies at the heart of dissipationless transport in type-II superconductors. Vortices by nature interact with each other repulsively. At a given applied magnetic field, they arrange themselves in an ordered hexagonal lattice Abrikosov (1957); Blatter et al. (1994). A finite applied current can cause the entire vortex-solid to move due to Lorentz force and create an electric field along the direction of the applied current inducing dissipation in the system Bardeen and Stephen (1965); Abrikosov (1957). Such a system cannot support dissipationless transport even for infinitesimally small electrical currents.
In any real sample however, the ubiquitous disorders pin the vortices restoring the true zero-resistance state Fietz and Webb (1969); Higgins and Bhattacharya (1996). Pinning destroys the long range positional and orientational order of the vortex-solid – there is only local ordering in the lattice and the vortex state is called a ‘vortex-glass’ Fisher et al. (1991); Giamarchi and Le Doussal (1995, 1997); Chudnovsky (1989). Both magnetic and electric fields can tune the density of the vortex-solid/glass and affect the dissipation induced in the superconductor Fietz and Webb (1969); Bardeen and Stephen (1965). At large enough fields/temperatures the vortex-solid/glass can melt into a dissipative vortex-fluid state Pastoriza et al. (1994); Zeldov et al. (1995); Liang et al. (1996); Schilling et al. (1996, 1997); Sun et al. (2013).
Despite decades of research a clear picture of the solid-fluid transition in 2D superconductors is elusive Ravikumar et al. (2000); Lortz et al. (2006); Ling et al. (2001); Paltiel et al. (2000); Roy et al. (2000); Forgan et al. (2002); Bowell et al. (2010); Yazdani et al. (1993); Berghuis and Kes (1993); Yazdani et al. (1993); Berghuis et al. (1990). The effect of dimensionality and disorder on the order and nature of this transition is widely debated Blatter et al. (1994); De Col et al. (2007, 2006); Saiki and Ikeda (2011); Imry and Wortis (1979); Soibel et al. (2000); Özer et al. (2006). There have been predictions, and some recent experimental verification of interesting intermediate phases like hexatic phases Guillamón et al. (2009); Roy et al. (2019) and the absence of dissipationless state in a single sheet of superconductor because of vortex dynamics Tsen et al. (2016); Sharma et al. (2018); Benyamini et al. (2019); Tamir et al. (2019). Vortex-solid/glass is also of immense practical interest because it is an important parameter governing the applications of high-TC superconductors Koch et al. (1989); Blatter et al. (1994). High- materials are known to exhibit the Berezinskii-Kosterlitz-Thouless (BKT) transition which is a hallmark of 2D superconductors Ying and Kwok (1990). Presence of unavoidable topological defects like vortices and anti-vortices makes it complicated to analyze their zero-resistance state Kosterlitz and Thouless (2016); White et al. (1993); Berghuis and Kes (1993); Yazdani et al. (1993). This is partially the reason why clear experimental signatures of the existence of vortex-solid/glass remain elusive so far.
In this article we report a detailed, comparative study of magnetoresistance and dependence of current-voltage (-) characteristics of high-quality NbN films of two thicknesses – 3 nm and 68 nm. NbN is a well known, conventional type-II superconductor with excellent control over induced disorder and thickness Chockalingam et al. (2009); Mondal et al. (2011a). Both 2D and 3D homogeneous NbN films of high crystalline quality can be grown which exhibit excellent superconducting properties Mondal et al. (2011b). It lacks the plethora of phases like high- materials, making it easier to interpret the experiential observations. The coherence length of NbN, as obtained from upper critical field measurements, is 6 nm Koushik et al. (2013). Both transport, and super-fluid density studies have established that NbN films of thickness 3 nm undergo BKT transition, making this material an ideal candidate for a comparative study of vortex dynamics in 2D and 3D superconductors Mondal et al. (2011b); Koushik et al. (2013).
We find that the superconductor to normal transition, in presence of a perpendicular magnetic field, is characteristically different for the 3 nm (2D) and 68 nm (3D) superconductors at close to . For , the – line becomes similar in nature for the two systems. It is in this regime that we looked for the possible existence of vortex-solid/glass to fluid transition in a 2D superconducting film and compared its characteristics to the well-documented corresponding transition of a 3D superconductor.
The films were grown by reactive dc magnetron sputtering of a Nb target in Ar-N2 gas mixture Chockalingam et al. (2008); Chand et al. (2009) and were characterized by measurements of temperature dependence of resistance, dc - characteristics, magnetoresistance and super-fluid density. Figure 1(a) shows the resistance versus temperature data for the 68 nm film. For this 3D film, the superconducting transition temperature (defined throughout in this article as the temperature where drops to 1% of its normal state value) is 12.44 K, very close to that of bulk single crystal NbN. In Fig. 1(c) is plotted the measured variation of super-fluid density (which is proportional to the inverse square of the penetration depth, ) with temperature. The data follows the classic BCS pattern as is increased from deep inside superconducting regime and goes to zero at as expected. The corresponding data for the 3 nm film are shown in Fig. 1(b) and Fig. 1(d). The mean field transition temperature (T where R drops to 1% of its normal state value) is 9.2 K and the , identified by the universal jump in (or equivalently, the super-fluid density). A plot of versus is shown in Fig. 1(d) Nam et al. (2016). Note that due to the differing requirements of sample geometry and sizes for the transport and measurements, these were measured on two different NbN films, both of thickness 3 nm and hence the slightly different and . The identification of on the measured device is obtained by power law behaviour of current-voltage (I-V) characteristics in superconducting state Tsen et al. (2016); Minnhagen (1987); Yeh and Tsuei (1989); Ying and Kwok (1990); Daptary et al. (2016); Reyren et al. (2007).
Figure 1(e) and (f) show the magnetoresistance data for 3D and 2D superconducting films respectively at different for applied perpendicular to the plane of the films. We observe a striking difference in the way dissipation appears in these two cases. In 3D film, a finite amount of is necessary to destroy superconductivity at all temperatures. In contrast, for 2D superconductor near , an infinitesimal magnitude of is enough to destroy superconductivity. We find that at one needs T to induce dissipation in the 3D case as opposed to only 0.22 T in the 2D case - an order of magnitude lesser than the 3D case. This significant difference in magnetoresistance can be appreciated better from the surface plots shown in Fig. 2(a) and Fig. 2(b) for 3D and 2D respectively. The color bar represents the resistance in logarithmic scale normalized by its normal state value. One can clearly see that there is a distinct difference in the way superconductivity is destroyed near (marked in Fig. 2 by a black dotted circle) in presence of a perpendicular magnetic field. We have measured three different NbN films of thickness 3 nm – the data in all of them were qualitatively similar. Here we present data of one representative sample where we have studied the phase diagram extensively.
To look into these differences quantitatively, we plot in fig. 3(a) the critical magnetic field () versus temperature for both 3D (red solid line) and 2D (black solid line) films. is defined at the field at which reaches 1% of its normal state resistance at each corresponding temperature. Near , the two curves have very different characteristics becoming quite similar at lower temperatures.
A possible reason for this very striking difference between the response of 2D and 3D to close to can be the presence of a vortex-solid/glass at low temperatures which undergoes a phase transition to a vortex-fluid in a manner different in the 3D than in the 2D superconductor in the presence of the field. Near a critical point of a phase transition, physical quantities can be expressed in terms of correlation length, and time, where is the dynamical exponent. The critical point is temperature and magnetic field dependent. is the field at which this vortex-solid/glass to vortex-fluid transition occurs at a given . Since the critical line exists in the plane, the correlation length can diverge as this line is approached by changing the magnetic field at constant temperature. We assume that diverges with an exponent , near the vortex-solid/glass to vortex-fluid transition. While, the exponent might in general be expected to equal the correlation length exponent obtained at constant field by changing the temperature, we do not explicitly require a consideration of this equality since in our measurements, we always approach the transition by changing the field.
For vortex-solid/glass to vortex-fluid transition, the dc - characteristic for a d-dimensional superconductor should follow the following scaling relation Fisher et al. (1991); Koch et al. (1989):
| (1) |
where is the current density and is the electric field. In the scaling function , is scaled by the characteristic current density which vanishes as from below. Under the condition from above and , becomes a constant giving a resistivity which vanishes as:
| (2) |
Eqn. 1 indicates that for , . This implies that at , the - characteristics should follow the power-law
| (3) |
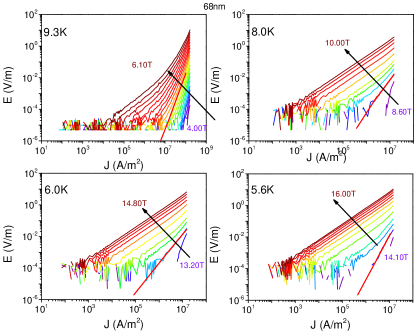
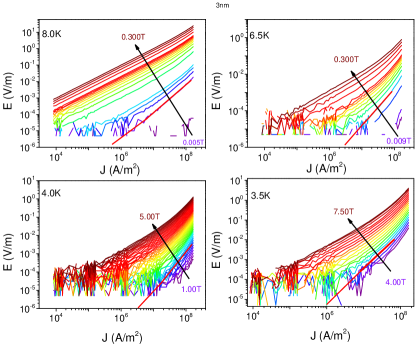
We measured the - characteristics of both the 2D and 3D NbN films over a range of values of and . From Eqn. 3 we expect that, at a given , the - curves for large enough currents should be a power law for . At low currents, the behavior should be ohmic for and exponentially vanishing dissipation for .
Figure 3 (b) and (c) are the plots of - characteristics at a few representative values of for the 3D (measured at 8.7 K) and for 2D (measured at 5.5 K) superconducting films respectively. Similar data have been presented in the supplementary material for several different temperatures for both the 3D and 2D film. At each temperature, we find that the - curves show a power-law behavior for a particular value of , which we identify to be . For , the - curve have a positive curvature and at low there is an ohmic regime described by linear resistivity . For , the - curves have a negative curvature with going to zero rapidly as is decreased. At , one can fit the - curves to a power law and extract the dynamical exponent , as given by Eqn. 3. The power law fits are shown in red solid line in fig. 3(b) and 3(c). The values of obtained at different are listed in table 1. Note that all these fits were performed in the very low current density limit ie. (where is the flux-flow current density) or equivalently, for Kim et al. (1965). In Fig. 3(a) the lines are plotted versus for both the 2D and 3D superconductors. We observe for 3D, the line and line do not differ much whereas there is significant distinction for the 2D superconductor.
The critical current density, was obtained from the - plots. For and , the - characteristics are linear. For it follows an asymptotic behaviour. can be thus be determined by noting the value beyond which the - characteristics deviate significantly from linearity for H>. We used the criterion to define . The value 2 is not special, other choices of slope of the log() versus log() plots between 1.5 to 3, while changing the value of , leave the scaling behavior unchanged. has a power law dependence on ():
| (4) |
From the power-law fits to plots of versus we obtained the value of exponent . Figures 4(a) and 4(b) show the plots of versus obtained at representative temperatures for the 3D and 2D superconductors respectively. The values of extracted from these plots are tabulated in table 1.
| 3D | 2D | ||||||||||||||||
|---|---|---|---|---|---|---|---|---|---|---|---|---|---|---|---|---|---|
| T | z |
|
|
T | z |
|
|
||||||||||
| 5.6 | 0.78 | 4.44 | 2.60 | 2.68 | 1.3 | 0.34 | 1.24 | 0.42 | 3.91 | ||||||||
| 7.0 | 0.63 | 5.26 | 2.68 | 2.68 | 3.5 | 0.59 | 0.74 | 0.44 | 3.33 | ||||||||
| 8.7 | 0.95 | 5.8 | 4.56 | 4.22 | 5.5 | 0.57 | 1.10 | 0.63 | 3.37 | ||||||||
| 9.6 | 1.18 | 4.73 | 4.38 | 4.00 | 6.5 | 0.38 | 1.10 | 0.42 | 2.04 | ||||||||
| 10.0 | 0.99 | 5.82 | 4.77 | 4.15 | 8.0 | 0.68 | 0.68 | 0.46 | 1.45 | ||||||||
To verify the consistency of the scaling relations and exponents obtained near the transition from the - plots, we looked into the plots of magnetic field dependence of linear resistivity, versus () using Eqn. 2. The plot is shown in Fig. 4(c) and (d) for 3D and 2D respectively and the exponents obtained are listed in table 1.
We find an excellent match in the values of the quantity obtained by the two independent methods – from - plots (using Eqn. 3 and Eqn. 4) and from magnetoresistance plots (using Eqn. 2) for the 3D superconductor. But for the 2D superconductor, the values obtained from - and magnetoresistance measurements differ by almost an order of magnitude. This mismatch in consistency of exponents for 2D superconductor can primarily be due to two reasons – firstly this can be understood to indicate the absence of vortex-solid/glass in 2D superconductors. Secondly, it is possible that the assumptions regarding a well defined dependence of the coherence length on () near the critical point and an exact scaling function at critical point does not hold in the case of 2D.
To clarify this point, the - curves obtained near the transition from vortex-solid/glass to a vortex-fluid were fitted to a scaling form derived from Eqn. 1 which turned out to be
| (5) |
for the 3D superconductor, and
| (6) |
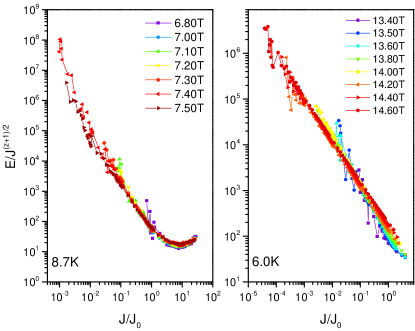
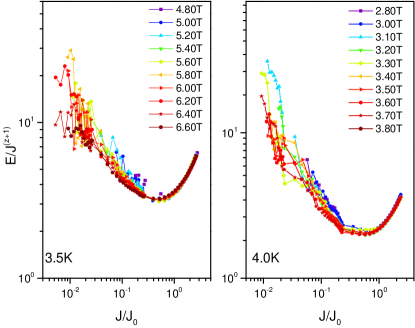
for the 2D superconductor. The details of the derivation are given in Supplementary materials. The scaling relation indicates that if one plots ( = 0.5 for 3D and 1 for 2D)as a function of for different magnetic fields at a fixed temperatures, the plots should collapse on top of each other. Fig. 5(a) and (b) are the scaled plots of versus for 3D superconductor following Eqn. 5 at two different . The corresponding plots for the 2D superconductor are presented in Fig. 5(c) and (d). In all cases, we find the scaling relation to hold extremely well as all the plots at a given fall on top of each other. Similar analysis for T=8.7K and 6.0K for 3D and T=4K and 3.5K for 2D are presented in supplementary material. This excellent scaling agreement for the 2D case (as good as for the 3D superconductor) shows that Eqn. 1 holds for 2D superconductors. This suggests the possibility of the existence of vortex-solid/glass in 2D superconductors. This leaves us with the second possibility discussed earlier to explain the inconsistencies in the critical exponents extracted from - and magnetoresistance measurements – the assumed presence of a length scale relation of () close to critical point is probably not valid for 2D superconductors.
To conclude, in this article we have looked for signatures of vortex dynamics in 3D and 2D superconductors in NbN thin films. We have established a characteristic difference in response of the 2D to 3D superconductors to a perpendicular magnetic field close to . In 3D superconductor we find signatures of vortex-solid/glass to fluid transition. We extracted the corresponding dynamical exponents from two independent measurements - magnetoresistance and current-voltage characteristics and found excellent match between the two sets. On the other hand, for the 2D superconductor, the exponents obtained from these two disparate sets of experiments are significantly different. We established that this anomaly is due to the fact that the characteristic length scale diverges near the critical point in 2D superconductors in a manner different from that in the 3D superconductors. Our measurements and analysis indicates the existence of a vortex-solid/glass to fluid transition in 2D superconductors by validating the scaling form of fundamental - relation near the critical point both in the case 2D as well as for 3D superconductors (where such transitions are well documented).
AB acknowledges funding from Nanomission and FIST program, Department of Science & Technology (DST), Government of India. HKK acknowledges CSIR, Govt of India and IISc, Bangalore for financial help.
References
- Tinkham (2004) M. Tinkham, Introduction to superconductivity (Courier Corporation, 2004).
- Abrikosov (1957) A. Abrikosov, Journal of Physics and Chemistry of Solids 2, 199 (1957).
- Blatter et al. (1994) G. Blatter, M. V. Feigel’man, V. B. Geshkenbein, A. I. Larkin, and V. M. Vinokur, Reviews of Modern Physics 66, 1125 (1994).
- Bardeen and Stephen (1965) J. Bardeen and M. J. Stephen, Phys. Rev. 140, A1197 (1965).
- Fietz and Webb (1969) W. A. Fietz and W. W. Webb, Phys. Rev. 178, 657 (1969).
- Higgins and Bhattacharya (1996) M. J. Higgins and S. Bhattacharya, Physica C: Superconductivity and its applications 257, 232 (1996).
- Fisher et al. (1991) D. S. Fisher, M. P. Fisher, and D. A. Huse, Physical Review B 43, 130 (1991).
- Giamarchi and Le Doussal (1995) T. Giamarchi and P. Le Doussal, Phys. Rev. B 52, 1242 (1995).
- Giamarchi and Le Doussal (1997) T. Giamarchi and P. Le Doussal, Phys. Rev. B 55, 6577 (1997).
- Chudnovsky (1989) E. M. Chudnovsky, Phys. Rev. B 40, 11355 (1989).
- Pastoriza et al. (1994) H. Pastoriza, M. F. Goffman, A. Arribére, and F. de la Cruz, Phys. Rev. Lett. 72, 2951 (1994).
- Zeldov et al. (1995) E. Zeldov, D. Majer, M. Konczykowski, V. B. Geshkenbein, V. M. Vinokur, and H. Shtrikman, Nature 375, 373 (1995).
- Liang et al. (1996) R. Liang, D. A. Bonn, and W. N. Hardy, Phys. Rev. Lett. 76, 835 (1996).
- Schilling et al. (1996) A. Schilling, R. Fisher, N. Phillips, U. Welp, D. Dasgupta, W. Kwok, and G. Crabtree, Nature 382, 791 (1996).
- Schilling et al. (1997) A. Schilling, R. A. Fisher, N. E. Phillips, U. Welp, W. K. Kwok, and G. W. Crabtree, Phys. Rev. Lett. 78, 4833 (1997).
- Sun et al. (2013) Y. Sun, J. Wang, W. Zhao, M. Tian, M. Singh, and M. H. Chan, Scientific reports 3, 2307 (2013).
- Ravikumar et al. (2000) G. Ravikumar, V. C. Sahni, A. K. Grover, S. Ramakrishnan, P. L. Gammel, D. J. Bishop, E. Bucher, M. J. Higgins, and S. Bhattacharya, Phys. Rev. B 63, 024505 (2000).
- Lortz et al. (2006) R. Lortz, F. Lin, N. Musolino, Y. Wang, A. Junod, B. Rosenstein, and N. Toyota, Phys. Rev. B 74, 104502 (2006).
- Ling et al. (2001) X. S. Ling, S. R. Park, B. A. McClain, S. M. Choi, D. C. Dender, and J. W. Lynn, Phys. Rev. Lett. 86, 712 (2001).
- Paltiel et al. (2000) Y. Paltiel, E. Zeldov, Y. Myasoedov, M. L. Rappaport, G. Jung, S. Bhattacharya, M. J. Higgins, Z. L. Xiao, E. Y. Andrei, P. L. Gammel, and D. J. Bishop, Phys. Rev. Lett. 85, 3712 (2000).
- Roy et al. (2000) S. B. Roy, P. Chaddah, and S. Chaudhary, Phys. Rev. B 62, 9191 (2000).
- Forgan et al. (2002) E. M. Forgan, S. J. Levett, P. G. Kealey, R. Cubitt, C. D. Dewhurst, and D. Fort, Phys. Rev. Lett. 88, 167003 (2002).
- Bowell et al. (2010) C. J. Bowell, R. J. Lycett, M. Laver, C. D. Dewhurst, R. Cubitt, and E. M. Forgan, Phys. Rev. B 82, 144508 (2010).
- Yazdani et al. (1993) A. Yazdani, W. R. White, M. R. Hahn, M. Gabay, M. R. Beasley, and A. Kapitulnik, Phys. Rev. Lett. 70, 505 (1993).
- Berghuis and Kes (1993) P. Berghuis and P. H. Kes, Phys. Rev. B 47, 262 (1993).
- Berghuis et al. (1990) P. Berghuis, A. L. F. van der Slot, and P. H. Kes, Phys. Rev. Lett. 65, 2583 (1990).
- De Col et al. (2007) A. De Col, G. I. Menon, V. B. Geshkenbein, and G. Blatter, Phys. Rev. B 75, 184532 (2007).
- De Col et al. (2006) A. De Col, G. I. Menon, V. B. Geshkenbein, and G. Blatter, Phys. Rev. Lett. 96, 177001 (2006).
- Saiki and Ikeda (2011) T. Saiki and R. Ikeda, Phys. Rev. B 83, 174501 (2011).
- Imry and Wortis (1979) Y. Imry and M. Wortis, Phys. Rev. B 19, 3580 (1979).
- Soibel et al. (2000) A. Soibel, E. Zeldov, M. Rappaport, Y. Myasoedov, T. Tamegai, S. Ooi, M. Konczykowski, and V. B. Geshkenbein, Nature 406, 282 (2000).
- Özer et al. (2006) M. M. Özer, J. R. Thompson, and H. H. Weitering, Nature Physics 2, 173 (2006).
- Guillamón et al. (2009) I. Guillamón, H. Suderow, A. Fernández-Pacheco, J. Sesé, R. Córdoba, J. De Teresa, M. Ibarra, and S. Vieira, Nature Physics 5, 651 (2009).
- Roy et al. (2019) I. Roy, S. Dutta, A. N. Roy Choudhury, S. Basistha, I. Maccari, S. Mandal, J. Jesudasan, V. Bagwe, C. Castellani, L. Benfatto, and P. Raychaudhuri, Phys. Rev. Lett. 122, 047001 (2019).
- Tsen et al. (2016) A. Tsen, B. Hunt, Y. Kim, Z. Yuan, S. Jia, R. Cava, J. Hone, P. Kim, C. Dean, and A. Pasupathy, Nature Physics 12, 208 (2016).
- Sharma et al. (2018) C. H. Sharma, A. P. Surendran, S. S. Varma, and M. Thalakulam, Communications Physics 1, 90 (2018).
- Benyamini et al. (2019) A. Benyamini, E. Telford, D. Kennes, D. Wang, A. Williams, K. Watanabe, T. Taniguchi, J. Hone, C. Dean, A. Millis, et al., arXiv preprint, arXiv:1901.09310 (2019).
- Tamir et al. (2019) I. Tamir, A. Benyamini, E. Telford, F. Gorniaczyk, A. Doron, T. Levinson, D. Wang, F. Gay, B. Sacépé, J. Hone, et al., Science advances 5, eaau3826 (2019).
- Koch et al. (1989) R. H. Koch, V. Foglietti, W. J. Gallagher, G. Koren, A. Gupta, and M. P. A. Fisher, Phys. Rev. Lett. 63, 1511 (1989).
- Ying and Kwok (1990) Q. Y. Ying and H. S. Kwok, Phys. Rev. B 42, 2242 (1990).
- Kosterlitz and Thouless (2016) J. M. Kosterlitz and D. J. Thouless, International Journal of Modern Physics B 30, 1630018 (2016).
- White et al. (1993) W. R. White, A. Kapitulnik, and M. R. Beasley, Phys. Rev. Lett. 70, 670 (1993).
- Chockalingam et al. (2009) S. P. Chockalingam, M. Chand, A. Kamlapure, J. Jesudasan, A. Mishra, V. Tripathi, and P. Raychaudhuri, Phys. Rev. B 79, 094509 (2009).
- Mondal et al. (2011a) M. Mondal, A. Kamlapure, M. Chand, G. Saraswat, S. Kumar, J. Jesudasan, L. Benfatto, V. Tripathi, and P. Raychaudhuri, Phys. Rev. Lett. 106, 047001 (2011a).
- Mondal et al. (2011b) M. Mondal, S. Kumar, M. Chand, A. Kamlapure, G. Saraswat, G. Seibold, L. Benfatto, and P. Raychaudhuri, Phys. Rev. Lett. 107, 217003 (2011b).
- Koushik et al. (2013) R. Koushik, S. Kumar, K. R. Amin, M. Mondal, J. Jesudasan, A. Bid, P. Raychaudhuri, and A. Ghosh, Phys. Rev. Lett. 111, 197001 (2013).
- Chockalingam et al. (2008) S. P. Chockalingam, M. Chand, J. Jesudasan, V. Tripathi, and P. Raychaudhuri, Phys. Rev. B 77, 214503 (2008).
- Chand et al. (2009) M. Chand, A. Mishra, Y. M. Xiong, A. Kamlapure, S. P. Chockalingam, J. Jesudasan, V. Bagwe, M. Mondal, P. W. Adams, V. Tripathi, and P. Raychaudhuri, Phys. Rev. B 80, 134514 (2009).
- Nam et al. (2016) H. Nam, H. Chen, T. Liu, J. Kim, C. Zhang, J. Yong, T. R. Lemberger, P. A. Kratz, J. R. Kirtley, K. Moler, P. W. Adams, A. H. MacDonald, and C.-K. Shih, Proceedings of the National Academy of Sciences 113, 10513 (2016), https://www.pnas.org/content/113/38/10513.full.pdf .
- Minnhagen (1987) P. Minnhagen, Rev. Mod. Phys. 59, 1001 (1987).
- Yeh and Tsuei (1989) N.-C. Yeh and C. C. Tsuei, Phys. Rev. B 39, 9708 (1989).
- Daptary et al. (2016) G. N. Daptary, S. Kumar, P. Kumar, A. Dogra, N. Mohanta, A. Taraphder, and A. Bid, Phys. Rev. B 94, 085104 (2016).
- Reyren et al. (2007) N. Reyren, S. Thiel, A. D. Caviglia, L. F. Kourkoutis, G. Hammerl, C. Richter, C. W. Schneider, T. Kopp, A.-S. Rüetschi, D. Jaccard, M. Gabay, D. A. Muller, J.-M. Triscone, and J. Mannhart, Science 317, 1196 (2007), https://science.sciencemag.org/content/317/5842/1196.full.pdf .
- Kim et al. (1965) Y. B. Kim, C. F. Hempstead, and A. R. Strnad, Phys. Rev. 139, A1163 (1965).
Supplementary Information
Hemanta Kumar Kundu John Jesudasan Pratap Raychaudhuri Subroto Mukerjee Aveek Bid
I - curves for 3D and 2D superconductor:
Figure S1 (a), (b), (c) and (d) are the - plots for = 9.3 K, 8.0 K, 6.0 K and 5.6 K respectively for 3D (68nm) NbN superconductor. For 2D (3nm) NbN superconductor, the - curves for T = 8.0 K, 6.5 K, 4.0 K and 3.5 K are shown in fig. S2(a), (b), (c), (d) respectively. At every temperature, for both 2D and 3D superconductors, at a specific value of applied magnetic field, which we identify to be , we observe a power law dependence of on , as explained in main text. The power behaviour was shown to follow the relation:
The red thick line shows the fits. From the fits, the values of the dynamical exponent at different were extracted and have been presented in the main text.
II Scaling behavior of curves:
The fundamental E-J characteristics for vortex glass transition in d-dimensional superconductor is given by,
| (7) |
As ,
| (8) |
For d=3,
of dc curves (following Eqn. 10) obtained at T = 3.5 K and 4.0 K for the 2D superconductor.
This yields the following scaling relation for 3D superconductor near the vortex solid/glass to vortex fluid melting transition:
| (9) |
In Eqn.8 if we use =2, we obtain the corresponding scaling form for the 2D superconductor in the vicinity of the vortex solid/glass to vortex fluid melting transition:
| (10) |
Plots of the scaling relation Eqn. 9 for the 3D superconductor at two different temperatures = 6.0 K and 8.7 K have been shown in fig. S3(a) and (b) respectively. Similar scaling plots of Eqn. 10 for the 2D superconductor at = 3.5 K and 4.0 K are shown in Fig. 9(c) and (d) respectively. At all temperatures, for both the 2D and 3D superconductors, the - data obtained for different values of magnetic field close to scale extremely well.