The Swift Bulge Survey: Motivation, Strategy, and First X-ray Results
Abstract
Very faint X-ray transients (VFXTs) are X-ray transients with peak X-ray luminosities () of L erg s-1, which are not well-understood. We carried out a survey of 16 square degrees of the Galactic Bulge with the Swift Observatory, using short (60 s) exposures, and returning every 2 weeks for 19 epochs in 2017-18 (with a gap from November 2017 to February 2018, when the Bulge was in sun-constraint). Our main goal was to detect and study VFXT behaviour in the Galactic Bulge across various classes of X-ray sources. In this work, we explain the observing strategy of the survey, compare our results with the expected number of source detections per class, and discuss the constraints from our survey on the Galactic VFXT population. We detected 91 X-ray sources, 25 of which have clearly varied by a factor of at least 10. 45 of these X-ray sources have known counterparts: 17 chromospherically active stars, 12 X-ray binaries, 5 cataclysmic variables (and 4 candidates), 3 symbiotic systems, 2 radio pulsars, 1 AGN, and a young star cluster. The other 46 are of previously undetermined nature. We utilize X-ray hardness ratios, searches for optical/infrared counterparts in published catalogs, and flux ratios from quiescence to outburst to constrain the nature of the unknown sources. Of these 46, 7 are newly discovered hard transients, which are likely VFXT X-ray binaries. Furthermore, we find strong new evidence for a symbiotic nature of 4 sources in our full sample, and new evidence for accretion power in 6 X-ray sources with optical counterparts. Our findings indicate that a large subset of VXFTs is likely made up of symbiotic systems.
keywords:
accretion, accretion discs – X-rays: binaries – surveys – stars: neutron, black holes1 Introduction
Very Faint X-ray Transients (VFXTs) are phenomenologically defined as X-ray transients with peak X-ray luminosities in the range erg s-1(Wijnands et al., 2006).111Unless otherwise specified, and are given in 0.3–10 keV throughout this work. VFXTs have been relatively difficult to study, as they generally fall below the typical sensitivity of all-sky (or Galactic Bulge) monitors (see surveys of Swank & Markwardt, 2001; in’t Zand et al., 2004; Kuulkers et al., 2007; Krimm et al., 2013; Negoro et al., 2016). However, Chandra, Swift, and XMM-Newton surveys of the Galactic Centre have revealed that the majority of transient X-ray outbursts do not reach erg s-1, and that VFXT outbursts may outnumber brighter X-ray transients (Muno et al., 2005a; Degenaar & Wijnands, 2009; Degenaar et al., 2012). Many of these transients have not shown any bright outbursts, though some objects show both very faint and brighter outbursts.
Various studies of VFXTs over the past decade have shown that these systems are an inhomogeneous population. A number of VFXTs have been identified as low-mass X-ray binaries (LMXBs; where compact objects accrete from donor stars of mass 2 ) containing neutron stars (e.g., Cornelisse et al., 2002; Degenaar & Wijnands, 2012). These include some accreting millisecond X-ray pulsars (AMXPs, where the neutron star shows X-ray pulsations with millisecond periods), such as NGC 6440 X-2 (Heinke et al., 2010), IGR J17062–6143 (Strohmayer & Keek, 2017), and IGR J173793747 (Sanna et al., 2018). Some VFXTs have been identified as LMXBs likely to contain black holes (e.g. CXOGC J174540.0290031, Bower et al. 2005; Muno et al. 2005b; Swift J1357.20933, Corral-Santana et al. 2013; Armas Padilla et al. 2013; XTE J1728295, Sidoli et al. 2011). Some VFXTs show slow X-ray pulsations that suggest a high-mass X-ray binary (HMXB) nature (e.g., Torii et al., 1998). Low-luminosity HMXB behaviour has not been well-studied (e.g., Wijnands & Degenaar, 2016; Rouco Escorial et al., 2017).
Other objects, such as cataclysmic variables (CVs), magnetars, and symbiotic systems (in which a compact object accretes from a red giant wind) can also produce VFXT behaviour. Novae may produce similar hard X-ray luminosities for a few weeks (Mukai et al., 2008), and the brightest intermediate polars (IPs) can reach this range (e.g. Brunschweiger et al., 2009; Stacey et al., 2011; Bernardini et al., 2012; Suleimanov et al., 2019). Magnetars can also reach this X-ray luminosity range (e.g., Coti Zelati et al., 2018), as can colliding-wind binaries (Güdel & Nazé, 2009), and background AGN will certainly be present. In addition, a variety of foreground X-ray sources have been detected at similar fluxes in Galactic Centre surveys, thought to be dominated by nearby chromospherically active stars (e.g. Wijnands et al., 2006), but including other source populations such as cataclysmic variables. Since distances are not easy to determine, we often can not be certain whether detected transients fall into the VFXT luminosity range.
Some VFXTs have been detected in repeated outbursts, allowing assessment of their average mass-transfer rates. These inferred rates are quite low compared to normal (brighter) LMXBs, suggesting a later (or unusual) stage of LMXB binary evolution (e.g., Degenaar & Wijnands, 2009; Heinke et al., 2015). VFXT behaviour seems to be associated with parts of X-ray binary evolution that are not generally studied with brighter objects. A likely candidate is the slow final evolution of 0.01 degenerate companions (King & Wijnands, 2006; in’t Zand et al., 2005; Heinke et al., 2015). LMXBs accreting from a weak donor wind before their Roche-lobe overflow phase, or while in the period gap, may also produce low-luminosity VFXT outbursts (Pfahl et al., 2002; Maccarone & Patruno, 2013). Black hole LMXBs with short orbital periods may also be extremely faint, if their radiative efficiency decreases with decreasing luminosity as predicted, and there should be large numbers of these short orbital period systems (Knevitt et al., 2014; Maccarone et al., 2015; Arur & Maccarone, 2018).
The evolution and final fate of LMXBs are difficult to model due to the wide range of physics that must be included. Major areas of uncertainty include the common envelope phase (e.g., Ivanova et al., 2013), effects of angular momentum losses (e.g., Knigge et al., 2011), and the fraction of transferred mass accreted onto the compact object (e.g., Ponti et al., 2012). Binary evolution calculations (e.g., Patterson & Raymond, 1985) predict that the majority of LMXBs should have short orbital periods and low mass-transfer rates, and thus may have infrequent, short, and low-luminosity outbursts (King, 2000). However, if angular momentum losses are much larger than in the standard evolution scenario (e.g., due to strong winds from donors; di Salvo et al., 2008; Marino et al., 2019), the lifetimes of LMXBs may be much shorter, and there may be many fewer LMXBs than predicted. Understanding the late stages of LMXB evolution (likely at low mass transfer rates, showing very faint outbursts) is critical for understanding how millisecond radio pulsars are born (e.g. Tauris, 2012; Papitto et al., 2014).
We have begun a novel survey - the Swift Galactic Bulge Survey (hereafter SBS), based on fast tiling procedures (see § 2) by the Neil Gehrels Swift Observatory (hereafter Swift; Gehrels et al., 2004), that uses biweekly shallow (60-second) mosaic imaging by the X-ray telescope (XRT; Burrows et al., 2005) and the Ultra-Violet/Optical Telescope (UVOT; Roming et al., 2005) to identify VFXTs across 16 square degrees of the Galactic Bulge. Over the first year of this survey, we have detected multiple very faint outbursts and performed multi-wavelength follow-up observations to better understand the population and nature of VFXTs. This paper is one of three papers summarizing our findings from the first year of SBS (see also Shaw et al. 2020 and Rivera Sandoval et al., in prep., which detail results from follow-up observations with optical/near-IR facilities, and results from the Swift Ultraviolet/Optical Telescope (UVOT) data, respectively). In this paper, we report the plan of the survey and the initial X-ray results. We have also carried out a second year of SBS observations in 2019 and early 2020, which will be reported in detail elsewhere (some initial results are given in Heinke et al. 2019a, b; Maccarone et al. 2019; Heinke et al. 2020). We discuss the survey strategy and configuration in § 2, and the data reduction and analysis pipeline in § 3. Finally we present the X-ray results and their implications in § 4.
2 The Swift Bulge Survey: strategy and configuration
To understand accretion at lower mass-transfer rates (and to understand the fraction of an X-ray binary’s life spent in such states), we need surveys capable of identifying these relatively lower-luminosity outbursts. Swift’s ability to tile large areas with very short XRT and UVOT observations meets this need. Swift’s rapid slewing and quick operation permits exposures (with both XRT and UVOT) as short as 60 seconds, with 28 seconds between exposures for slewing and settling. Evans et al. (2015) pioneered these new methods for the follow-up of gravitational wave and high-energy neutrino detections, and they have been used to detect moderately faint X-ray transients in a survey of the Small Magellanic Cloud (Kennea et al., 2018).
The SBS consists of biweekly epochs, with an average of 120 pointings per epoch (up to 163) and 60 or 120 s per pointing. This has enabled regular repeated X-ray surveys of 16 square degrees around the Galactic Centre with a few arcsecond angular resolution, and sensitivity reaching to erg s-1 at kpc for cm-2. Since the Galactic Bulge is very rich in LMXBs, we estimate the distance of most LMXBs here to be 8 kpc.
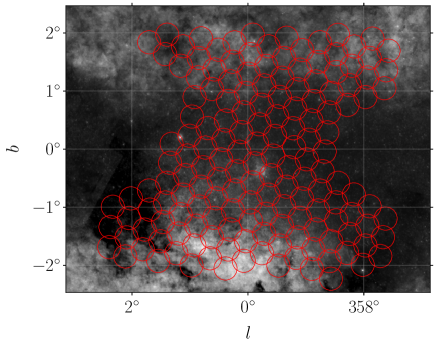
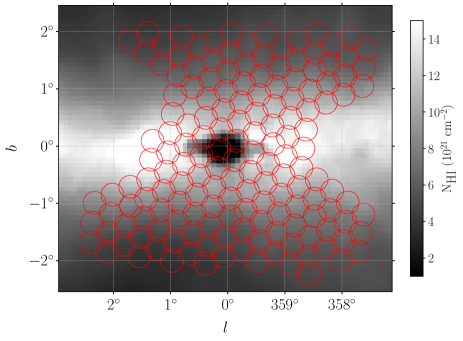
The size and shape of the survey area was selected as a compromise between the concentration of LMXBs towards the Galactic Centre, and the increased extinction towards the Galactic plane (Fig. 1). For example, at 1–2 degrees off the Galactic plane, the hydrogen column density () falls from cm-2 to cm-2, allowing detection of activity down to erg s-1. The aim of the SBS is to ensure a large number of VFXT detections (thus enclosing regions around the Galactic Centre), while also covering a larger region close to the Galactic plane with relatively low extinction and good multiwavelength coverage (e.g., the Chandra Galactic Bulge Survey fields, located 1–2 degrees above and below the Galactic plane; Jonker et al. 2011).
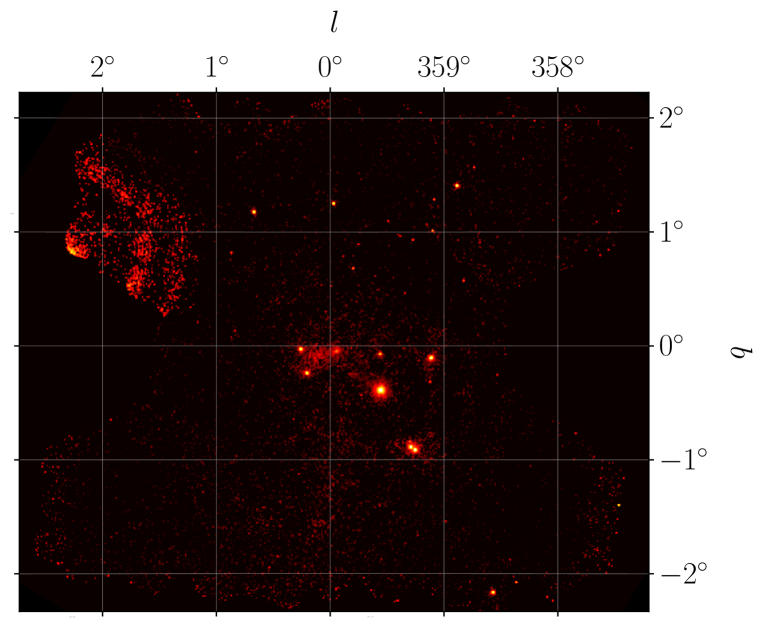
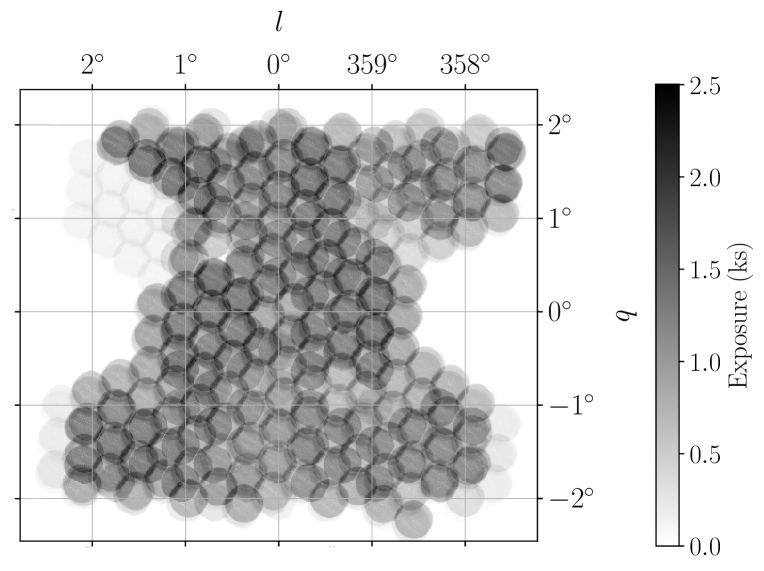
In the first year of this survey (April 2017 – March 2018), we obtained a total of 19 biweekly epochs with an average XRT exposure time of 50-60 seconds per pointing for epochs 1 to 15 and 115-120 seconds for epochs 16-19. Our survey strategy and pointing pattern was slightly adjusted through the course of the survey based on previous epochs. For example, after the first epoch we noticed that scattered light from the bright persistent LMXB GX 3+1 substantially contaminates some of the survey tiles located 1∘ away from GX 3+1 (Fig. 2, see Evans et al. 2020 for a detailed discussion and modeling of this artifact in Swift/XRT). Thus we excluded these tiles in later epochs. In the last 4 epochs, we reduced the number of tiles while doubling individual exposures, to increase depth of individual epochs, and reduced the overlap area between tiles to retain a large coverage area (see Section 4.6). Details of the survey epochs are summarized in Table 1.
| Epoch | Start time | N Tiles | Tile Exp. | Total Exp. |
|---|---|---|---|---|
| (UTC) | (s) | (ks) | ||
| 1 | 2017-04-13 00:21:12 | 139 | 58 | 8.1 |
| 2 | 2017-04-20 04:32:57 | 148 | 58 | 8.6 |
| 3 | 2017-05-04 00:11:07 | 144 | 58 | 8.3 |
| 4 | 2017-05-18 04:14:01 | 145 | 55 | 7.9 |
| 5 | 2017-06-01 02:49:22 | 128 | 49 | 6.3 |
| 6a | 2017-06-15 03:01:01 | 153 | 47 | 7.2 |
| 7 | 2017-06-29 00:11:59 | 90 | 50 | 4.5 |
| 8 | 2017-07-13 08:46:24 | 121 | 58 | 7.1 |
| 9 | 2017-07-27 06:11:43 | 163 | 59 | 9.6 |
| 10 | 2017-08-10 00:02:35 | 133 | 58 | 7.7 |
| 11 | 2017-08-24 05:13:44 | 150 | 57 | 8.6 |
| 12 | 2017-09-07 03:50:35 | 109 | 58 | 6.6 |
| 13 | 2017-09-21 02:45:55 | 130 | 58 | 7.6 |
| 14 | 2017-10-05 00:02:36 | 158 | 57 | 9.2 |
| 15b | 2017-10-19 01:56:24 | 61 | 57 | 3.5 |
| 16 | 2018-02-15 05:40:57 | 93 | 119 | 11.1 |
| 17 | 2018-02-28 23:58:57 | 93 | 116 | 10.8 |
| 18 | 2018-03-15 07:50:57 | 65 | 117 | 7.6 |
| 19 | 2018-03-29 00:18:56 | 86 | 116 | 10.0 |
3 Swift/XRT Data reduction and analysis
3.1 Reduction and analysis pipelines
The primary goal of this survey is a search for VXFTs, many of which show short ( hours–days) transient activity. This requires reduction and analysis of the survey data as soon as possible (e.g., by obtaining preliminary data from the Quick-look database). However, Quick-look data are not the final processing of the data, and can be updated with further telemetry or processing. Thus we developed two pipelines, one for rapid processing of data as soon as they become available on the Swift Quick-look database222https://www.swift.ac.uk/archive/ql.php, and another pipeline with more robust calibration and more careful processing, but with substantially higher overhead, for analysis of final archival data in the Swift database333https://www.swift.ac.uk/archive/obs.php.
Both pipelines follow fundamentally similar procedures: 1- identification and acquisition of observations that belong to a specific epoch in the survey (as tabulated in Table 1); 2- performing event energy filtering and creating image files from events; 3- producing mosaic images and exposure maps for the epoch; 4- performing source detection and producing a source catalogue for each epoch; 5- cross-matching detections against existing catalogs (e.g., via Vizier and SIMBAD databases).
The only difference between the the two pipelines is the status and reduction of the initially acquired data sets. The focus of the Quick-look pipeline is rapid analysis (as opposed to robust calibration and reduction). Thus, the Quick-look pipeline obtains a pre-processed “clean” event file and exposure map for each observation from the Swift archive, as opposed to locally produced versions of those files. Some of these clean event files were produced using older versions of heasoft444https://heasarc.gsfc.nasa.gov/docs/software/heasoft (versions ). Small version differences typically do not cause significant discrepancies. However, the newest updates to the xrtpipeline, introduced in 2017 (version 0.13.4, included in heasoft 6.22 and higher)555https://heasarc.gsfc.nasa.gov/docs/software/lheasoft/Rel_Notes_6.22.html, impact exposure filtering in short Swift/XRT observations significantly. In contrast, using the robust pipeline, we reprocess level 1 Swift/XRT data of archived observations locally, using heasoft 6.25. This procedure introduces a significant overhead compared to the Quick-look pipeline, but allows a more careful examination of the data (without loss of events due to exposure filtering, or incomplete telemetry). The rest of the reduction and analysis procedure is identical between the two pipelines.
We then produce filtered event and image files for each observation in the 0.5–10, 1.5–10, and 0.5–1.5 keV bands using xselect, and make wide-field mosaic images and exposure maps for each epoch. For producing mosaic images and exposure maps, we used the Swarp package666http://astromatic.iap.fr/software/swarp (version 2.38, Bertin et al., 2002) with the combination method set to sum and background subtraction disabled.
The 0.5–1.5 keV and 1.5–10 keV bands were chosen specifically to estimate source hardness, and possibly to constrain distance. Due to the extremely high extinction in the direction of the Galactic Bulge, these energy bands can be used as a very rough proxy for distance. Soft ( keV) X-ray emission from sources at kpc in this region is likely to be mostly extinguished by interstellar absorption (e.g., see Schultheis et al., 2014). As an example, we calculate (using PIMMS777https://asc.harvard.edu/toolkit/pimms.jsp) that in the lowest- portion of our field (=0, =-2 deg), where cm-2, a background X-ray source with photon index 1.7 will show a hardness ratio (1.5–10 keV)/(0.3–10 keV) of 0.8, while an unabsorbed source of the same index will have a hardness ratio of 0.5. Thus we expect that hardness ratios indicate substantial absorption, while lower values suggest foreground objects.
3.2 Rapid Source Detection
The low exposure in individual snapshots combined with the rather large size of the Swift/XRT point spread function (18′′ half-power diameter; Moretti et al., 2005) make source detection challenging in the photon-starved regime dominating our survey. Detecting faint sources (with Swift/XRT count rate ct s-1) in 60 s snapshots is especially difficult and unreliable, due to low significance and high false detection rates.
Given these issues, we developed the following source detection method for detecting transients in each epoch: We first convolve the mosaic image of an epoch with a Gaussian kernel with a standard deviation of 10 pixels using the convolution package in Astropy (Astropy Collaboration et al., 2013a). Then, we use the task find_peaks in the package Photutils888https://photutils.readthedocs.io/ (Bradley et al., 2019) to perform source detection on the smoothed image. We performed two sets of detections, with different detection thresholds, representing high ( 3-) and low (1- to 3-) significance levels based on the average background in the images. Then, we checked for detections in all previous Swift/XRT coverage of the area, and against other X-ray (and multi-wavelength) catalogs.
This method allowed us to identify faint sources effectively across our survey. A substantial fraction of the false detections picked up by this detection method could be ruled out by visual inspection based on their shape/location. For example, some of these detections were located in the contaminated regions around GX 3+1, or within the diffuse emission region near the Galactic Centre (Fig. 2, left), or near other bright sources. Another group were caused by optical leak of photons from extremely bright optical/ultraviolet stars (e.g., from V* X Sgr). We subjected all high-significance detections of new sources to X-ray, and often optical and/or near-IR, follow-up, typically within 1-7 days (see Shaw et al. 2020 for details on some of these observations and their conclusions).
3.3 Swift Bulge Survey X-ray Source Catalogue
To construct a final source catalogue we used an approach almost identical to that employed for the Swift Small Magellanic Cloud Survey (S-CUBED, Kennea et al., 2018), except that we based it on the new XRT catalogue tools created for the Swift-XRT Point Source catalogue (2SXPS, Evans et al., 2020). In this approach, the XRT fields were grouped into ‘blocks’ of overlapping fields, with each block being up to in radius. Blocks were defined such that every field, and every overlap between fields, was in at least one block. Source detection, localisation and characterisation were then carried out using the 2SXPS software (Evans et al., 2020), which produces positions and fluxes for every source, as well as a flag characterising the probability that it is spurious. These flags have values of ‘Good’, ‘Reasonable’ and ‘Poor’, with false positive rates of 0.3% for good sources, 1% for the set of good+reasonable sources and 10% when poor sources are also included. Due to the large amount of diffuse emission around the Galactic Bulge, especially around the Galactic Centre, the rate of spurious sources is expected to be somewhat elevated999In 2SXPS extra warnings are set in the flags in such cases; these warnings were not set in our analysis., and in particular we found that a very high fraction of ‘poor’ sources were clearly spurious. We therefore limit the results reported here to ‘good’ and ‘reasonable’ sources.
This pipeline produced a total of 831 individual sources, with varying level of significance. Out of these, 654 detections are of poor quality, 54 of reasonable quality, and 123 were good detections. For a more careful investigation, we omitted poor-quality detections, and inspected each of the remaining 177 individually. We found that a small subset of these detections are from areas suspected of diffuse emission (e.g., around Sgr A*), in the PSF of very bright sources (e.g., around H 1742294), or likely due to optical loading in the vicinity of very bright stars (e.g., around V* X Sgr). Ignoring these detections, along with other instances where a visual inspection identifies an unreliable detection, resulted in a final catalogue of 104 sources (shown in part in Tables 2, 3, 4, 5; the complete catalogue is available in the electronic version of the manuscript). Many of these sources are previously identified X-ray emitters. However, for most of them, the SBS provides the first long-term high-cadence variability study, allowing detection of faint outbursts, among other long-term behaviors. We crossmatched the sources in this catalogue against SIMBAD (Wenger et al., 2000), the Chandra Source Catalog101010https://cxc.harvard.edu/csc/ (Evans et al., 2010) release 2.0 (2019), and the XMM-Newton source catalogue 3XMM-DR8 111111http://xmmssc.irap.omp.eu/Catalogue/3XMM-DR8/3XMM_DR8.html (Rosen et al., 2016). To estimate the number of possible chance coincident matches, we produced multiple sets of mock localisations by shifting each SBS source by arcmin in an arbitrary direction (to imitate a randomly generated source catalogue with similar global source distribution as the SBS catalogue). These randomisations typically produced matches between the catalogues, limiting the expected number of coincident matches.
Although we measure variations between our Swift observations, these are not sensitive to variability for most of our sources, which are too faint for a nondetection to be statistically meaningful, and thus we cannot robustly determine whether most of our sources are transients using Swift data alone. Luckily, we often have the opportunity to detect transient behaviour by comparing to archival Chandra or XMM-Newton observations, either detections or nondetections. The fields of the majority of our SBS transients have been imaged with Chandra (especially by the Galactic Bulge Survey, Jonker et al. 2011, 2014, which gives positional names starting with CXOGBS, and shorthand CX names) and/or XMM-Newton. This allows us to use the ratio of the peak flux in the SBS and the (likely) quiescent Chandra or XMM-Newton flux, based on the catalogued values (from the catalogues above), or nondetections, to indicate transient behaviour. Typical nondetections come from 2 ks Chandra Galactic Bulge Survey Chandra/ACIS observations, for which we used an upper limit of (0.3–10 keV, absorbed) erg s-1 cm-2(assuming a conservative 5 count detection limit, a high cm-2 - based on spectral analysis of sources in the bulge from our survey, and a power-law of photon index 1.7). We classify a source as transient if the peak SBS flux lower limit is 10 times the quiescent flux, and as a likely transient if the peak SBS flux lower limit is at least 5 times the quiescent flux (as our SBS errors are often large). We find 25 sources that have clearly varied by at least a factor of 10, and 14 more that have varied by at least a factor of 5; this is a lower limit on the variability among our X-ray sources, as many of our Swift detections are highly uncertain.
With this process, we were able to determine possible classifications for 45 sources in the catalogue, which we discuss in the following sections.
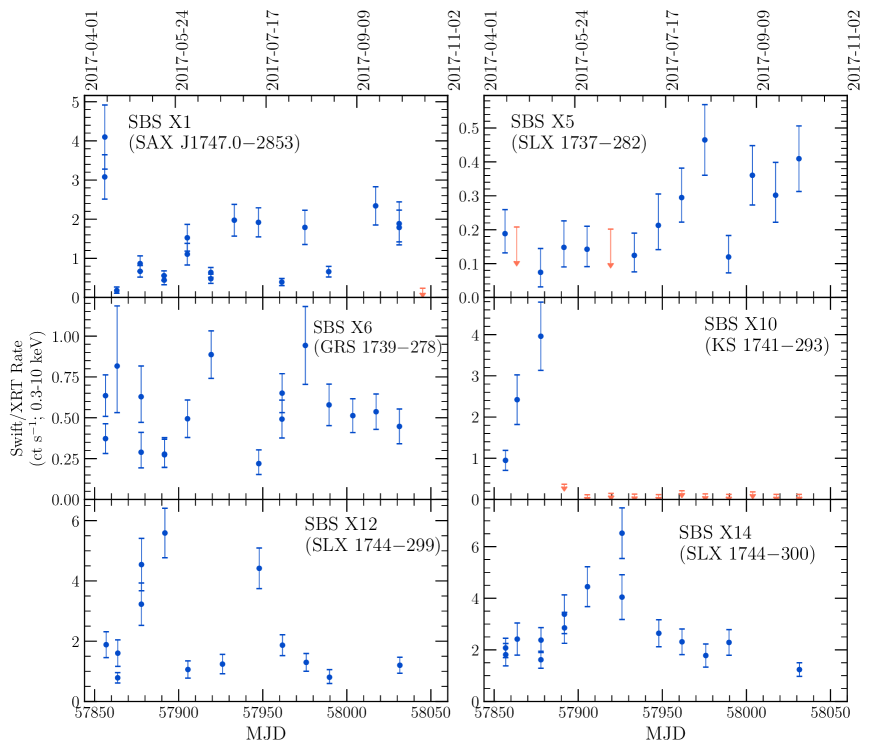
Tables 2, 3, 4 and 5 represent catalogue columns for a subset of sources detected in our survey. These include source designations, detection quality, coordinates, possible counterparts, basic estimates of peak count rate and absorbed flux (in the 0.3–10 keV band), hardness ratio (fraction of flux in 1.5–10 keV), results of X-ray spectral analysis, and a simple measure of variability significance (Var-) defined as the difference between peak count rate and the lowest detection (or upper limit) within the SBS data, divided by the 1-sigma uncertainty. For each source, we fitted the X-ray spectrum (stacked across all observations in which the source was detected) with an absorbed power-law using Bayesian inference and nested sampling using Xspec, and Bxa (Arnaud, 1996; Buchner et al., 2014; Feroz et al., 2019). Table 4 contains flux measurements of likely counterparts for each SBS source in the Chandra and XMM-Newton source catalogues. We also provide a flux ratio between the measurements from those catalogues and the peak value from the SBS catalogue (converted to the appropriate band for each instrument, using the pimms121212https://asc.harvard.edu/toolkit/pimms.jsp software and assuming a power-law fit with parameters based on the merged spectrum in SBS, Table 3). We also produce light curve plots for all the sources in the catalogue. These figures are available in the online version of the journal, and a subset are presented in Fig. 3.
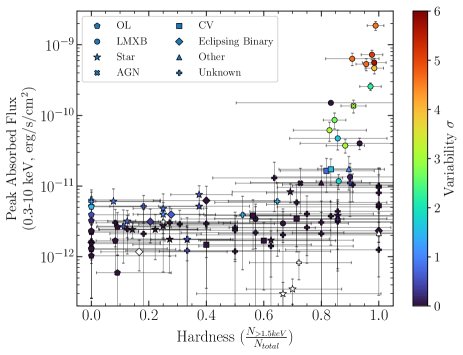
The combination of observed flux, hardness ratio, and variability measure provide a simple picture of detected sources in the first year of our survey (Fig. 4).
We identify emission from 17 bright chromospherically active stars, 12 X-ray binaries, 5 CVs, 3 symbiotic systems, 1 AGN, 2 radio pulsars, 1 young massive cluster, and 4 candidate CVs. We discuss their identifications and properties below, and then discuss systems whose nature is not yet known.
| SBS X | Swift | Quality | RA | Dec | Err | Peak Rate | Hardness | #Detect/Cover | Var- |
|---|---|---|---|---|---|---|---|---|---|
| (°) | (°) | (′′) | (ct s-1) | ||||||
| 1 | J174702.6285259 | Good | 266.76118 | -28.8833 | 19/20 | 4.7 | |||
| 2 | J174621.1284342 | Good | 266.58812 | -28.7284 | 15/15 | 2.2 | |||
| 3 | J174627.1271122 | Reasonable | 266.61314 | -27.1897 | 0/5 | – | |||
| 4 | J174430.5274600 | Good | 266.12713 | -27.7667 | 4/14 | 3.1 | |||
| 5 | J174042.8281807 | Good | 265.17861 | -28.3020 | 12/14 | 3.1 | |||
| 6 | J174240.0274455 | Good | 265.66678 | -27.7487 | 17/17 | 2.7 | |||
| 7 | J174230.3284454 | Good | 265.62663 | -28.7484 | 12/13 | 0.3 | |||
| 8 | J174354.8294441 | Good | 265.97867 | -29.7450 | 16/16 | 3.9 | |||
| 9 | J174445.2295045 | Good | 266.18842 | -29.8459 | 4/16 | 1.6 | |||
| 10 | J174451.5292042 | Good | 266.21483 | -29.3451 | 3/14 | 4.7 |
| SBS X | Swift | NH | Avg. Unabs. Flx | Avg. Abs. Flx | Peak Abs. Flx | |
|---|---|---|---|---|---|---|
| ( cm-2) | ( erg s-1 cm-2) | ( erg s-1 cm-2) | ( erg s-1 cm-2) | |||
| 1 | J174702.6285259 | |||||
| 2 | J174621.1284342 | |||||
| 3 | J174627.1271122 | |||||
| 4 | J174430.5274600 | |||||
| 5 | J174042.8281807 | |||||
| 6 | J174240.0274455 | |||||
| 7 | J174230.3284454 | |||||
| 8 | J174354.8294441 | |||||
| 9 | J174445.2295045 | |||||
| 10 | J174451.5292042 |
| SBS X | ACIS flux | HRC flux | EPIC flux | Vmag | ||||
| (0.5–7 keV) | (0.1–10 keV) | (0.2–12 keV) | ||||||
| 1 | – | – | – | – | ||||
| 2 | – | – | – | – | ||||
| 3 | – | – | – | – | – | – | 10.77 | -2.25 |
| 4 | – | – | – | – | – | – | – | – |
| 5 | – | – | – | – | – | – | ||
| 6 | – | – | – | – | – | – | – | – |
| 7 | – | – | – | – | 9.0 | -2.53 | ||
| 8 | – | – | – | – | ||||
| 9 | – | – | – | – | ||||
| 10 | – | – | – | – |
| SBS X | Swift | Alt. ID | Type | Comment |
|---|---|---|---|---|
| 1 | J174702.6285259 | SAX J1747.02853 | LMXB | Burster, Transient NS-LMXB (Werner et al., 2004) |
| 2 | J174621.1284342 | 1E 1743.12843 | LMXB | Persistent NS-LMXB candidate (Lotti et al., 2016) |
| 3 | J174627.1271122 | HD 316264 | Ecl-Bin | Algol type, Gaia Parallax 6.5838+/-0.1913 mas (distance of 150 pc) |
| 4 | J174430.5274600 | IGR J174452747 | LMXB | Transient NS-LMXB, this work, Shaw et al. (2020) |
| 5 | J174042.8281807 | SLX 1737282 | LMXB | Persistent, Burster, NS-LMXB, UCXB candidate (in’t Zand et al., 2002; in’t Zand et al., 2007) |
| 6 | J174240.0274455 | GRS 1739278 | LMXB? | Transient, BH-XRB candidate (e.g. Tetarenko et al., 2016), companion B-star or K giant? |
| 7 | J174230.3284454 | HD 160682 | Ecl-Bin | Beta Lyra, Gaia Parallax 11.38+/-0.05 mas (distance of 88 pc), negligible optical loading |
| 8 | J174354.8294441 | 1E 1740.72942 | LMXB? | Transient, BH-XRB, LMXB vs HMXB unclear (e.g. Tetarenko et al., 2016) |
| 9 | J174445.2295045 | XMMU J174445.5295044 | LMXB | Transient, Symbiotic XRB at 3.1 kpc (Bahramian et al., 2014) |
| 10 | J174451.5292042 | KS 1741293 | LMXB | Burster, Transient NS-LMXB (De Cesare et al., 2007) |
3.4 Detections due to optical loading
Some SBS detections are contaminated by optical loading by bright optical counterparts on the Swift/XRT detector131313https://www.swift.ac.uk/analysis/xrt/optical_loading.php. We used the Swift/XRT Optical Loading Calculator141414https://www.swift.ac.uk/analysis/xrt/optical_tool.php to estimate possible contamination of the estimated count rates (and subsequently flux), and thus determine whether we can be confident that real X-ray emission was detected from sources near bright stars. Detections that are likely due to optical loading are denoted in the catalog by “OL” under the “Type” column. We also comment on the severity of optical loading in each case in the “Comment” column (Table 5). We found that in 12 sources (SBS X16, X44, X45, X82, X85, X86, X130, X135, X184, X198, X775, X784), all or most detected X-ray events are likely caused by optical loading and in 1 source (SBS X71), while optical loading is possible, real X-ray emission from the source is not ruled out. We verify that in each of these sources, the X-ray hardness ratio is , indicating an extremely soft spectrum consistent with optical loading 151515see https://www.swift.ac.uk/analysis/xrt/optical_loading.php. It is possible that these sources may also provide some soft X-ray photons typical of chromospheric activity, but they certainly do not provide hard ( keV) X-ray photons. We do not consider these sources further in this paper, bringing our solid X-ray detections down to 91 sources.
4 Results
Using the methods described above, we detected new faint (and bright) X-ray transients in the Galactic Bulge, and studied variability and faint transient activity from other known sources.
4.1 Previously Classified Sources
4.1.1 X-rays from stellar chromospheric activity
Sixteen of the 17 optically bright () counterparts showing genuine X-ray emission show soft X-ray hardness ratios (; see section 3 for definitions), consistent with nearby (low ) foreground stars where the X-rays are produced by chromospheric activity. We use = 0 as a conservative maximum for chromospheric activity, following the empirical dividing line between ABs and CVs in globular clusters (Verbunt et al., 2008). We find that these active stars vary from to (Fig. 4, right). All but SBS X103 have soft Swift/XRT spectra. We quote some key information below, from the Two Micron All Sky Survey (2MASS, Skrutskie et al., 2006), Gaia (Gaia Collaboration et al., 2018; Bailer-Jones et al., 2018), and Tycho (Høg et al., 2000) catalogues.
SBS X3 matches HD 316264, a =10.77 Algol-type F8 eclipsing binary at 150 pc.
SBS X7 associates with an eclipsing binary Beta Lyrae system, HD 160682 (9), which is a G5V star at 88 pc.
SBS X20, or Swift J173931.3290953, matches HD 316072, a G9III star at =9.9, and is transient (factor 155 increase over Chandra), though it was detected in 3 SBS epochs.
SBS X31 matches HD 316308, a K0 star at =9.6, detected by Chandra as CXO J174854.0285930. It was only seen in one epoch, where it was 100 times brighter than the Chandra detection.
SBS X34 (Swift J174023.9285647) matches AX J1740.42856, which was identified with the nearby (56 pc), spectrally normal M dwarf 2MASS J174023842856527 by Lutovinov et al. (2015). Optical flares up to (from quiescent ) were seen from 2MASS J174023842856527 in INTEGRAL Optical Monitor data. The ratio is at the top of the range for chromospheric activity.
SBS X46, aka 1SXPS J174215.0291453 (Evans et al., 2014), is shown by Shaw et al. (2020) to be an M dwarf binary. Details of its X-ray emission are in § 4.3.2.
SBS X47 matches CXOGBS J173826.1290149 (aka CX7; Jonker et al. 2011), which was shown to be a K0 pre-main-sequence star by Torres et al. (2006); Hynes et al. (2012).
SBS X48 matches CXOGBS J173629.0291028 (CX10), which is HD 315992, a G7 variable star without evidence of binarity (Hynes et al., 2012). The SBS detection is 2010 times brighter than Chandra, but it is detected in 3 SBS epochs.
1SXPS J174034.5293744 (SBS X55) is Tycho 6839-501-1, =11.26. Gaia Collaboration et al. (2018) gives =4974 K, =180 pc.
SBS X63 matches V* BN Sgr, an Algol-type F3V eclipsing binary at 340 pc. The Swift/XRT data show strong flaring compared to archival Chandra and XMM-Newton quiescent measurements (factor 8), but it is detected in 5 (of 14) SBS epochs.
Swift J175041.4291644 (SBS X79) is very soft (hardness ratio of 0), and matches 2RXP J175041.2291644, CXOGBS J175041.1291644 (CX183, Jonker et al. 2011, a factor 13 brighter), and HD 162120, an A2V star with =8, at =177 pc (Hynes et al., 2012; Gaia Collaboration et al., 2016). It is unusual to see X-rays from an A star; typically X-rays from A stars are thought to be produced by companion stars (Schröder & Schmitt, 2007; Hynes et al., 2012), which is consistent with the especially low and soft spectrum here.
Swift J174142.0283321 (SBS X92) matches 2RXP J174141.9283324 and 2CXO J174141.7283324, associated with a =13 star at 111 pc, with K, and (Gaia Collaboration et al., 2018), thus a nearby dwarf K star. SBS detected it in one epoch, 5 times brighter than the Chandra detection.
SBS X132 matches CXO J174446.0274732, which matches a =12.3 star. Gaia Collaboration et al. (2018) indicates =92050 pc, =5 , =4900 K.
SBS X190 matches CXOGBS J175020.7302652 (CXB11), which matches a =12.2 star at 540 pc, with 4500 K, =3.2 , L=3.8 (Gaia Collaboration et al., 2018). An optical spectrum shows that H is filled in, as often seen in chromospherically active stars (Skiff, 2014).
SBS X558 matches 2RXP J174046.7283849 and CXOGBS J174046.5283850 (CX469). Wevers et al. (2016) identify the Chandra source with a saturated star at , with high likelihood. This matches a Gaia star with Rp=12.7, =3850 K, at =95 pc. The peak SBS flux is 16 times brighter than the Chandra and XMM-Newton fluxes, and it is only detected in one SBS epoch.
SBS X803 matches CXOGBS J175432.1292824 (CXB8), which matches Tycho 6853-1571, with =11.2. Gaia Collaboration et al. (2018) gives =10.5, =4900 K, =3.4 , and =46615 pc. Wevers et al. (2017) find that this star shows an optical spectrum consistent with a normal star. The peak SBS flux is 179 times the Chandra flux, though it is detected in 5 of 21 epochs.
Finally, Swift J174701.3291308 (SBS X103) matches 2XMM J174700.7291309 and the Tycho star TYC 6840-337, =11.6, with a Gaia distance of 1.0 kpc (Bailer-Jones et al., 2018), K, and (Gaia Collaboration et al., 2018), thus a K giant. Its hardness (0.67) is consistent with a 1 kpc distance and a hard intrinsic spectrum, as seen in RS CVn binaries at this high of erg s-1 (e.g. Heinke et al. 2005). Its log of -2.5 is consistent with chromospheric activity.
4.1.2 Known X-ray binaries
SAX J1747.02853 (SBS X1) is a transient X-ray binary discovered by BeppoSAX in 1998 (in ’t Zand et al., 1998). Follow-up observations confirmed its transient nature, and detection of X-ray bursts showed it harbors a neutron star, and constrained the source distance to kpc (Werner et al., 2004). In the SBS observations we observed a long outburst detected from the first epoch of the survey on 2017-04-13, until 2017-10-05 (epoch 14, last detection), with the X-ray luminosity reaching erg s-1. We observed an initial peak, followed by a sharp decline around MJD 57860 and variability in a relatively faint state for the next 200 days, and eventually decay to quiescence by 2017-10-19, with the X-ray luminosity fading below erg s-1 (Fig. 3).
1E 1743.12843 (SBS X2) is a persistent source, without clear evidence of its nature (e.g., Del Santo et al., 2006). A recent deep X-ray study of this system by Lotti et al. (2016) has indicated that this system is likely a neutron star LMXB. 1E 1743.12843 was detected persistently throughout our survey with a variable X-ray flux between erg s-1 cm-2 and erg s-1 cm-2 ( of – erg s-1 if at 8 kpc).
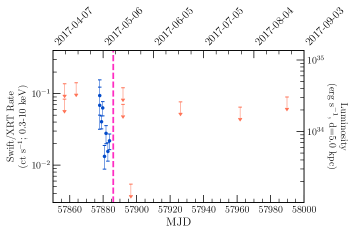
IGR J174452747 (SBS X4) is a transient discovered by INTEGRAL (Bird et al., 2007, 2010). Landi et al. (2007) identified a Swift/XRT counterpart with a 2–10 keV flux of erg s-1 cm-2. Swift/XRT has detected it in outburst twice since discovery. In April 2017, INTEGRAL detected a type I X-ray burst from it, indicating the compact object is a neutron star (Mereminskiy et al., 2017b, d). Our SBS Swift/XRT observations allowed a more precise localization to , , with uncertainty 2.2 arcseconds (Kennea et al., 2017). Chakrabarty et al. (2017) obtained the most accurate Chandra localization of , , with uncertainty of 1 arcsecond. This allowed identification and study of the infrared counterpart (Fortin et al., 2017; Shaw et al., 2017). Shaw et al. (2020) show from Gemini near-IR spectroscopy that the companion is a giant, estimating a distance of 2–8 kpc, and argue that IGR J174452747 is a symbiotic X-ray binary where the neutron star has a low field, allowing X-ray bursts.
IGR J174452747 was detected only in epochs 1-3 of SBS in 2017-18, showing an overall decline to quiescence over a period of weeks after the INTEGRAL observations, and strong variability on timescales of a few days (Fig. 5). Swift/XRT count rates were converted to flux assuming the best-fit model (absorbed power-law) as reported by Mereminskiy et al. (2017b). The detection on 2017-05-04 was preceded and succeeded by non-detections on 2017-05-01 and 2017-05-06. The highest X-ray flux measured in 2017 was from April 7th/11th INTEGRAL observations (Mereminskiy et al., 2017b). For a distance of 2.3 kpc (Shaw et al., 2020), this suggests a VFXT outburst with a peak of erg s-1. However, the distance to the source is highly uncertain (Shaw et al., 2020), and the full range of possible luminosities for a distance in the 2–8 kpc range is – erg s-1.
SLX 1737282 (SBS X5) is a persistent, relatively faint X-ray source. in’t Zand et al. 2002 discovered X-ray bursts from this system, confirming its neutron star nature. The faint X-ray luminosity of the system suggests that it may be an ultracompact X-ray binary (in’t Zand et al., 2007). SLX 1737282 shows suggestive evidence of variability in the SBS, with X-ray luminosity between erg s-1 and erg s-1, assuming a distance of 7.3 kpc (Falanga et al., 2008). While the upper bound is consistent with previous studies of this source, our lower bound establishes the faintest level at which it has been observed (Fig. 3; cf. Armas Padilla et al., 2018).
GRS 1739278 (SBS X6) is a known BH XRB (aka V* V2606 Oph), that has undergone outbursts in 1996 (Borozdin et al., 1998) and 2014, the latter followed by several mini-outbursts (Mereminskiy et al., 2017a). It erupted again in 2016, unusually staying bright into 2018 (Parikh et al., 2018). Our lightcurve of GRS 1739278 shows variability by a factor of (Fig. 3).
1E 1740.72942 (SBS X8) is a well-known persistent BH (candidate) X-ray binary (Sunyaev et al., 1991; Natalucci et al., 2014, and references therein). During our survey, it showed a variable X-ray luminosity between 2 and erg s-1, assuming a distance of 8.5 kpc (Natalucci et al., 2014; Tetarenko et al., 2020). This is consistent with the system luminosity observed in the hard state (e.g., Nakashima et al., 2010).
KS 1741293 (SBS X10) is a known bursting neutron star LMXB (in’t Zand et al., 1991; De Cesare et al., 2007). This system sometimes shows short subluminous outbursts with L erg s-1 (e.g., Degenaar et al., 2012). We detected a bright (L erg s-1) outburst from KS 1741293, with an X-ray luminosity averaging erg s-1, and reaching erg s-1(assuming a distance of 8 kpc, a hydrogen column density of NH of cm-2, and a power-law photon index of 1.6, Degenaar et al. 2008) in the third epoch. The source was not detected in the fourth epoch or later, with a (conservative) upper limit of L erg s-1 (Fig. 3).
1A 1742294 (SBS X11) is a bright persistent burster LMXB (Pavlinsky et al., 1994; Lutovinov et al., 2001). We detect this source in all epochs, with between and erg s-1, assuming a distance of 8 kpc, NH of cm-2, and a power-law photon index of 1.6 (e.g., Wijnands et al., 2006).
SLX 1744299 (SBS X12) and SLX 1744300 (SBS X14) are two bright persistent LMXBs. Detection of bursts from both systems indicated they are NS-LMXBs (Skinner et al., 1990; Pavlinsky et al., 1994). Given the small separation between these two sources (), SBS provides the first long-term monitoring of these sources in which they are distinguished from one another. We find both systems variable in the SBS (Fig. 3), with LX between and erg s-1 for SLX 1744299, and between and erg s-1 for SLX 1744300, assuming a distance of 8 kpc, hydrogen column density of cm-2, and a power-law photon index of 2.0 for both systems (from XMM-Newton spectral fitting of these sources, Mori et al., 2005).
AX J1745.62901 (SBS X30) is a transient, eclipsing, bursting LMXB near the Galactic Centre, included in Swift/XRT daily monitoring (e.g. Degenaar & Wijnands, 2012; Ponti et al., 2015, 2018). We detected it in the May 18 and June 1, 2017 epochs, peaking at erg s-1, consistent with Degenaar et al. (2017).
GRS 1747312 (SBS X60) is a transient, eclipsing, bursting LMXB in the globular cluster Terzan 6 (in’t Zand et al., 1999, 2003). This source typically shows outbursts every months. It is possible that there are multiple transient LMXBs residing in Terzan 6 which are not resolved by Swift/XRT (given its high encounter rate, Bahramian et al. 2013). An outburst detected by Suzaku did not show an eclipse at the predicted time, which might indicate a second LMXB in the cluster (Saji et al., 2016), though Vats et al. (2018) argue that it could be the same LMXB. We confirmed the outburst detected in our survey was from GRS 1747312 by performing a follow-up Swift/XRT observation at the time of one predicted eclipse ingress (in’t Zand et al., 2003), which successfully detected the eclipse.
GRO J174428 (SBS X334) is a transient, bursting, pulsing LMXB (Finger et al., 1996) and is known to display low-level activity between its bright outbursts and quiescence (Degenaar et al., 2012). We detect it on June 29, 2017 at 20 times above its quiescent flux, as measured by XMM-Newton and Chandra (Wijnands & Wang, 2002). This may be a continuation of the February outburst reported by Mereminskiy et al. (2017c); Sanna et al. (2017); Russell et al. (2017).
4.1.3 Known cataclysmic variables (CVs)
SBS X76, or Swift J174015.9290331, matches AX J1740.22903, an ASCA source (Sakano et al., 2000). Several authors measured X-ray and optical periods between 623 and 628 s (Farrell et al., 2010; Halpern & Gotthelf, 2010). Thorstensen & Halpern (2013) measured an orbital period (via radial velocities) of 0.2384 days, securely classifying this system as a DQ Her, or IP, CV. Farrell et al. (2010) measure cm-2 from the XMM-Newton observation, implying a distance below 4 kpc (using the extinction/distance relation of Schultheis et al. 2014).
SBS X29 matches CXOGBS J174133.7284033 (CX21, Jonker et al. 2011), which was classified as a quiescent CV below the period gap by Britt et al. (2014) and Wevers et al. (2017) on the basis of strong optical flickering and an optical spectrum, and argued to be closer than 500 pc.
SBS X35 matches CXOGBS J174009.1284725 (CX5), and AX 1740.12847, which shows an X-ray periodicity of 729 s (Sakano et al., 2000). Kaur et al. (2010) identified a low-mass stellar counterpart, which Britt et al. (2013) verified spectroscopically as an IP with a likely 125-minute orbital period.
SBS X146 matches CXOGBS J174028.3271136 (CX128). Torres et al. (2014) discovered strong H and H emission lines in the optical spectrum of this source, along with several helium lines. They also detected broad emission lines from the Paschen series with complex profiles, and suggested the system is likely a CV. Assuming a power-law photon index of 1.8, NH of 1021 cm-2, and a distance of 1.0 kpc (Torres et al., 2014), we estimate an X-ray luminosity of erg s-1, more than 10 times higher than the reported luminosity by Torres et al. (2014). It is detected in only one of 5 SBS exposures covering its location.
SBS X133 matches XMMU J175035.2293557, which was identified as a likely IP by Hofmann et al. (2018) due to its X-ray spectrum and 511 second X-ray periodicity, interpreted as the spin period of the system. Our measured Swift flux is at least 50 times brighter than an upper limit we estimate from the quiescent Chandra flux, but is very close to the XMM-Newton flux of Hofmann et al. (2018). This suggests that SBS X133 is one of the rare IPs that occasionally go into off states (Kennedy et al., 2017).
4.1.4 Likely symbiotic X-ray binaries or symbiotic stars
Swift J175233.3293944 (SBS X707) is consistent with the position of the Chandra Galactic Bulge Survey source CXB12 (or CXOGBS J175233.2293944, Jonker et al. 2014). Our Swift detection, at = erg s-1 cm-2, is 16 times brighter than the Chandra and XMM-Newton detections, but with large errors. Wevers et al. (2016, 2017) identified CXB12 with a =12.35 star (blended with a brighter neighbour 05 away), which is also detected in XMM-Newton Optical Monitor UV images (e.g. uvw1=14.570.01). Wevers et al. (2017) used VLT/FORS2 spectroscopy to find an H absorption line of EW=1.03() Å. The ASAS V-band lightcurve (Pojmanski, 1997) shows variability of 0.2 magnitudes. Wevers et al. (2017) use the fitted of an XMM-Newton observation ( cm-2) to infer a distance of 1.5-4 kpc, using the reddening map of Green et al. (2015), and thus a likely giant companion. The UV detection implies (/2 kpc)2 erg s-1, while the Chandra and XMM-Newton flux values imply (/2 kpc)2 erg s-1. Wevers et al. (2017) suggest this is likely a symbiotic system, with either a WD or NS primary. Our Swift measurement of (/2 kpc)2 erg s-1 strongly favors the symbiotic explanation over the alternative RS CVn interpretation considered by Wevers et al. (2017). We also favor a WD, rather than NS, nature for the accretor, based on the high UV luminosity, naturally produced in boundary layers on WDs accreting at high rates (e.g. Patterson & Raymond, 1985; Mukai, 2017).
IGR J174452747 (SBS X4) is a candidate symbiotic X-ray binary, also discussed in § 4.1.2 above. Optical/IR follow-up of this object is discussed in Shaw et al. (2020).
XMMU J174445.5295044 (SBS X9) is a rapidly variable X-ray transient (Heinke et al., 2009). K-band spectroscopy of the near-infrared counterpart indicated that it is a symbiotic X-ray binary at a distance of kpc (Bahramian et al., 2014). This system was briefly detected in the first few epochs of the SBS, with peak X-ray luminosity of erg s-1.
4.1.5 Young stellar cluster
Swift J174550.3284920 (SBS X101) matches the Arches Cluster, a young cluster of high-mass stars near the Galactic Centre, including multiple Wolf-Rayet stars (Figer et al., 2002), that is a known X-ray source (Yusef-Zadeh et al., 2002; Law & Yusef-Zadeh, 2004). Detailed analysis of our Swift data on this source, and of archival Swift and Chandra data, is performed in Kozynets et al. (in prep).
4.1.6 Active galactic nuclei (AGN)
SBS X18 matches GRS 1734292, a known AGN with bright X-ray emission. Multiple broad optical emission lines at a redshift of 0.0214 verify its AGN nature (Marti et al., 1998). GRS 1734292 is a variable X-ray source, with an observed range of - erg s-1 cm-2 in the 2–10 keV band (Guainazzi et al., 2011; Tortosa et al., 2017). We persistently detect GRS 1734292 in the SBS with flux between and erg s-1 cm-2 in the 2–10 keV band, consistent with previous observations.
4.1.7 Radio pulsars and pulsar wind nebulae
SBS X13 matches G359.23–0.82, also known as the Mouse pulsar wind nebula, which is a well-studied extended X-ray and radio nebula (Yusef-Zadeh & Bally, 1987; Gaensler et al., 2004; Mori et al., 2005; Klingler et al., 2018) associated with the radio pulsar PSR J17472958. Our peak absorbed flux (7 erg s-1 cm-2) and average flux (7 erg s-1 cm-2) are consistent with the catalogued XMM-Newton flux (9 erg s-1 cm-2), as expected for such a source.
SBS X112 matches CXOGCS J174722.9280904, a known X-ray source catalogued by both Chandra and XMM-Newton. Based on its X-ray and infrared properties, Lin et al. (2012) classify this source as a rotationally powered pulsar. We marginally detect this hard source (with a hardness of 1.0) in the final stacked image of our survey, with an absorbed flux of erg s-1 cm-2.
4.2 New or newly classified sources
4.2.1 Candidate CVs or X-ray binaries
SBS X54 matches CXOGBS J175553.2281633 (CX137, Jonker et al. 2011). The OGLE-IV survey identified a very bright optical counterpart to CX137 with and , and a sinusoidal modulation with a period of 0.43 days, interpreted as the orbital period (Udalski et al., 2012). Based on the optical properties, Torres et al. (2014) estimated a lower limit distance of kpc, and a lower limit on erg s-1. Bailer-Jones et al. (2018) gave a Gaia distance estimate of 880 pc for the associated star. Torres et al. (2014) suggested that this system is either a CV accreting at a low rate, or a quiescent LMXB. Assuming a power-law photon index of , and NH of 1021 cm-2, we estimate a peak X-ray luminosity (in a single SBS detection) of erg s-1 at 880 pc. This is 20 times brighter than the luminosity reported by Torres et al. (2014). Gomez et al. (2020) recently reported on modeling of the optical light curve of this source and classified the source as a CV.
SBS X97 matches XMMU J174654.1291542, which was discovered and discussed by Degenaar et al. (2012), who identified strong spectral variations (large changes in the 4–10 keV flux, without corresponding changes in the 1-4 keV flux). Degenaar & Wijnands (2012) also suggested it may be associated with a Spitzer infrared source, with a 3.6 micron magnitude of 10.7. All Swift photons are hard, consistent with the high (2-3 cm-2) measured by Degenaar & Wijnands (2012) from XMM-Newton and Chandra data. If the Spitzer association is correct, this points towards a symbiotic system and the strong spectral variability indicates that an AGN nature is less likely.
SBS X374 matches 3XMM J174417.229394 with a subgiant optical counterpart, which Shaw et al. (2020) argue has a WD companion in a 8.71 day period, accreting from a focused wind. We present further X-ray follow-up, supporting this scenario, in § 4.3.3 below.
SBS X657, a hard source (hardness ratio of 0.67), matches CXOGBS J175359.8292907 (CXB2). The secure optical counterpart has a broad, variable H emission line, and shows eclipsing or dipping on a 0.447-day period (Wu et al., 2015). Wu et al. (2015) also found possible optical evidence of an X-ray burst (indicating it is a candidate NS-LMXB), and estimated the distance to be 1-4 kpc, suggesting the detected Chandra corresponds to erg s-1. This source was also detected by ASCA as AX J1754.02929 (Sakano et al., 2002), but was not detected by ROSAT, which could be due the hard and absorbed spectrum of the source (compared to the soft band of the ROSAT imager).
4.2.2 Sources with optical counterparts of unknown nature
SBS X39 (intermediate hardness of 0.4) appears to be associated with the =0.282 day eclipsing binary OGLE BLG-ECL-116765 (Soszyński et al., 2016), with =17.9. This star is kpc away (Bailer-Jones et al., 2018), so should be somewhat reddened. The peak SBS X-ray flux (in 2 SBS epochs) at a 2 kpc distance gives an X-ray luminosity of erg s-1(150 times higher than the Chandra upper limit), and the source shows a value of 1.1, suggesting that this may be an X-ray binary. It is also possible that the optical association is spurious.
SBS X78, CXOGBS J175316.4283812 (CX46), was identified by Wevers et al. (2016) at high confidence with a star that was saturated in their photometry (). This star has a Gaia-measured K, at a distance of kpc (Bailer-Jones et al., 2018), and an inferred radius of 31 ; thus, a K giant. The X-ray hardness ratio of 0.5 is consistent with the foreground nature of this source. The suggests that this object may be an RS CVn star, but the peak erg s-1 is unusually large for that type of system, hinting it may be a symbiotic star. Follow-up spectroscopy of this reasonably bright star may be necessary to ascertain its nature.
SBS X109, a hard source (hardness ratio of 0.7), matches CXOGBS J175249.3284009 (CX164). Wevers et al. (2016) found a high confidence counterpart, with , , and near-infrared magnitudes =12.84, =13.24, =14.31 from the VISTA Variables in the Via Lactea survey (VVV, Minniti et al., 2017). The reddening-free parameter gives , which is close to that expected for late-type (K-M) stars (Comerón & Pasquali, 2005; Negueruela & Schurch, 2007). We can place limits on the reddening from the range of intrinsic colors of giant stars, compared to the observed =1.47; we measure , cm-2, . If this star is a K0 giant, we can estimate its distance as 6-7 kpc; a later spectral type would give a larger distance. This distance range indicates erg s-1, suggesting accretion, possibly in a symbiotic X-ray binary.
SBS X129, a hard source (hardness ratio of 0.9), matches CXOGBS J174151.2270223 (CX11). Wevers et al. (2016) find a high-likelihood optical counterpart, with =18.9, =21.1. Britt et al. (2014) find this star to be variable. Greiss et al. (2014) give =13.5 for this star.
SBS X136, a moderately hard Swift X-ray source (hardness 0.63) matches CXOGBS J175007.0300154, or CX124. Udalski et al. (2012) identify CX124 with OGLE BUL-SC5 134677, a star showing irregular variability. Wevers et al. (2016) confirm this identification with high likelihood. Gaia gives a 1.9 kpc distance for this star, indicating a peak erg s-1 (however with large errors).
SBS X148, a fairly hard source (hardness 0.63) matches CXOGBS J173935.7274023, or CX342. Wevers et al. (2016) identify a high likelihood counterpart, with =20.6, =22.4. Greiss et al. (2014) identify the NIR counterpart, with =16.5.
SBS X180 matches CXOGBS J174718.2304110 (CX34), and is a hard (hardness ratio of 0.9) source. Greiss et al. (2014) find a 2MASS match with =12.3, which has a low probability () of a false match.
SBS X210, a hard source (hardness ratio of 0.8), matches CXOGBS J175414.5282150 (CX123). Wevers et al. (2016) find a likely counterpart with =18.8, and colors consistent with a reddened, distant object. The Chandra position is also consistent with a bright (8.3 mag) 24-micron MIPSGAL source (Gutermuth & Heyer, 2015).
SBS X267, a hard source (hardness ratio of 0.9), matches CXOGBS J173440.8291930 (CX242). Wevers et al. (2016) found a likely counterpart with =19.0, =20.9.
SBS X417 has hardness 0.5, and matches 3XMM J174938.6290333, as well as a Gaia source with =13.2, =3900 K, =9.2 , at kpc. This matches the AAVSO variable source GDS J1749386290333 (Watson et al., 2006).
SBS X557, or Swift J174217.6285651, is a hard source (1.0), which matches 2RXP J174217.9285649 and 3XMM J174217.8285647, and is seen in Chandra ObsID 18995, at flux levels within factor of 10 of our Swift detection. The XMM-Newton position matches 2MASS 174217802856478 (=7.1, =12.9), which has a Gaia distance (Bailer-Jones et al., 2018) of 3.2 kpc, and of 3460 K, indicating a late-type giant. Its SBS flux implies (/3.2 kpc)2 erg s-1, which is exceptionally high for RS CVn systems, indicating a probable symbiotic system.
SBS X669 is a soft (0.1) source, matching CXOGBS J173908.3282041 (CX126), the ROSAT source 1RXH J173908.2282040, and 2MASS 173908342820405 (=10.2). Greiss et al. (2014) find a high-likelihood =11 star. Wevers et al. (2016) find a high likelihood counterpart, saturated, with H=13.8. Our Swift detection (in 2 epochs) is a factor of at least 16 times brighter than the quiescent Chandra flux.
SBS X744, a hard (0.88) source, matches CXOGBS J173757.3275213 (CX167), and is 8 times brighter in the single SBS detection. 2MASS 173757322752137 (=8.4, =9.7) is associated with it by Greiss et al. (2014) with high probability. This matches a Gaia star with =11.4, =4000 K, =7.5 , at 92040 pc. It is also variable in the UV (Rivera Sandoval et al., in prep.) This may be an RS CVn, or a symbiotic star.
SBS X771, a hard (0.67) source, matches CXOGBS J175737.9280953 (CXB19). Wevers et al. (2016) identify a =17.8, 14.6 (saturated) very red source, with high likelihood. Greiss et al. (2014) find VVV J175737.99280952.94 to be a match at high likelihood, with =12.9, =14. A Gaia star is associated, with =15.9, kpc. This is a candidate for a symbiotic star, given the peak X-ray luminosity of erg s-1.
4.2.3 Sources without clear optical/IR counterparts
We attempt to classify most sources without optical/IR counterparts using their hardness ratio and variability.
The following objects, though they lack clear optical counterparts, have soft X-ray colors (quoted in parentheses, as the fraction of photons above 1.5 keV) indicating their foreground (and thus, likely chromospherically active) nature (see §3.1).
SBS X15 increased by a factor 200 from the Chandra upper limit, though it was only detected in the SBS stack. All detected photons are below 0.5 keV (so hardness is 0.0).
SBS X17 (0.25) increased by a factor compared to the Chandra upper limit, and is only clearly detected in the SBS stack, but may have shown a flare. The detection lies 15" from the unidentified ASCA source AX J1735.12930, seen at erg cm-2 s-1 (Sakano et al., 2002), which is similar to the peak SBS flux.
SBS X19 is also extremely soft (hardness 0), and highly variable (factor 62).
SBS X36 is a very soft (hardness ratio of 0.08) transient (26 times brighter than Chandra upper limit).
SBS X37 is soft (0.18) and transient (17 times brighter than Chandra upper limit).
SBS X38 is soft (0.13), without any Chandra or XMM-Newton observation yet to measure its flux variation.
SBS X64 is a soft (0.3) transient (factor 110).
SBS X113 is soft (0.18), with no Chandra observation of the region, but it matches the ROSAT source 2RXP J174522.6281732.
SBS X122 (CXOGBS J173508.2292957, CX8) is soft (0.27), and not obviously varying. 2″ away is the Tycho star TYC 6839-612, =11.6, =1.5 kpc, 4000 K, 22 , 110 . The Chandra detection is 4.8’ off-axis, which might account for the positional offset of 2″ from this counterpart.
SBS X546 is soft (0.4).
SBS X714 is soft (0.3), and matches the position of CXOGBS J175327.8295718 (CXB51).
The following sources showed hard X-ray spectra, and variation by a factor of 5 or more, compared to previous Chandra and/or XMM-Newton observations.
SBS X21 (Swift J175233.9290952) is a mysterious hard (hardness ratio of 0.86) transient (factor 24 compared to Chandra upper limit) source. Shaw et al. (2020) were unable to confirm an optical/IR counterpart, even though they used a DDT Chandra observation to obtain a precise localization during outburst. We discuss the X-ray data on this object in more detail in § 4.3.1 below.
SBS X83 is a hard (hardness ratio of 0.86) transient (factor 6, compared to a Chandra upper limit).
SBS X91, a spectrally hard source (hardness ratio of 0.73), matches the hard Chandra source 2CXO J174333.9283953 (Wang et al., 2016), and requires variability by a factor 4.
SBS X131 matches CXOGCS J174622.0285201 (Muno et al., 2006). It is hard (hardness ratio of 0.7), and varied by a factor of 30 between the Chandra and Swift fluxes.
SBS X140 is a hard (hardness ratio of 1.0) transient (varying by a factor 7 compared to the Chandra upper limits). It may be associated with the WISE YSO candidate J174310.86270154.7 (Marton et al., 2016).
SBS X195 is hard (hardness ratio of 0.86), and its SBS flux increased over the Chandra upper limit by a factor of at least 7.5.
SBS X738 (hardness ratio of 0.86) matches 2CXO J175700.5280735 (Evans et al., 2019). The Swift detection is at least 36 times the detected Chandra flux.
The following sources showed fluxes within a factor of 5 of a previous Chandra or XMM-Newton detection, and hard X-ray spectra. A relative lack of variability with a hard X-ray spectrum suggests either an AGN, or rarer hard stellar X-ray sources such as IPs, or persistent very faint X-ray binaries. We checked the positions of these sources in the Very Large Array Sky Survey 2-4 GHz continuum images (Lacy et al., 2020)161616https://science.nrao.edu/vlass/, since AGN are often radio-bright, but did not find any radio counterparts to these sources.
SBS X22, a hard source (0.72), matches CXOGBS J175322.5290535 (CX151), and is consistent with the Chandra flux. Wevers et al. (2016) identified a potential optical counterpart (with =18.9), but the likelihood ratio for this object over alternative counterparts is 1, indicating the counterpart is likely to be spurious.
SBS X24 matches CXOGBS J175253.0292209 (CX17), is hard (0.65), and consistent with the Chandra flux.
SBS X26 matches CXOGBS J175244.5285852 (CX201) and is fairly hard (0.56). Wevers et al. (2016) identified a potential optical counterpart, but the likelihood ratio is 2, so it is likely spurious.
SBS X27 matches with OGLE BLG195.7 120277, an RR Lyrae star, but RR Lyrae stars are not expected to be X-ray emitters. This is likely to be a spurious match.
SBS X66, a hard source, has a Swift flux consistent with the flux previously seen by XMM-Newton, Swift (the 1SXPS survey, Evans et al. 2014), and ROSAT.
SBS X69 matches the ROSAT source [SBM2001] 23 (Sidoli et al., 2001a), and the Chandra source CXO J174216.9283707 (Evans et al., 2019). It is hard (0.75), and not obviously varying compared to the Chandra flux.
SBS X114 matches CXOGBS J174656.0303259 (CX35), and is hard (1.0). Its flux is consistent with the Chandra flux.
SBS X124, a hard source (0.64), matches 3XMM J174917.7283329. The XMM-Newton flux may lie within a factor of 2 of the Swift flux. It may match the 2MASS and UKIDSS star UGPS J174917.66283328.7, a =11.9 source.
SBS X294, a hard source (0.83), matches CXOGBS J173808.8292216 (CX136). There is no optical counterpart with a strong likelihood of a match (Wevers et al., 2016). There is a possible association with the MIPSGAL 24 micron 8.4 mag point source MG358.7691+01.1559 (Gutermuth & Heyer, 2015), which likely matches GLIMPSE G358.7690+01.1557.
SBS X423 is hard (1.0), and matches 2RXP J175029.3285954 and CXOGBS J175029.1290002 (CX13). It is persistent; the Swift flux is consistent with the Chandra and XMM-Newton fluxes. There is no clear optical counterpart (Wevers et al., 2016).
SBS X592 is hard (1.0), and consistent in position and flux with 3XMM J173918.2292349. It may correspond to MIPSGAL source MG358.8819+00.9293, which has a 24 micron magnitude of 7.1 (Gutermuth & Heyer, 2015).
SBS X731 is a hard (1.0) source. It is probably not associated with OGLE BLG-ECL-19927, which is 12″ away, as that nearby active binary is unlikely to show a hard X-ray spectrum.
SBS X807, a hard source (0.8), matches 2XMM J175516.6293655 in position and flux.
4.3 X-ray follow-up on three sources
4.3.1 Swift J175233.9290952
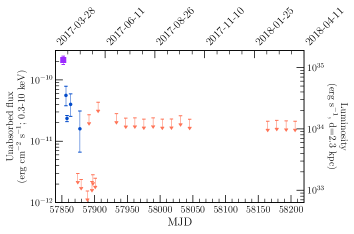
Swift J175233.9290952 (SBS X21) was first discovered in epoch 3 of the SBS (on 2017-05-04) with a Swift/XRT count rate of 0.05 ct s-1 (in the 0.5–10 keV band; Bahramian et al., 2017). We obtained a short Chandra observation on 2017-05-20 and identified a counterpart at , , with an uncertainty of 0.5 arcseconds (Maccarone et al., 2017b). Archival Chandra data (Jonker et al., 2011) showed no prior detection, indicating a flux increase of a factor 24. Follow-up Swift/XRT observations of Swift J175233.9290952 showed a steady decline over 2–3 weeks, with no later detections (Fig. 6).
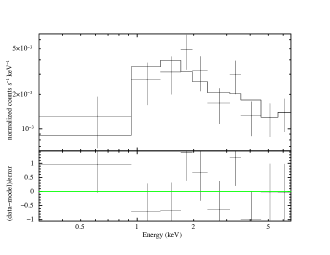
We extracted an X-ray spectrum from all Swift/XRT observations in which the source was detected (all in PC mode) using the Swift/XRT automated pipeline171717https://www.swift.ac.uk/user_objects/, and performed spectral analysis in the 0.3–10 keV band using Xspec (version 12.10.1, Arnaud, 1996), assuming Wilms et al. (2000) abundances and Verner et al. (1996) photo-electric cross-sections (Fig. 7). The merged spectrum contains a total of counts, thus we used W-statistics for minimization (Cash, 1979).181818See https://heasarc.gsfc.nasa.gov/docs/xanadu/xspec/manual/node304.html Given the low quality of the spectrum, we modelled it with a simple absorbed power-law (TBABSPEGPWRLW in Xspec). This model provides a W-statistic of 87.4 for 98 degrees of freedom, and a null hypothesis probability (the probability that the data is drawn from the fitted model, given the goodness and degrees of freedom) of 67%. This fit indicates a hydrogen column density of cm-2, power-law photon index of , and an average unabsorbed flux of erg s-1 cm-2 in the 0.5–10 keV band.191919All uncertainties are at 90% for a single interesting parameter. The constraint on the hydrogen column density suggests that Swift J175233.9290952 is within kpc, and the very hard power-law photon index indicates that the X-ray emission is at least in part caused by non-thermal processes (like inverse-Compton scattering in X-ray binaries with L 1034 - 1036 erg s-1).
The Swift/XRT spectrum hints at the presence of an emission line around 6.3-6.9 keV. Adding a gaussian emission line component to the power-law model (TBABS[PEGPWRLW+GAUSSIAN] in Xspec) indicates a constrained line with a mean energy of keV, a line normalization of (which is not highly significant, but inconsistent with zero), and the width of the gaussian corresponds to a standard deviation of keV. Adding this line also slightly changes the constraints on and photon index to cm-2 and . However, the poor quality of the data does not allow us to robustly establish whether the line is real.
A radio observation of Swift J175233.9290952 at 10 GHz by the Karl G. Jansky Very Large Array observatory on May 13th, 2017 (three days after the last X-ray observation, Fig. 6) yielded a 3- upper limit of 15 Jy. This is more suggestive of a neutron star, rather than black hole, accretor if the source is an X-ray binary (Tetarenko et al., 2017).

4.3.2 1SXPS J174215.0291453
1SXPS J174215.0291453 (SBS X46) was detected in multiple epochs of our 2017 survey (Maccarone et al., 2017a). The combined Swift/XRT data gives a position of , , with an uncertainty of 2.9, matching 1SXPS J174215.0291453 from (Evans et al., 2014), and the soft ROSAT X-ray source 1RXS J174216.4291454 (Sidoli et al., 2001b). It is also clearly detected in 2016 XMM-Newton observations.
We used XMM-Newton spectra of the source from 2016-03-09 and 2016-08-30, produced by the XMM-Newton Processing Pipeline System (PPS) and performed spectral analysis in the 0.2-12 keV band using Xspec. We fit spectra from all EPIC detectors simultaneously for each epoch, and included a cross-instrument calibration coefficient in the model. All XMM-Newton spectra for this source contain counts, so we used statistics. No single-component model (absorbed blackbody, disk-blackbody, power-law, comptonization, or diffuse emission from hot plasma) provided a satisfactory fit. We found a two-temperature hot gas model (MEKAL in Xspec, Mewe et al., 1986; Liedahl et al., 1995) provides reasonable fits in both epochs (TBABS[MEKAL+MEKAL] in Xspec; Table 6).
We also extracted a spectrum from all the Swift/XRT observations covering the source (performed between 2012 and 2018, all in photon-counting mode) and fit it with the same model as the XMM-Newton data. The Swift/XRT spectrum contains only counts (Fig. 7). Thus we fit this data set using W-statistics for minimization. The two-temperature hot gas model fit the Swift/XRT spectrum well, but it indicates a higher plasma temperature (Table 6).
The Swift/XRT flux is higher than that from XMM-Newton, showing strong evidence for variability. However, evidence for variability within the Swift/XRT data is weak due to the low signal-to-noise ratio in the individual Swift/XRT exposures. Shaw et al. (2020) identify a late M dwarf optical counterpart with a measured Gaia (Luri et al., 2018) distance of 78 pc. This indicates that the source X-ray luminosity is variable between and erg s-1, consistent with typical luminosities for nearby chromospherically active M dwarfs.
| Date | 2016-03-09 | 2016-08-30 | 2012-2018 |
|---|---|---|---|
| Telescope | XMM-Newton | XMM-Newton | Swift/XRT |
| Obs. ID. | 0764190301 | 0764191801 | – |
| N (cm-2) | |||
| kT1 (keV) | 0.30.01 | 0.28 | 0.3 |
| Norm1 | 9.9 | 8 | 14 |
| kT2 (keV) | 1.010.05 | 0.9 | 4 |
| Norm2 | 7.7 | 6 | 19 |
| Calib. (MOS1/PN) | 0.940.08 | 1.1 | – |
| Calib. (MOS2/PN) | 0.970.08 | 0.9 | – |
| F (erg s-1 cm-2) | 2.6 | 2.4 | 5.1 |
| /D.O.F | 1.2/77 | 0.99/49 | – |
| N.H.P. (%) | 8.4 | 48 | – |
4.3.3 3XMM J174417.2293944
3XMM J174417.2293944 (SBS X374) was first detected in SBS on 2017-09-21, and is marginally detected in other epochs. This source, ′ from the bright X-ray binary 1E 1740.72942, is covered in multiple Swift, Chandra, and XMM-Newton observations. Shaw et al. (2020) noted the 8.69 day period from ASAS-SN monitoring, spectroscopically classified the visible star as a K subgiant, and used radial velocities to identify a dark companion with 1M0.4 , i.e. a WD. Shaw et al. (2020) also used the mass ratio and observed X-ray luminosity to argue that the white dwarf accretes from the subgiant via a focused wind.
We combined all relevant Swift observations to find an enhanced position of , , with an uncertainty of 23, consistent with previously catalogued sources by XMM-Newton (3XMM J174417.2293944, Rosen et al., 2016), Chandra (CXO J174417.2293943, Evans et al., 2010), and Swift (1SXPS J174417.2293946, Evans et al., 2014). We extracted spectra from all Chandra and XMM-Newton observations in which the source is entirely located on an active detector chip in imaging mode. These include 7 Chandra/ACIS-I and ACIS-S observations and 2 XMM-Newton/EPIC observations. The source is clearly detected in the XMM-Newton observations in this sample with high signal-to-noise ratio, and contamination from 1E 1740.72942 appears to be minimal. Therefore, we acquired source and background spectra produced from the XMM-Newton PPS for this source. In Chandra observations, the source is typically located at high off-axis angles. Thus, we used MARX (Davis et al., 2012) and ACIS-EXTRACT (Broos et al., 2010) to estimate the shape of the off-axis point-spread function and extract source and background spectra accordingly. Due to the low number of events per spectrum, we combined Chandra spectra from observations taken within days of each other using combine_spec in Ciao (Fruscione et al., 2006). We performed spectral analysis on every individual Chandra and XMM-Newton spectrum separately in XSPEC, in the 0.3–10 keV and 0.2-12 keV ranges respectively. All spectra were binned to have at least 15 to 50 counts per bin, and we used statistics for spectral fitting and goodness-of-fit evaluation.
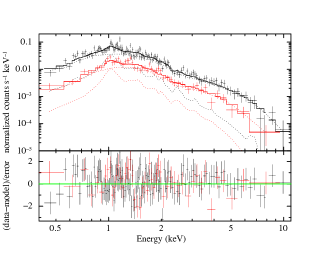
As demonstrated in Table 7, a soft absorbed power-law fits most of the data reasonably well. However, there are notable exceptions. The XMM-Newton data set from 2012 (which has the highest signal-to-noise ratio) shows a trend in the residuals around 1 keV, when fitted with a power-law (Fig. 8). This could be caused by emission from hot diffuse gas. We therefore added a second component (MEKAL in Xspec) to the model for this spectrum. This model yields a hydrogen column density of cm-2, power-law photon index of , and plasma temperature of 1.3 keV. It also reduced the fit from 218.5 (for 176 degrees of freedom in fitting a single power-law) to 186.5 (for 174 degrees of freedom). An F-test gives a probability of for obtaining this reduction in by chance, suggesting the second component is statistically significant. Testing this model on other spectra that have moderate signal-to-noise levels (e.g., XMM-Newton data from 2000-09-21 and Chandra data from 2006-06-27) suggests that a MEKAL component is present in those data sets as well (Table 7, Fig. 8). The presence of a low-temperature plasma component, giving detectable X-ray line emission around 1 keV, is typical of CVs (e.g. Baskill et al., 2005; Wada et al., 2017).
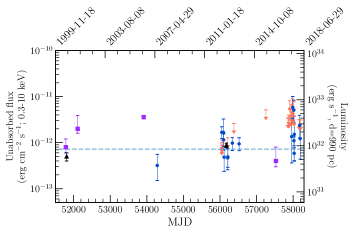
Comparing the source flux as estimated from Swift/XRT count rates along with XMM-Newton and Chandra spectra provides significant evidence that the source is strongly variable (Fig. 9). Assuming a distance of 0.99 kpc (based on the optical counterpart, Shaw et al. 2020), this indicates that the source is variable between and erg s-1. The average seems to be compatible with the calculated range of for the focused wind CV model of Shaw et al. (2020), erg s-1.
| Date | 2000-08-30 | 2000-09-21 | 2001-07-20/21 | 2006-06-27/28 & 07-01 | 2012-09-07 | 2016-05-21 |
| Telescope | Chandra | XMM-Newton | Chandra | Chandra | XMM-Newton | Chandra |
| Obs.ID. | 00658 | 0112970801 | 02278,02281,02289 | 07042, 07345, 07346 | 0694640101 | 18331, 18332, 18333 |
| N (cm-2) | ||||||
| Photon index | ||||||
| Calib. (MOS1/PN) | – | – | – | – | – | |
| Calib. (MOS2/PN) | – | – | – | – | ||
| F (erg s-1 cm-2) | ||||||
| /D.O.F | 0.5/11 | 1.1/45 | 0.98/74 | 1.6/18 | 1.2/176 | 0.3/2 |
| N.H.P (%) | 90 | 27 | 5.7 | 1.6 | 75 | |
| N (cm-2) | – | – | ||||
| kT (keV) | – | – | ||||
| Norm | – | – | ||||
| Photon index | – | – | ||||
| Calib. (MOS1/PN) | – | – | – | – | – | |
| Calib. (MOS2/PN) | – | – | – | – | ||
| F (erg s-1 cm-2) | – | – | ||||
| /D.O.F | – | 0.9/43 | 0.92/72 | 0.9/16 | 1.1/174 | – |
| N.H.P (%) | – | 56 | 66 | 60 | 24 | – |
| F-Test probability(%) | – | 1.2 | 3.8 | 0.3 | – |
5 Discussion
5.1 Classes of objects
We first enumerate the numbers of different classes of objects we have identified so far: 104 sources, minus 13 due to optical loading, gives 91 real X-ray sources. 35 of these sources are substantially (factor 5) brighter in at least one SBS epoch, compared to Chandra or XMM-Newton archival data. 45 are known sources:
-
•
12 XRBs
-
•
5 CVs
-
•
3 symbiotics
-
•
4 candidate CVs or XRBs
-
•
17 chromospherically active stellar X-ray sources.
-
•
1 young star cluster, 2 radio pulsars
-
•
1 AGN
46 sources of unknown nature:
-
•
6 sources with secure optical counterparts which are likely produced by chromospheric activity. These are SBS X 136, 148, 180, 417, 669, 744.
-
•
8 sources with secure optical counterparts which are likely accretion-fed (LMXBs, CVs, symbiotics, or AGN) in nature.
-
•
11 soft foreground sources not securely associated with stars, but likely produced by chromospheric activity. The lack of a secure optical association may often be due to a lack of a subarcsecond (Chandra) X-ray position. Many of these show dramatic X-ray flaring, up to more than a factor of 100.
-
•
13 hard persistent sources, which must be luminous and distant. A large fraction of these, perhaps most, are likely AGN, though other natures–e.g. IPs or X-ray binaries–are possible.
-
•
7 hard sources that clearly increased in flux by a factor 5. We suggest the majority of these are very faint X-ray binaries.
5.2 Expected and observed populations of AGN, CVs, ABs
We can estimate the numbers of several different populations that we expect among our X-ray sources using prior population estimates. We take a rough estimate of our (stacked) X-ray flux sensitivity as (2–10 keV) erg s-1 cm-2. We predict, from Ueda et al. (1998), AGN deg-2 at this flux level, thus about 10 AGN in our survey field.
How can we identify these AGN? AGN (in the direction of the Galactic bulge) will typically be extinguished by of order cm-2, thus should be relatively hard X-ray sources with the majority of counts above 1.5 keV. All AGN seem to be variable in X-rays, but typical variability in the hard X-rays on month timescales seems to be around 30%, up to a factor of 3 for the narrow-line Seyfert 1 class, or up to 10 in the more variable soft X-rays (Ulrich et al., 1997; Gaskell & Klimek, 2003; Paolillo et al., 2004). Observations of AGN in the Chandra Deep Fields found that variation of 4 in were very rare (Yang et al., 2016; Zheng et al., 2017). Strotjohann et al. (2016) found that 5% of a sample of AGN observed with both ROSAT and the XMM-Newton Slew Survey varied by a factor of 10 in the soft band. We consider that AGN varying by 10 in 2–10 keV will be rare.
Although we only securely identify one AGN in our sample, we suspect that many, perhaps the majority, of the 13 hard persistent sources are likely to be AGN . This would be consistent with the predictions above.
We expect some cataclysmic variables within our survey field. Jonker et al. (2011) predicts 5 IPs at our flux levels within 16 square degrees, which should have optical counterparts of (Britt et al., 2014) if seen under relatively low extinction, cm-2. The brightest IPs (at erg s-1) may be visible at Galactic Centre distances. Indeed, we find 5 known CVs in our field, plus another 4 candidate CVs or XRBs.
Chromospherically active binaries will generally be lower-, and visible at shorter distances. Jonker et al. (2011) suggest RS CVn binaries pc-3, which with a typical erg s-1, suggests a maximum distance of 300 pc, with about 4 in our survey (at , Britt et al. 2014). The population synthesis of Warwick (2014) predicts the number of X-ray detected ABs in Galactic plane fields at (2–10 keV) erg s-1 cm-2 to be 1/2 the number of CVs, and 1/6 the number of XRBs, suggesting the number of detected ABs should be 10 (based on the numbers of other categories). However, we find 17 secure ABs, 12 foreground sources that are probably mostly or all ABs, as well as 13 sources with optical counterparts of uncertain nature, suggesting a total of 30-40 ABs in our sample.
The population syntheses mentioned do not consider flares, which we appear to be seeing in abundance, as 2/3 of the known chromospherically active stars in our sample with prior Chandra or XMM-Newton observations were seen to be flaring by a factor of 5 or more. Soft foreground sources not identified with stars tended to have even stronger flares; 7 of 10 with prior Chandra/XMM-Newton imaging flared by a factor of 10 or more, with three flaring by over a factor of 100. We interpret this as a selection effect; stars that flare from initially lower X-ray fluxes up to our flux limit may not be detected by Chandra in short observations in quiescence, and thus are harder to confidently identify with their optical counterparts (as their error radii are larger).
5.3 Predicted population of VXFTs in the bulge
The Swift Galactic Bulge Survey was inspired in large part by the identifications of a number of VFXTs in the long-running Swift/XRT survey of the Galactic Centre (Degenaar & Wijnands, 2009, 2010; Degenaar et al., 2013, 2015). Here we assume that X-ray binaries are distributed uniformly in stellar mass, calculate the expected number of both bright and fainter (VFXT) transients that we might detect in our survey based on the Galactic Centre studies above, and compare it to our actual results, to see if the Galactic Centre is unusual. The Galactic Centre Swift survey largely used daily 1-ks observations, allowing high-quality light curves of each detected X-ray outburst. We used PIMMS202020http://asc.harvard.edu/toolkit/pimms.jsp to calculate the 2–10 keV X-ray luminosities of each observation of an outburst within the first 4 years of the Swift program (Degenaar & Wijnands, 2010), along with the peak and average LX values. We separated the outbursts into three classes: Bright (peak erg s-1), Very Faint A (peak erg s-1), and Very Faint B (peak erg s-1). Note that some LMXBs exhibit two, or all three, types of outburst at different times (Degenaar & Wijnands, 2009, 2010). We used the Galactic mass model of Launhardt et al. (2002) to estimate the mass covered by the Galactic Centre Swift pointings, and thus calculated the rate of each type of outburst per stellar mass.
We then modeled each of the 163 pointings of SBS (in the 2017 season) to predict the number of outbursts expected to be detectable from our survey. We created fake light curves corresponding to actual light curves of known Galactic Centre transients at random times, distributed uniformly by Galactic stellar mass (using the Launhardt model), with count rates calculated using the model LX at that point in the outburst, and the NH estimated by Schlegel et al. (1998) in that direction. We performed simulations of the SBS survey.
We used this model to test the expected numbers of detections of bright, ‘very faint A’, and ‘very faint B’ outbursts expected with our observational setup, assuming straightforward scaling of X-ray binaries by stellar mass. The median results were a prediction of 24 bright outbursts, 4.7 ‘very faint A’ outbursts, and 0.9 ‘very faint B’ outbursts. Comparing this to our observations, we see that of the 12 SBS sources associated with known LMXBs, we find 8 to be bright ( erg s-1), 6 of which are persistent through our observations; 3 ‘very faint A’ outbursts ( erg s-1); and 1 ‘very faint B’ outburst ( erg s-1, from GRO J174428). However, we also see seven hard transient sources, which may be ‘very faint B’ LMXB outbursts, though there are other possibilities. Overall, we find that our modeling reasonably represents our detection rates of ‘very faint A’ and ‘very faint B’ outbursts, but predicts too many bright outbursts, compared to what we actually see. This could indicate an excess of bright X-ray binaries at the Galactic Centre, compared to the Bulge regions we are studying here.
We also modeled different observing strategies to attempt to increase the number of ‘very faint A’ and ‘very faint B’ outbursts that can be detected with a similar observation time (relevant for planning future surveys). We found that a strategy of spacing the pointings farther apart to minimize overlaps, while increasing the time per pointing from 60 to 120 seconds (thus from 45 to 105 seconds average exposure, accounting for slew and settle times), gave significantly higher probabilities of detecting ‘very faint B’ transients, and of detecting ‘very faint A’ transients during the tails of their outbursts (as they tend to spend significantly longer with erg s-1 than above it). Using a biweekly observation scheme with 142 pointings, rather than 163, over 19 epochs predicts a total of 14 bright outburst detections (similar to that predicted for the 2017 season), but with 6-7 ‘very faint A’, and 1.4 ‘very faint B’ detections, predicted. The very faint numbers are 40-50% more than obtained with the 2017 60-second exposure plans as listed above (though these small numbers would be subject to Poisson fluctuations). We tested this new deeper-exposure plan in the last few cycles of the 2017-18 Swift Bulge Survey, in Feb-March 2018, and encountered no problems. We implemented this new system in our 2019 observations of the SBS.
5.4 Symbiotic systems
Finally, we note that we have identified a substantial number of possible symbiotic systems. We use the terminology “symbiotic star” to indicate a white dwarf accretor, “symbiotic X-ray binary” for a neutron star or black hole accretor, and “symbiotic system” where the accretor nature is uncertain. In our survey, these include the likely symbiotic X-ray binaries SBS X4 and SBS X9, the hybrid CV/symbiotic star SBS X374, and the strong candidate symbiotic systems SBS X707, X97, X109, X557, and X771. Symbiotic stars may also be present among the remaining 10 sources with optical counterparts of unknown nature, the 7 hard transients, and possibly the 13 hard persistent systems.
Existing models of the symbiotic star population in the Galaxy (e.g. Lü et al. 2006) do not estimate the X-ray luminosity of symbiotic stars. However, if we take the Lü et al. (2006) estimate of the total number of symbiotic stars in the Galaxy (–), and use the local stellar density (0.1 stars pc-3) and 200 billion stars in the Galaxy, we can estimate a space density of – symbiotic stars pc-3. If we assume a peak X-ray luminosity of erg s-1(and thus a maximum distance of 3 kpc, as our faintest SBS sources are around erg s-1 cm-2), then our 16 square degrees gives us a volume of pc3, and 0.2 symbiotic stars predicted (where is the fraction that reach this ). At erg s-1, we are sensitive to objects in the denser Bulge, at least in the less extinguished regions; this gives us access to 6% of the stars in the Galaxy (Jonker et al., 2011). Symbiotic stars are not thought to reach erg s-1 in hard X-rays, except during rare nova explosions (Mukai et al., 2008), so it seems unlikely to us that symbiotic stars in the Bulge contribute signficantly. A larger population of X-ray detectable symbiotic stars at lower accretion rate has recently been suggested (van den Berg et al., 2006; Hynes et al., 2014; Mukai et al., 2016), based on the idea that accretion rates below /yr can give high X-ray efficiency without reaching the bolometric accretion luminosity of 10 necessary for optical identification of a symbiotic star. A substantial number of symbiotic stars at distances 1-3 kpc in our survey would give strong support for this hypothesis.
Alternatively, symbiotic X-ray binaries can provide erg s-1 or more. Lü et al. (2012) predict a total Galactic population of 100–1000 symbiotic X-ray binaries. Lü et al. (2012) predict most to have erg s-1, but do not study whether this accretion is steady, or may occur in (wind clump-induced) flares. UV observations (e.g. Rivera Sandoval et al. in prep.) will be especially helpful in investigating potential nearby symbiotic systems, as accreting white dwarfs should produce a substantial UV excess.
6 Conclusion
The Swift Bulge Survey covered 16 square degrees of the Galactic Bulge in 19 epochs, using 60-second Swift/XRT exposures. The data were taken at 2-week intervals during April-Oct 2017, and Feb-March 2018. This allows us to probe faint transient X-ray behaviour, at fluxes below those detectable by all-sky monitors, across a significant fraction of our galaxy. We identify 104 clear Swift/XRT detections, 13 of which we attribute to optical loading of the detectors, and thus 91 significant X-ray sources. 25 of these sources varied by a factor of 10 or more (generally in comparison to archival Chandra or XMM data), and another 14 by at least a factor of 5. Since many of our Swift detections had large error bars, and not all sources were covered by archival data, the true fraction of our sample that are transients is probably significantly higher.
We can identify 45 of these sources as known categories of X-ray sources: X-ray binaries, cataclysmic variables, symbiotic systems, chromospherically active stars, radio pulsars, an AGN, and a young star cluster. We include detailed X-ray spectroscopy of several objects of particular interest, including the bursting X-ray transient IGR J174452747 (which we and Shaw et al. 2020 argue is a symbiotic X-ray binary with a low field), and a subgiant star in a 8.7 day orbital period with a white dwarf (which we and Shaw et al. 2020 argue is a focused-wind system, in between a CV and a symbiotic star).
Another 46 sources do not have certain classifications yet. We use their hardness ratios, partial information about their optical/infrared counterparts, and measurements of how much their flux has increased compared to quiescence (Chandra or XMM-Newton data), to suggest that these include a mixture of AGN, chromospherically active stars, symbiotic stars, and LMXBs undergoing very faint outbursts. Our survey found 4 detections of known LMXBs when erg s-1, proof that we are sensitive to VFXT behaviour. We have also found at least 7 unknown hard X-ray sources that showed outbursts by at least a factor of 5, without obvious optical/infrared counterparts, suggestive of distant, luminous X-ray transients in our Galaxy. Our 2019 run of the SBS, with longer (120 s) exposures, detected more very faint transients (which will be described elsewhere).
Several hard X-ray transients with bright optical/infrared counterparts, often at several kpc distances, may be symbiotic systems. Detailed studies of these systems can test this hypothesis.
In addition to the Swift/XRT survey, the SBS survey also provided a survey in the direction of the Galactic Bulge with the UVOT telescope in several UV filters, enabling the detection of UV transients (Rivera Sandoval et al., in prep.).
Data Availability
All the data presented/used in this work are publicly available. All the Swift data are publicly accessible through the HEASARC portal (https://heasarc.gsfc.nasa.gov/db-perl/W3Browse/w3browse.pl) and the UK Swift Science Data Centre (https://www.swift.ac.uk/archive/index.php). All the software packages used in this work are open-source and publicly available (see below).
Acknowledgements
We thank the anonymous referee for their helpful suggestions. AB thanks John Good for helpful discussions and James C. A. Miller-Jones for support during this project. TJM and LERS thank NASA for support under grant 80NSSC17K0334. COH, GRS and AJT acknowledge support from Natural Sciences and Engineering Research Council of Canada (NSERC) Discovery Grants (RGPIN-2016-04602 and RGPIN-06569-2016 respectively), and a Discovery Accelerator Supplement for COH. ND is supported by a Vidi grant from the Netherlands Organization for Scientific Research (NWO). PAE acknowleges UKSA support. AJT acknowledges support for this work through an NSERC Post-Graduate Doctoral Scholarship (PGSD2-490318-2016). JS acknowledges support from a Packard Fellowship. We acknowledge extensive use of NASA’s Astrophysics Data System Bibliographic Services, Arxiv, SIMBAD (Wenger et al., 2000) and Vizier (Ochsenbein et al., 2000).
We have made use of available archival data from Chandra, XMM-Newton and Swift.
This research has used the following software packages: Astropy (Astropy Collaboration et al., 2013b, 2018), BXA (Buchner et al., 2014), HEASOFT (Nasa High Energy Astrophysics Science Archive Research Center, 2014), IPython (Perez & Granger, 2007), Jupyter (Kluyver et al., 2016), Matplotlib (Hunter, 2007), MultiNest (Feroz et al., 2019), Numpy (Oliphant, 2006; van der Walt et al., 2011), SAOImage DS9 (Joye & Mandel, 2003), XSPEC (Arnaud, 1996).
References
- Armas Padilla et al. (2013) Armas Padilla M., Degenaar N., Russell D. M., Wijnands R., 2013, MNRAS, 428, 3083
- Armas Padilla et al. (2018) Armas Padilla M., Ponti G., De Marco B., Muñoz-Darias T., Haberl F., 2018, MNRAS, 473, 3789
- Arnaud (1996) Arnaud K. A., 1996, in ASP Conf. Ser. 101: Astronomical Data Analysis Software and Systems V. p. 17
- Arur & Maccarone (2018) Arur K., Maccarone T. J., 2018, MNRAS, 474, 69
- Astropy Collaboration et al. (2013a) Astropy Collaboration et al., 2013a, A&A, 558, A33
- Astropy Collaboration et al. (2013b) Astropy Collaboration et al., 2013b, A&A, 558, A33
- Astropy Collaboration et al. (2018) Astropy Collaboration et al., 2018, AJ, 156, 123
- Bahramian et al. (2013) Bahramian A., Heinke C. O., Sivakoff G. R., Gladstone J. C., 2013, ApJ, 766, 136
- Bahramian et al. (2014) Bahramian A., Gladstone J. C., Heinke C. O., Wijnands R., Kaur R., Altamirano D., 2014, MNRAS, 441, 640
- Bahramian et al. (2017) Bahramian A., et al., 2017, The Astronomer’s Telegram, 10355
- Bailer-Jones et al. (2018) Bailer-Jones C. A. L., Rybizki J., Fouesneau M., Mantelet G., Andrae R., 2018, AJ, 156, 58
- Baskill et al. (2005) Baskill D. S., Wheatley P. J., Osborne J. P., 2005, MNRAS, 357, 626
- Bernardini et al. (2012) Bernardini F., de Martino D., Falanga M., Mukai K., Matt G., Bonnet-Bidaud J.-M., Masetti N., Mouchet M., 2012, A&A, 542, A22
- Bertin et al. (2002) Bertin E., Mellier Y., Radovich M., Missonnier G., Didelon P., Morin B., 2002, in Bohlender D. A., Durand D., Handley T. H., eds, Astronomical Society of the Pacific Conference Series Vol. 281, Astronomical Data Analysis Software and Systems XI. p. 228
- Bird et al. (2007) Bird A. J., et al., 2007, ApJ Supp, 170, 175
- Bird et al. (2010) Bird A. J., et al., 2010, ApJ Supp, 186, 1
- Borozdin et al. (1998) Borozdin K. N., Revnivtsev M. G., Trudolyubov S. P., Aleksandrovich N. L., Sunyaev R. A., Skinner G. K., 1998, Astronomy Letters, 24, 435
- Bower et al. (2005) Bower G. C., Roberts D. A., Yusef-Zadeh F., Backer D. C., Cotton W. D., Goss W. M., Lang C. C., Lithwick Y., 2005, ApJ, 633, 218
- Bradley et al. (2019) Bradley L., et al., 2019, astropy/photutils: v0.6, doi:10.5281/zenodo.2533376, https://doi.org/10.5281/zenodo.2533376
- Britt et al. (2013) Britt C. T., et al., 2013, ApJ, 769, 120
- Britt et al. (2014) Britt C. T., et al., 2014, ApJ Supp, 214, 10
- Broos et al. (2010) Broos P. S., Townsley L. K., Feigelson E. D., Getman K. V., Bauer F. E., Garmire G. P., 2010, ApJ, 714, 1582
- Brunschweiger et al. (2009) Brunschweiger J., Greiner J., Ajello M., Osborne J., 2009, A&A, 496, 121
- Buchner et al. (2014) Buchner J., et al., 2014, A&A, 564, A125
- Burrows et al. (2005) Burrows D. N., et al., 2005, Space Sci. Rev., 120, 165
- Cash (1979) Cash W., 1979, ApJ, 228, 939
- Chakrabarty et al. (2017) Chakrabarty D., Jonker P. G., Markwardt C. B., 2017, The Astronomer’s Telegram, 10395
- Comerón & Pasquali (2005) Comerón F., Pasquali A., 2005, A&A, 430, 541
- Cornelisse et al. (2002) Cornelisse R., Verbunt F., in’t Zand J. J. M., Kuulkers E., Heise J., 2002, A&A, 392, 931
- Corral-Santana et al. (2013) Corral-Santana J. M., Casares J., Muñoz-Darias T., Rodríguez-Gil P., Shahbaz T., Torres M. A. P., Zurita C., Tyndall A. A., 2013, Science, 339, 1048
- Coti Zelati et al. (2018) Coti Zelati F., Rea N., Pons J. A., Campana S., Esposito P., 2018, MNRAS, 474, 961
- Davis et al. (2012) Davis J. E., et al., 2012, in Space Telescopes and Instrumentation 2012: Ultraviolet to Gamma Ray. p. 84431A, doi:10.1117/12.926937
- De Cesare et al. (2007) De Cesare G., Bazzano A., Martínez Núñez S., Stratta G., Tarana A., Del Santo M., Ubertini P., 2007, MNRAS, 380, 615
- Degenaar & Wijnands (2009) Degenaar N., Wijnands R., 2009, A&A, 495, 547
- Degenaar & Wijnands (2010) Degenaar N., Wijnands R., 2010, A&A, 524, A69
- Degenaar & Wijnands (2012) Degenaar N., Wijnands R., 2012, MNRAS, 422, 581
- Degenaar et al. (2008) Degenaar N., Wijnands R., Muno M., 2008, The Astronomer’s Telegram, 1531, 1
- Degenaar et al. (2012) Degenaar N., Wijnands R., Cackett E. M., Homan J., in’t Zand J. J. M., Kuulkers E., Maccarone T. J., van der Klis M., 2012, A&A, 545, A49
- Degenaar et al. (2013) Degenaar N., et al., 2013, ApJ, 775, 48
- Degenaar et al. (2015) Degenaar N., et al., 2015, MNRAS, 451, 2071
- Degenaar et al. (2017) Degenaar N., Reynolds M. T., Wijnands R., Miller J. M., Kennea J. A., 2017, The Astronomer’s Telegram, 10323, 1
- Del Santo et al. (2006) Del Santo M., Sidoli L., Bazzano A., Cocchi M., De Cesare G., Paizis A., Ubertini P., 2006, A&A, 456, 1105
- Evans et al. (2010) Evans I. N., et al., 2010, ApJ Supp, 189, 37
- Evans et al. (2014) Evans P. A., et al., 2014, ApJ Supp, 210, 8
- Evans et al. (2015) Evans P. A., et al., 2015, MNRAS, 448, 2210
- Evans et al. (2019) Evans I. N., et al., 2019, in AAS/High Energy Astrophysics Division. AAS/High Energy Astrophysics Division. p. 114.01
- Evans et al. (2020) Evans P. A., et al., 2020, ApJ Supp, 247, 54
- Falanga et al. (2008) Falanga M., Chenevez J., Cumming A., Kuulkers E., Trap G., Goldwurm A., 2008, A&A, 484, 43
- Farrell et al. (2010) Farrell S. A., Gosling A. J., Webb N. A., Barret D., Rosen S. R., Sakano M., Pancrazi B., 2010, A&A, 523, A50
- Feroz et al. (2019) Feroz F., Hobson M. P., Cameron E., Pettitt A. N., 2019, The Open Journal of Astrophysics, 2, 10
- Figer et al. (2002) Figer D. F., et al., 2002, ApJ, 581, 258
- Finger et al. (1996) Finger M. H., Koh D. T., Nelson R. W., Prince T. A., Vaughan B. A., Wilson R. B., 1996, Natur, 381, 291
- Fortin et al. (2017) Fortin F., Chaty S., Tomsick J. A., 2017, The Astronomer’s Telegram, 10284
- Fruscione et al. (2006) Fruscione A., et al., 2006, in Society of Photo-Optical Instrumentation Engineers (SPIE) Conference Series. p. 62701V, doi:10.1117/12.671760
- Gaensler et al. (2004) Gaensler B. M., van der Swaluw E., Camilo F., Kaspi V. M., Baganoff F. K., Yusef-Zadeh F., Manchester R. N., 2004, ApJ, 616, 383
- Gaia Collaboration et al. (2016) Gaia Collaboration et al., 2016, A&A, 595, A1
- Gaia Collaboration et al. (2018) Gaia Collaboration et al., 2018, A&A, 616, A1
- Gaskell & Klimek (2003) Gaskell C. M., Klimek E. S., 2003, Astronomical and Astrophysical Transactions, 22, 661
- Gehrels et al. (2004) Gehrels N., et al., 2004, ApJ, 611, 1005
- Gomez et al. (2020) Gomez S., et al., 2020, arXiv e-prints, p. arXiv:2009.08983
- Green et al. (2015) Green G. M., et al., 2015, ApJ, 810, 25
- Greiss et al. (2014) Greiss S., et al., 2014, MNRAS, 438, 2839
- Guainazzi et al. (2011) Guainazzi M., Bianchi S., de La Calle Pérez I., Dovčiak M., Longinotti A. L., 2011, A&A, 531, A131
- Güdel & Nazé (2009) Güdel M., Nazé Y., 2009, A&A Rev., 17, 309
- Gutermuth & Heyer (2015) Gutermuth R. A., Heyer M., 2015, AJ, 149, 64
- HI4PI Collaboration et al. (2016) HI4PI Collaboration et al., 2016, A&A, 594, A116
- Halpern & Gotthelf (2010) Halpern J. P., Gotthelf E. V., 2010, The Astronomer’s Telegram, 2681, 1
- Heinke et al. (2005) Heinke C. O., Grindlay J. E., Edmonds P. D., Cohn H. N., Lugger P. M., Camilo F., Bogdanov S., Freire P. C., 2005, ApJ, 625, 796
- Heinke et al. (2009) Heinke C. O., Tomsick J. A., Yusef-Zadeh F., Grindlay J. E., 2009, ApJ, 701, 1627
- Heinke et al. (2010) Heinke C. O., et al., 2010, ApJ, 714, 894
- Heinke et al. (2015) Heinke C. O., Bahramian A., Degenaar N., Wijnand s R., 2015, MNRAS, 447, 3034
- Heinke et al. (2019a) Heinke C. O., et al., 2019a, The Astronomer’s Telegram, 12751, 1
- Heinke et al. (2019b) Heinke C. O., et al., 2019b, The Astronomer’s Telegram, 12843, 1
- Heinke et al. (2020) Heinke C. O., Rivera Sandoval L., Maccarone T. J., Kennea J., Bahramian A., Strader J., Sivakoff G., 2020, The Astronomer’s Telegram, 13648, 1
- Hofmann et al. (2018) Hofmann F., Ponti G., Haberl F., Clavel M., 2018, A&A, 615, L7
- Høg et al. (2000) Høg E., et al., 2000, A&A, 355, L27
- Hunter (2007) Hunter J. D., 2007, Computing In Science & Engineering, 9, 90
- Hynes et al. (2012) Hynes R. I., et al., 2012, ApJ, 761, 162
- Hynes et al. (2014) Hynes R. I., et al., 2014, ApJ, 780, 11
- Ivanova et al. (2013) Ivanova N., et al., 2013, A&A Rev., 21, 59
- Jonker et al. (2011) Jonker P. G., et al., 2011, ApJ Supp, 194, 18
- Jonker et al. (2014) Jonker P. G., et al., 2014, ApJ Supp, 210, 18
- Joye & Mandel (2003) Joye W. A., Mandel E., 2003, New Features of SAOImage DS9. Astronomical Society of the Pacific, p. 489
- Kaur et al. (2010) Kaur R., Wijnands R., Paul B., Patruno A., Degenaar N., 2010, MNRAS, 402, 2388
- Kennea et al. (2017) Kennea J. A., et al., 2017, The Astronomer’s Telegram, 10273
- Kennea et al. (2018) Kennea J. A., Coe M. J., Evans P. A., Waters J., Jasko R. E., 2018, ApJ, 868, 47
- Kennedy et al. (2017) Kennedy M. R., Garnavich P. M., Littlefield C., Callanan P., Mukai K., Aadland E., Kotze M. M., Kotze E. J., 2017, MNRAS, 469, 956
- King (2000) King A. R., 2000, MNRAS, 315, L33
- King & Wijnands (2006) King A. R., Wijnands R., 2006, MNRAS, 366, L31
- Klingler et al. (2018) Klingler N., Kargaltsev O., Pavlov G. G., Ng C. Y., Beniamini P., Volkov I., 2018, ApJ, 861, 5
- Kluyver et al. (2016) Kluyver T., et al., 2016, in Loizides F., Schmidt B., eds, Positioning and Power in Academic Publishing: Players, Agents and Agendas. pp 87 – 90
- Knevitt et al. (2014) Knevitt G., Wynn G. A., Vaughan S., Watson M. G., 2014, MNRAS, 437, 3087
- Knigge et al. (2011) Knigge C., Baraffe I., Patterson J., 2011, ApJ Supp, 194, 28
- Krimm et al. (2013) Krimm H. A., et al., 2013, ApJ Supp, 209, 14
- Kuulkers et al. (2007) Kuulkers E., et al., 2007, A&A, 466, 595
- Lacy et al. (2020) Lacy M., et al., 2020, PASP, 132, 035001
- Landi et al. (2007) Landi R., et al., 2007, The Astronomer’s Telegram, 1273, 1
- Launhardt et al. (2002) Launhardt R., Zylka R., Mezger P. G., 2002, A&A, 384, 112
- Law & Yusef-Zadeh (2004) Law C., Yusef-Zadeh F., 2004, ApJ, 611, 858
- Liedahl et al. (1995) Liedahl D. A., Osterheld A. L., Goldstein W. H., 1995, ApJL, 438, L115
- Lin et al. (2012) Lin D., Webb N. A., Barret D., 2012, ApJ, 756, 27
- Lotti et al. (2016) Lotti S., et al., 2016, ApJ, 822, 57
- Lü et al. (2006) Lü G., Yungelson L., Han Z., 2006, MNRAS, 372, 1389
- Lü et al. (2012) Lü G. L., Zhu C. H., Postnov K. A., Yungelson L. R., Kuranov A. G., Wang N., 2012, MNRAS, 424, 2265
- Luri et al. (2018) Luri X., et al., 2018, A&A, 616, A9
- Lutovinov et al. (2001) Lutovinov A. A., Grebenev S. A., Pavlinsky M. N., Sunyaev R. A., 2001, Astronomy Letters, 27, 501
- Lutovinov et al. (2015) Lutovinov A. A., et al., 2015, Astronomy Letters, 41, 179
- Maccarone & Patruno (2013) Maccarone T. J., Patruno A., 2013, MNRAS, 428, 1335
- Maccarone et al. (2015) Maccarone T. J., et al., 2015, arXiv e-prints, p. arXiv:1501.02769
- Maccarone et al. (2017a) Maccarone T. J., et al., 2017a, The Astronomer’s Telegram, 10419
- Maccarone et al. (2017b) Maccarone T. J., et al., 2017b, The Astronomer’s Telegram, 10428
- Maccarone et al. (2019) Maccarone T. J., Bahramian A., Sivakoff G., Heink C., 2019, The Astronomer’s Telegram, 12932, 1
- Marino et al. (2019) Marino A., et al., 2019, A&A, 627, A125
- Marti et al. (1998) Marti J., Mirabel I. F., Chaty S., Rodriguez L. F., 1998, A&A, 330, 72
- Marton et al. (2016) Marton G., Tóth L. V., Paladini R., Kun M., Zahorecz S., McGehee P., Kiss C., 2016, MNRAS, 458, 3479
- Mereminskiy et al. (2017a) Mereminskiy I. A., Filippova E. V., Krivonos R. A., Grebenev S. A., Burenin R. A., Sunyaev R. A., 2017a, Astronomy Letters, 43, 167
- Mereminskiy et al. (2017b) Mereminskiy I. A., Grebenev S. A., Sunyaev R. A., 2017b, Astronomy Letters, 43, 656
- Mereminskiy et al. (2017c) Mereminskiy I. A., Grebenev S. A., Krivonos R. A., 2017c, The Astronomer’s Telegram, 10073, 1
- Mereminskiy et al. (2017d) Mereminskiy I. A., Grebenev S. A., Krivonos R. A., Chelovekov I. V., Sunyaev R. A., 2017d, The Astronomer’s Telegram, 10256
- Mewe et al. (1986) Mewe R., Lemen J. R., van den Oord G. H. J., 1986, A&AS, 65, 511
- Minniti et al. (2017) Minniti D., Lucas P., VVV Team 2017, VizieR Online Data Catalog, p. II/348
- Moretti et al. (2005) Moretti A., et al., 2005, in Siegmund O. H. W., ed., Proc. SPIEVol. 5898, UV, X-Ray, and Gamma-Ray Space Instrumentation for Astronomy XIV. pp 360–368, doi:10.1117/12.617164
- Mori et al. (2005) Mori H., Maeda Y., Pavlov G. G., Sakano M., Tsuboi Y., 2005, Advances in Space Research, 35, 1137
- Mukai (2017) Mukai K., 2017, PASP, 129, 062001
- Mukai et al. (2008) Mukai K., Orio M., Della Valle M., 2008, ApJ, 677, 1248
- Mukai et al. (2016) Mukai K., et al., 2016, MNRAS, 461, L1
- Muno et al. (2005a) Muno M. P., Pfahl E., Baganoff F. K., Brandt W. N., Ghez A., Lu J., Morris M. R., 2005a, ApJL, 622, L113
- Muno et al. (2005b) Muno M. P., Lu J. R., Baganoff F. K., Brandt W. N., Garmire G. P., Ghez A. M., Hornstein S. D., Morris M. R., 2005b, ApJ, 633, 228
- Muno et al. (2006) Muno M. P., et al., 2006, ApJL, 636, L41
- Nakashima et al. (2010) Nakashima S., Nobukawa M., Tsuru T. G., Koyama K., Uchiyama H., 2010, PASJ, 62, 971
- Nasa High Energy Astrophysics Science Archive Research Center (2014) Nasa High Energy Astrophysics Science Archive Research Center 2014, HEAsoft: Unified Release of FTOOLS and XANADU, Astrophysics Source Code Library (ascl:1408.004)
- Natalucci et al. (2014) Natalucci L., et al., 2014, ApJ, 780, 63
- Negoro et al. (2016) Negoro H., et al., 2016, PASJ, 68, S1
- Negueruela & Schurch (2007) Negueruela I., Schurch M. P. E., 2007, A&A, 461, 631
- Ochsenbein et al. (2000) Ochsenbein F., Bauer P., Marcout J., 2000, A&AS, 143, 23
- Oliphant (2006) Oliphant T. E., 2006, A guide to NumPy. Vol. 1, USA: Trelgol Publishing
- Paolillo et al. (2004) Paolillo M., Schreier E. J., Giacconi R., Koekemoer A. M., Grogin N. A., 2004, ApJ, 611, 93
- Papitto et al. (2014) Papitto A., Torres D. F., Rea N., Tauris T. M., 2014, A&A, 566, A64
- Parikh et al. (2018) Parikh A. S., Wijnands R., Degenaar N., Altamirano D., 2018, The Astronomer’s Telegram, 11869, 1
- Patterson & Raymond (1985) Patterson J., Raymond J. C., 1985, ApJ, 292, 535
- Pavlinsky et al. (1994) Pavlinsky M. N., Grebenev S. A., Sunyaev R. A., 1994, ApJ, 425, 110
- Perez & Granger (2007) Perez F., Granger B. E., 2007, Computing in Science Engineering, 9, 21
- Pfahl et al. (2002) Pfahl E., Rappaport S., Podsiadlowski P., 2002, ApJL, 571, L37
- Pojmanski (1997) Pojmanski G., 1997, Acta Astron., 47, 467
- Ponti et al. (2012) Ponti G., Fender R. P., Begelman M. C., Dunn R. J. H., Neilsen J., Coriat M., 2012, MNRAS, 422, L11
- Ponti et al. (2015) Ponti G., et al., 2015, MNRAS, 446, 1536
- Ponti et al. (2018) Ponti G., et al., 2018, MNRAS, 473, 2304
- Roming et al. (2005) Roming P. W. A., et al., 2005, Space Sci. Rev., 120, 95
- Rosen et al. (2016) Rosen S. R., et al., 2016, A&A, 590, A1
- Rouco Escorial et al. (2017) Rouco Escorial A., Bak Nielsen A. S., Wijnands R., Cavecchi Y., Degenaar N., Patruno A., 2017, MNRAS, 472, 1802
- Russell et al. (2017) Russell T., Degenaar N., Miller-Jones J., Tudor V., 2017, The Astronomer’s Telegram, 10106, 1
- Saji et al. (2016) Saji S., et al., 2016, PASJ, 68, S15
- Sakano et al. (2000) Sakano M., Torii K., Koyama K., Maeda Y., Yamauchi S., 2000, PASJ, 52, 1141
- Sakano et al. (2002) Sakano M., Koyama K., Murakami H., Maeda Y., Yamauchi S., 2002, ApJ Supp, 138, 19
- Sanna et al. (2017) Sanna A., D’Ai A., Bozzo E., Riggio A., Pintore F., Burderi L., Di Salvo T., Iaria R., 2017, The Astronomer’s Telegram, 10079, 1
- Sanna et al. (2018) Sanna A., et al., 2018, A&A, 616, L17
- Schlegel et al. (1998) Schlegel D. J., Finkbeiner D. P., Davis M., 1998, ApJ, 500, 525
- Schröder & Schmitt (2007) Schröder C., Schmitt J. H. M. M., 2007, A&A, 475, 677
- Schultheis et al. (2014) Schultheis M., et al., 2014, A&A, 566, A120
- Shaw et al. (2017) Shaw A. W., et al., 2017, The Astronomer’s Telegram, 10305
- Shaw et al. (2020) Shaw A. W., et al., 2020, MNRAS, 492, 4344
- Sidoli et al. (2001a) Sidoli L., Parmar A. N., Oosterbroek T., Stella L., Verbunt F., Masetti N., Dal Fiume D., 2001a, A&A, 368, 451
- Sidoli et al. (2001b) Sidoli L., Belloni T., Mereghetti S., 2001b, A&A, 368, 835
- Sidoli et al. (2011) Sidoli L., Paizis A., Mereghetti S., Götz D., Del Santo M., 2011, MNRAS, 415, 2373
- Skiff (2014) Skiff B. A., 2014, VizieR Online Data Catalog, p. B/mk
- Skinner et al. (1990) Skinner G. K., Foster A. J., Willmore A. P., Eyles C. J., 1990, MNRAS, 243, 72
- Skrutskie et al. (2006) Skrutskie M. F., et al., 2006, AJ, 131, 1163
- Soszyński et al. (2016) Soszyński I., et al., 2016, Acta Astron., 66, 405
- Stacey et al. (2011) Stacey W. S., Heinke C. O., Elsner R. F., Edmonds P. D., Weisskopf M. C., Grindlay J. E., 2011, ApJ, 732, 46
- Strohmayer & Keek (2017) Strohmayer T., Keek L., 2017, ApJL, 836, L23
- Strotjohann et al. (2016) Strotjohann N. L., Saxton R. D., Starling R. L. C., Esquej P., Read A. M., Evans P. A., Miniutti G., 2016, A&A, 592, A74
- Suleimanov et al. (2019) Suleimanov V. F., Doroshenko V., Werner K., 2019, MNRAS, 482, 3622
- Sunyaev et al. (1991) Sunyaev R., et al., 1991, ApJL, 383, L49
- Swank & Markwardt (2001) Swank J., Markwardt K., 2001, in ASP Conf. Ser. 251, New Century of X-ray Astronomy, eds. H. Inoue & H. Kunieda (San Francisco: ASP), 94
- Tauris (2012) Tauris T. M., 2012, Science, 335, 561
- Tetarenko et al. (2016) Tetarenko B. E., Sivakoff G. R., Heinke C. O., Gladstone J. C., 2016, ApJ Supp, 222, 15
- Tetarenko et al. (2017) Tetarenko A. J., et al., 2017, The Astronomer’s Telegram, 10422
- Tetarenko et al. (2020) Tetarenko A. J., Rosolowsky E. W., Miller-Jones J. C. A., Sivakoff G. R., 2020, MNRAS, 497, 3504
- Thorstensen & Halpern (2013) Thorstensen J. R., Halpern J., 2013, AJ, 146, 107
- Torii et al. (1998) Torii K., et al., 1998, ApJ, 508, 854
- Torres et al. (2006) Torres C. A. O., Quast G. R., da Silva L., de La Reza R., Melo C. H. F., Sterzik M., 2006, A&A, 460, 695
- Torres et al. (2014) Torres M. A. P., et al., 2014, MNRAS, 440, 365
- Tortosa et al. (2017) Tortosa A., et al., 2017, MNRAS, 466, 4193
- Udalski et al. (2012) Udalski A., et al., 2012, Acta Astron., 62, 133
- Ueda et al. (1998) Ueda Y., et al., 1998, Natur, 391, 866
- Ulrich et al. (1997) Ulrich M.-H., Maraschi L., Urry C. M., 1997, ARAA, 35, 445
- Vats et al. (2018) Vats S., Wijnands R., Parikh A. S., Ootes L., Degenaar N., Page D., 2018, MNRAS, 477, 2494
- Verbunt et al. (2008) Verbunt F., Pooley D., Bassa C., 2008, in E. Vesperini, M. Giersz, & A. Sills ed., IAU Symposium Vol. 246, IAU Symposium. pp 301–310 (arXiv:0710.1804), doi:10.1017/S1743921308015822
- Verner et al. (1996) Verner D. A., Ferland G. J., Korista K. T., Yakovlev D. G., 1996, ApJ, 465, 487
- Wada et al. (2017) Wada Q., Tsujimoto M., Ebisawa K., Hayashi T., 2017, PASJ, 69, 10
- Wang et al. (2016) Wang S., Liu J., Qiu Y., Bai Y., Yang H., Guo J., Zhang P., 2016, ApJ Supp, 224, 40
- Warwick (2014) Warwick R. S., 2014, MNRAS, 445, 66
- Watson et al. (2006) Watson C. L., Henden A. A., Price A., 2006, Society for Astronomical Sciences Annual Symposium, 25, 47
- Wenger et al. (2000) Wenger M., et al., 2000, A&AS, 143, 9
- Werner et al. (2004) Werner N., et al., 2004, A&A, 416, 311
- Wevers et al. (2016) Wevers T., et al., 2016, MNRAS, 458, 4530
- Wevers et al. (2017) Wevers T., et al., 2017, MNRAS, 470, 4512
- Wijnands & Degenaar (2016) Wijnands R., Degenaar N., 2016, MNRAS, 463, L46
- Wijnands & Wang (2002) Wijnands R., Wang Q. D., 2002, ApJL, 568, L93
- Wijnands et al. (2006) Wijnands R., et al., 2006, A&A, 449, 1117
- Wilms et al. (2000) Wilms J., Allen A., McCray R., 2000, ApJ, 542, 914
- Wu et al. (2015) Wu J., et al., 2015, MNRAS, 448, 1900
- Yang et al. (2016) Yang G., et al., 2016, ApJ, 831, 145
- Yusef-Zadeh & Bally (1987) Yusef-Zadeh F., Bally J., 1987, Natur, 330, 455
- Yusef-Zadeh et al. (2002) Yusef-Zadeh F., Law C., Wardle M., Wang Q. D., Fruscione A., Lang C. C., Cotera A., 2002, ApJ, 570, 665
- Zheng et al. (2017) Zheng X. C., et al., 2017, ApJ, 849, 127
- di Salvo et al. (2008) di Salvo T., Burderi L., Riggio A., Papitto A., Menna M. T., 2008, MNRAS, 389, 1851
- in ’t Zand et al. (1998) in ’t Zand J., Bazzano A., Cocchi M., Ubertini P., Muller J. M., Torroni V., 1998, IAU Circ., 6846, 2
- in’t Zand et al. (1991) in’t Zand J. J. M., et al., 1991, Advances in Space Research, 11, 187
- in’t Zand et al. (1999) in’t Zand J. J. M., et al., 1999, A&A, 345, 100
- in’t Zand et al. (2002) in’t Zand J. J. M., et al., 2002, A&A, 389, L43
- in’t Zand et al. (2003) in’t Zand J. J. M., et al., 2003, A&A, 406, 233
- in’t Zand et al. (2004) in’t Zand J., et al., 2004, Nuclear Physics B Proceedings Supplements, 132, 486
- in’t Zand et al. (2005) in’t Zand J. J. M., Cumming A., van der Sluys M. V., Verbunt F., Pols O. R., 2005, A&A, 441, 675
- in’t Zand et al. (2007) in’t Zand J. J. M., Jonker P. G., Markwardt C. B., 2007, A&A, 465, 953
- van den Berg et al. (2006) van den Berg M., et al., 2006, ApJL, 647, L135
- van der Walt et al. (2011) van der Walt S., Colbert S. C., Varoquaux G., 2011, Computing in Science & Engineering, 13, 22