Constructing interval variables via faceted Rasch measurement and multitask deep learning: a hate speech application
Chris J. Kennedy1, 2, *, Geoff Bacon1, 3,
Alexander Sahn1, 4,
Claudia von Vacano1, 5
1. D-Lab, University of California, Berkeley
2. Department of Biomedical Informatics, Harvard Medical School
3. Department of Linguistics, UC Berkeley
4. Travers Department of Political Science, UC Berkeley
5. Digital Humanities, UC Berkeley
* Corresponding author. ck37@berkeley.edu
Keywords: Rasch measurement theory, ordinal deep learning, many-facet Rasch models, multitask learning, hate speech
Version:
Abstract
We propose a general method for measuring complex variables on a continuous, interval spectrum by combining supervised deep learning with the Constructing Measures approach to faceted Rasch item response theory (IRT). We decompose the target construct, hate speech in our case, into multiple constituent components that are labeled as ordinal survey items. Those survey responses are transformed via an IRT nonlinear activation into a debiased, continuous outcome measure. Our method estimates the survey interpretation bias of the human labelers and eliminates that influence on the generated continuous measure; removing labeling bias supersedes the use of inter-rater reliability as a quality diagnostic. We further estimate the response quality of each individual labeler using faceted IRT, allowing responses from low-quality labelers to be removed.
Our faceted Rasch scaling procedure integrates naturally with a multitask, weight-sharing deep learning architecture for automated prediction on new data. The ratings on the theorized components of the target outcome are used as supervised, ordinal latent variables for the neural networks’ internal concept learning, improving sample efficiency and promoting generalizability. We test the use of a neural activation function (ordinal softmax) and loss function (ordinal cross-entropy) designed to exploit the structure of ordinal outcome variables. Our multitask architecture leads to a new form of model interpretation because each continuous prediction can be directly explained by the constituent components in the penultimate layer.
We demonstrate this new method on a dataset of 50,000 social media comments sourced from YouTube, Twitter, and Reddit and labeled by 10,000 United States-based Amazon Mechanical Turk workers to measure a continuous spectrum from hate speech to counterspeech. We evaluate Universal Sentence Encoders, BERT, and RoBERTa as language representation models for the comment text, and compare our predictive accuracy to Google Jigsaw’s Perspective API models, showing significant improvement over this standard benchmark.
1 Introduction
Across fields of knowledge (science, engineering, medicine, etc.) phenomena of interest are often labeled by humans as discrete, dichotomous variables: speech is toxic or not, an MRI scan shows cancer or is clear, a stoplight is red or green. Simple variables may be inherently binary or ordinal in nature. For example, an online advertisement might be clicked by a person viewing a webpage, or might not — a partial click between 0 and 1 does not make sense. But if a discrete variable represents a concept with complexity or granularity, those {0, 1} values may reflect the simplification of an underlying continuous spectrum or latent variable. Consider an online message that is rated for its sentiment using the discrete, ordered labels of ?positive?, ?neutral?, or ?negative? [46]. Those labels can reasonably be viewed as summarizing what is ultimately a continuous, infinitely divisible spectrum ranging from extremely negative to extremely positive sentiment.
Physical quantities such as temperature and weight can be measured as interval variables where magnitudes are meaningful: we can subtract the measurements of two units and have an estimate of distance on the original scale. We can make factual statements such as ?today’s temperature is 5 degrees warmer than yesterday? or ?I lost 10 pounds after dieting?. The development of physical measurement systems required major, long-term investments in scientific and engineering that led to a theory of those physical systems [11]. Thanks to those fixed scales we can receive a weather report with specific temperatures provided, or stand on a scale and view our current weight. But in the fields of machine learning, natural language processing, and many other areas, current practice would provide a binary prediction. As a mental exercise, what if today’s expected weather forecast were reported as two values: hot or cold? Classification models could only estimate and we might hear: ?Today’s weather forecast: expected hot, with 55% probability, but a 45% chance of being cold.? It sounds absurd, but that is how we treat many variables in science today, including our construct of interest in this paper: hate speech. ?Classification? of discrete outcome variables has seemingly become synonymous with ?supervised learning?, so rarely are continuous variables analyzed. Our question becomes: how can we aspire to emulate physical scales like temperature, which we take for granted in our daily lives, and construct interval measurements for arbitrary variables?
A method to estimate a continuous spectrum for human-generated variables could be valuable for several reasons. If the variable is recorded in order to determine the application of interventions, a continuous measurement would allow many different thresholds to be defined with varied policy prescriptions. A binary outcome would support only two policy alternatives, and research based on the binary version would lose most of its underlying value if the implicit threshold of interest changed [77]. When the construct of interest is an outcome variable, such as in a randomized trial or an observational study, having a continuous measurement will increase statistical power compared to a dichotomous or ordinal variable [15, 74]. If the variable is a confounder in a causal inference analysis, a continuous measurement would more strongly reduce residual confounding compared to a discretized version of that variable [68]. Similarly, if the variable is a pre-treatment adjustment variable in a randomized trial, the variable will more effectively improve precision if continuous rather than binary [18].
In this work we propose a methodology to construct continuous, interval variables by combining two complementary techniques: many-facet Rasch measurement, a form of item response theory, and supervised deep learning. Rasch measurement theory involves the application of a probabilistic multilevel statistical model to create continuous, interval scales out of multiple survey questions, measured as binary or ordinal variables. When those survey items (or ?components?) are completed by human test-takers we need a way to automate the human ratings for unseen future data, otherwise we would need human test-takers to review any future observation in order to create its measurement on the scale. Supervised deep learning provides an automated approximation of the human ratings by learning to predict those ratings on arbitrary new observations, which also serves as a new form of model explanation. The deep learning model can alternatively predict the continuous scale directly and skip the intermediate step of predicting the ratings. Our methodology can be applied to any variable that can be theorized as a continuous spectrum and is based on human ratings. The underlying source data is also general: it might be text, images, videos, time series, waveform, or audio. As long as the underlying data source is unstructured and reviewed by humans, the deep learning model has the potential to approximate those human ratings for automation purposes.
We apply this novel method to the measurement of hate speech, a social problem that has received extensive attention from policymakers, researchers, and firms. While existing attempts to detect hate speech use predictions derived from discrete labels, our method measures the hateful content of speech by scaling multiple labels of multiple components.
Our manuscript is structured as follows: we begin by providing background on the theoretical foundations of hate speech and previous machine learning approaches. We then describe our methodology, starting with the theoretical development of a hate speech spectrum, which is operationalized as a survey instrument, the collection of social media comments and crowdsourced labeling process, use of faceted Rasch theory to statistically transform the labeled data into an interval variable, and application of deep learning models to predict that interval variable using only the text of the comment. We next present the results of our work, which consist of the Rasch scaling followed by the deep learning performance evaluation. We conclude with a discussion of current limitations and the many possible extensions of this method. We hope that this work can help spur wider usage of Rasch measurement theory to go beyond simplified discrete variables and instead develop continuous, interval variables across fields.
2 Application to hate speech
We demonstrate the effectiveness of our method in measuring hate speech, a complex linguistic phenomenon with consequential social and political impacts. The accurate measurement of, and intervention to counter, hate speech may prevent psychological harm, dissipate extremist groups and prevent downstream violent, even genocidal events. However, the difficultly of identifying this rare and complex phenomenon has made interventions costly, error-prone, and rare.
The harm in hate speech is significant. Within niche extremist communities, hate speech serves as a mechanism for recruitment and as a radicalizing influence, building cultures of hatred that can lead to hate crimes and terrorist violence [80]. In areas with long-term ethnic conflicts, hate speech may precipitate or otherwise foment mass genocidal violence [85].
Even given the many harms of hate speech, legislation, corporate content moderation, or outright censorship to combat hate speech also cause harm. Laws intended to protect groups that are minorities in numbers within the power structure can be used against the very people they were intended to protect [78]. Research on online hate speech is often conducted behind corporate walls given the centrality of large internet firms in addressing its harms. Open, transparent, and reproducible research on hate speech is vital to balancing the relative harms of hate speech against content removal.
Computationally analyzing hate speech is a challenging task for several reasons. First, there is no consensus on a systematic definition of hate speech [73] or existing measurement instrument. Second, the scale of communication and the different linguistic forms it takes necessitates algorithmic approaches. Third, hate speech constitutes a small proportion of online communication (1% or less), making it difficult to create well-powered training datasets for algorithmic approaches. Fourth, human reviewers that generate the training data often do not agree on how to label training observations, even when given detailed criteria and intensive training to evaluate speech [38]. Finally, extremist groups often use sarcasm, ambiguity, and coded language to obscure the hateful nature of their communications, to evade moderation, and ultimately, to organize actions. The combined impact of this mixture of challenges is that we cannot currently track hate speech in a consistent manner over time.
Like many social or linguistic phenomena, definitions of hate speech are contested and vary over temporal and geographic contexts. Even if a definition were readily agreed upon, hate speech would be difficult to measure numerically. Many existing approaches use a binary theoretical construct—speech either contains hate speech or not. In identifying hate speech, whether at small, medium, or large-scale, human raters, novice or expert, label texts based on a common definition. Due to the binary construct, these labels are also frequently binary and in large-scale computational analyses, out-of-sample predictions produce a prediction along the binary construct with associated error. Table 1 summarises some prominent existing approaches, noting the number of construct levels and outcome measurement granularity. Our approach improves on the existing literature in two ways: in our integration of the hate speech and counter-speech literature, we create a theoretical construct with 8 levels, allowing for more categories of hateful content in speech. We then create a labeling instrument with 32-48 measurement levels. These levels, which are described in the labeling instrument section in detail, reduce measurement error by using multiple items per construct and allow us to accurately distinguish between the 8 theorized construct levels. We validate the measurement of these levels in section 4.2.
2.1 Prior computational work
The scale of online communications has made computational approaches a necessity for characterizing hate speech patterns. In particular, machine learning for hate speech analysis has become a well-studied topic over the past decade. Early work [[, e.g.]]warner2012detecting used simple, non-deep learning algorithms for estimation, such as naive Bayes, support vector machines, or linear regression. Text features were typically unigram TF-IDF scores, and sometimes additional syntactic features like part-of-speech tagging [17]. The field gradually transitioned to word embeddings, often pre-trained, where the best featurization approach was comment word embedding averages or paragraph embeddings [22, 54]. Those features could then be combined with gradient boosted decision trees or Bayesian additive regression trees.111These were our best results from a pilot study we completed in October 2017.
More recently there has been a shift to deep learning methods, beginning with long short-term memory networks (LSTMs), convolutional neural networks (CNNs), and gated recurrent unit networks (GRUs), that either use pre-trained word embeddings or learn their own embeddings from the raw text [4, 91]. Adding attention mechanisms to deep learning is beginning to be used in hate speech research [28], but their successor transformer units [81] have not yet been widely adopted for hate speech research.
Model-based transfer learning methods provided a further breakthrough in supervised natural language processing [70], including best in class architectures OpenAI’s GPT-2 [62], fast.ai’s ULMFiT [35], and Google’s BERT [20]. Those contextualized word representation methods are only beginning to be used in hate speech research. The algorithms column of Table 1 summarises the existing approaches in prominent previous work.
Paper Construct levels Outcome measurement granularity Measurement theory Identity categories Algorithms Obs. Platforms Ratings per comment Reviewer bias adjustment Coded language annotation [82] 2 2 CTT 1 Linear SVM 1,000 Yahoo! Groups 3 No No [17] 3 3 CTT 1 Lasso, Ridge 24,802 Twitter 3 No No [19] 3 3 CTT 3 LSTM 3,685 - 6,502 Facebook 1-3 No No [21] 2 2 CTT 30 CNNs 127,820 Wikipedia 3? No No [75] 2 2 CTT 1 Naive Bayes 25,000 Twitter, Reddit 3 No No This study 8 32 - 48 Faceted Rasch IRT 50 USE, BERT, RoBERTa 50,000 YouTube, Twitter, Reddit 4 Yes Yes
Developing a labeled corpus to produce an accurate measurement tool for hate speech on social media requires overcoming two obstacles: the rarity of hate speech across all posts and differences in linguistic styles of different social media platforms. We overcome the first challenge by pre-processing 54 million total comments with a hypothesis score model, then labeling comments from different quantiles of likely hate content. To overcome the second problem, we sample comments from three platforms: YouTube, the most used social media platform globally, Twitter, a platform with heavily political content that engage with identity, and Reddit, a longer-format forum home to some radical communities. The 50,000 labeled comments across 3 platforms form the most representative, and one of the largest training sets of hate speech data.
Reviewer reliability is a particularly difficult challenge in hate speech research. Definitional variation, along with differences in labeler knowledge, context, and ideology can result in inconsistent labels. Prior approaches refine their definition and measurement interest to try to maximize inter-coder reliability. We take a different approach, adjusting the final continuous score based on estimated labeler bias from our faceted Rasch IRT model.
3 Methods and Data
We use our method to measure hate speech, a complex social phenomenon that is difficult to define, measure, and analyze at scale. Our methodological approach begins with constructing a systematic conceptualization of hate speech in online communication, operationalized through a survey instrument, and proposes an efficient, debiased prediction algorithm using deep learning. In the following sections, we describe the process of construct theorization using a reference set of comments, the measurement of sub-constructs (components) using a labeling instrument, the crowdsourcing of labeling to a network of interlinked reviewers, the debiased scaling of labeled data using faceted Rasch measurement theory, and the integration of the Rasch model into a novel multitask deep learning architecture for debiased, explainable, interval prediction.
3.1 Construct theorization from a reference set
Hate speech has many definitions across academic disciplines, legal and regulatory doctrines, and in common vernacular. When attempting to systematically measure a social concept, ?I know it when I see it? will vary greatly on who is doing the identification: life experience, familiarity with language, and historical context all vary across individuals, whether experts or laypeople. Difficult-to-measure phenomena like hate speech are an ideal application of our method, but require careful theorization and translation to measurement instruments.
We draw from the legal definition of hate crimes in the United States that protects against discriminatory actions targeting one of the following protected groups: race, religion, ethnicity, nationality, gender, sexual orientation, gender identity, and disability. In identifying groups within these broad categories, we include subjugated groups that have been discriminated against in the United States, as well as power-dominant groups who have not. Targeting of a group or an individual on the basis of their membership in a group is common to most definitions of hate speech [73]. Not only do we adopt this convention, but we allow for intersectional or overlapping identities to be selected for further analysis. We consider intersectional identities and the possibility of compounding hate speech directed at an individual who belongs to multiple groups.
Speech can also lead to individual acts of violence and when targeted against a group, genocide and extermination. The ?dangerous speech? framework ties the effects of hateful speech to actions that it can incite [6]. Dehumanization, such as radio broadcasts in Rwanda referring to the Tutsi people as cockroaches, is directly linked to later genocidal killing of that group. Incitement towards violence is a narrowly defined concept under US law, and the dangerous speech framework that we use takes a broader view of the link between cause and effect. [73] points out that the accumulated affects of anti-Semitic or racist speech can have multi-generational impacts on the well-being of individuals in a group born long after hateful speech was original created. Given the complexities of these concepts, we focus on calls to individual violence or collective extermination, with the idea that these are the final step after expression of hate and deeming a group inferior or inhuman.
Table 2 describes the eight levels of our theorized hate speech scale. The positive levels on the scale designate hate speech of increasing severity. Unlike many existing scales, our typology includes both neutral and positive identity speech, represented by 0 and negative values, respectively. Following [76, 2], we place speech supporting the systematic killing of a specific group as the most severe form of hate speech. Viewing other types of hate speech as pathways to genocide, we pay special attention to individuals threats of violence and dehumanization that may justify violence.
Level Summary Description 5 Genocide Support for or intention of systematically killing all or a large number of a protected identity group 4 Violence Threat or support of physical force or emotional abuse intended to hurt or kill members of a protected identity group 3 Dehumanization Depriving a protected group of human-like qualities, such as comparison to an animal, insect, or disease 2 Hostility Unfriendliness or opposition to a protected identity group, such as through slurs, profantiy, or insults 1 Bias Inclination or preference against a protected identity group, including prejudice 0 Neutral Descriptive or other non-harmful references to identity groups -1 Supportive Respectful, prideful, or other solidarity-based messaging about a protected identity group(s) -2 Counterspeech Response to hate speech that seeks to undermine its impact and standing
From a manual review of social media comments, we curated a reference set, a small corpus of example text for each conceptual level. We selected 10 comments to serve as examples of each of our theoretical levels, totalling 80 comments. In concert with construct development using existing literature, we manually reviewed thousands of comments from our corpus, oversampling on comments with high hypothesis scores. We also selected reference set comments for each level that yielded a diversity of target groups, text length, and linguistic styles. Iteratively, we selected comments that we felt best exemplified levels of hate speech, and when we found ambiguities, used the comments to refine the definitions of each level. This allowed us to identify distinguishing features of speech and create measurement items to capture these distinctions. These reference set comments served two purposes: to aid in construct development by providing clear examples between levels and as empirical scaffolding to link human raters in our crowdsourced measurement. We describe the importance of the reference set for construct theorization and measure development below and its integration with linking labelers in Section 3.4.
Level Text Hate score 5. Genocidal Every g**k in #LosAngeles should be deported or killed. 2.69 4. Violence #whitepower…I’ll hang you n****r 2.55 3. Dehumanization You’re all a bunch of human cockroaches is what you are… You ch**ks… 1.51 2. Hostility Learn the fucking language you fucking useless immigrant. 1.18 1. Bias @[NAME] They are arabs. Do you need any other explanations? 0.90 0. Neutral Go get a job at Dick’s Sporting Goods and try to work at being a better person. -0.50 -1. Supportive I’m bi. And a good listener if you need a friend -2.99 -2. Counterspeech No, the chances of a muslim shooting you in America is almost nil. There are over 50K gun deaths every year christian USA… -0.82
Example comments from each level of the reference set are shown in Table 3.
3.2 Labeling instrument
In order to evaluate the comments we needed one or more human reviewers (also called ?annotators?, ?labelers?, ?judges?, ?raters?, or ?moderators?) to examine the comment text and provide data to estimate where each comment fell on each of our theorized components of hate speech. Most labeling tasks for training data give the labeler a detailed definition of the construct and then ask them to assign a binary label to each data point (e.g. designating a block of text as hate speech or not, designating whether an image contains a stop sign). This approach has to two shortcomings: labelers cannot indicate uncertainty and if the construct has multiple components that labelers differ on, the label does not indicate which element they disagree in. The approach described below overcomes both of these issues by decomposing the construct of hate speech into multiple labeling items and by giving labelers Likert-style response options to incorporate uncertainty.
The labeling instrument, similar to a a survey instrument, has three sections: 1) identity target items, which establish whether the comment targets a protected group , 2) scale items that measure the content of the comment along several distinguishing features of hate speech, and 3) a set of demographic questions asked about the labelers. The target items and scale items are asked for each of the comments that labelers review, and then are followed by the demographic items. One of the scale items, sentiment, is asked before the target items, to get one measure for items that target a non-protected group or no group at all. If no identity groups were mentioned they were not asked any remaining scale items and proceeded to the next comment. If at least one identity group was mentioned they were asked to specify the sub-identity group(s),222As described in the construct theorization section, groups consisted of the categories protected under US law (e.g., religion), while the sub-identity groups are a short list of the most commonly occurring groups within these categories (e.g., Muslims). See Appendix zz for full list of identity and sub-identity groups. and then asked the remaining scale items. All comments were also rated on a binary hate speech item sourced from [75] to allow comparison to the current best practice in binary hate- speech measurement.
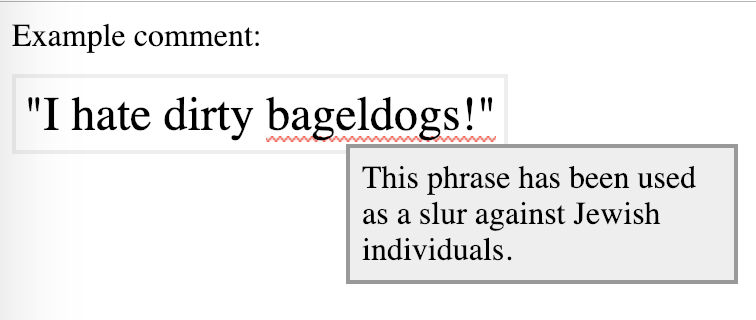
Differences in labeler knowledge and views make consistent annotations difficult to obtain. We address differences in labeler knowledge by providing a dictionary tool for niche slurs that appear in the comments we showed to labelers. Using a new dictionary, slur words were underlined in our survey user interface. If the user moved their mouse over the underlined slur word they would be shown a tooltip stating ?This word may be a slur against identity group [X]? (see Figure 1 for an example). This user interface feature was intended to reduce response variation due to varying awareness of slur terms, as well as to make noticeable any coded slur language in the comment [[, for more details on the problem of covert slurs see]]magu2017detecting.
After rating the comments reviewers were asked a series of demographic questions about themselves, followed by an optional free response feedback item. The demographic items included the reviewer’s gender, education, race, year of birth, income, religion, sexual orientation, and political ideology.
3.3 Comment collection
We sourced our comments from three major social media platforms: YouTube, Twitter, and Reddit. We chose these platforms for their popularity, as respectively, they are used by 73%, 22%, and 11% of U.S. adults [59]. Prior work on hate speech has often focused on a single platform, commonly Twitter, but our goal was to study hate speech in a variety of settings and to ultimately build an algorithmic model to accurately measure hate speech across multiple platforms [27]. We used public APIs to download recent comments posted to each site. Comments were considered eligible for labeling if they were written primarily in English and were not too short ( 4 characters) or too long ( 600 characters) after removing URLs, phone numbers and contiguous whitespace. Our comment collection took place between March and August 2019.
On Reddit we collected all comments from the real-time stream of the subreddit ?/r/all?. For Twitter, we collected tweets from Twitter’s streaming API, which is a random sample of all tweets on Twitter. YouTube required additional consideration because one must first select videos and then download comments associated with the selected videos. We searched for videos within proximity of the top 300 most populated U.S. cities in order to focus on videos originating in the U.S. and most likely to contain English comments with U.S.-based authors. From those videos we then downloaded all comments and responses.
3.4 Crowdsourced labeling
Hate speech is a rare phenomenon, estimated at less than 1% of online comments when viewed as a binary outcome, so randomly sampling from the collected comments would not have been efficient. That is, the outcome in the labeled data would be highly imbalanced at 1% hate speech and 99% non-hate speech, which would make it difficult for statistical machine learning analysis to find patterns that differentiate between hate speech and non-hate speech and costly for our labeling process. Instead, we used a sampling method that would increase the relevance of the labeled comments to our theorized levels of hate speech; we targeted an even distribution of labeled comments across our 8 levels (12.5% each). We also wanted to avoid common shortcuts to increase rates of hate speech in labeled text, such as filtering on slur terms or Twitter hashtags. Those approaches would artificially reduce the linguistic variation in the comments and allow the deep learning to learn those shortcuts (confounded associations) without capturing true patterns (i.e. causal relationships), which is known as the ?Clever Hans? effect [53, 31]. In an effort to maximize the generalizability of our deep learning algorithm, we maintained a positive probability of selection for all sampled comments (i.e. no comments would be excluded based on their word usage).
Our sampling method relied on two dimensions for stratified sampling: 1) a relevance estimate of how likely the comment was to contain a target identity group, and 2) a hypothesis score for how hateful the comment was estimated to be.
Both scores were built from a pilot set of 4,000 labeled comments, using pre-trained Universal Sentence Encoder representations (TensorFlow) plus a genetically optimized prediction head [56]. For identity prediction the genetic optimization algorithm selected a multilayer perceptron model while for the hypothesis score it selected a random forest.333In the pilot set we used simpler scores to create the stratification bins. The maximum cosine similarity to an identity-term dictionary was used for relevance estimation in the pilot. For our pilot hypothesis score we used the Perspective API’s identity attack model, which gave a predicted probability of the comment being hate speech (https://perspectiveapi.com). With each future iteration of the project we can leverage the models developed in the prior iteration to improve the stratified sampling efficiency.
We used the identity relevance and hate speech hypothesis scores to create five stratification bins: 1) irrelevant (i.e. estimated to contain no references to identity groups), 2) relevant and low on predicted hate speech score (potential counterspeech or positive identity speech), 3) relevant and moderate on predicted hate speech score (neutral), 4) relevant and high on predicted hate speech score (low or moderate intensity hate speech), and 5) relevant and very high on predicted hate speech score (violent hate speech). We heavily oversampled bins 2, 4, and 5, and undersampled bins 1 and 3. Because this stratification scheme covered all comments, each comment had a positive probability of being sampled, but we improved the likelihood of labeling comments that were some form of hate speech or counterspeech. As in a case-control study, this biased sample could be re-weighted back to the original population of comments through inverse probability weighting [33]. We incorporated platform sample size targets such that our labeled data consisted of 40% sourced from Reddit, 40% from Twitter, and 20% from YouTube.
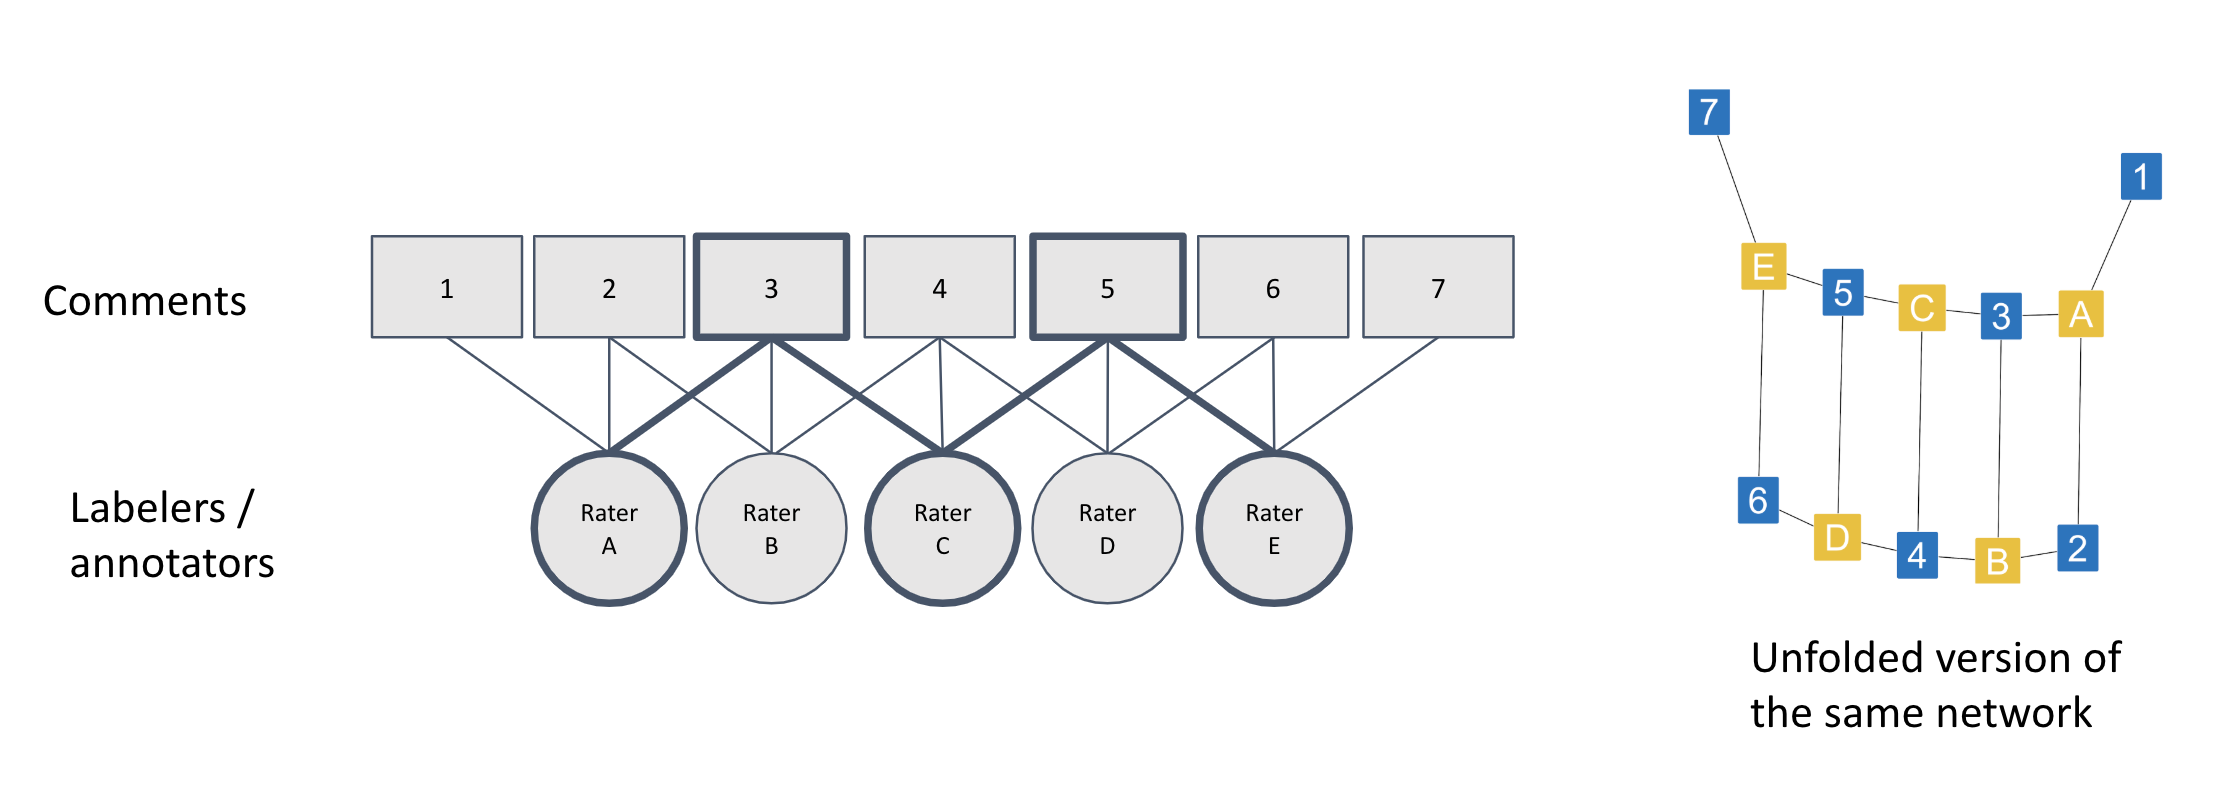
The sampled comments were then compiled into groups of 4 ?original comments?, stratified across our bins so that each group contained comments across the hypothesized hate speech spectrum. Each comment group was randomly allocated to 4 comment batches to ensure 4 ratings per comment, and each batch also included 6 reference set comments stratified across our 6 reference set levels. This design was chosen to generate a single network across all raters, which were linked through the comment groups plus the random selection from the reference set. In Figure 2 we show a simplified example of overlapping comment ratings that yield a single network across reviewers. This experimental design further ensured that every reviewer would receive comments across our hate speech scale; we eliminated the risk that by random chance some raters would only review comments in a narrow range of the scale.
We connected the labeling instrument, hosted on Qualtrics, to a comment batch server using web service requests in order to reserve comment batches and then mark them as completed. The comment batch server was hosted as a Python serverless function in Google Cloud with a MySQL database backend. Each reviewer was given a random comment batch of 26 comments that was not already reserved by another worker and that had not yet been completed. If a given comment batch was not completed with 10 hours it was returned to the pool of unreserved comments.
Human reviewers were recruited from Amazon Mechanical Turk to complete our labeling instrument hosted on an external site. Each labeler was given 26 comments—6 reference set comments and 20 ?original comments?—to label. Median time to complete the instrument was 49 minutes. Participants were compensated $7 for their participation in our study, yielding a median pay rate of $8.57 per hour. A manual review of the worker feedback on the task showed high satisfaction with the compensation for the task, and appreciation that the results would contribute to an understanding of social media conversations.
3.5 Constructing a scale with Rasch measurement theory
Our scaling procedure, as described in this section, converted the collection of ordinal ratings from crowdsourced human reviewers into a continuous, linear hate speech scale. We identified Rasch item response theory (IRT) as the appropriate psychometric framework to analyze the ratings and to transform them into the continuous score.
We selected the Rasch family of item response models because their theoretical properties have provably distinct advantages over other forms of IRT, leading to their elevated status as ?the necessary and sufficient process for measurement? [87]. [[, 1960,]]rasch1980probabilistic first described the requirements for objective measurement. Only Rasch models are founded on Fisherian sufficient statistics [26] that allow the latent variable, rater, and item parameters to be estimated separately using additive models [1].
Notably, Rasch models satisfy the five requirements of invariant measurement [24, Ch. 1] as translated into our hate speech application:
-
1.
Item invariance: measurement of comments must be independent of the particular items (survey questions) used for data collection.
-
2.
Non-crossing comment response functions: a more hateful comment must always have a higher probability of a more hateful response option than a less hateful comment.
-
3.
Comment invariance: The calibration of items and response options must be independent of the particular comments that were labeled.
-
4.
Non-crossing item response functions: A comment must have a higher (more indicative of hatefulness) expected response on an easier item (lower difficulty) compared to a harder item (higher difficulty).
-
5.
Construct map: Comments, items, item responses, and raters must be simultaneously located on a single underlying continuous latent variable.
The benefit of the invariant measurement is that the resulting scale is not specific to the particular survey items, raters, or comments that we analyzed in this study. Instead, we have created a measurement system for hate speech that can be applied to future text, incorporate improved survey items, and use different raters, while maintaining the ability to analyze all such objects on the original scale we have constructed in this initial work. In other words, we are able to construct a measurement device for hate speech that provides stability of meaning over a long time period, rather than an arbitrary metric that is valid only for our currently acquired data and instrument. More detailed discussions of the ?Rasch rationale? are provided in [[]Ch. 6]wilson2004constructing and [[]Ch. 1]wright1982rating.
The partial credit model [50] was the appropriate model within the Rasch family because our labeling instrument did not use the same set of response options for each item. We avoided the two-parameter or three-parameter families of IRT models such as the graded response model [71] or generalized partial credit model [51]. Those non-Rasch models do not admit the invariance properties of Rasch measurement. Specifically, the estimation of item discrimination parameters (aka ?slope parameter?) in a 2- or 3-parameter model implicitly results in the item difficulties no longer being separable from person (comment) abilities [[]Ch. 1, p. 8]wright1982rating. That result can be visualized by comparing the item characteristic curves from such models and noting that they must cross, because they do not have the same shape [[]Ch. 6, p. 110 - 113]wilson2004constructing.
We further avoided principal component analysis and factor analysis because they also do not transform raw scores into objective measures. Rather, they analyze the item responses as though they were already linear measures, when in fact they are only ordinal categorical ratings [88]. Moreover, neither method is sample invariant: they generate results that are intrinsically limited to the specific comments, items, and raters that were observed [65].
3.5.1 Faceted Rasch measurement
In the late 1980s Linacre extended the Rasch family of models to include judge-mediated assessments [40, 41], which applies to our labeled dataset generation where a human reviewer completed a survey in which they analyzed textual comments. Treating the rater as an additional facet of the scaling procedure enabled the estimation of a rater ?fixed effect? or ?severity? parameter with the same hate speech scale units as the comment scores, item difficulty estimates, and item step thresholds. This severity parameter can be viewed as an estimate of survey interpretation bias, where raters vary in how aggressively or loosely they interpret the scale items. Those rater fixed effects then no longer influence the statistical estimation of the comment abilities, item difficulties, or item steps. The result is a more objective estimate of the hate speech score for an individual comment that is independent of the severity of the raters who happen to be assigned to review that comment. Extensive details on faceted Rasch models can be found in [25], [23], and [41].
With the faceted partial credit model the probability of a given response to an item can be written formally as the following equation [45, 23]:
| (1) |
where:
-
•
is the probability of comment being rated as response by rater on item ,
-
•
is the probability of comment being rated as response by rater on item ,
-
•
is the ability of comment ,
-
•
is the difficulty of item ,
-
•
is the first-order bias (“severity”) of rater ,
-
•
is the difficulty of receiving rating relative to rating .
Faceted Rasch models include a noteworthy implication for inter-rater (kappa) reliability: it is not essential that different raters provide the same responses to an item when analyzing a certain comment. There is a growing body of related literature showing that a single ?true? labeled response is often unrealistic [3, 57, 29]. Instead, we want within-rater consistency in item interpretation so that their estimated severity acts as a strong summary measure of their individual style of rating. In fact, for raters with very different estimated severities, we would expect them to provide different ratings on an item when analyzing the same comment - that would be consistent with the measurement model (and common sense). Reliability of ratings and unbiasedness are two distinct phenomena; for example, a given comment may exhibit high reliability due to multiple raters agreeing on an biased assessment [32]. This is a marked psychometric departure from prior studies of hate speech or other supervised natural language processing topics, which have commonly relied on inter-rater reliability as the primary quality metric for dataset labeling [67].
We used Facets software [44] to conduct the many-facet Rasch scaling. A sequence of four scaling estimates were conducted, in which increasing percentages of low-quality raters were removed, and response options were collapsed to reduce noise in the estimates. The details of the rater quality analysis and response collapsing are described in the appendix.
3.6 Automated score prediction with deep learning
After scaling, we trained an algorithm to estimate a mapping from the raw text to our latent hate speech score. Deep learning has shown the best performance for this type of task, provided that sample size is not too small. The current best architectures are based on transfer learning [58] and Transformer units, such as T5, ALBERT, and RoBERTa. These architectures consist of a language model that is first trained in an unsupervised fashion on large amounts of general text, typically millions of Wikipedia articles and about 10,000 books. This teaches the algorithm the meaning of words within their context, allowing it to read new types of text.
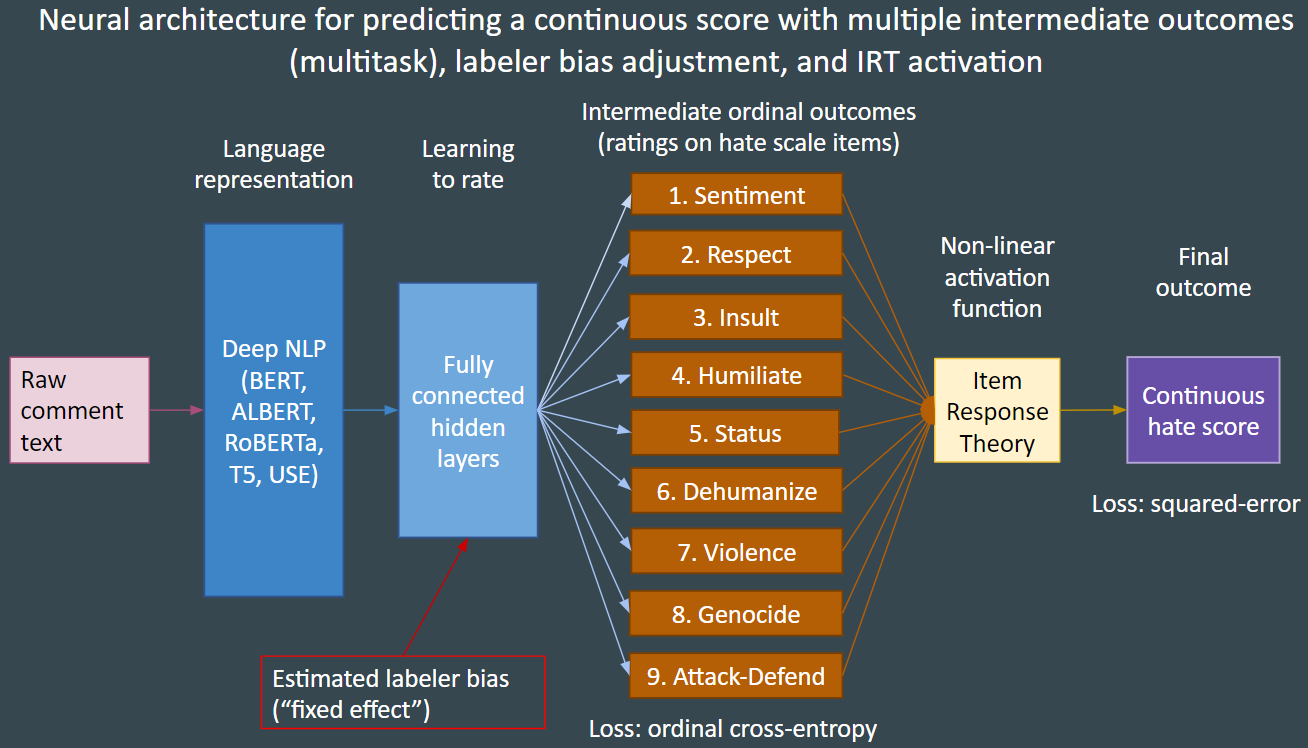
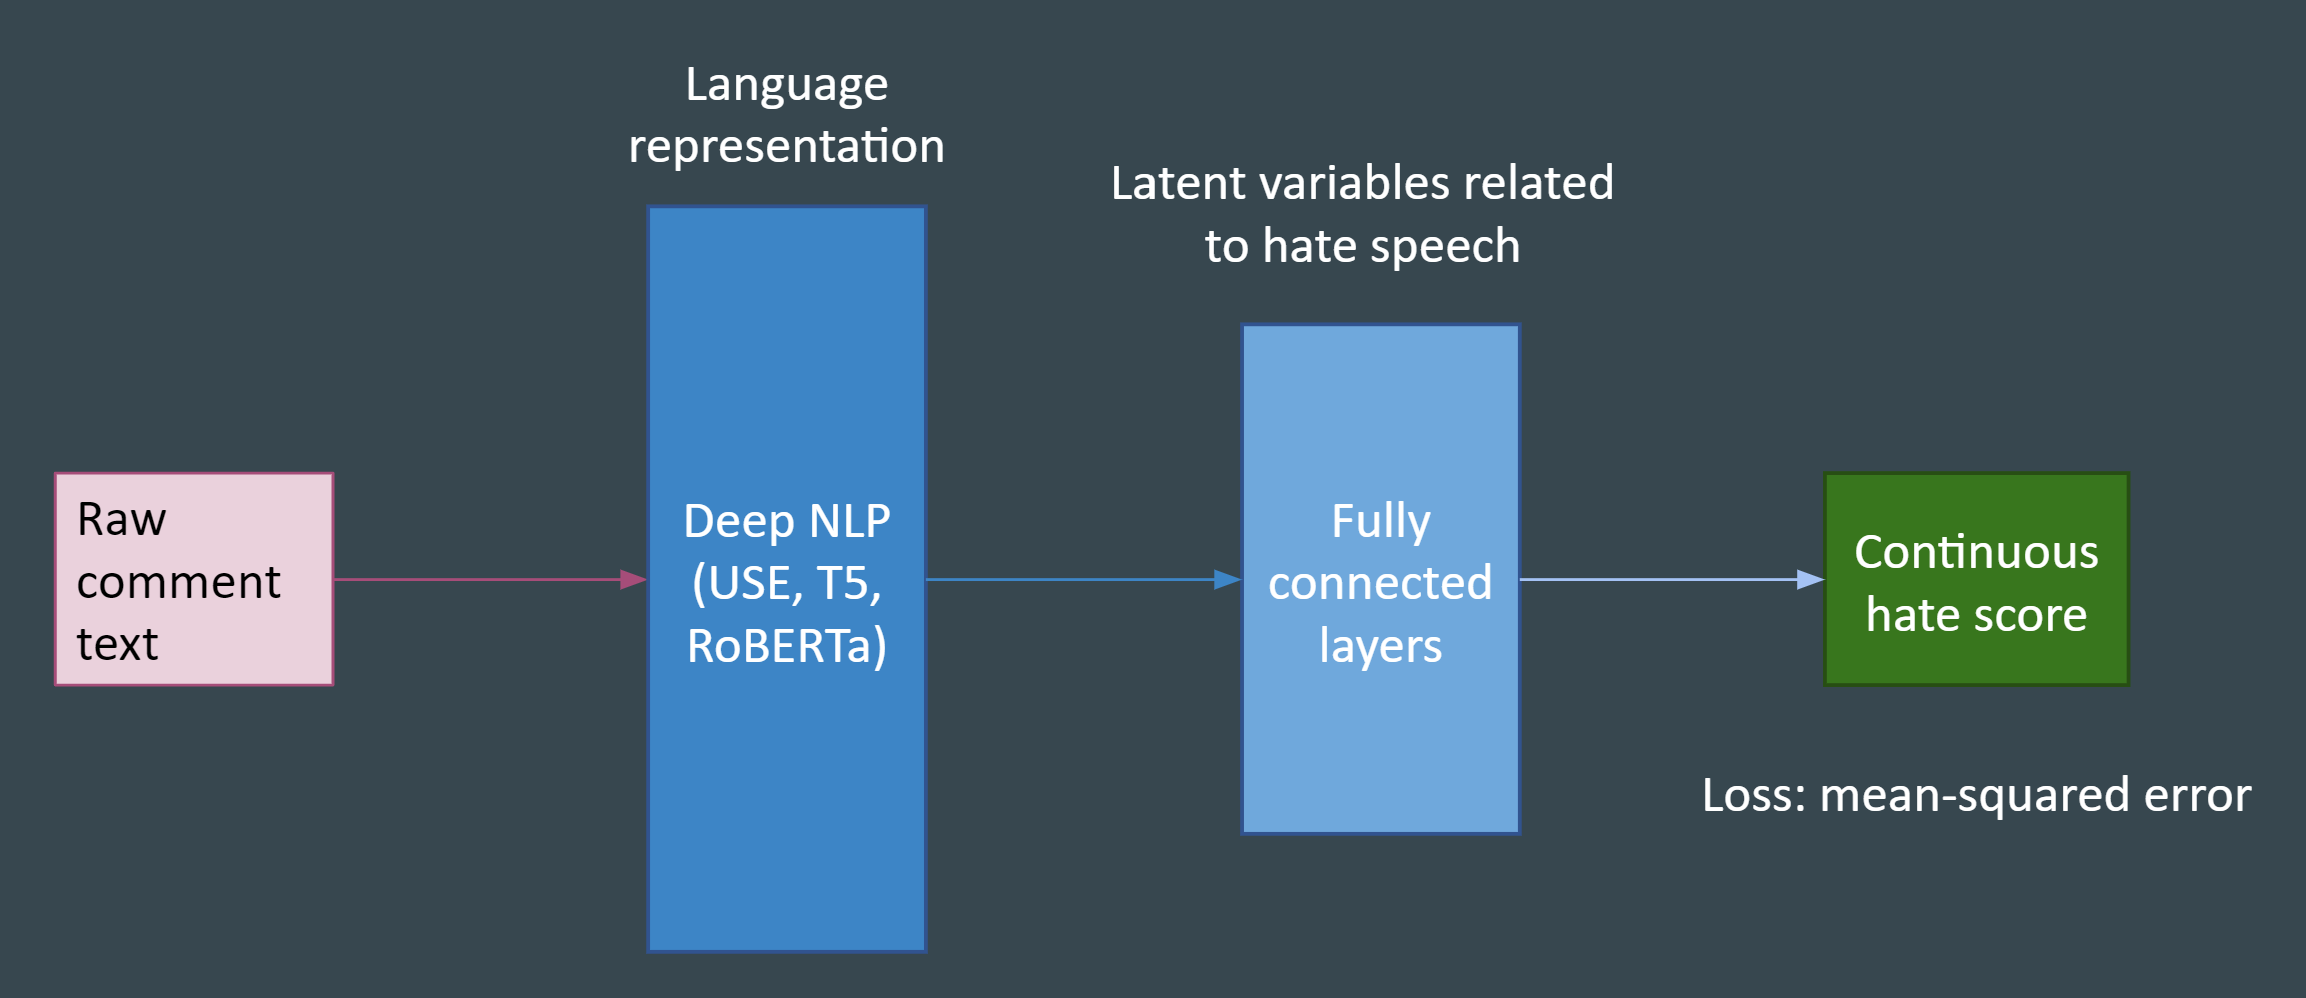
We then conducted the supervised learning: we supplied the raw comment text as our input observations, with the ultimate goal of predicting the latent hate speech score. We made four novel changes in our supervised approach: 1) rather than predict the hate speech score directly, we instead predicted the responses to each survey item using a multitask architecture (i.e. multiple outputs within a single model) [69], 2) each survey item was directly analyzed as an ordinal outcome using the consistent rank logits method of ordinal softmax activation and ordinal cross-entropy loss [9], 3) we supplied the rater’s estimated survey interpretation bias (severity) as an additional non-text input to allow the model to adjust its understanding of the likely item response, and 4) we tagged known slurs in the raw text of the comments, giving the deep learning models comparable information to what the human annotators were provided. The individual item response predictions could then be transformed into latent scores using the estimated IRT parameters. See Figure 3 for a depiction of this architecture. We believe that this approach represents a new way of integrating deep learning with item response theory for measuring phenomena that can be decomposed into multiple items that are reviewed by human raters. We now describe the details of those steps.
The simplest supervised learning strategy would be to predict the continuous hate score directly, and to ignore the intermediate item ratings that led to that score. With this architecture the data structure would consist of one observation per comment. The estimated severity (bias) for each labeler would not need to be incorporated as an auxiliary input because the score was already debiased through the IRT scaling. The loss function could simply be mean-squared error and the architecture could consist of a Transformer-based representation subnetwork applied to the raw text, followed by one or more dense layers to learn the mapping to the continuous score. In lieu of the dense layers, the language representation could be applied to generate a summary feature vector for each observation, and traditional machine learning such as XGBoost [12], BART [13], SuperLearner ensembling [61], etc. could be applied to predict the continuous score. We implemented both the full neural architecture (dense layers) as well as the traditional machine learning structure with TPOT optimization [55] as benchmark options.
3.6.1 Survey items as supervised concept learning
We hypothesized that an improved supervised learning architecture would instead attempt to predict the human rating on each of the survey items (as listed in Table A1). Those intermediate predictions could then be transformed into the continuous score using the IRT parameters estimated during the scaling process. The exciting insight of this approach is that the items facilitate what could be called directly supervised concept learning. In a typical neural architecture the final hidden layer has developed the highest level concepts that best predict the outcomes in the output layer based on the architectural hyperparameters: loss function, number of hidden units, activation function, random initialization of weights, dropout, and optimization over multiple epochs of a certain batch size. Exactly what those final concepts mean is not immediately obvious, and is the result of a greedy stochastic process that reflects a local optimum. In contrast with our method we know from our theorization and development of the construct the exact concepts that need to be learned as well as the nonlinear function that transforms those constructs to the continuous score, and we have labeled data for each of those concepts: the survey item responses from the human labelers. This is a powerful shortcut in the supervised learning process that largely eliminates the need for architecture search or hyperparameter optimization in that final concept layer of the neural network. We know how many hidden units there are, the form of the loss function for those units, and the nonlinear activation function to transform those units into the final output. And it provides direct supervision during the optimization process for those concepts: we don’t have to rely on backpropagation of errors from the final continuous output.
3.6.2 Multitask architecture
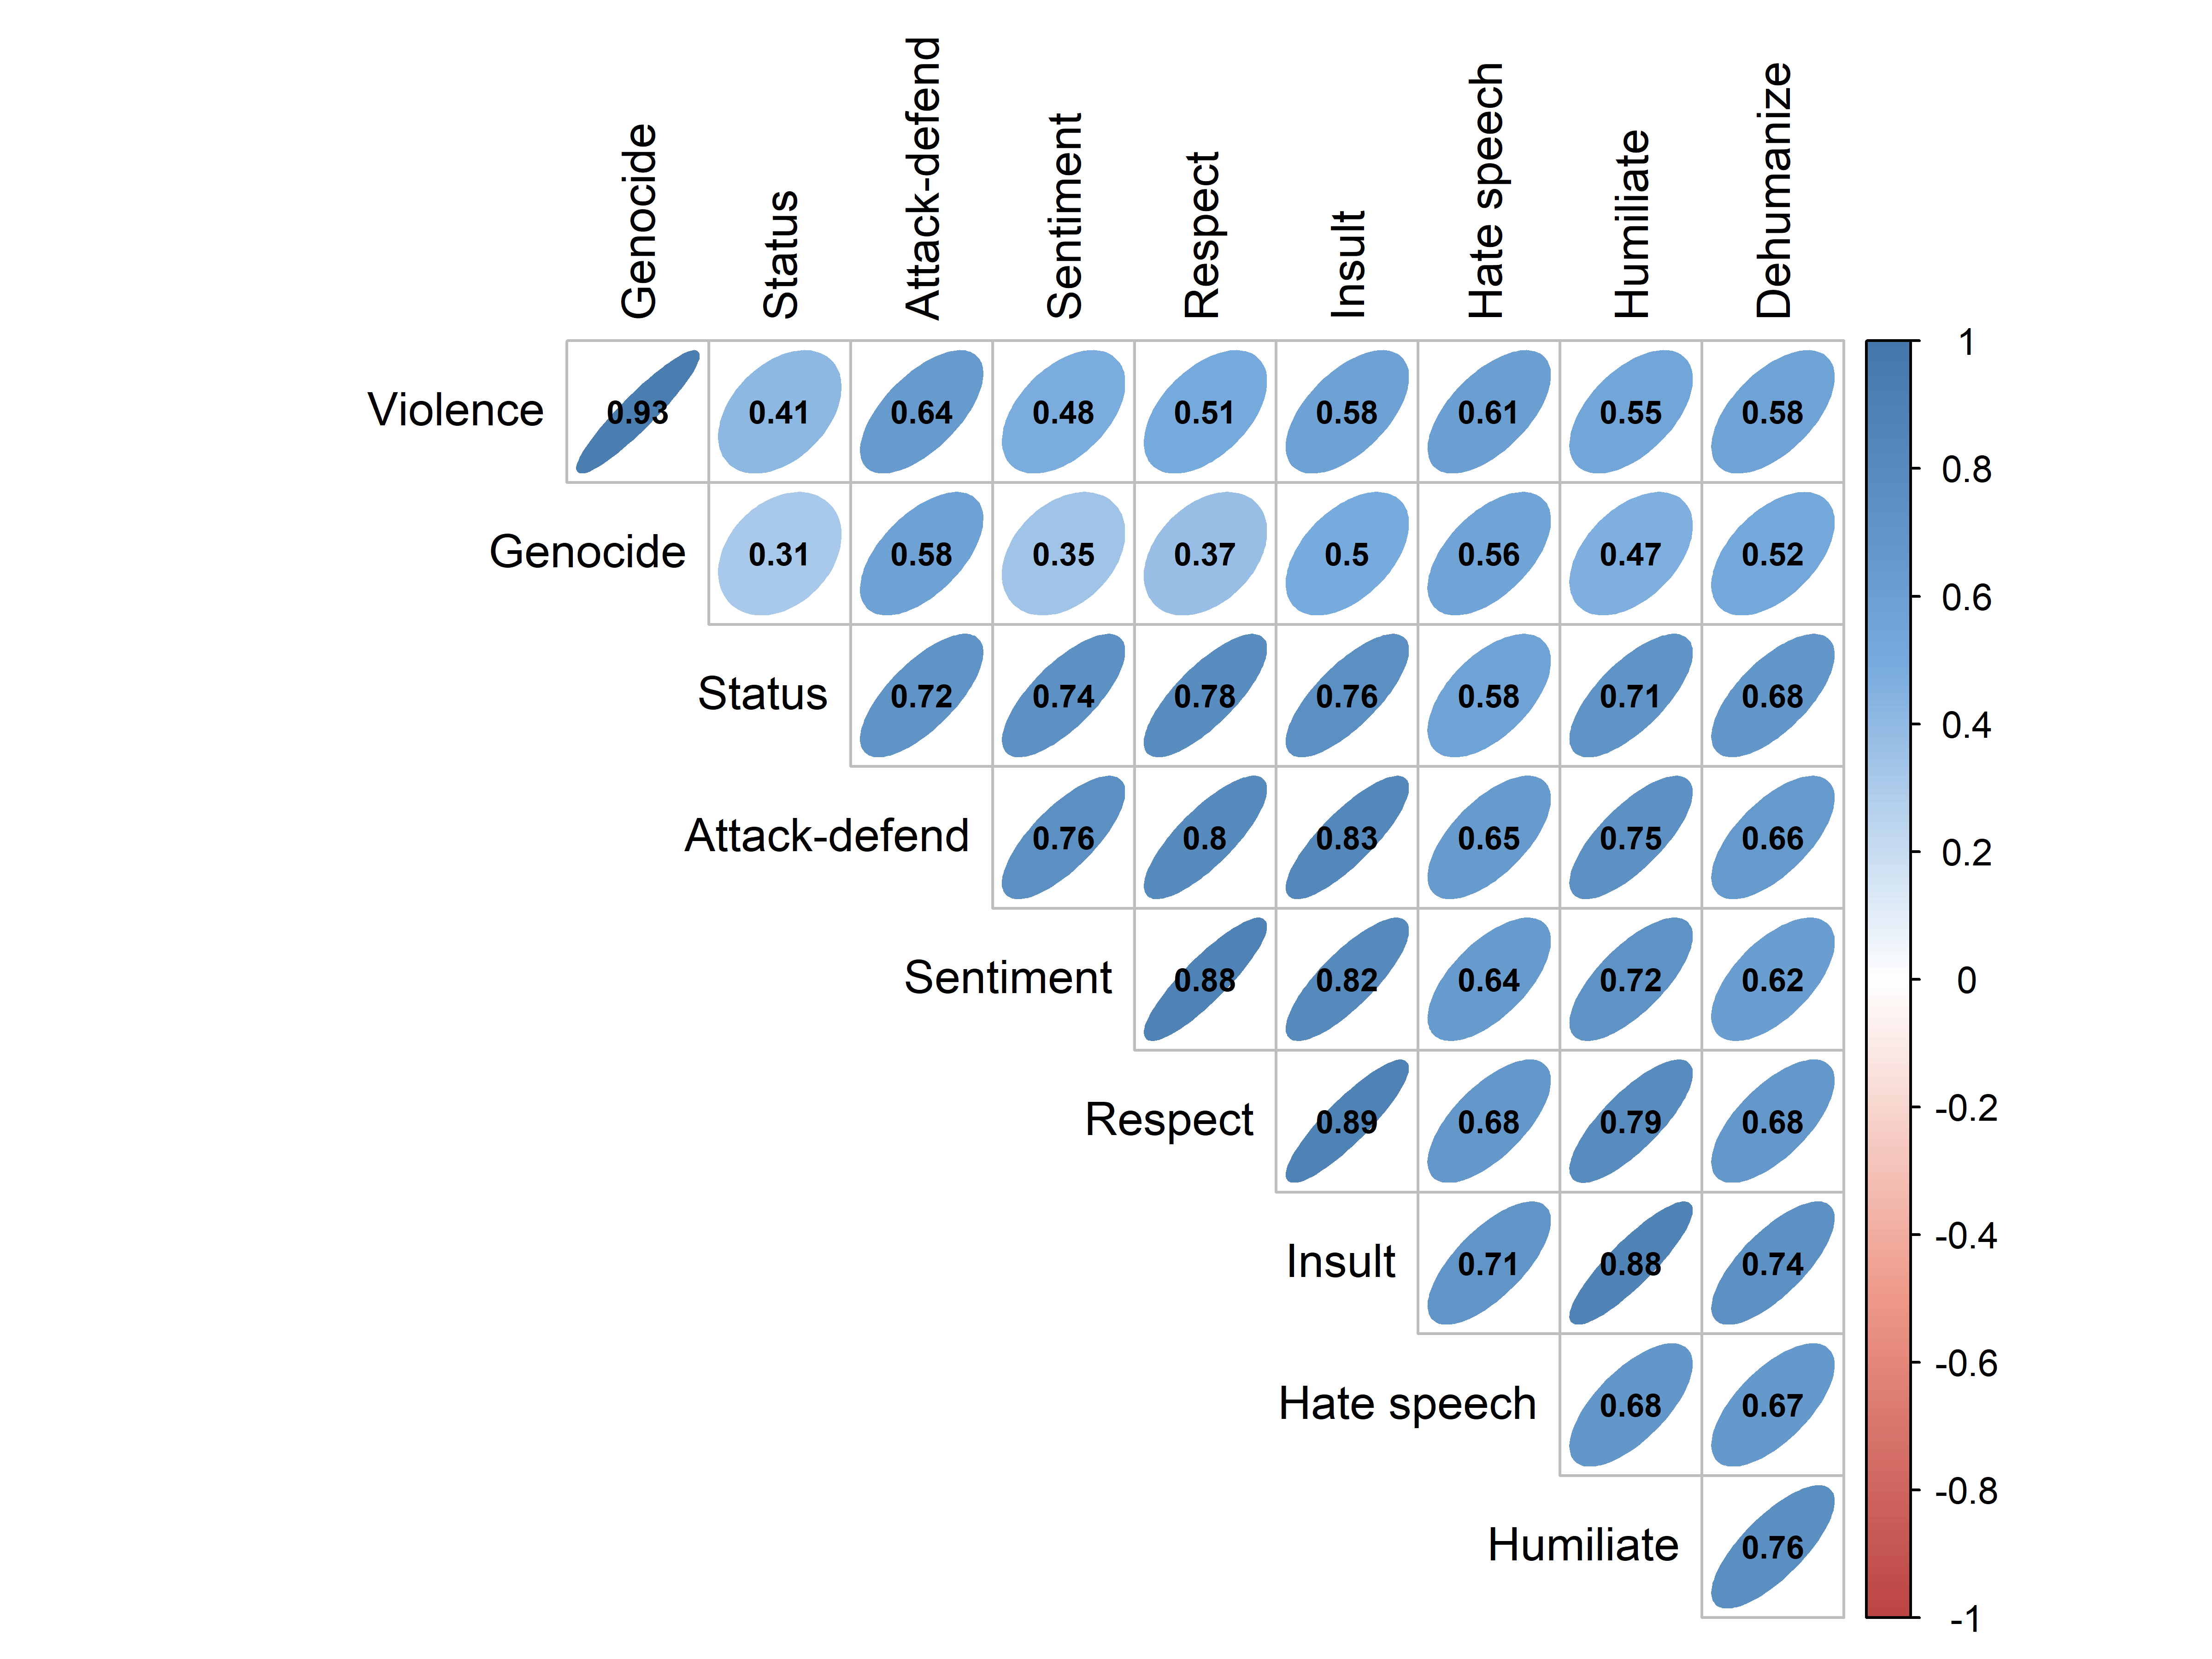
While there could be a separate model for each item, a multitask architecture was advantageous for three reasons: efficiency, generalizability, and convenience. Multitask architectures can improve efficiency and generalization because they bias the network to learn a shared representation of concepts that explains multiple related outputs [10, 30, §7.7]. Multitask architectures are gaining increasing adoption across deep learning tasks, include face analysis [64], language modeling (CITE), self-driving cars [36], etc. We examined the relatedness of items in our scale through a correlation heatmap (Figure 8) and found strong levels of correlation, supporting the likely benefit of multitask learning. Multitask items offer convenience through packaging multiple outputs into a single architecture, reducing the lines of code needed for training and prediction.
3.6.3 Ordinal loss and activation functions
Each item served as an output in the network, and the label was an ordinal Likert-style variable with 5 response options typically, such as: {strongly disagree, disagree, neutral, agree, strongly agree}. The loss function for each output (task) would benefit from acknowledging the ordinal nature of the outcomes: predicted probability mass assigned farther from the true label is worse than probability mass allocated to the adjacent label(s) [34]. For example, when a human rater labels a comment as ?strongly disagree? on the ?calls for violence? item, the predicted probability of ?strongly agree? should contribute much more to the loss than ?disagree?, because it is a much worse prediction. This has been recognized as a desire for unimodal probability distributions when conducting ordinal classification [16, 5]. Cross entropy, the standard loss function used for discrete labels, does not do this. It only examines the probability placed on the true label and encourages that probability to be maximized.
We incorporated the method of [9] termed consistent rank logits (CORAL), to explicitly handle the ordinal nature of predicting the rating on each item. When applied to an item with k possible ratings (e.g. 5 for a Likert-style item), the CORAL method decomposes an ordinal regression into binary classification tasks in which the model learns to predict if the expected response is greater than or equal to each possible rating; the highest rating value is skipped because its probability prediction will be the remainder. The loss function becomes the (possibly weighted) sum of the cross-entropies of each of these binary classification tasks, which we call ordinal cross-entropy. The set of binary classifiers uses shared weights combined with separate trainable bias parameters, which guarantees that the output yields a unimodal probability distribution over the possible item ratings; for this reason we term the ordinal activation function ordinal softmax. We implemented a Keras version of the CORAL method for this work [37].
3.6.4 Partial credit IRT transformation of predictions
Once the multi-task deep learning model has been trained to generate item-level predictions (i.e. probability distribution over each response option), those predictions need to be fed into an anchored faceted Rasch model to be converted into the predicted hate score. The simplest approach would be, for each of the 10 items, to predict the response option (label) with the highest estimated probability. For example, if the model estimated that the genocide item would be answered as ?yes? at 10% probability and ?no? at 90% probability, the model’s label prediction would be ?no?. So the model would generate estimated item labels for each comment, and those predicted ratings would be scaled by running the partial credit scaling procedure with item and response parameters anchored (fixed) to the values from the original faceted Rasch scaling. The measurement model for this deep learning scaling differs from the Rasch scaling we used to create the continuous outcome variable because we have only a single rater - the deep learning model itself. That is the reason that we use the partial credit model for this step, rather than a faceted Rasch model that estimates a severity parameter for each rater.
3.6.5 Plausible value sampling
There are two key downsides to the partial credit scaling as described:
-
1.
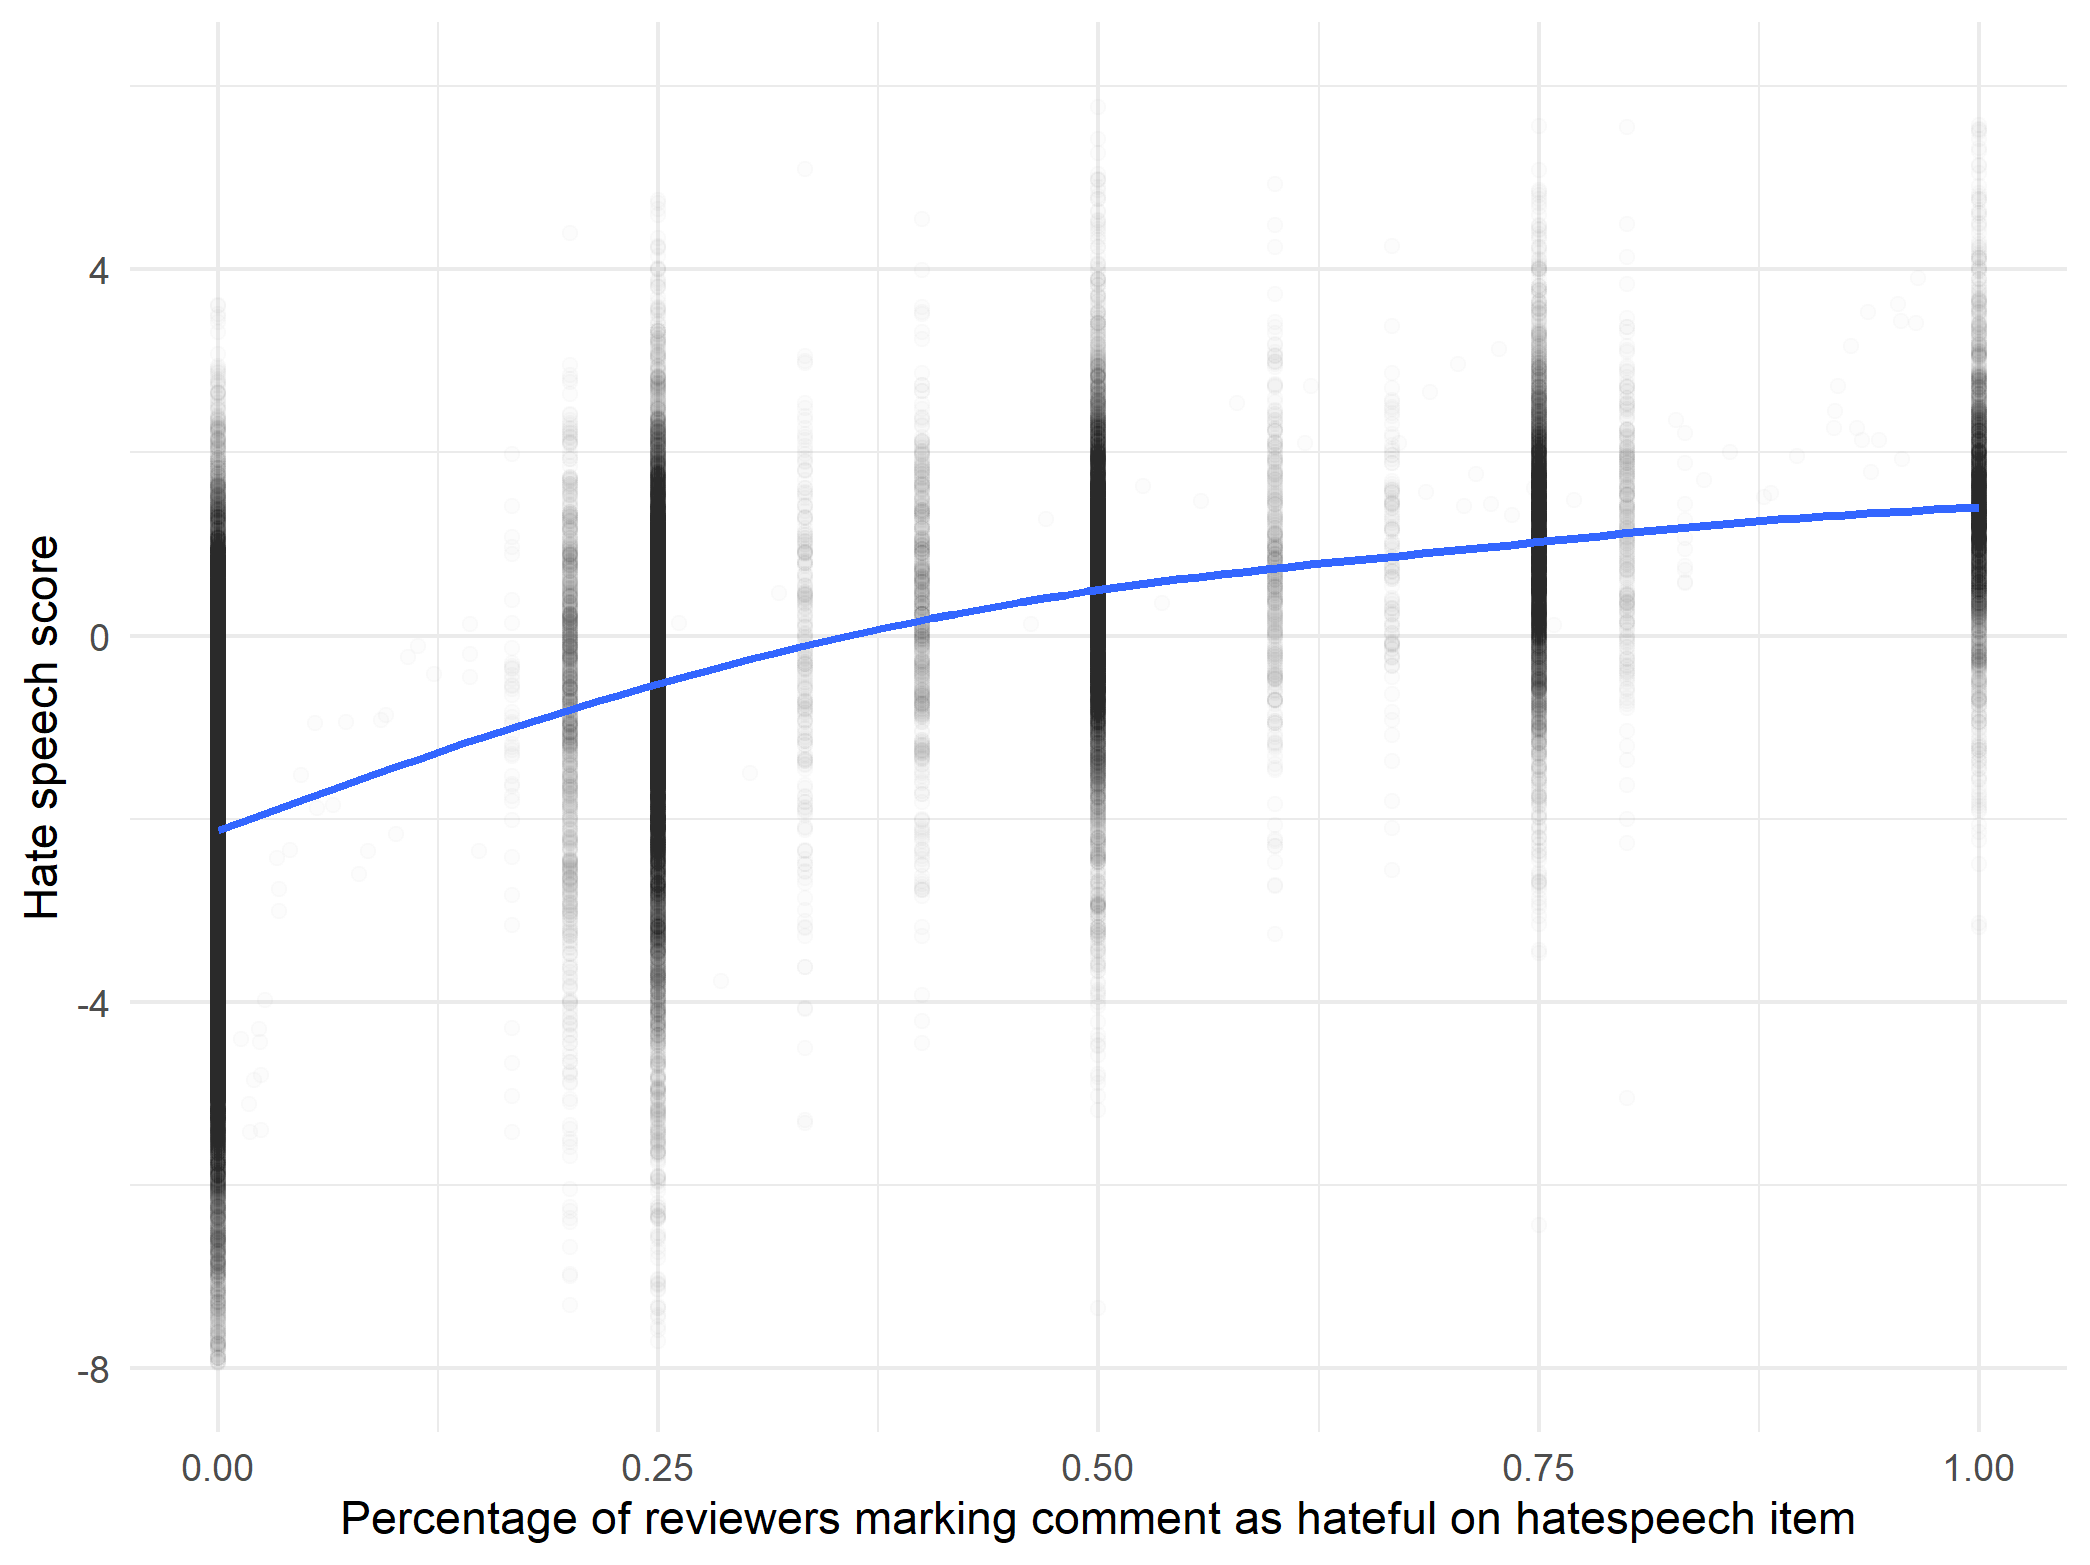
The number of unique predictions generated by the partial credit model is limited to the cardinality of the raw scores. This is because the raw score (the sum of the individual item ratings) is a sufficient statistic for the continuous latent variable generated by Rasch measurement models. In our case the final item setup had 33 possible raw scores (0 - 32), so only 33 unique point estimates could be generated by the partial credit model transformation. Although certainly more granular than predicting a yes/no or ordinal label, that seems somewhat coarse when covering a continuous spectrum from -8 to +5, which could limit the predictive performance of this version of the model.
-
2.
Possibly more importantly, in selecting the most probable rating we discard the information contained in the predicted probability distribution for each item, i.e. how confident the model is about a predicted item rating for a given comment. That information seems quite valuable, and is missing from the original labeled data from the human raters - we only know the single response option that they selected (presumably the highest probability response option from their mental model of the rating task).444This begs the question: could we ask human raters to provide a probability distribution over the response options, rather than selecting a single rating? Perhaps this has already been proposed or studied. Incorporating that probability information will also improve the sensitivity of overall model performance to improvements in the multi-task item predictions: architecture improvements will translate into improved probability predictions more efficiently than improved label (rating) predictions.
How best to solve these problems then, generating more precise predictions that incorporate the confidence information from the predicted probability distributions? We chose to take a plausible value sampling approach, which resolved both issues. Rather than select the most probable response for each item, we sampled many possible item ratings for each comment based on the probability distribution for each item. Each ?plausible value? for an item rating was selected at random from the possible response options, with discrete probability equal to the model’s predicted probability for each response option. In other words, we asked the model to rate each comment many times, and to select each item rating by a probability-weighted sample of the response options. Those replicated ratings were then scaled simultaneously in the anchored partial credit model to yield an estimated hate score for each comment. We tested different replication counts (1, 2, 4, 8, 10, 16, 24, 32, 64, 128, 256) to examine the trade-offs of predictive performance and computation time.
3.6.6 Dynamic adjustment via revised slur tagging
As noted previously, the raw comment text was processed so that any known slurs that had been highlighted during the annotation process were also tagged for use in the deep learning model training. This gave the models the potential to incorporate slur tagging into their contextual language representation, if it was found to be useful. While our intent with the slur tagging was primarily to improve the quality of the labeled data, it has an interesting implication for the deep learning side as well. In effect, it partially decouples the understanding of slur terms from the model’s predictions, meaning that we do not have to keep fixed the slur tagging as it was implemented during human annotation. This has a major advantage: as coded slur terms and other covert language evolve in the future, or as we simply develop a more strongly theorized list of slur terms, we can update our slur dictionary to reflect those changes and improve our model’s ability to measure contemporary hate speech, even when those terms were never seen in the original training data. We call this dynamic adjustment of slur tagging during prediction.
For example, our training data predates the coronavirus epidemic, so the training data contains no examples of COVID-related hate speech, such as the racist phrase ?kung flu.? However, if we add that phrase to our slur dictionary and tag it appropriately in future raw comments, our model prediction then incorporates that side knowledge to better measure the hatefulness of comments that adopt that novel racial slur. We can also do the chronological reverse: when applying our model to older text, such as historical literature, we can modify the slur tagging preprocessing to reflect the slurs as they were used at that time. This slur tagging process can further benefit from improvements in the tagging methodology: model-based tagging, rather than simple dictionary lookups, can reduce false positives where context demonstrates that a word or phrase is unlikely to intended as a slur.
4 Results
We now report on our observed results from the evaluation of the allocation of comments to raters (judging plan), application of faceted IRT to our labeled comments (scaling), and our accuracy at predicting the hate score using deep learning on the raw comment text.
4.1 Network analysis for comment batch annotation
We evaluated the network linkage across the raters, original comments, and reference set comments. We confirmed that our batch creation procedure generated a single linked network, with no disjoint subsets, that would allow the estimation of rater severity ( ?fixed effects?). The diameter of the network was 6, meaning that any two points were connected by traveling across no more than 6 edges. The average distance was 3.6, meaning that any two nodes were typically about 4 edges apart.
4.2 Rasch measurement theory scaling
Our faceted partial credit model achieved a case (comment) reliability of 0.94. Our estimated rater separation reliability was also 0.94, suggesting that our judging plan resulted in high accuracy at estimating the individual severity for the labelers. Following [42], we confirmed that for each item the average hate score increased monotonically with more hateful response options.
The calibrated Wright Map showing our scale across comments, items, item steps, and raters is shown in Figure 5.
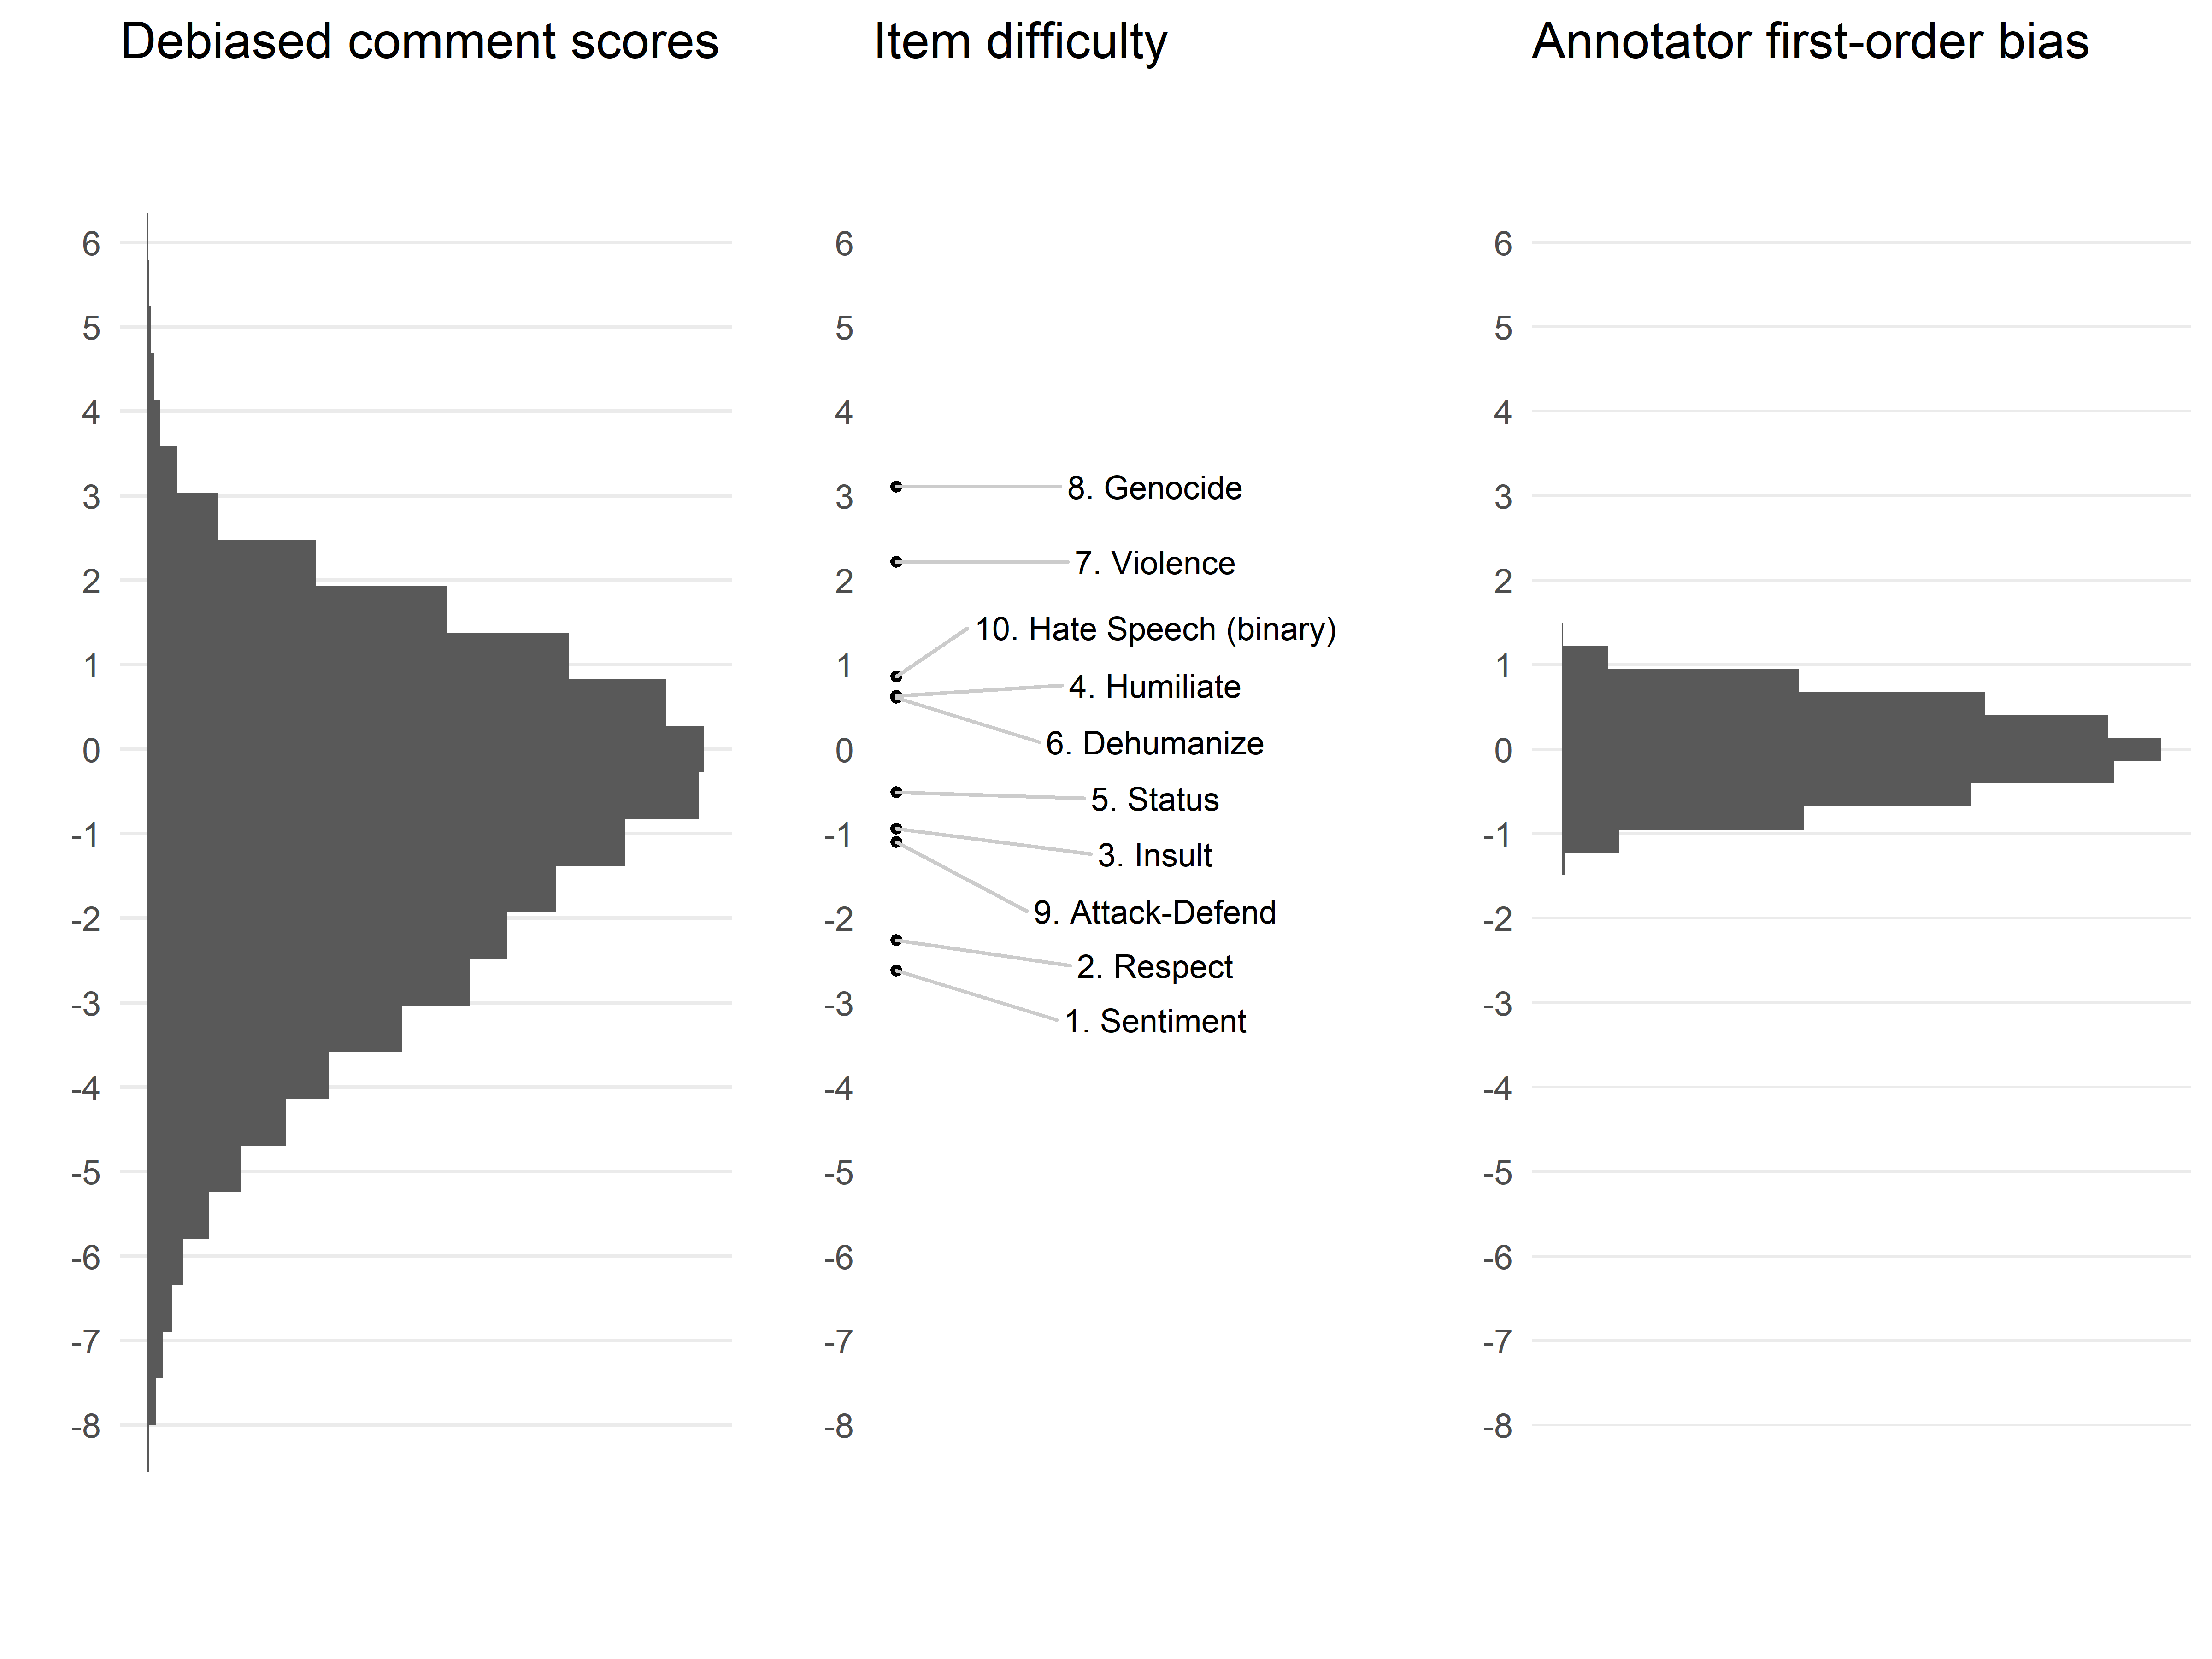
Our estimated item difficulties (Table 4 and Figure 5) were consistent with our hypothesized item difficulties, which speaks to the construct validity of our instrument. Our item fit statistics exhibited reasonable fit to our assumed Rasch model. Both infit (inlier sensitive) and outfit (outlier sensitive) mean-squares fell within the [0.7, 1.3] heuristic target for statistical agreement between the proposed Rasch model and the observed ratings [23, 5.1.2, p. 77].
| Item | Difficulty | Infit MnSq | Outfit MnSq | Discrm | PtMea |
|---|---|---|---|---|---|
| Sentiment | -2.62 | 1.04 | 1.05 | 1.00 | 0.83 |
| Respect | -2.26 | 0.94 | 1.01 | 1.09 | 0.85 |
| Attack-Defend | -1.10 | 1.05 | 1.07 | 0.93 | 0.80 |
| Insult | -0.94 | 0.96 | 1.04 | 1.04 | 0.84 |
| Status | -0.51 | 1.04 | 1.19 | 0.93 | 0.65 |
| Dehumanize | 0.61 | 1.09 | 1.09 | 0.87 | 0.60 |
| Humiliate | 0.63 | 1.10 | 1.05 | 0.90 | 0.72 |
| Hate speech (binary) | 0.86 | 0.97 | 0.89 | 1.04 | 0.62 |
| Violence | 2.22 | 0.91 | 0.89 | 1.09 | 0.51 |
| Genocide | 3.11 | 0.85 | 0.90 | 1.12 | 0.44 |
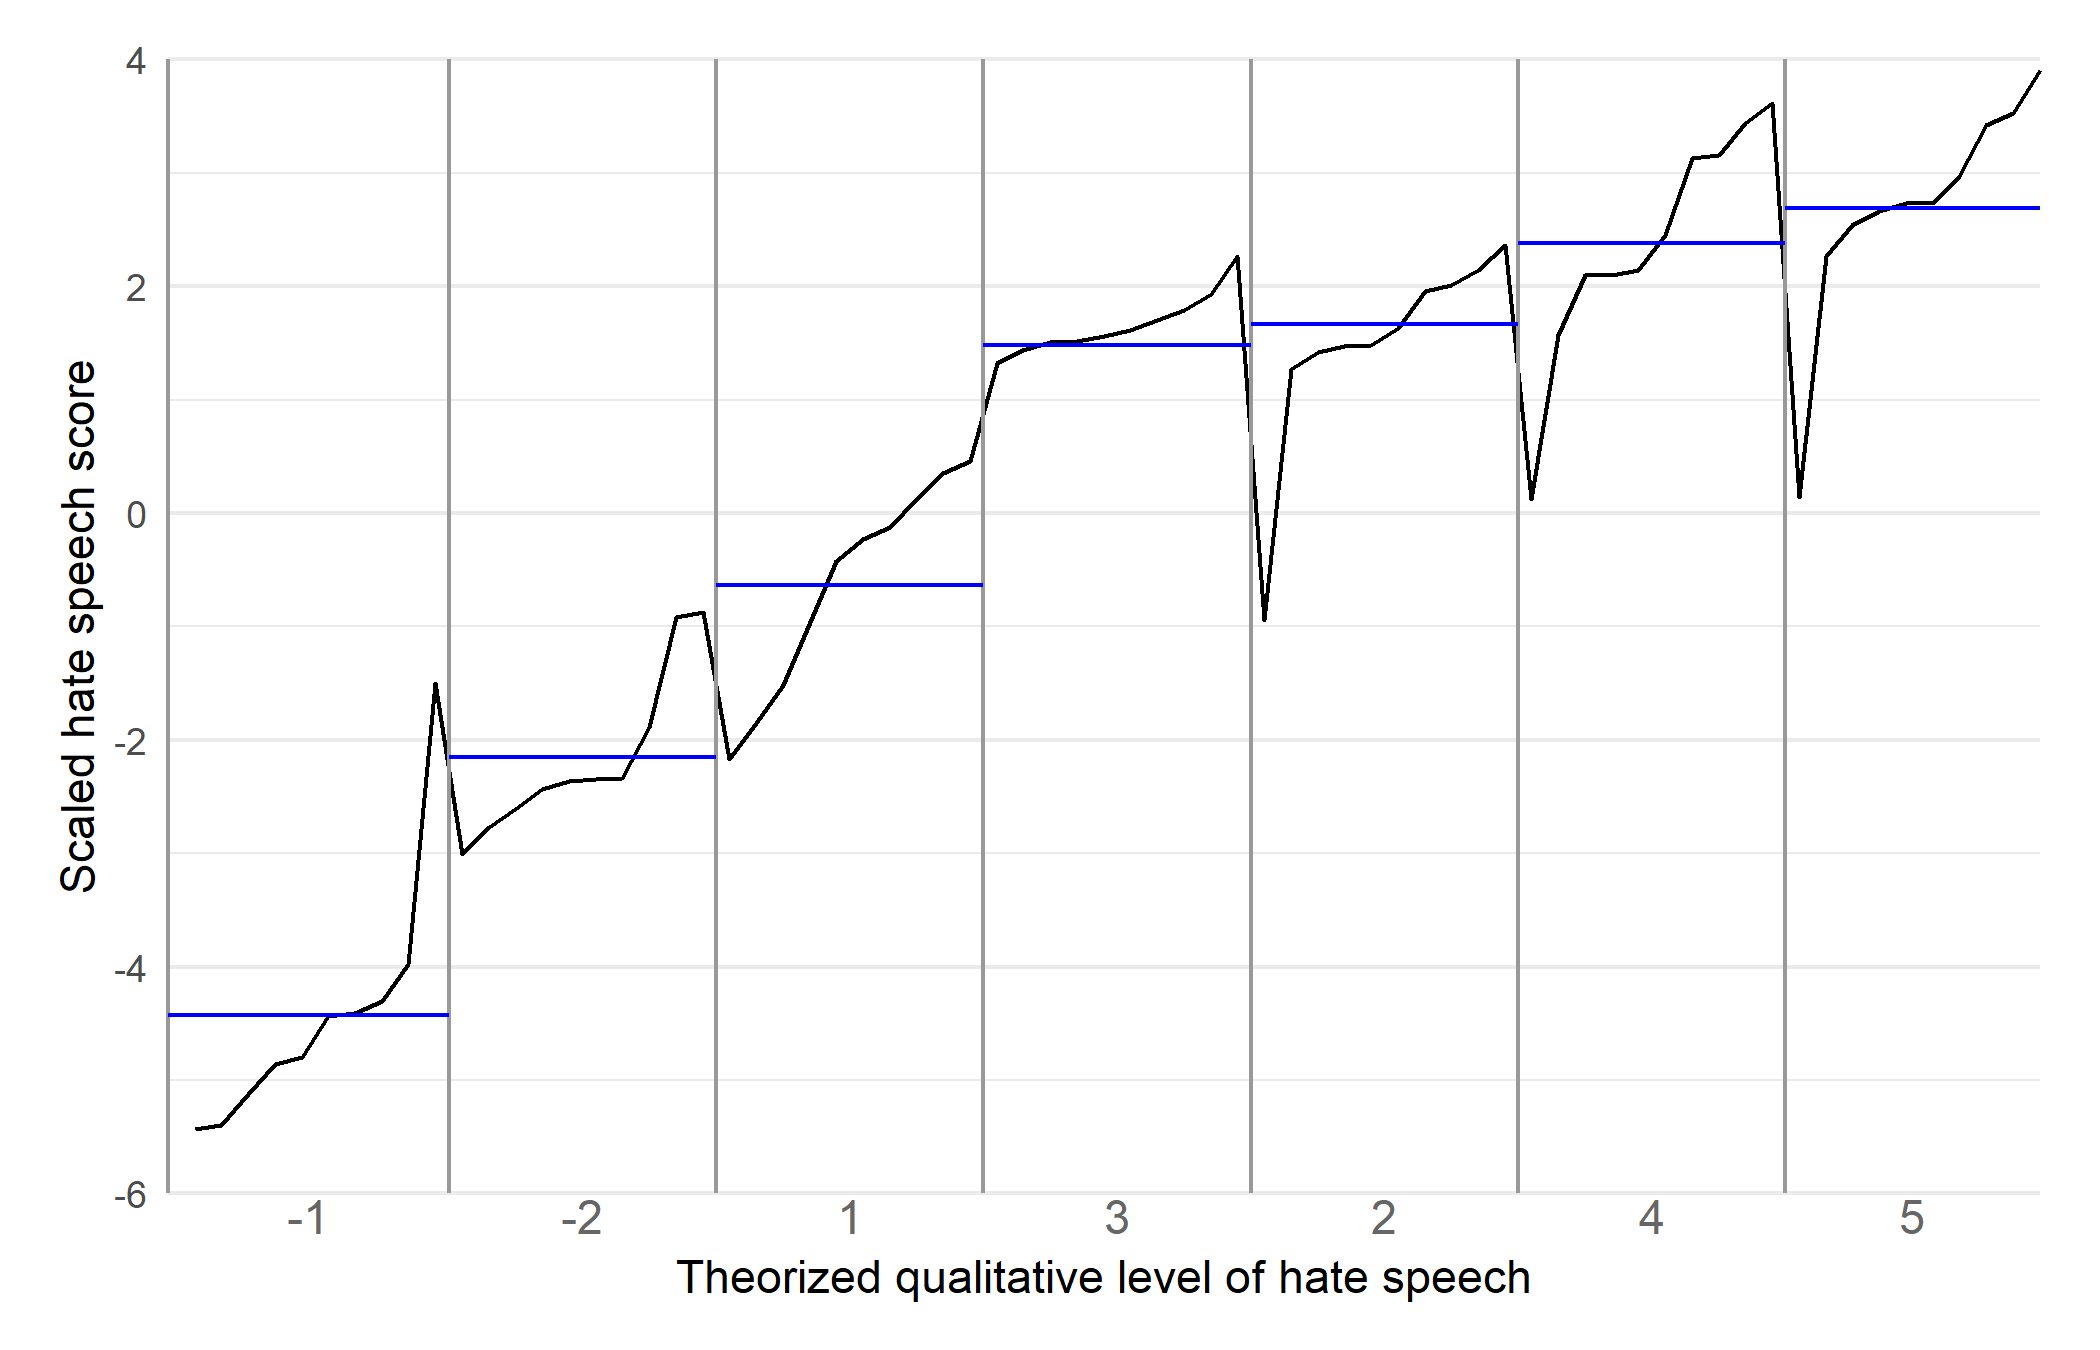
We reviewed the scaling results on our reference set comments, which were each rated 500 - 1200 times. Figure 6 displays the ability point estimates for each reference set comment grouped into its qualitative level. The average score within each level showed the expected monotonic increase in hate speech for increasing levels. However, the level pairs 2 & 3 and 4 & 5 did not show large absolute differences in their average hate speech scores. We also noted that some comments appeared to be better moved into adjacent levels based on their hate speech scores. These results imply that we should revisit our theorization for the reference set, review the criteria for the comments to determine if they are better placed in adjacent levels, and consider substituting ambiguous comments with more clearly exemplary comments. We may want to simplify the reference set by merging levels 2 & 3 and levels 4 & 5.
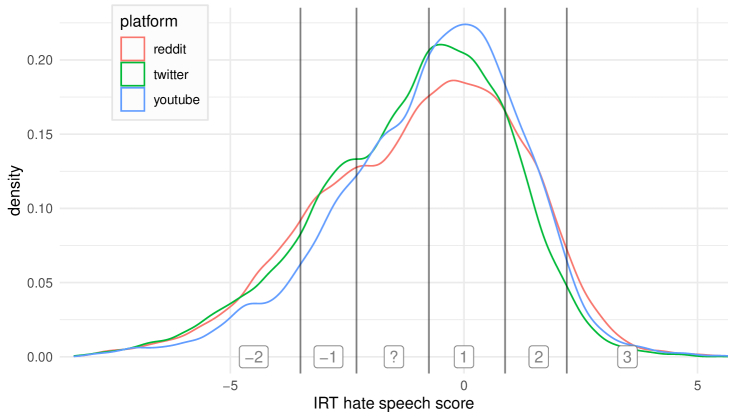
We examined the distribution of the hate speech score across our three platforms (Figure 7). YouTube and Reddit looked very comparable. Twitter showed a similar distribution but shifted to the left, with a noticeable reduction in scores at the high end of our hate speech scale. This result suggests that we may need to improve the allocation of Twitter comments into batches in order to increase the percentage of comments on the hateful side of the spectrum. Our observed results may also indicate that Twitter already conducts some sort of automated filtering of hateful comments before allowing the comments to be downloaded through their API, or that the Perspective API is less accurate on Twitter comments. Alternatively, this may suggest differential item functioning of our labeling instrument for Twitter comments, if they have linguistic characteristics that cause the raters to interpret them differently from comments sourced from YouTube or Reddit. It is important to note though that these results reflect the unweighted distribution of our labeled sample, which was intentionally skewed during the comment collection and batch creation process. Therefore these distributions should not be seen as population estimates of the true score distribution on each platform, but rather as descriptions of our training data. Future work will apply weighting corrections to the training data to estimate population-level parameters.
A review of the correlation across items, shown in Figure 8, was suggestive that a multi-task deep learning architecture could benefit from sharing information across each item rating prediction.
4.3 Deep natural language processing
After scaling, we used supervised deep learning to estimate a mapping from the raw text to the continuous hate speech score. Our current best models used a RoBERTa-Large contextual language base to process the raw text into a vector representation [47], followed by a 64-unit hidden layer with 10% dropout, and included fine-tuning of the language representation subnetwork using HuggingFace software’s Keras implementation [86, 14]. Results from our model testing are shown in Table 5. Direct prediction of the continuous hate score has currently achieved the lowest root mean-squared error (RMSE), although our proposed multitask networks that are transformed via IRT achieved comparable performance and slightly lower mean absolute error with the benefit of explainability. In the multitask outcome representation we did not find a benefit from ordinal modeling of the items compared to categorical modeling.
| Prediction Algorithm | Outcome Representation | Trained Parameters | CV RMSE | CV MAE | CV Corr. | Training Comments |
| Outcome mean baseline | Continuous | 1 | 2.061 | 1.964 | 0.000 | 42,000 |
| Google Jigsaw Identity Attack | Binary + calibration555Because this is a probability prediction for a binary outcome, we linearly calibrate the probability output to our continuous outcome by fitting an OLS regression on the training set with the probability output as the only feature, then apply the prediction of that regression estimator to the validation data. | Unknown | 1.868 | 1.914 | 0.423 | 100,000 |
| Google Jigsaw Toxicity | Binary + calibration5 | Unknown | 1.557 | 1.904 | 0.655 | 100,000 |
| In-domain embeddings + Bi-LSTM | Continuous | 9,121 | 1.342 | 1.033 | 0.763 | 37,817 |
| Universal Sentence Encoder FE | Ordinal IRT | 33,539 | 1.286 | 0.990 | 0.780 | 37,817 |
| Universal Sentence Encoder FE | Continuous | 32,897 | 1.245 | 0.969 | 0.792 | 37,817 |
| BERT-Large WWM FT | Continuous | 335,142,913 | 1.142 | 0.893 | 0.824 | 28,571 |
| RoBERTa-Large FT | Ordinal + IRT | 355,360,769 | 1.126 | 0.858 | 0.841 | 28,571 |
| RoBERTa-Large FT | Categorical + IRT | 355,360,769 | 1.117 | 0.849 | 0.843 | 28,571 |
| RoBERTa-Large FT | Continuous | 355,360,769 | 1.078 | 0.861 | 0.839 | 28,571 |
5 Discussion
Grounded by theorization, our empirical results showed that we were successful in both major sub-projects of this work: 1) creating a 10-item labeling instrument processed with faceted Rasch modeling to yield a continuous scale for hate speech, including counterspeech, and 2) predicting that scale on unseen social media comments using Transformer-based natural language processing. That prediction could be accomplished either by directly predicting the hate score from the raw text, or by taking advantage of the Rasch transformation by first predicting the human ratings on the ten constituent components of hate speech (i.e. the multitask architecture), and then aggregating multiple possible ratings of each comment (plausible values) into a predicted hate score with a fixed-parameter Rasch scaling. The two prongs of this work allow arbitrary text to be placed on an interval spectrum ranging from genocidal hate speech on one extreme to supportive identity speech on the other extreme. In sum, we successfully created an initial measurement system for hate speech. Future work will no doubt provide further improvements to the scale creation and prediction algorithm, as well as the source data collection and the comment labeling system.
While we have focused on our hate speech problem of interest, the methodology we have developed is applicable whenever humans review data to make a judgment, and that summary judgment could be based on multiple component parts. That data could be images or video just as well as text, or other data structures such as time series. Within natural language processing, sentiment analysis is one of the most widely used supervised learning problems; we suspect that the application of our method to measure sentiment would lead to substantial improvements in that subfield. Automated essay grading might be an even more straight-forward application of our method. Possible video applications include the automated evaluation of technical skill derived from videos of surgical procedures, where a multi-component labeling instrument is already used by human judges, called ?OSATS? [49], and the assessment of the quality of surgical wound closure [8]. Numerous other applications could likely be developed in future years.
5.1 Limitations and future work
Our work thus far is promising but with some known limitations. The ten items used for scaling deserve further comparison and development; we may be able to remove certain items or add additional items to increase reliability. During the scale development our estimated item fit statistics encouraged the collapsing of response options to improve invariance. This suggests that reviewers had difficulty with consistently differentiating between response options for several items. This is quite reasonable given that our response options were primarily Likert-style ?strongly agree? to ?strongly disagree? - those options are inherently subjective and ambiguous. Additional theorization, qualitative review, and pilot testing of improved response options could lead to better measurement characteristics, particularly for the items with greater estimated difficulty such as genocide and violence. Clearer, more objective response options that are consistently interpreted should then result in reduced variance in the rater severity parameter, and increased precision for the latent variable. That increased precision may better separate the latent variable estimates for the different theorized levels in our reference set. Further refinement of the reference set and theorized levels may help to provide even more granular distinct levels of measurement. Incorporation of the rater bundle model into our estimation procedure will also provide a more accurate estimate of instrument reliability [84].
In addition to those incremental improvements, our leveraging of item response modeling opens up powerful methods for the analysis of bias and fairness. The field of measurement has long examined bias in exam questions through the lenses of differential item functioning (DIF) and differential rater severity [52]. DIF methods can test if one of our 10 components of hate speech does not operate consistently for certain subsets of comments. For example, if reviewers are more likely to rate comments with a racial dialect as being disrespectful [72], we can statistically identify the issue and work to create alternative item wording that mitigates the bias. If certain individual reviewers interpret the items more harshly for comments that include sexist speech, we can also identify that statistically and correct for that bias in our analysis. These types of analyses are standard practice when analyzing item response theory scales, and can be executed within a formal statistical framework that is comprehensive for the wide variety of identity groups that are included in our labeled data. Evaluation and improvement of bias & fairness will be a significant part of our future work in this line of research.
With regard to the deep learning modeling, we have not yet reached the limits of supervised performance using our existing training data. The language representation backend can be continually upgraded as new language models are developed, such as T5 [63]. In-domain pretraining of the language model on our own corpus of social media comments would likely improve performance, which is an upgrade we are currently exploring. Both the multi-task architecture and implementation of ordinal loss and activation likely have untapped performance improvements, such as those that might be discovered through neural architecture search or through customized task weighting [39]. The integration of the IRT transformation with the multi-task predictions bears substantial future experimentation to answer key questions. Can we approximate the IRT transformation through an integrated neural subnetwork? Is plausible value sampling the best way to capture uncertainty in the predicted ratings? What about using the item ratings as a pretraining objective for a two-stage model that predicts the continuous score directly, or integrating the item ratings and the continuous score into a single multi-task network? Robustness to misspellings or other adversarial orthography would be yet another helpful improvement [79]. Lastly, numerous low-level optimization improvements are likely possible for the training of deep models, including learning rate scheduling, next-generation optimizers (e.g. Yogi - [90]), and differential learning rates.
We have a number of longer term goals for future work in our hate speech research agenda. Most urgently, there is a need to apply this measurement technology to causal inference problems such as estimating the effects of policy changes, current events, and user interface interventions on hate speech, as well as purely descriptive work to report on temporal hate speech trends. Extending our current model to English-speaking countries outside of the United States (e.g. the United Kingdom, Canada, or English-speaking African states) will require a broader theorization of hate speech for variation in culture and configurations of vulnerable populations. Expanding our platform sources will likely continue to be fruitful for generalizability and linguistic robustness; we hope to include data from Facebook, Instagram, Wikipedia, Twitch, and WhatsApp in later work. Expanding to additional languages, especially Sinhala, Khmer, Arabic, Hindi, and Portuguese, will allow our work to be relevant to developing countries where ethnic conflict, genocide, and extremist violence may be more overt than in the United States. Application of our model and methodology to low-resource languages will be facilitated by our dynamic slur tagging approach, where existing slur lexicons can facilitate early pilot models prior to the development of a full labeled corpus. Releasing our models to select partners through an API will facilitate incorporating them into browser plugins, social media platforms, and other user interface interventions. We also plan to apply our models to extremist literature, such as The Turner Diaries [60] and Hitler’s Mein Kampf, to better understand the role of hate speech in radicalizing literary works.
6 Conclusion
In this paper we described the development of a novel, holistic methodology for measuring hate speech in a scalable, debiased, explainable manner. Based on prior literature, we theorized eight qualitative levels on a scale ranging from genocidal hate speech to counterspeech and collected empirical observations as examples of each level (the reference set). We developed a labeling instrument to record ordinal ratings on 10 components of hate speech through a reviewing process. We collected online comments from three major social media platforms (YouTube, Twitter, and Reddit) and sampled them in such a way as to focus our labeling on comments more likely to be hate speech or counterspeech, but maintaining generalizability by ensuring that all collected comments had a positive probability of selection in our sampling procedure. We created a crowdsourcing-based labeling procedure to allocate comments to reviewers and yield a network linking all reviewers to each other through overlapping comment reviews, facilitating the estimation of the survey interpretation bias of each reviewer (a rater ?fixed effect?). We fit the faceted Rasch partial credit model to create a sample-invariant scale for hate speech that placed comments, survey instrument items, and raters on the same continuous metric, and adjusted the estimated comment hate speech score for the estimated survey interpretation bias of the raters who happened to rate that comment. The statistical diagnostics from the Rasch model allowed us to evaluate the quality of each reviewer and remove crowdsource workers with low-quality responses. Finally, we applied supervised, multitask, Transformer-based deep learning with rater bias as an auxiliary input, followed by an IRT nonlinear post-processsing transformation with plausible value sampling, to learn an estimator that maps raw text to the hate speech score in a robust, explainable manner. That deep learning model was encouraged to gain a more general understanding of language through training on data from three separate social media platforms.
Separately, each of these steps represents a novel contribution to the hate speech literature. In combination, we believe our methodology proposes a paradigm shift in the understanding and measurement of hate speech, and in supervised learning of human-labeled data more broadly. We hope that our work will encourage other researchers to adopt Constructing Measures-style theoretical development & measurement in the study of complex social phenomena, including a transition from dichotomous or ordinal outcomes to continuous, linear scales estimated via Rasch-based item response modeling, corrected for survey interpretation bias of reviewers, and integrated into explainable multitask deep learning architectures. For future updates on our project, data, and models, please visit hatespeech.berkeley.edu.
Funding
This work was funded by the UC Berkeley D-Lab, the Anti-Defamation League, the Berkeley Institute for Data Science, and Google Jigsaw.
Acknowledgments
We thank Nora Broege, Laura Jakli, Ben Gebre-Medhin, Christopher Hench, Simal Ozen Irmak, Aniket Kesari, Renata Barreto-Montenegro, Aaron Culich, and Kimberly Izar for their valuable contributions to the project. For research assistance we acknowledge the thoughtful work of Andy Chu, Chengzhi Huang, Jinlin He, Eshaan Pathak, and Violet Yao. For helpful comments and collaboration we are grateful to Rachel Rosen, Sebastian Raschka, Victor Vargas, Brittan Heller, D. Alex Hughes, Ahmad Sultan, Adam Anderson, David Mongeau, Karen Draney, Daniel Kelley, Perman Gochyev, Alan Hubbard, Mark van der Laan, and especially Mark Wilson. We thank our item panel pilot testers and study participants for their comment reviews, particularly given the emotionally taxing nature of the material.
References
- 1. David Andrich “Rating scales and Rasch measurement” In Expert review of pharmacoeconomics & outcomes research 11.5 Taylor & Francis, 2011, pp. 571–585
- 2. Anti-Defamation League “Empowering young people in the aftermath of hate”, 2016 URL: https://www.adl.org/education/resources/tools-and-strategies/empowering-young-people-in-the-aftermath-of-hate-en
- 3. Lora Aroyo, Lucas Dixon, Nithum Thain, Olivia Redfield and Rachel Rosen “Crowdsourcing Subjective Tasks: The Case Study of Understanding Toxicity in Online Discussions” In Companion Proceedings of The 2019 World Wide Web Conference, 2019, pp. 1100–1105 ACM
- 4. Pinkesh Badjatiya, Shashank Gupta, Manish Gupta and Vasudeva Varma “Deep learning for hate speech detection in tweets” In Proceedings of the 26th International Conference on World Wide Web Companion, 2017, pp. 759–760 International World Wide Web Conferences Steering Committee
- 5. Christopher Beckham and Christopher Pal “Unimodal probability distributions for deep ordinal classification” In arXiv preprint arXiv:1705.05278, 2017
- 6. Susan Benesch, Cathy Buerger, Tonei Glavinic and Sean Manion “Dangerous Speech: A Practical Guide” In Dangerous Speech Project, 2018
- 7. Adam J Berinsky, Gregory A Huber and Gabriel S Lenz “Evaluating online labor markets for experimental research: Amazon. com’s Mechanical Turk” In Political analysis 20.3 Cambridge University Press, 2012, pp. 351–368
- 8. NS Blencowe, L Rooshenas, Z Tolkien, KD Bera, H Gould Brown, D Elliott, BC Reeves and JM Blazeby “A qualitative study to identify indicators of the quality of wound closure” In Journal of Infection Prevention 20.5 SAGE Publications Sage UK: London, England, 2019, pp. 214–223
- 9. Wenzhi Cao, Vahid Mirjalili and Sebastian Raschka “Rank-consistent ordinal regression for neural networks” In arXiv preprint arXiv:1901.07884, 2019
- 10. Rich Caruana “Multitask learning” In Machine learning 28.1 Springer, 1997, pp. 41–75
- 11. Hasok Chang “Inventing temperature: Measurement and scientific progress” Oxford University Press, 2004
- 12. Tianqi Chen and Carlos Guestrin “Xgboost: A scalable tree boosting system” In Proceedings of the 22nd acm sigkdd international conference on knowledge discovery and data mining, 2016, pp. 785–794
- 13. Hugh A Chipman, Edward I George and Robert E McCulloch “BART: Bayesian additive regression trees” In The Annals of Applied Statistics 4.1 Institute of Mathematical Statistics, 2010, pp. 266–298
- 14. Francois Chollet “Keras”, https://keras.io, 2015
- 15. Jacob Cohen “The cost of dichotomization” In Applied psychological measurement 7.3 Sage Publications Sage CA: Thousand Oaks, CA, 1983, pp. 249–253
- 16. Joaquim F Pinto Costa, Hugo Alonso and Jaime S Cardoso “The unimodal model for the classification of ordinal data” In Neural Networks 21.1 Elsevier, 2008, pp. 78–91
- 17. Thomas Davidson, Dana Warmsley, Michael Macy and Ingmar Weber “Automated hate speech detection and the problem of offensive language” In Eleventh International AAAI Conference on Web and Social Media, 2017
- 18. Neal V Dawson and Robert Weiss “Dichotomizing continuous variables in statistical analysis: a practice to avoid.” Sage Publications, 2012
- 19. Fabio Del Vigna, Andrea Cimino, Felice Dell’Orletta, Marinella Petrocchi and Maurizio Tesconi “Hate me, hate me not: Hate speech detection on Facebook”, 2017
- 20. Jacob Devlin, Ming-Wei Chang, Kenton Lee and Kristina Toutanova “Bert: Pre-training of deep bidirectional transformers for language understanding” In arXiv preprint arXiv:1810.04805, 2018
- 21. Lucas Dixon, John Li, Jeffrey Sorensen, Nithum Thain and Lucy Vasserman “Measuring and mitigating unintended bias in text classification” In Proceedings of the 2018 AAAI/ACM Conference on AI, Ethics, and Society, 2018, pp. 67–73 ACM
- 22. Nemanja Djuric, Jing Zhou, Robin Morris, Mihajlo Grbovic, Vladan Radosavljevic and Narayan Bhamidipati “Hate speech detection with comment embeddings” In Proceedings of the 24th international conference on world wide web, 2015, pp. 29–30 ACM
- 23. Thomas Eckes “Introduction to many-facet Rasch measurement, 2nd Ed.” Frankfurt: Peter Lang, 2015
- 24. George Engelhard Jr “Invariant measurement: Using Rasch models in the social, behavioral, and health sciences” Routledge, 2013
- 25. George Engelhard Jr and Stefanie Wind “Invariant measurement with raters and rating scales: Rasch models for rater-mediated assessments” Routledge, 2018
- 26. Ronald Aylmer Fisher “Two new properties of mathematical likelihood” In Proceedings of the Royal Society of London. Series A, Containing Papers of a Mathematical and Physical Character 144.852 The Royal Society London, 1934, pp. 285–307
- 27. Paula Fortuna and Sergio Nunes “A survey on automatic detection of hate speech in text” In ACM Computing Surveys (CSUR) 51.4 ACM, 2018, pp. 85
- 28. Antigoni-Maria Founta, Despoina Chatzakou, Nicolas Kourtellis, Jeremy Blackburn, Athena Vakali and Ilias Leontiadis “A unified deep learning architecture for abuse detection” In arXiv preprint arXiv:1802.00385, 2018
- 29. Mor Geva, Yoav Goldberg and Jonathan Berant “Are We Modeling the Task or the Annotator? An Investigation of Annotator Bias in Natural Language Understanding Datasets” In arXiv preprint arXiv:1908.07898, 2019
- 30. Ian Goodfellow, Yoshua Bengio and Aaron Courville “Deep learning” MIT press, 2016
- 31. Benjamin Heinzerling “NLP’s Clever Hans Moment has Arrived”, 2019 The Gradient URL: https://thegradient.pub/nlps-clever-hans-moment-has-arrived/
- 32. Grant Henning “Accounting for nonsystematic error in performance ratings” In Language Testing 13.1 Sage Publications Sage CA: Thousand Oaks, CA, 1996, pp. 53–61
- 33. Daniel G Horvitz and Donovan J Thompson “A generalization of sampling without replacement from a finite universe” In Journal of the American statistical Association 47.260 Taylor & Francis Group, 1952, pp. 663–685
- 34. Le Hou, Chen-Ping Yu and Dimitris Samaras “Squared earth mover’s distance-based loss for training deep neural networks” In arXiv preprint arXiv:1611.05916, 2016
- 35. Jeremy Howard and Sebastian Ruder “Universal language model fine-tuning for text classification” In arXiv preprint arXiv:1801.06146, 2018
- 36. Andrej Karpathy “Multi-Task Learning in the Wilderness” ICML, 2019 URL: https://slideslive.com/38917690/multitask-learning-in-the-wilderness
- 37. Chris Kennedy “CORAL: Ordinal Regression in Keras” pypi.org, 2020 URL: https://github.com/ck37/coral-ordinal
- 38. Douwe Kiela, Hamed Firooz, Aravind Mohan, Vedanuj Goswami, Amanpreet Singh, Pratik Ringshia and Davide Testuggine “The Hateful Memes Challenge: Detecting Hate Speech in Multimodal Memes” In arXiv preprint arXiv:2005.04790, 2020
- 39. Nikita Klyuchnikov, Ilya Trofimov, Ekaterina Artemova, Mikhail Salnikov, Maxim Fedorov and Evgeny Burnaev “Nas-bench-nlp: Neural architecture search benchmark for natural language processing” In arXiv preprint arXiv:2006.07116, 2020
- 40. John M Linacre “An extension of the Rasch model to multi-facet situations” In Chicago: University of Chicago, Department of Education, 1987
- 41. John M Linacre “Many-facet Rasch measurement” Chicago, IL: MESA Press, 1989 URL: https://www.winsteps.com/a/Linacre-MFRM-book.pdf
- 42. John M Linacre “Investigating rating scale category utility” In Journal of outcome measurement 3 Rehabilitation Foundation Inc, 1999, pp. 103–122
- 43. John M Linacre “What do infit and outfit, mean-square and standardized mean?” In Rasch Measurement Transactions 16.2, 2002, pp. 878 URL: https://www.rasch.org/rmt/rmt162f.htm
- 44. John M Linacre “Facets computer program for many-facet Rasch measurement, version 3.83.0” Beaverton, Oregon: Winsteps.com, 2019
- 45. John M Linacre and Benjamin D Wright “Construction of measures from many-facet data.” In Journal of Applied Measurement Richard M Smith, 2002
- 46. Bing Liu “Sentiment analysis: Mining opinions, sentiments, and emotions” Cambridge University Press, 2015
- 47. Yinhan Liu et al. “Roberta: A robustly optimized bert pretraining approach” In arXiv preprint arXiv:1907.11692, 2019
- 48. Rijul Magu, Kshitij Joshi and Jiebo Luo “Detecting the hate code on social media” In Eleventh International AAAI Conference on Web and Social Media, 2017
- 49. JA Martin, Glenn Regehr, Richard Reznick, Helen Macrae, John Murnaghan, Carol Hutchison and M Brown “Objective structured assessment of technical skill (OSATS) for surgical residents” In British journal of surgery 84.2 John Wiley & Sons, Ltd. Bristol, 1997, pp. 273–278
- 50. Geoff N Masters “A Rasch model for partial credit scoring” In Psychometrika 47.2 Springer, 1982, pp. 149–174
- 51. Eiji Muraki “A generalized partial credit model: Application of an EM algorithm” In ETS Research Report Series 1992.1 Wiley Online Library, 1992, pp. i–30
- 52. Carol M Myford and Edward W Wolfe “Detecting and measuring rater effects using many-facet Rasch measurement: Part I” In Journal of applied measurement 4.4, 2003, pp. 386–422
- 53. Timothy Niven and Hung-Yu Kao “Probing Neural Network Comprehension of Natural Language Arguments” In Proceedings of the 57th Annual Meeting of the Association for Computational Linguistics Florence, Italy: Association for Computational Linguistics, 2019, pp. 4658–4664 DOI: 10.18653/v1/P19-1459
- 54. Chikashi Nobata, Joel Tetreault, Achint Thomas, Yashar Mehdad and Yi Chang “Abusive language detection in online user content” In Proceedings of the 25th international conference on world wide web, 2016, pp. 145–153 International World Wide Web Conferences Steering Committee
- 55. Randal S Olson and Jason H Moore “TPOT: A tree-based pipeline optimization tool for automating machine learning” In Automated Machine Learning Springer, 2019, pp. 151–160
- 56. Randal S Olson, Ryan J Urbanowicz, Peter C Andrews, Nicole A Lavender, La Creis Kidd and Jason H Moore “Applications of Evolutionary Computation: 19th European Conference, EvoApplications 2016, Porto, Portugal, March 30 – April 1, 2016, Proceedings, Part I” Springer International Publishing, 2016, pp. 123–137 DOI: 10.1007/978-3-319-31204-0_9
- 57. Jennimaria Palomaki, Olivia Rhinehart and Michael Tseng “A Case for a Range of Acceptable Annotations.” In SAD/CrowdBias@ HCOMP, 2018, pp. 19–31
- 58. Sinno Jialin Pan and Qiang Yang “A survey on transfer learning” In IEEE Transactions on knowledge and data engineering 22.10 IEEE, 2009, pp. 1345–1359
- 59. Andrew Perrin and Monica Anderson “Share of U.S. adults using social media, including Facebook, is mostly unchanged since 2018”, 2019 URL: https://www.pewresearch.org/fact-tank/2019/04/10/share-of-u-s-adults-using-social-media-including-facebook-is-mostly-unchanged-since-2018/
- 60. William Luther Pierce and Andrew MacDonald “The Turner Diaries” William Luther Pierce, 1978
- 61. Eric Polley, Erin LeDell, Chris Kennedy, Sam Lendle and Mark Laan “Package ’SuperLearner”’ CRAN, 2019
- 62. Alec Radford, Jeffrey Wu, Rewon Child, David Luan, Dario Amodei and Ilya Sutskever “Language models are unsupervised multitask learners” In OpenAI Blog 1, 2019, pp. 8
- 63. Colin Raffel, Noam Shazeer, Adam Roberts, Katherine Lee, Sharan Narang, Michael Matena, Yanqi Zhou, Wei Li and Peter J Liu “Exploring the limits of transfer learning with a unified text-to-text transformer” In arXiv preprint arXiv:1910.10683, 2019
- 64. Rajeev Ranjan, Swami Sankaranarayanan, Carlos D Castillo and Rama Chellappa “An all-in-one convolutional neural network for face analysis” In 2017 12th IEEE International Conference on Automatic Face & Gesture Recognition (FG 2017), 2017, pp. 17–24 IEEE
- 65. G Rasch “On simultaneous factor analysis in several populations” In Uppsala Symposium on Psychological Factor Analysis, 17-19 March 1953, 1953, pp. 65–71 Taylor & Francis
- 66. G Rasch “Probabilistic models for some intelligence and attainment tests. 1960” In Copenhagen, Denmark: Danish Institute for Educational Research, 1980
- 67. Bjirn Ross, Michael Rist, Guillermo Carbonell, Benjamin Cabrera, Nils Kurowsky and Michael Wojatzki “Measuring the Reliability of Hate Speech Annotations: The Case of the European Refugee Crisis” In Proceedings of NLP4CMC III: 3rd Workshop on Natural Language Processing for Computer-Mediated Communication 17, Bochumer Linguistische Arbeitsberichte, 2016, pp. 6–9
- 68. Patrick Royston, Douglas G Altman and Willi Sauerbrei “Dichotomizing continuous predictors in multiple regression: a bad idea” In Statistics in medicine 25.1 Wiley Online Library, 2006, pp. 127–141
- 69. Sebastian Ruder “An overview of multi-task learning in deep neural networks” In arXiv preprint arXiv:1706.05098, 2017
- 70. Sebastian Ruder “NLP’s ImageNet moment has arrived” In The Gradient, 2018 URL: https://thegradient.pub/nlp-imagenet/
- 71. Fumiko Samejima “Graded response models” In Handbook of item response theory, volume one ChapmanHall/CRC, 2016, pp. 123–136
- 72. Maarten Sap, Dallas Card, Saadia Gabriel, Yejin Choi and Noah A Smith “The risk of racial bias in hate speech detection” In Proceedings of the 57th Annual Meeting of the Association for Computational Linguistics, 2019, pp. 1668–1678
- 73. Andrew Sellars “Defining hate speech”, 2016 URL: https://dx.doi.org/10.2139/ssrn.2882244
- 74. Stephen Senn “Disappointing dichotomies” In Pharmaceutical Statistics: The Journal of Applied Statistics in the Pharmaceutical Industry 2.4 Wiley Online Library, 2003, pp. 239–240
- 75. Alexandra Siegel, Evgenii Nikitin, Pablo Barbera, Joanna Sterling, Bethany Pullen, Richard Bonneau, Jonathan Nagler and Joshua A Tucker “Trumping Hate on Twitter? Online Hate Speech in the 2016 US Election Campaign and its Aftermath”, 2019
- 76. Gregory Stanton “The Ten Stages of Genocide”, 2013 Genocide Watch URL: https://www.genocidewatch.com/ten-stages-of-genocide
- 77. David L Streiner “Breaking up is hard to do: the heartbreak of dichotomizing continuous data” In The Canadian Journal of Psychiatry 47.3 SAGE Publications Sage CA: Los Angeles, CA, 2002, pp. 262–266
- 78. Nadine Strossen “Hate: Why we should resist it with free speech, not censorship” Oxford University Press, 2018
- 79. Lichao Sun, Kazuma Hashimoto, Wenpeng Yin, Akari Asai, Jia Li, Philip Yu and Caiming Xiong “Adv-BERT: BERT is not robust on misspellings! Generating nature adversarial samples on BERT” In arXiv preprint arXiv:2003.04985, 2020
- 80. Alexander Tsesis “Destructive messages: How hate speech paves the way for harmful social movements” NYU Press, 2002
- 81. Ashish Vaswani, Noam Shazeer, Niki Parmar, Jakob Uszkoreit, Llion Jones, Aidan N Gomez, Lukasz Kaiser and Illia Polosukhin “Attention is all you need” In Advances in neural information processing systems, 2017, pp. 5998–6008
- 82. William Warner and Julia Hirschberg “Detecting hate speech on the world wide web” In Proceedings of the second workshop on language in social media, 2012, pp. 19–26 Association for Computational Linguistics
- 83. Mark Wilson “Constructing measures: An item response modeling approach” Routledge, 2004
- 84. Mark Wilson and Machteld Hoskens “The rater bundle model” In Journal of Educational and Behavioral Statistics 26.3 Sage Publications Sage CA: Los Angeles, CA, 2001, pp. 283–306
- 85. Richard Ashby Wilson “Incitement on trial: prosecuting international speech crimes” Cambridge University Press, 2017
- 86. Thomas Wolf et al. “HuggingFace’s Transformers: State-of-the-art Natural Language Processing” In ArXiv, 2019, pp. arXiv–1910
- 87. Benjamin D Wright “The International Objective Measurement Workshops: Past and future” In Objective measurement: Theory into practice 1 Norwood, NJ: Ablex Publishing Corporation, 1992
- 88. Benjamin D Wright “Comparing Rasch measurement and factor analysis” In Structural Equation Modeling: A Multidisciplinary Journal 3.1 Taylor & Francis, 1996, pp. 3–24
- 89. Benjamin D Wright and Geoff N Masters “Rating scale analysis” MESA press, 1982 URL: https://research.acer.edu.au/measurement/2/
- 90. Manzil Zaheer, Sashank Reddi, Devendra Sachan, Satyen Kale and Sanjiv Kumar “Adaptive methods for nonconvex optimization” In Advances in neural information processing systems, 2018, pp. 9793–9803
- 91. Ziqi Zhang, David Robinson and Jonathan Tepper “Detecting hate speech on twitter using a convolution-gru based deep neural network” In European Semantic Web Conference, 2018, pp. 745–760 Springer
A Appendix
A.1 Scale items from labeling instrument
Item name Prompt Response options Identities 666This item is converted to a binary value of 0 if no identities are present and 1 if any identities are present. It is not directly used in the scale but if a comment is not flagged as having at least one identity group target then the remaining scale items are skipped in our labeling instrument. Is the comment above directed at or about any individual or groups based on: (multiple selections allowed) Race or ethnicity, religion, national origin or citizenship status, gender, sexual orientation, age, disability status, or none of the above 1. Sentiment How would you describe the sentiment of this comment? Strongly negative, somewhat negative, neutral, somewhat positive, strongly positive 2. Respect Is this comment respectful towards the group(s) you previously identified? Strongly disrespectful, disrespectful, neutral, respectful, strongly respectful 3. Insult Do you agree or disagree with the following statement: This comment is insulting towards the group(s) you previously identified. Strongly disagree, disagree, neither disagree nor agree, agree, strongly agree 4. Humiliate Do you agree or disagree with the following statement: This comment is humiliating towards the group(s) you previously identified. Strongly disagree, disagree, neither disagree nor agree, agree, strongly agree 5. Status This comment states that the group(s) you previously identified is: Strongly inferior, inferior, neither superior nor inferior, superior, strongly superior 6. Dehumanize Do you agree or disagree with the following statement: This comment dehumanizes the group(s) you previously identified (e.g., by comparing them to an animal). Strongly disagree, disagree, neither disagree nor agree, agree, strongly agree 7. Violence Do you agree or disagree with the following statement: This comment calls for using violence against the group(s) you previously identified. Strongly disagree, disagree, neither disagree nor agree, agree, strongly agree 8. Genocide Do you agree or disagree with the following statement: This comment calls for the deliberate killing of a large group of people from the group(s) you previously identified. Strongly disagree, disagree, neither disagree nor agree, agree, strongly agree 9. Attack-Defend Is the comment attacking or defending the group(s) you previously identified? Strongly defending, defending, neither defending nor attacking, attacking, strongly attacking 10. Hate speech (binary) 777The question wording and response options for this item are sourced from [75]. Does this comment contain hate speech, defined as “bias-motivated, hostile and malicious language targeted at a person/group because of their actual or perceived innate characteristics, especially when the group is unnecessarily labeled (e.g., “jew bankers”, “n– hooligans”).” The comment contains hate speech if slurs or derogatory language are used toward any person or group regardless of whether or not the target is a member of the slur-target group. (e.g. a comment calling Trump a faggot or a n***** still contains hate speech). Yes, no, unclear
A.2 Identity group targets from labeling instrument
Identity Group Identity Subgroups Race or Ethnicity Black or African American, Latino or non-white Hispanic, Asian, Middle Eastern, Native American or Alaska Native, Pacific Islander, Non-hispanic white Religion Jews, Christians, Buddhists, Hindus, Mormons, Atheists, Muslims National Origin or Citizenship Status A specific country, immigrant, migrant worker, undocumented person Gender Identity Women, men, non-binary or third gender, transgender women, transgender men, transgender (unspecified) Sexual Orientation Bisexual, gay, lesbian, heterosexual Age Children (0 - 12 years old), adolescents / teenagers (13 - 17), young adults / adults (18 - 39), middle-aged (40 - 64), seniors (65 or older) Disability Status People with physical disabilities (e.g., use of wheelchair), people with cognitive disorders (e.g., autism) or learning disabilities (e.g., Down syndrome), people with mental health problems (e.g., depression, addiction), visually impaired people, hearing impaired people, no specific disability
A.3 Data structure for deep learning
Our data structure for the supervised deep learning treated each review of a comment as an observational unit. For a typical comment that was reviewed four times there would be four observations in our training data. Each observation would have the same raw comment text but a unique rater severity for each reviewer, plus the corresponding item ratings that the reviewer provided for that comment. This differs from prior studies which have generally aggregated the data to have one observation per comment, taking the mean or mode of the binary outcome label(s) from the reviewers, and usually discarding comments where inter-rater agreement did not exceed a certain threshold. See Table A3 for an example of the supervised learning data structure.
| Comment Id | Raw text | Rater | Rater severity | Item ratings | Hate speech score | Training or test set |
| 1 | Example A | 1 | 0.9 | 1, 3, 0, … | 1.92 | Train |
| 1 | Example A | 2 | -0.1 | 0, 2, 3, … | 1.92 | Train |
| 1 | Example A | 3 | -0.5 | 1, 1, 2, … | 1.92 | Train |
| 1 | Example A | 4 | 1.2 | 1, 4, 1, … | 1.92 | Train |
| 2 | Example B | 5 | 0.3 | 0, 1, 4, … | -0.43 | Test |
| 2 | Example B | 6 | 0.4 | 0, 3, 4, … | -0.43 | Test |
| 2 | Example B | 7 | -0.6 | 0, 2, 1, … | -0.43 | Test |
| 2 | Example B | 8 | -1.5 | 1, 0, 2, … | -0.43 | Test |
Due to this repeated measures (or hierarchical) data structure we could not use simple randomization to create training/test splits. By random chance it would be likely that some of the reviews for each individual comment would be in the training set and some in the test set, making the test set performance no longer an unbiased estimator of performance on future unseen comments (i.e. due to ?data leakage? across the training/test partitioning). Therefore it was important to conduct clustered randomization at the comment level when creating training/test splits, taking into account the hierarchical data structure so that reviews of a given comment would all be assigned either to training or to test, and not both.
A.4 Rater quality analysis
Crowdsourced labeling is thought to generally provide research-quality data with improved diversity over convenience samples such as undergraduate students [7]. However, it remained important to evaluate the quality of raters that created our labeled data. A subset of workers seek to maximize their effective hourly compensation by completing Amazon Mechanical Turk tasks as quickly as possible, even though their answers may be less accurate than a slower completion speed. That is a rational pursuit of self-interest, provided that it does not lead to their work being rejected upon review. In the case of our study, and academic research in general, ethical considerations precluded us from rejecting the compensation of any study participants, even if their answers were not usable. Experienced crowdsourced workers might be aware of that protocol for academic studies, which could incentivize response satisficing. The main effects of poor quality labeler data include increased variability in the item fit statistics and ability scores, and reduced reliability estimates for the scores, raters, and items.
In order to evaluate the quality of raters’ responses, we first examined the percentage of comments for which the rater had flagged one or more identity groups as being the targeted of the message. Our experimental design ensured that all comment batches contained six comments from our reference set, excluding the neutral level. That meant that at least 6 out of the 26 comments in the batch were known to include an identity group target (23%). The remaining 20 ?original? comments were sourced from a pool of comments that were stratified on our identity model. 90% of those comments exceeded a threshold of 82% probability of containing an identity group, with the remaining 10% of comments being downsampled from those that scored less than 82% probability. The threshold of 82% was chosen based on manual inspection. The average predicted identity probability in comments exceeding the threshold was 90.4%, and whereas for comments below the threshold the average was 27.1%. Therefore the expected identity rate in the 20 original comments was 60%, or 12 comments. The overall 26-comment batch was expected to contain roughly 18 comments with identity group targets (71%).
Figure 1(a) displays a histogram of the identity rate across all 11,143 raters. It is a bimodal distribution, with a peak at 73%, corresponding to 19 comments out of 26 being flagged as having an identity, and at 4%, corresponding to 1 out of 26 comments being flagged as having an identity. As noted previously, each batch consisted of at least 23% of comments containing an identity group target.
We layered on a second dimension of rater quality: the infit mean-squared statistic, a rater fit diagnostic that is calculated during the Rasch scaling [43]. Infit mean-squared has a minimum value of 0 and a maximum of infinity, with an expected value of 1 (or 0 on the log scale). Raters with an infit mean-squared greater than 1 had more randomness or noise in their responses than expected by the Rasch model. Those with a statistic less than 1 had less randomness than expected, suggesting that they may have favored certain response options. Values greater than 2 have been interpreted as degrading the measurement system [43].
We reviewed potential exclusions on both infit mean-squared statistic and the identity percentage statistic. We chose to exclude raters with an infit mean-squared statistic exceeding 1.9 or less than 0.37, or with an identity rate less than 20%. Those thresholds led to 24% of raters being removed, leaving 8,472 as providing acceptable data quality. The post-exclusion scatter plot appeared to have a reasonable bivariate normal distribution and the smoothed identity rate became nearly flat across the infit mean-squared statistic.
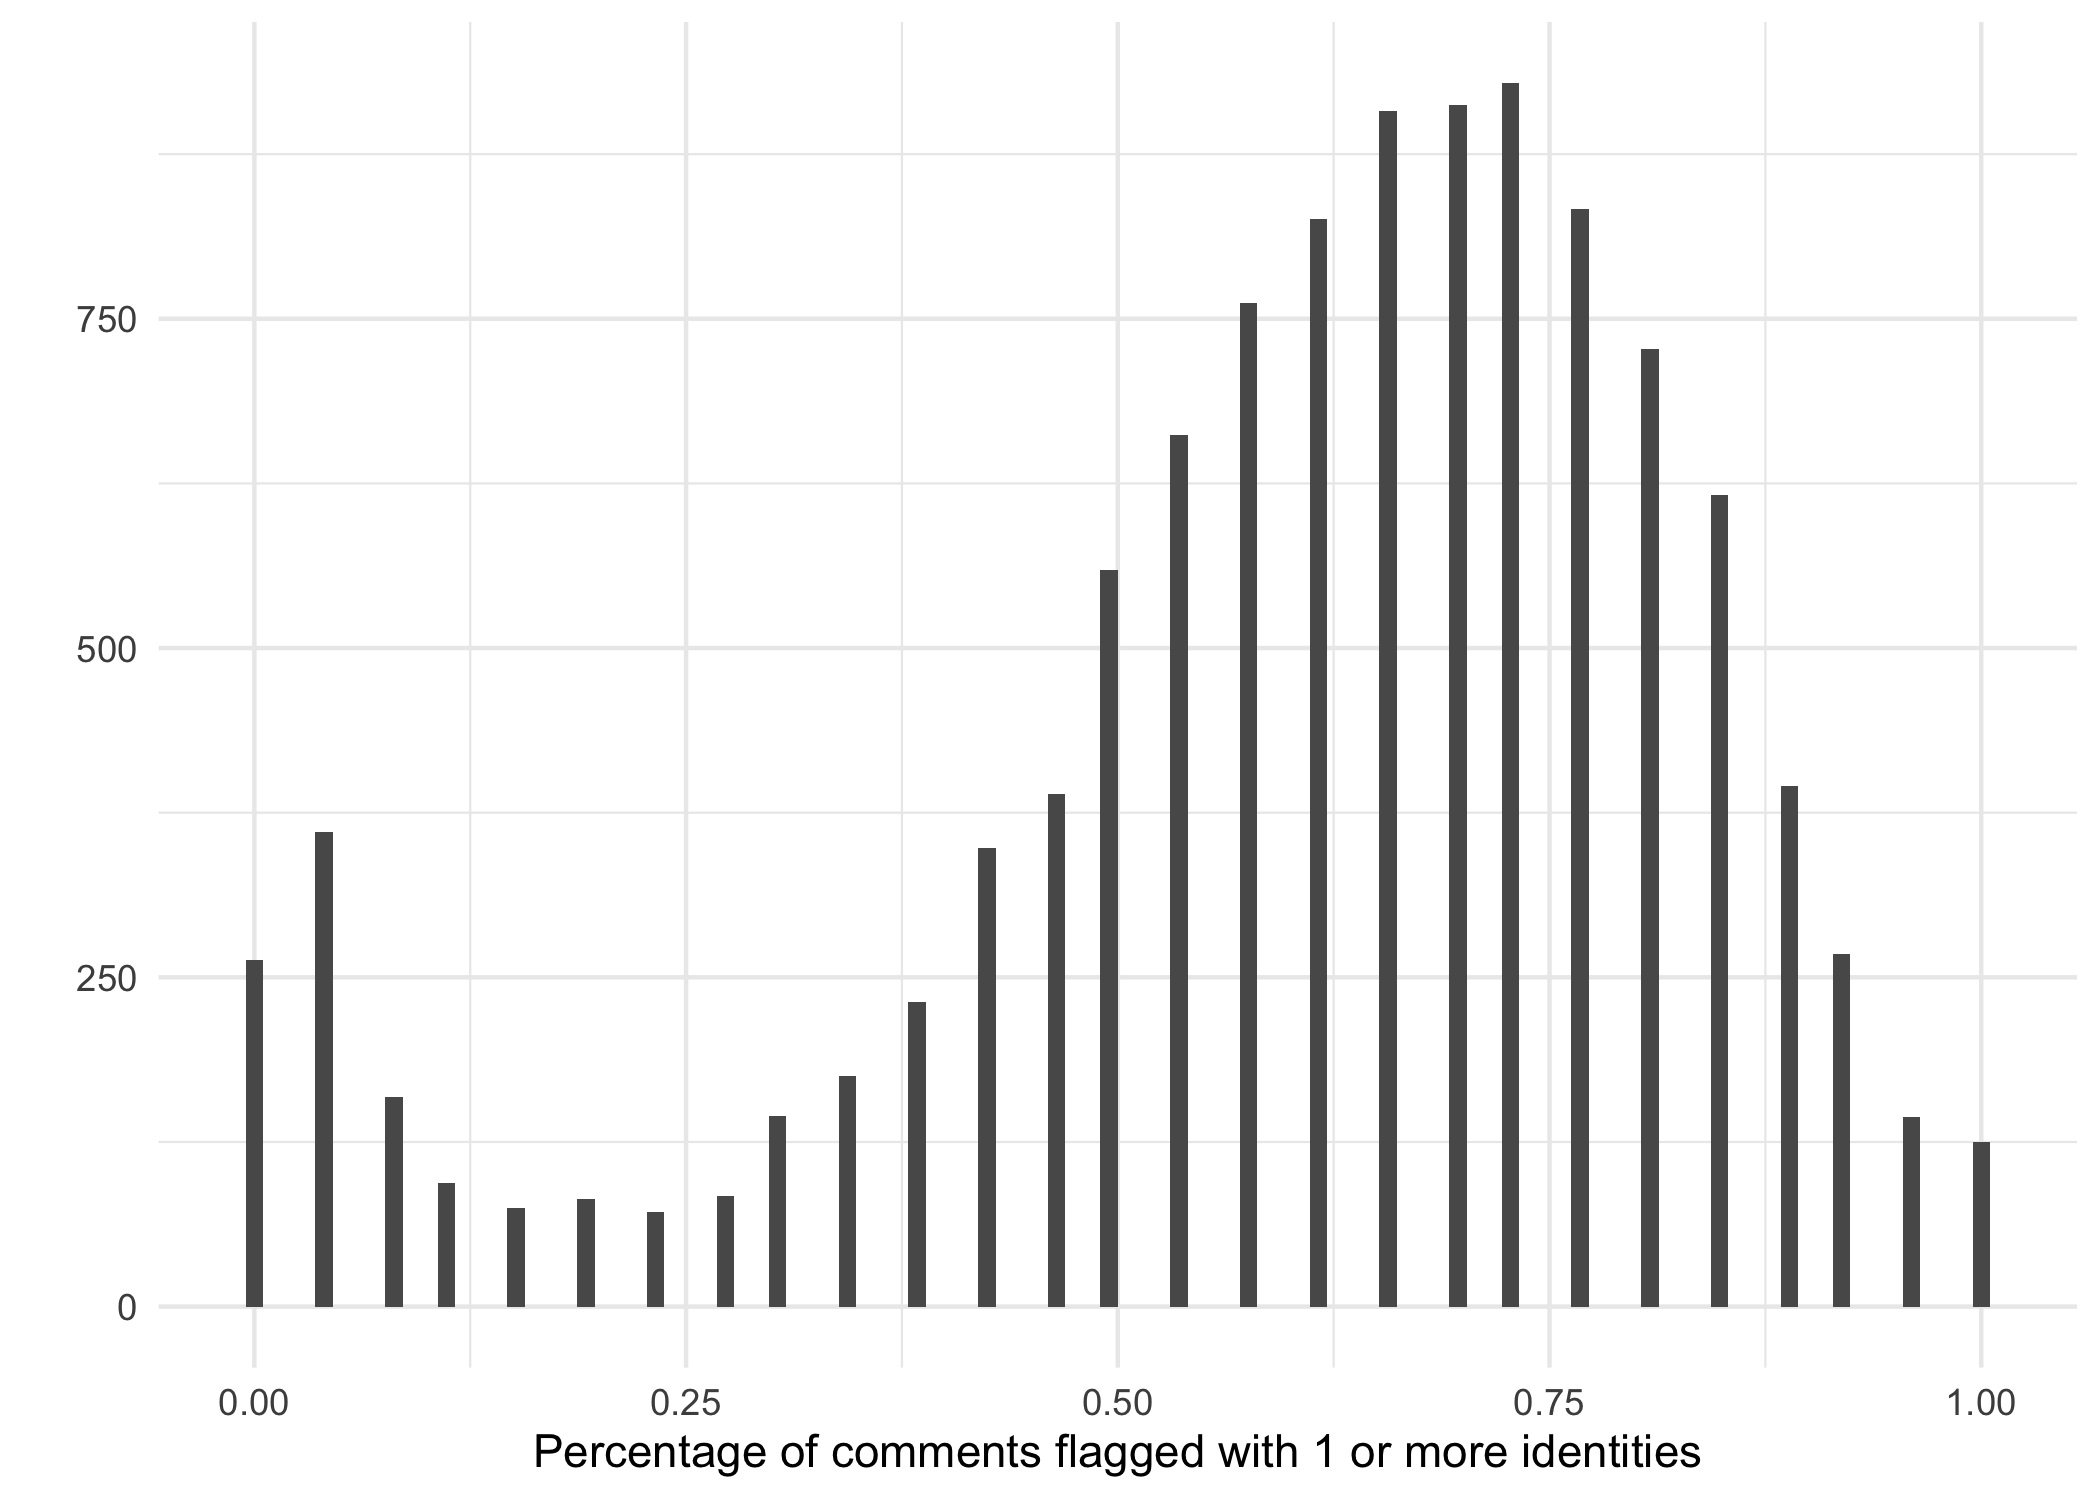
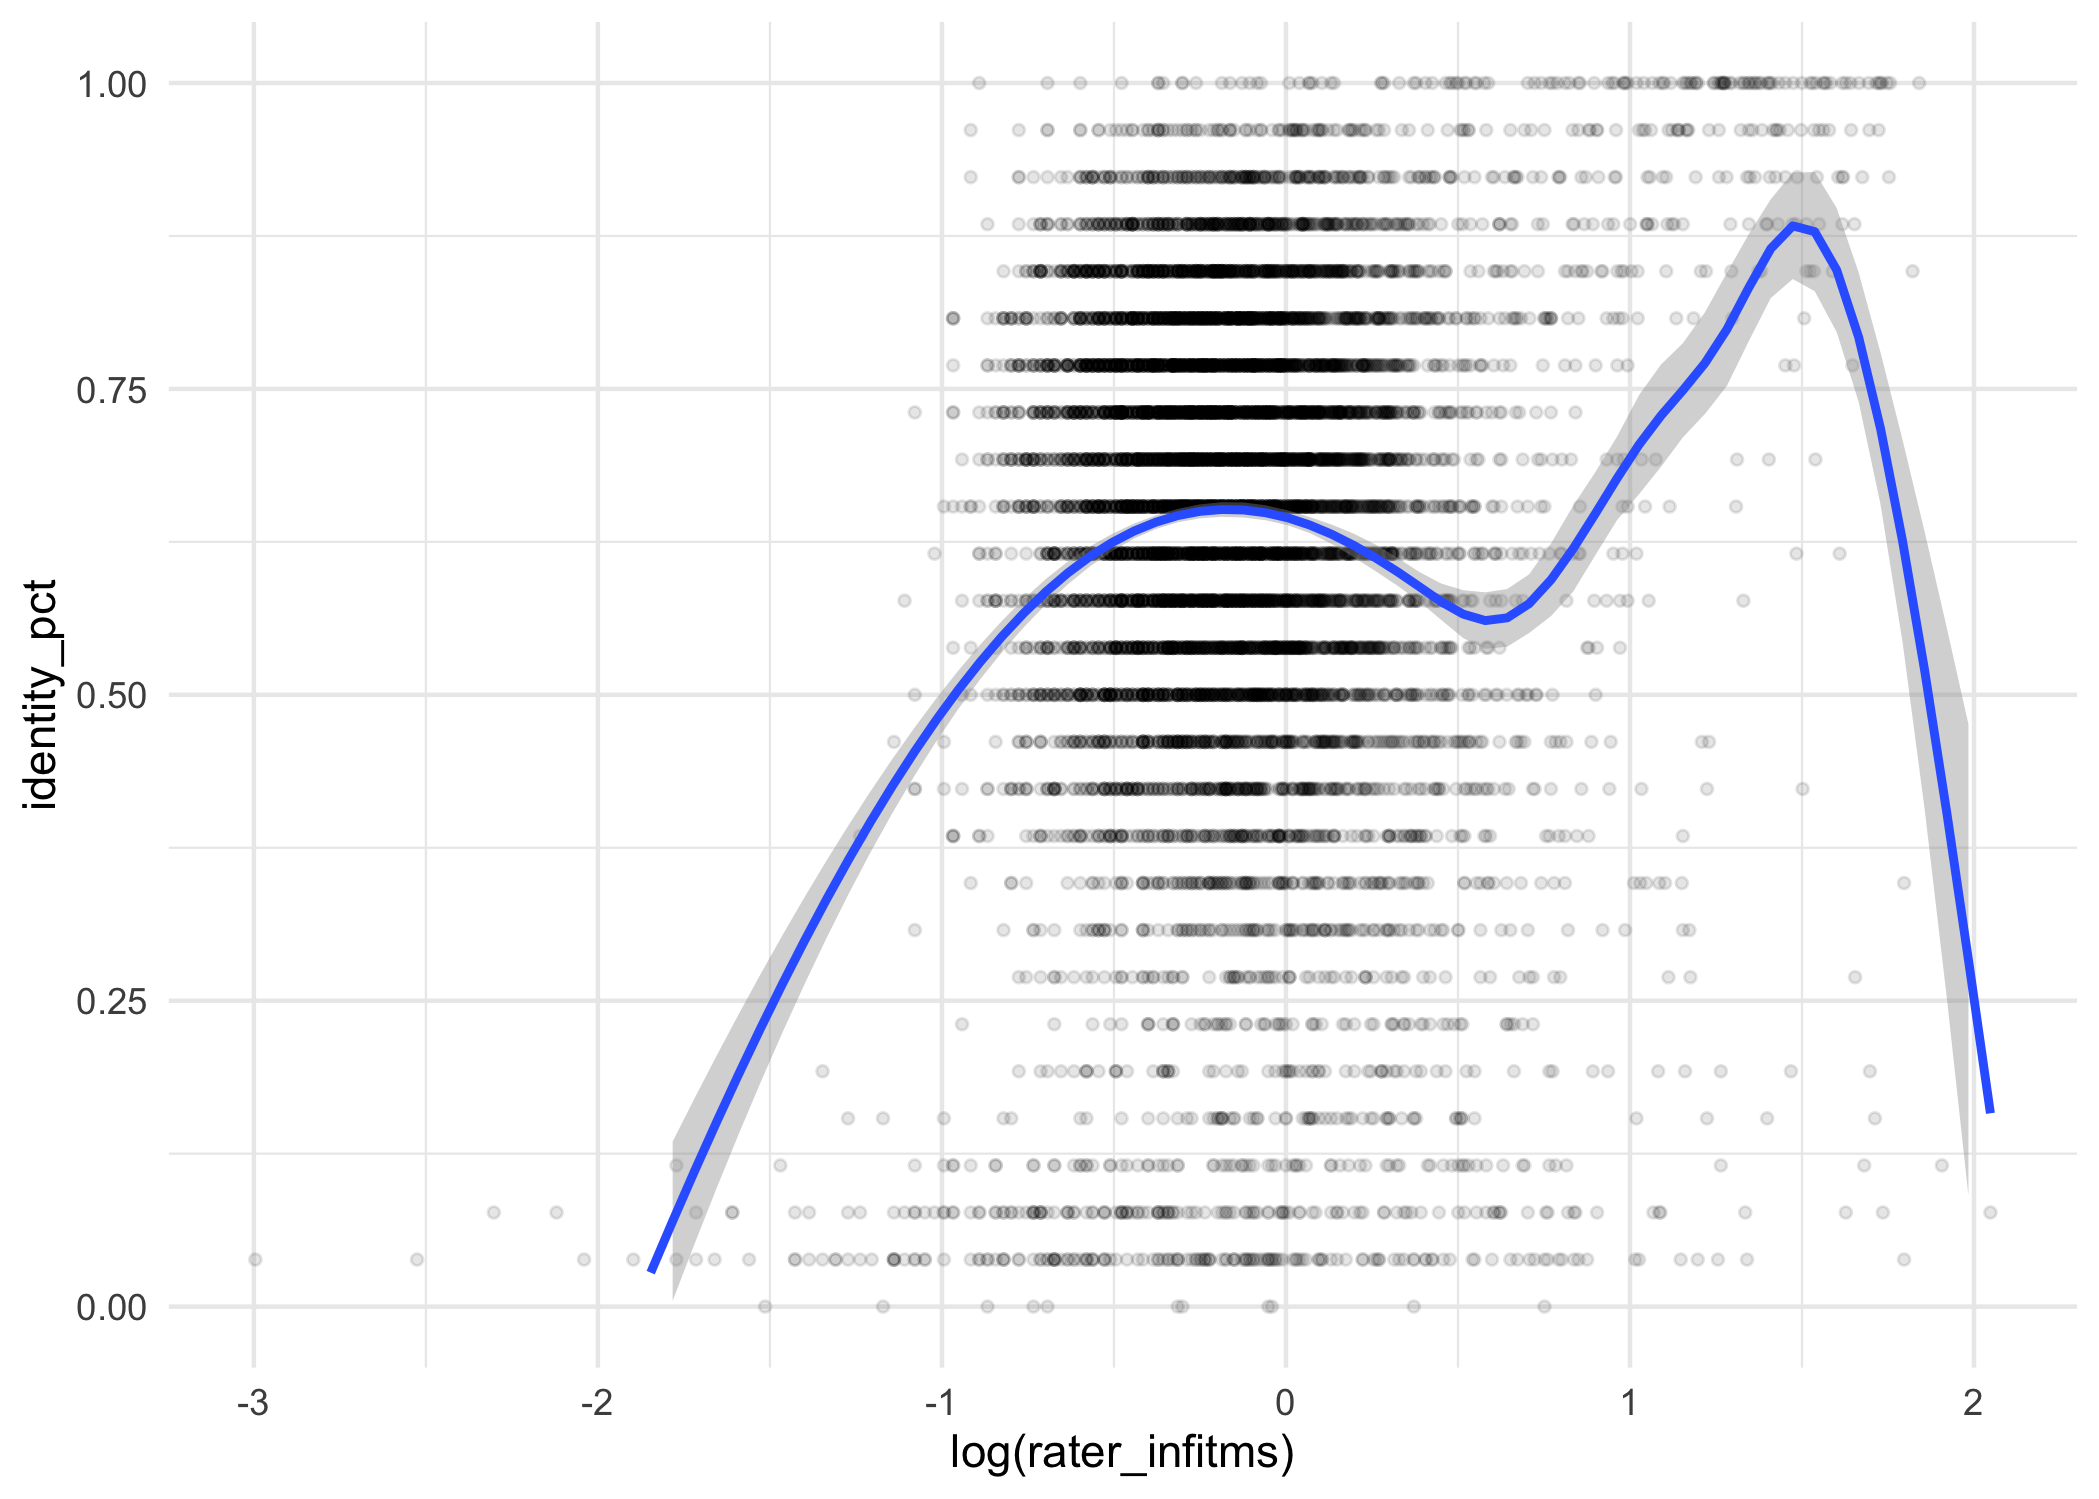
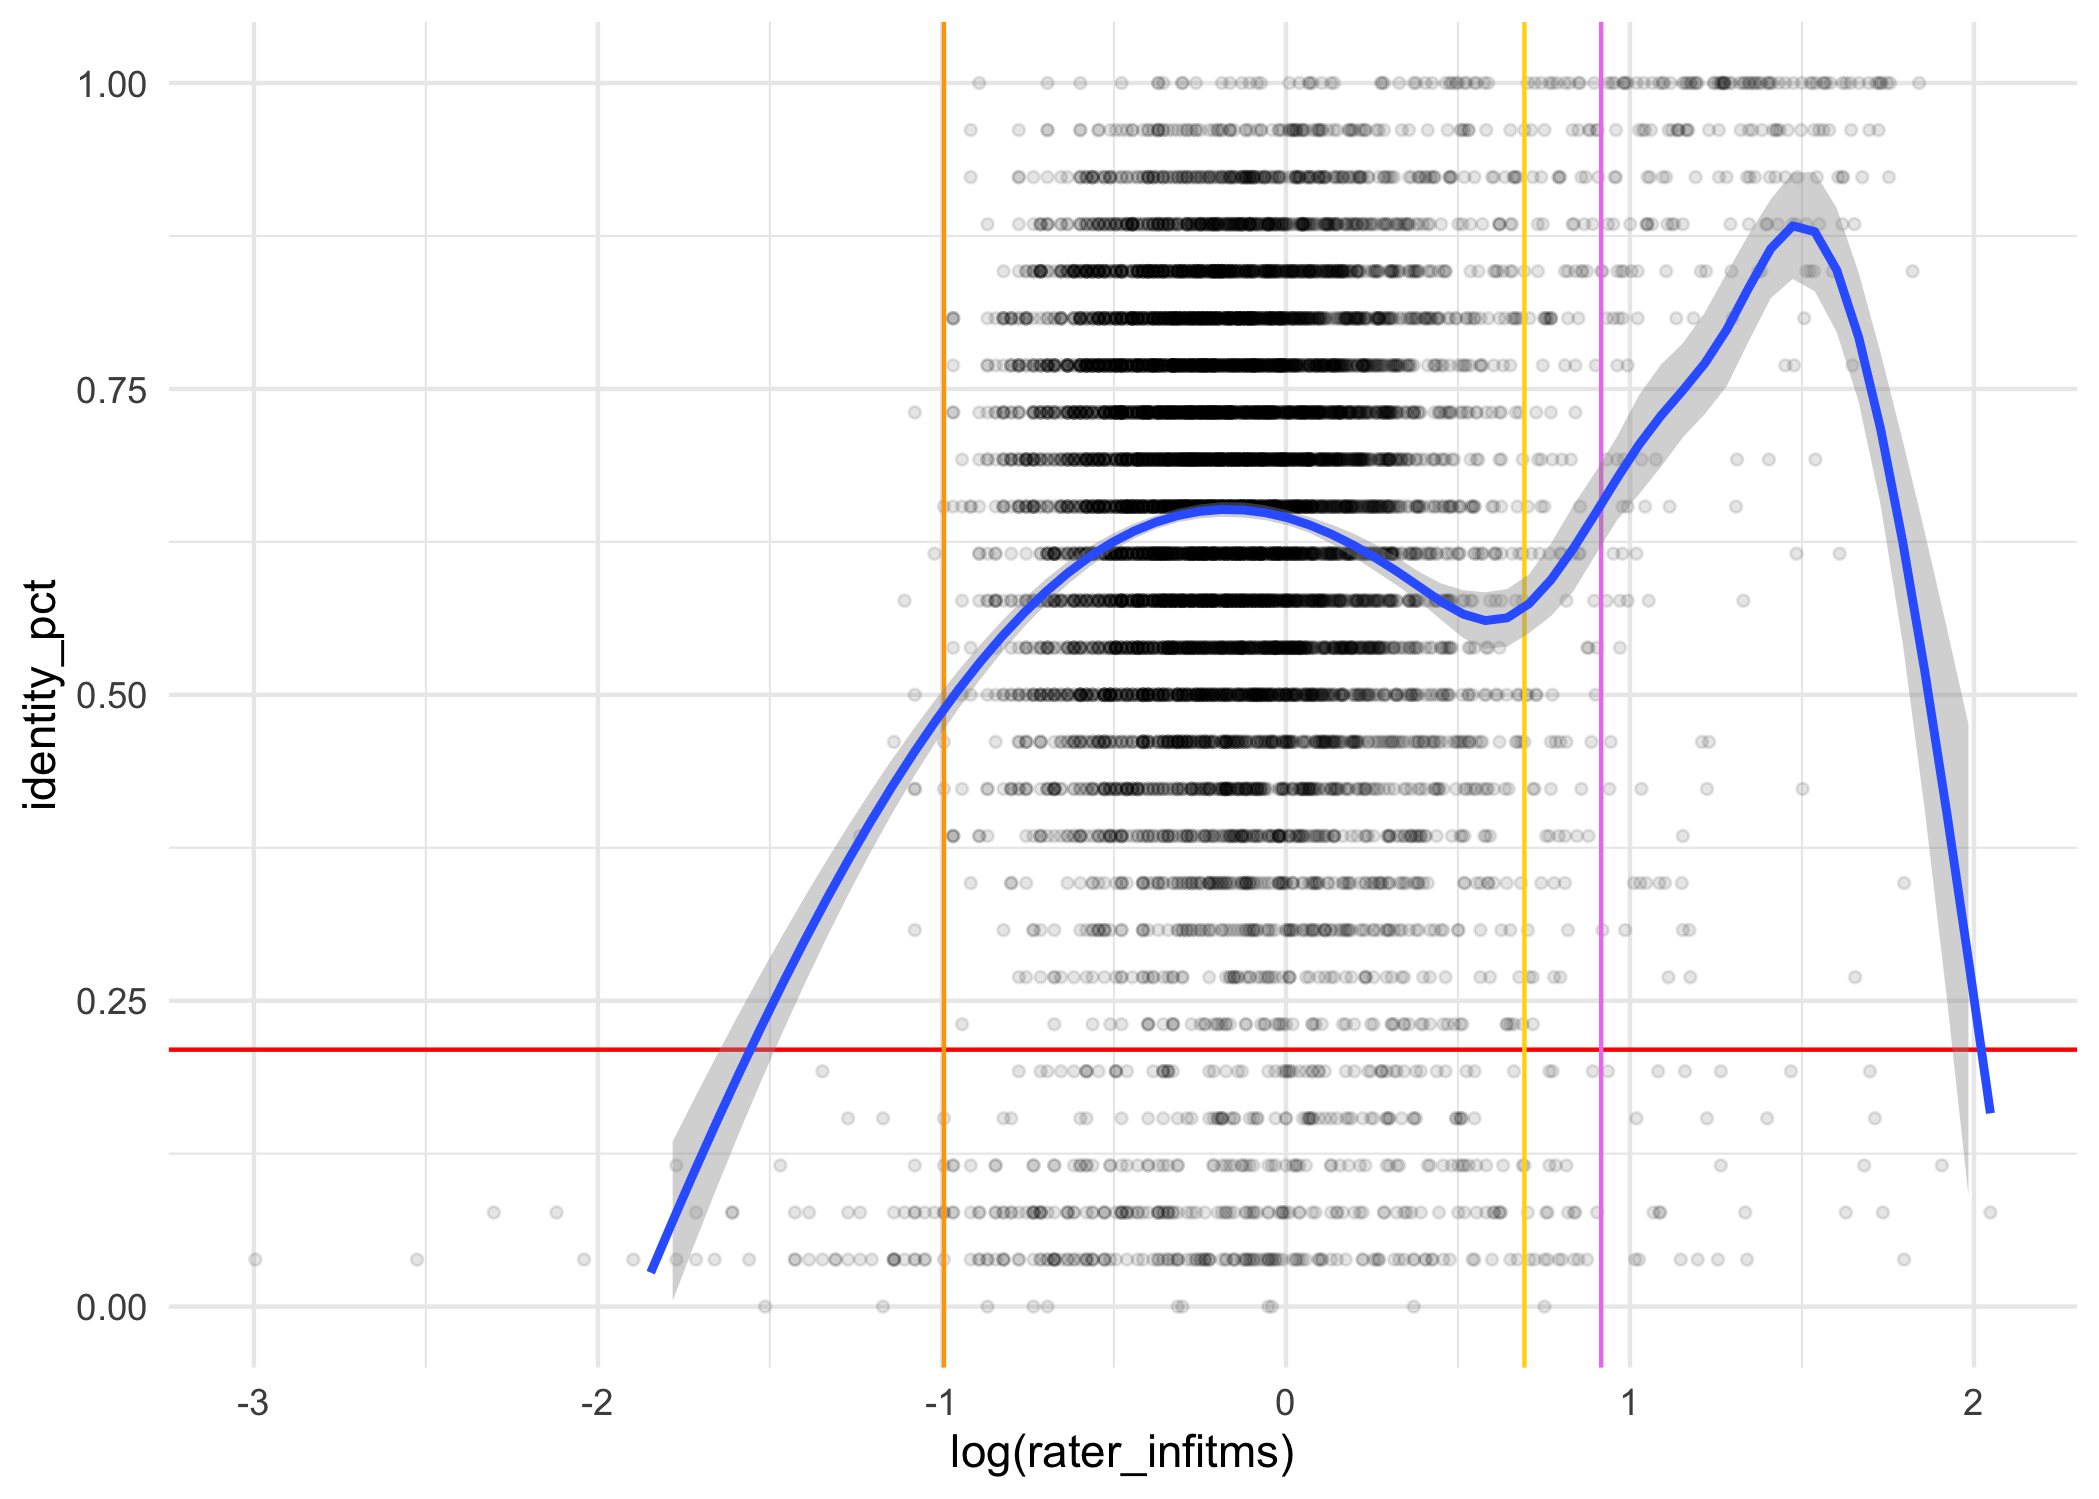
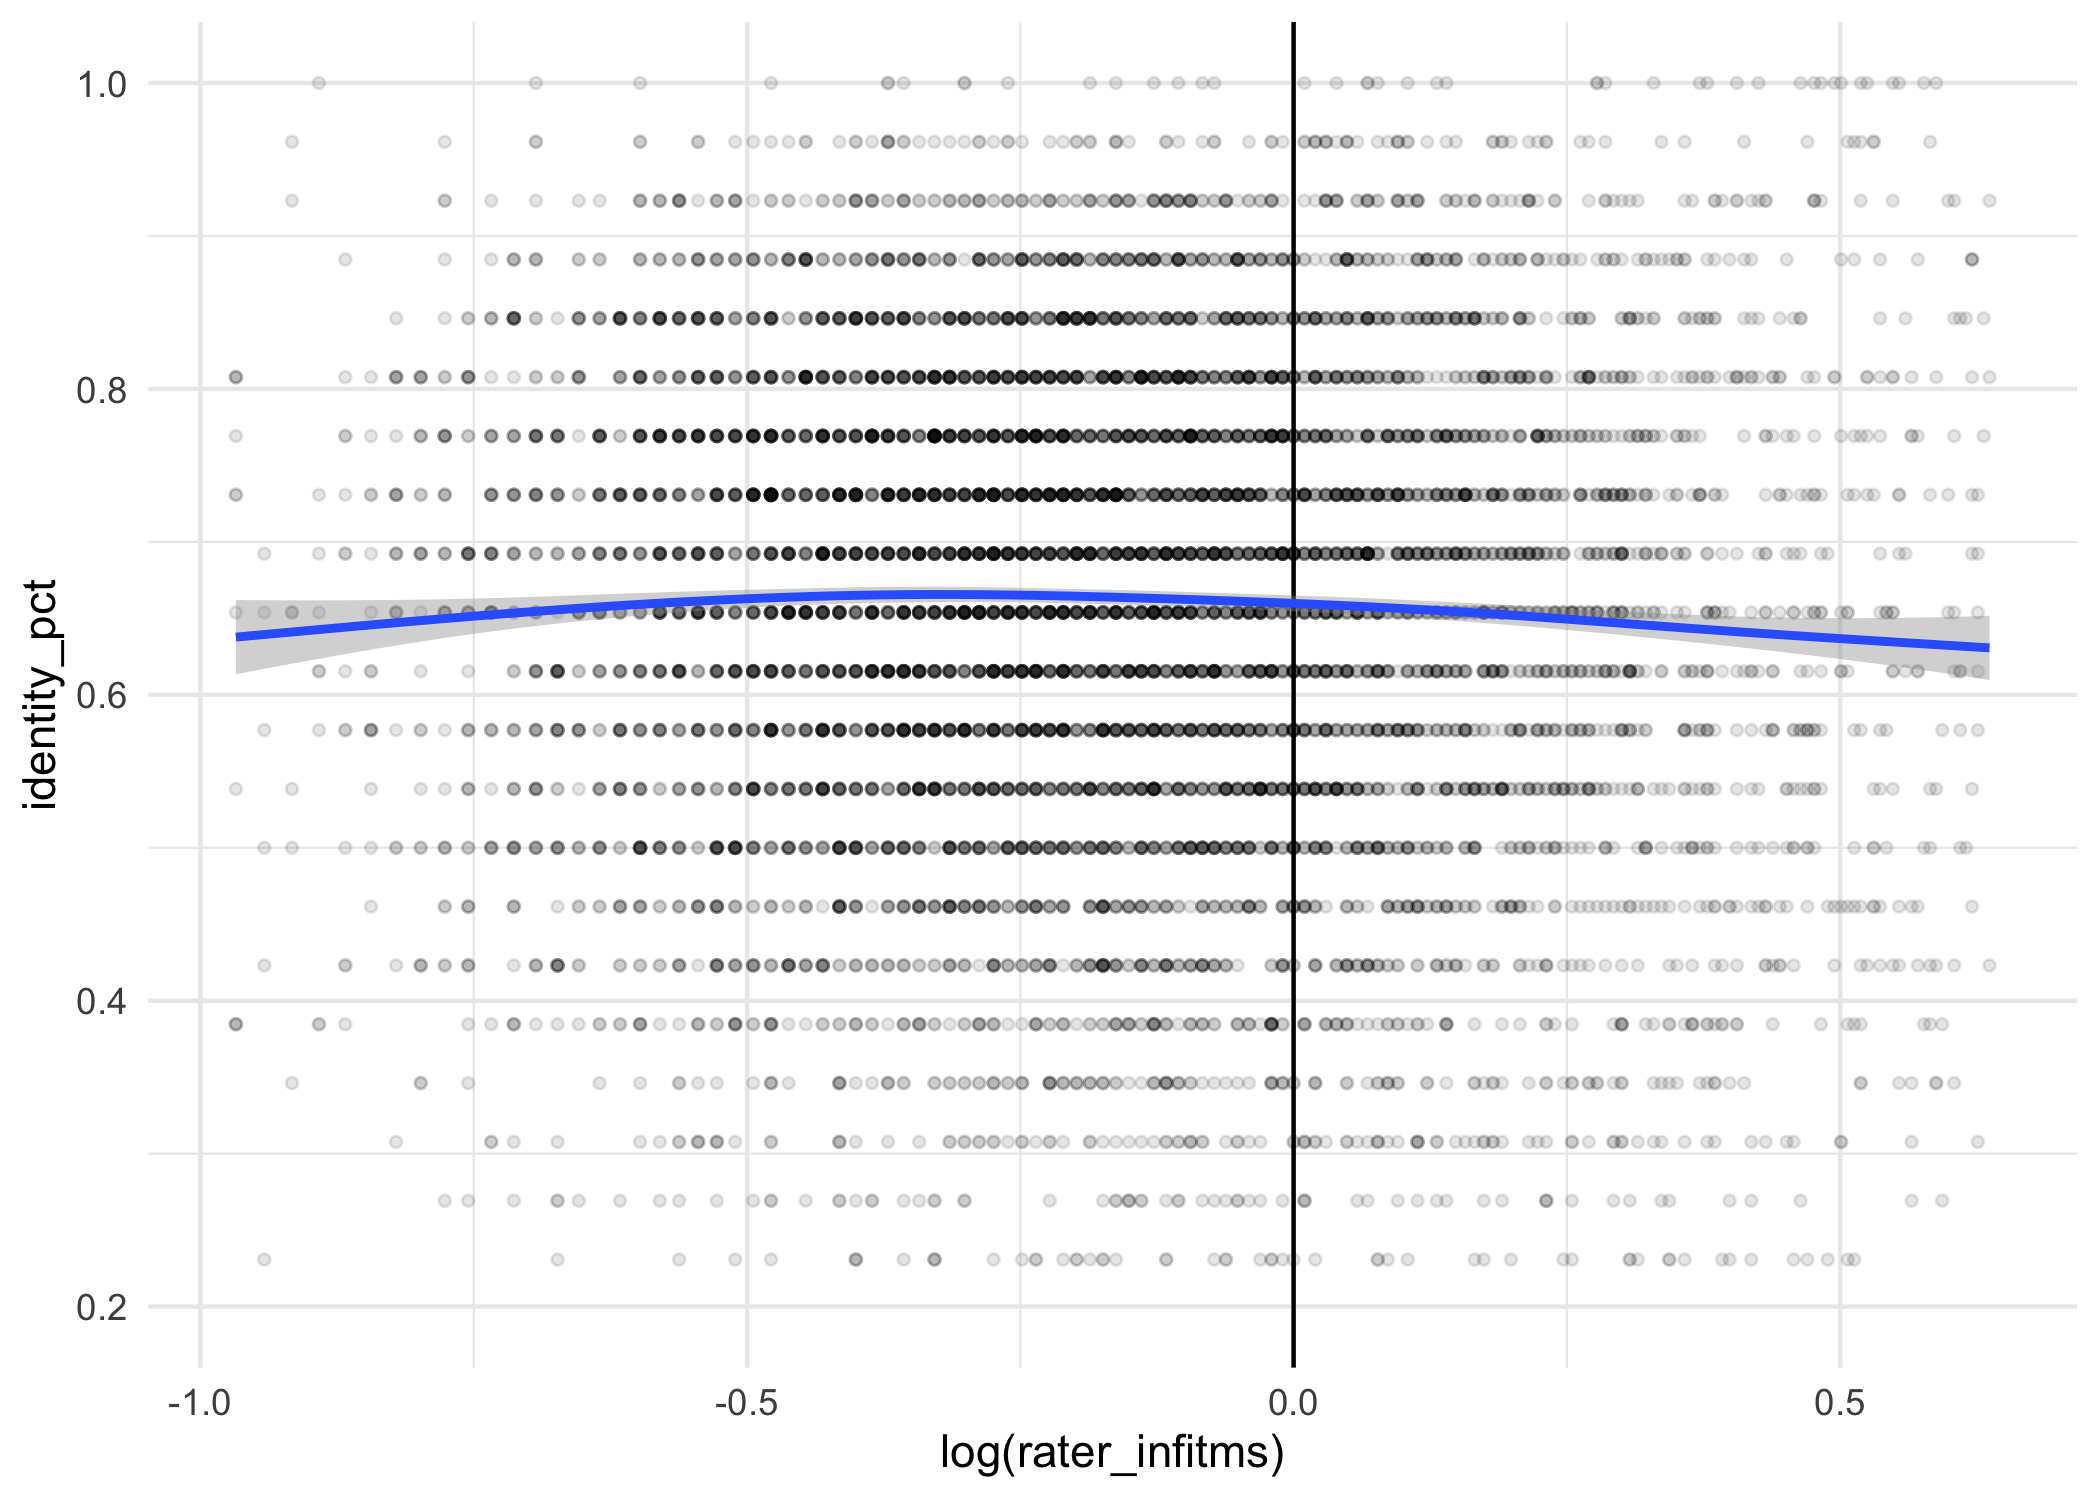
Raters were also excluded based on the number of demographic questions that were skipped, number of submissions from each unique IP, reverse geocoding of the response IP to not be located in the United States, matching of the IP to known proxies, duration to complete the survey, or an extreme value for estimated survey interpretation bias. After all exclusions we included the labels from 7,619 raters out of 11,143 total (31.6% excluded). More details on these filters will be included in future versions of this document. Following all rater exclusions we re-fit the item response model and used those estimates as our primary scaling result.
A.5 Inadequacy of a binary hate speech item
Our inclusion of a binary hate speech item in our labeling instrument allows the comparison of our interval measure to what would be possible with only a binary item response. An initial question might be: can rater agreement on the hate speech item approximate the magnitude provided by the continuous scale? Figure A2 shows that rater agreement on a single hate speech item is unfortunately a poor approximation of an interval measure. The statistical association is moderate (correlation = 60%), though highly significant (p < 0.00001), with rater agreement explaining 36% of the variance of the measure. In addition to other benefits (invariance, debiasing, explainability, interval measurement), the continuous measure contains approximately three times the information of the single-item rater agreement approximation.