Dark Energy: is it ‘just’ Einstein’s Cosmological Constant ?
Abstract
The Cosmological Constant , a concept introduced by Einstein in 1917, has been with us ever since in different variants and incarnations, including the broader concept of ‘Dark Energy’. Current observations are consistent with a value of corresponding to about present-epoch 70% of the critical density of the Universe. This is causing the speeding up (acceleration) of the expansion of the Universe over the past 6 billion years, a discovery recognised by the 2011 Nobel Prize in Physics. Coupled with the flatness of the Universe and the amount of 30% matter (5% baryonic and 25% ‘Cold Dark Matter’), this forms the so-called ‘CDM standard model’, which has survived many observational tests over about 30 years. However, there are currently indications of inconsistencies (‘tensions’ ) within CDM on different values of the Hubble Constant and the clumpiness factor. Also, time variation of Dark Energy and slight deviations from General Relativity are not ruled out yet. Several grand projects are underway to test CDM further and to estimate the cosmological parameters to sub-percent level. If CDM will remain the standard model, then the ball is back in the theoreticians’ court, to explain the physical meaning of . Is an alteration to the geometry of the Universe, or the energy of the vacuum? Or maybe it is something different, that manifests a yet unknown higher-level theory?
keywords:
Cosmology, Dark Matter, Cosmological Constant, Dark Energy, galaxy surveys1 Introduction
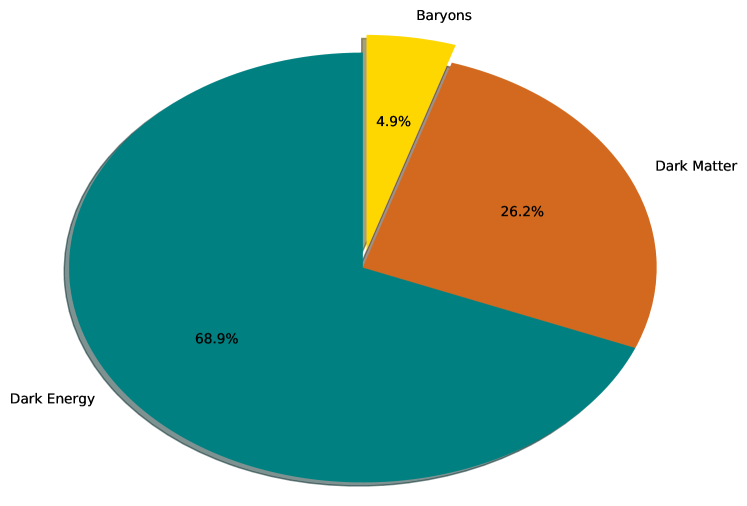
It is well established that the Universe started in a Big Bang about 13.8 billion years ago. The expansion of the Universe is a natural outcome of Einstein’s theory General Relativity, for particular the mass/energy contents of the Universe, but it is still a mystery what the Universe is actually made of. The expansion can be described by a single function of time, the cosmic scale factor, , which determines how the distances between galaxies change in time. It can also be expressed as , where is the cosmological redshift. The rate of expansion is defined as (dot indicates derivative with respect to time), where the present-epoch value is the Hubble Constant . Recent observations indicate that the universe is not only expanding - it is also accelerating at the present epoch, . But what is accelerating the Universe? The composition of the Universe, agreed by most astronomers, is a rather bizarre mixture: baryonic (ordinary) matter, Cold Dark Matter, massive neutrinos and Dark Energy. Dark Energy is a broad term, which includes the Cosmological Constant , a concept born in 1917, in Einstein’s famous article [1]. It is accepted that about 70% of the present-epoch Universe is made of ‘Dark Energy’, a mysterious substance which causes the cosmic acceleration. A further 25% of the Universe is made from invisible ‘Cold Dark Matter’ that can only be detected through its gravitational effects, with the ordinary atomic matter making up the remaining 5%, and an additional tiny contribution from massive neutrinos, with its exact value still unknown This composition is illustrated in Figure 1, based on the Planck Collaboration results [2]. This “ + Cold Dark Matter”(CDM) paradigm and its extensions pose fundamental questions about the origins of the Universe. If Dark Matter and Dark Energy truly exist, we must understand their nature. Alternatively, General Relativity and related assumptions may need radical modifications. These topics have been flagged as key problems by researchers and by advisory panels around the world, and significant funding has been allocated towards large surveys of Dark Energy. Commonly, Dark Energy is quantified by an equation of state parameter (the ratio of pressure to density, see below). The case where corresponds to Einstein’s in General Relativity, but in principle may vary with cosmic time. Essentially, affects both the geometry of the Universe and the growth rate of structures. These effects can be observed via a range of cosmological probes, including the CMB, Supernovae Type Ia, galaxy clustering, clusters of galaxies, and weak gravitational lensing. The Type Ia Supernova surveys [3, 4] revealed that our Universe is not only expanding but is also accelerating in its expansion. The 2011 Nobel Prize in Physics was awarded for this remarkable discovery. Evidence for cosmic acceleration was actually noted even earlier in the 1990s, when galaxy clustering measurements [5] indicated a low matter density parameter. This suggested the possibility of a Cosmological Constant when combined with the assumption that space is ‘flat’ (e.g. two light beams would travel in parallel lines). Flatness (zero curvature) is predicted by Inflation, a theory of exponential expansion in the early Universe, in a tiny fraction of a second just after the Big Bang. The flatness of the universe was later confirmed by CMB anisotropy measurements.
We start this review by providing some background and history on in General Relativity and on the concept of Dark Energy and a Newtonian version for the term (Section 2). Then we summarise the modern probes of Dark Energy (Section 3) and the landscape of galaxy surveys (Section 4), before presenting results from the Dark Energy Survey (Section 5) and discussing tension in the Hubble Constant (Section 6). We close by considering the outlook for Dark Energy research (Section 7).
2 Background: a brief history of Dark Energy
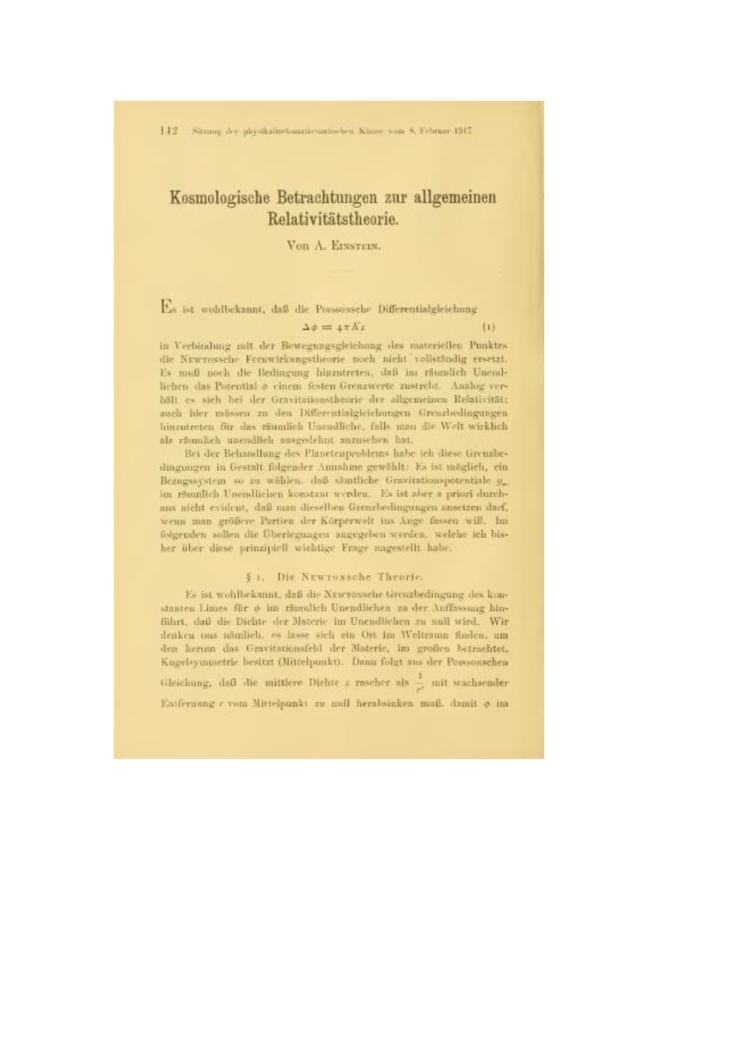
Over a century ago Einstein added the Cosmological Constant to his equations [1] (see Figure 2). It is a complicated equation, but we can think of it in a symbolic way as:
| (1) |
where represents the gravity in space-time, and (called the ‘energy-momentum tensor’) describes the contents of the Universe. One way to interpret this equation is in the words of John Archibald Wheeler: ‘Matter tells spacetime how to curve; curved spacetime tells matter how to move.’ Einstein added primarily as a way of generating a static universe, which neither expands nor contracts. With Edwin Hubble’s observations of the expansion of the universe a few years later it seemed to Einstein that the term was not needed anymore, and he blamed himself that inventing was the ‘blunder of his life’111For a historical review of Einstein’s 1917 paper see [6]. . One may argue that Einstein ‘missed opportunities’ in a number of ways: to predict the expansion/contraction of the Universe without , to notice that his static solution is unstable, so a Universe with would also expand/contract, and to view as a free parameter, which could also lead for example to an accelerating Universe. But this 1917 study was probably the first paper on relativistic cosmology, and the first time the cosmological constant was proposed. Dark Energy, an extension of the , is now the focus of projects worth billions of dollars, with hundreds of scientists spending significant parts of their careers on this problem.
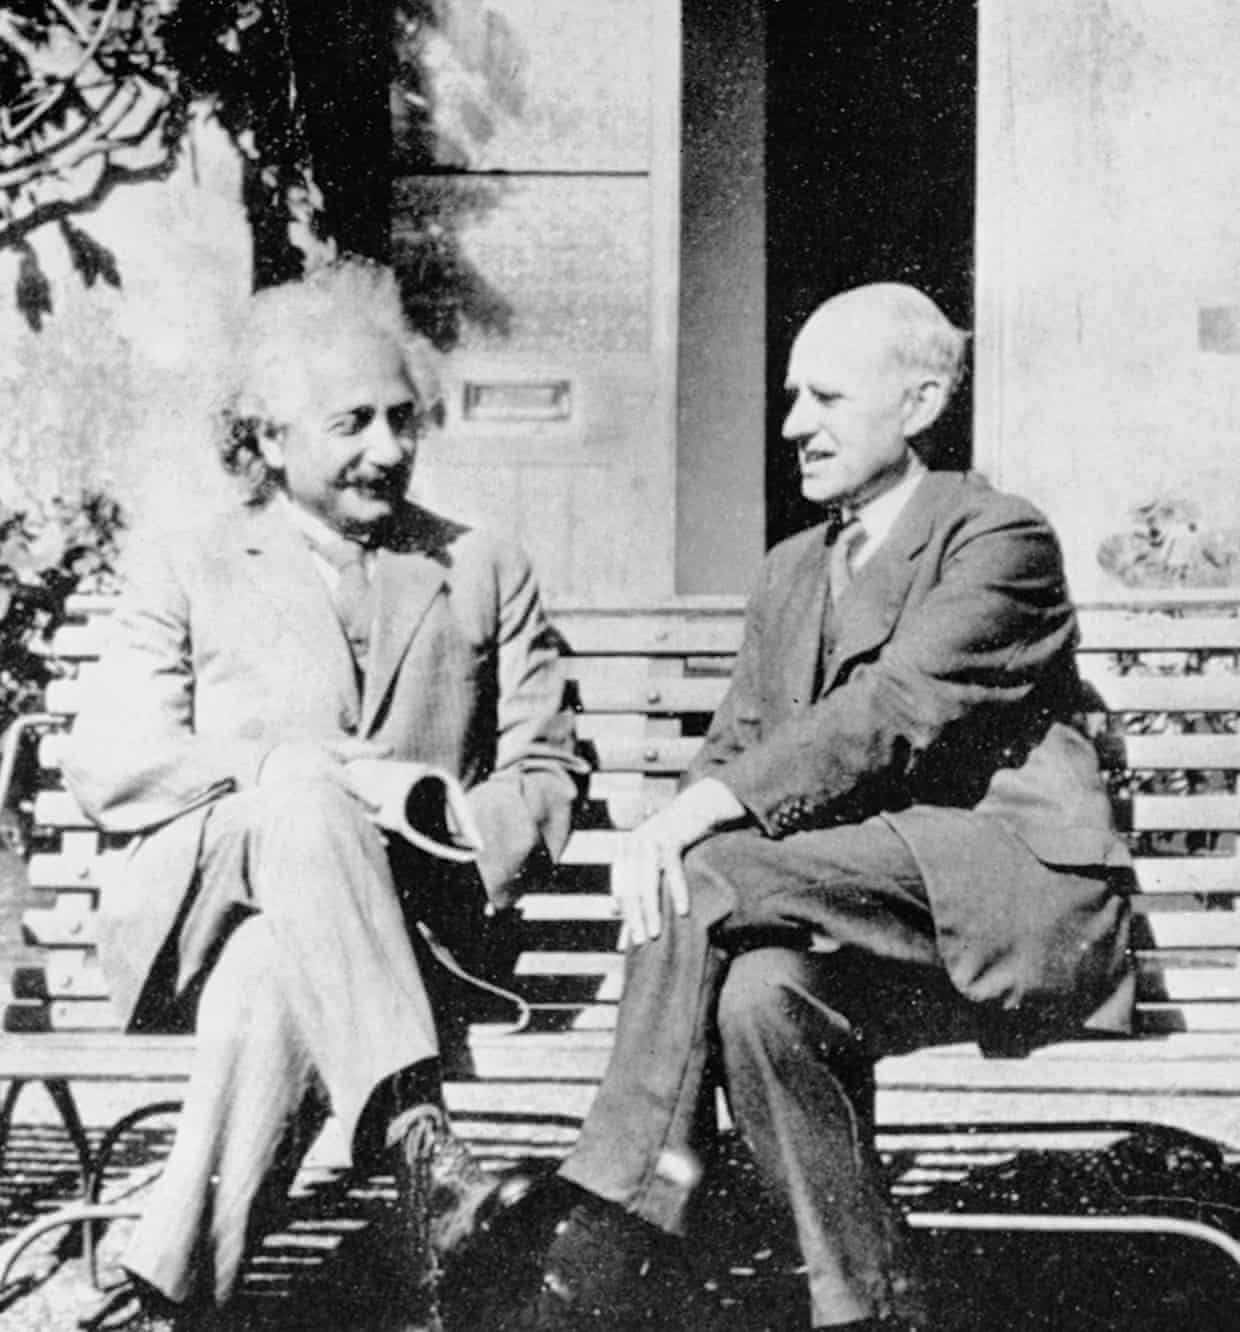
While Einstein abandoned , his friend Arthur Stanley Eddington (Plumian Professor at Cambridge; see Figure 3 ) was actually very keen on the Cosmological Constant, considering it as the possible source of expansion. In his popular book ‘The Expanding Universe’ [7] he stated: “I am a detective in search of a criminal - the Cosmological Constant. I know he exists, but I do not know his appearance, for instance I do not know if he is a little man or a tall man….”.
The big conceptual question is if should be on the left hand side of equation (1), as part of the curvature (as originally introduced by Einstein), or on the right hand side, as part of the energy-momentum tensor , for example associated with the vacuum energy222It seems non-intuitive that the vacuum contains energy. But recall in Quantum Mechanics even the ground state of a simple harmonic oscillator has energy, . Summing up the contributions from many harmonics oscillators (up to a certain energy cutoff) gives rise to vacuum energy. Vacuum energy can also be viewed in terms of ‘virtual particles’ (also known as ‘vacuum fluctuations’), which are created and destroyed out of the vacuum. Vacuum energy has been verified experimentally in the lab by the Casimir effect. . In fact, oddly, Quantum field theory predicts for the amount of vacuum energy times the observed value; that is a challenging ‘Cosmological Constant problem’ by itself (see [8]). If Dark Energy is the energy of the vacuum, then (unlike matter and radiation) its energy density doesn’t dilute as the Universe expands. More generally this time evolution is determined by the equation of state parameter of Dark Energy, defined as the ratio of its pressure to its energy density ,
| (2) |
The Dark Energy density varies with the scale factor as
| (3) |
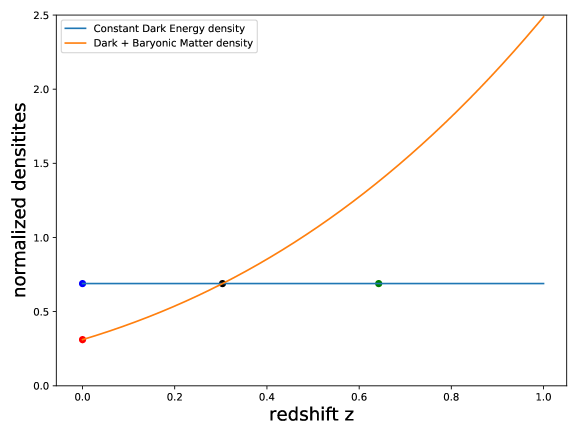
For vacuum energy, the equation of state parameter is and the density does not change with time, essentially the case (see Figure 4). The density of matter (the sum of ordinary matter and Cold Dark Matter) varies like , so the matter and densities were equal at
| (4) |
where the density parameter for is normalised by the Hubble Constant , , and the matter density is scaled by the critical density333The critical density is defined as . For Hubble constant it is kg m-3. This is a very low density, just over five protons per cubic metre of space. . The acceleration actually started earlier, at
| (5) |
We note that , regardless of the values of and .
In the Newtonian limit of General Relativity the equation of motion looks familiar:
| (6) |
In addition to the famous inverse square law, the second term is a linear force, that surprisingly was already discussed by Newton in Principia (see e.g. [9] for review). An intuitive Newtonian way to think about the term is as a repulsive linear force, opposing the inverse squared gravitational force. It is interesting that such a force can be noticeable on the Mpc scale444Mpc stands for Megaparsec, which is a distance of million parsecs, equivalent to about 3.26 million light years, or kilometers.. For example, the -force affects the acceleration of the Milky Way and Andromeda towards each other (see e.g. [10, 11, 12]). For further discussion on Dark Energy and Cosmological Parameters see reviews in [13, 14, 15, 16].
3 Primary probes of Dark Energy
Observational Cosmology provides tests of Einstein’s General Relativity and alternative theories. The subject has developed in recent decades from ‘metaphysics’ to a highly quantitative discipline, as recognised by the award of the Nobel Prize in Physics 2019 to Jim Peebles. Among the well-established cosmological probes are: Type Ia Supernovae, large-scale galaxy clustering, galaxy clusters, and weak gravitational lensing. Since the methods are sensitive to cosmological parameters in different ways, we can use them in combination to maximize our knowledge, and to control systematic errors.
3.1 Supernovae Type Ia as standard candles
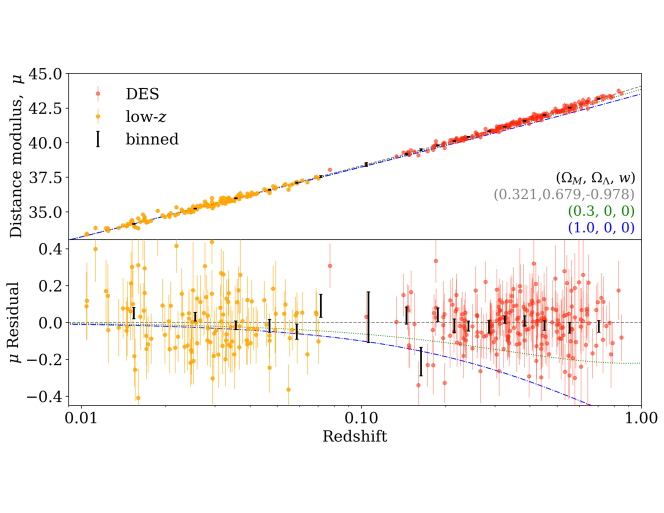
Exploding stars called Supernovae Type Ia are understood to originate in binary systems in which at least one of the two companion stars is a white dwarf. A Supernova becomes as bright as an entire galaxy of tens of billions of stars and then begins to fade away within a matter of weeks. Supernovae Type Ia are observed to all have nearly the same absolute luminosity when they reach their peak light (after some calibration corrections), hence the concept of ‘standard candles’. By comparing the apparent brightnesses of different Supernovae we can determine their relative distances. We can also measure the redshift to the Supernova (or its host galaxy), and look at the relation of distance and redshift (the so-called Hubble diagram). This relation depends on the geometry of the Universe, and hence on the amounts of Dark Matter and Dark Energy. This method led to the discovery that the Universe is accelerating at present [4, 3], which was recognised by the award of the Nobel Prize in Physics 2011. See Figure 5 for recent results.
3.2 Baryonic acoustic oscillations as standard rulers
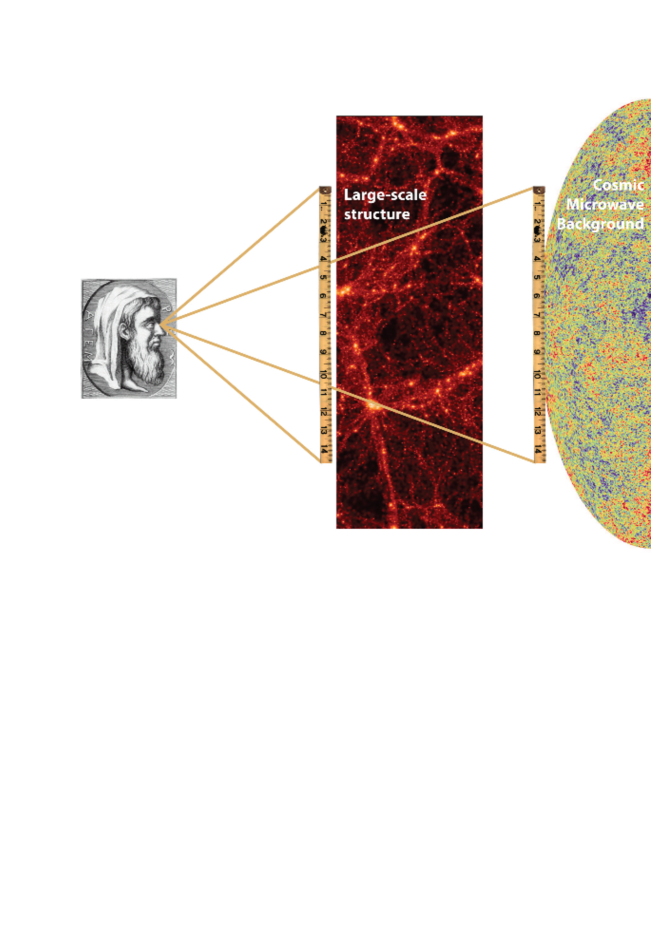
Another major cosmological probe is the spatial clustering of galaxies (deviation from a random uniform spatial distribution). What is useful as a standard ruler is a feature called baryon acoustic oscillations (BAO), first discovered by the 2dF and SDSS teams [18, 19]. Until approximately 370,000 years after the Big Bang, the Universe was a sea of colliding protons, electrons, and photons, forming an opaque, ionized plasma. Gravity pulled the protons and electrons together, while the pressure of the energetic photons acted to push them apart. This competition between gravity and pressure created a series of sound waves, ‘acoustic oscillations’, in the plasma. As the Universe expanded and cooled, the photons lost energy and became less effective at ionizing atoms, until gradually all the protons and electrons combined to form neutral hydrogen. Thereafter, the Universe became transparent to photons, which travelled without further interacting with matter. The distance travelled by the sound waves up to that point became imprinted in the spatial distribution of matter, which means that today there is a slight tendency for pairs of galaxies to be separated by about 480 million light years. Comparing this scale to how much galaxies appear to be separated on the sky, i.e., their angular separation, allows us to work out how far away they are. Comparing this distance to the redshift of their light, just as we do for Supernovae, tells us about the expansion history of the Universe. The same acoustic features (BAO) are seen in the CMB. See an illustration in Figure 6. There is additional useful information in galaxy clustering, in particular in ‘redshift distortion’ (the deviation of galaxy motions from the smooth Hubble flow) and in the entire statistical fluctuations at different physical scales. There are other important probes of the mass distribution, in particular ‘Lyman- clouds’ (inferred from spectra of Quasars) and peculiar velocities (deviations from the smooth Hubble flow).
3.3 Cluster abundance
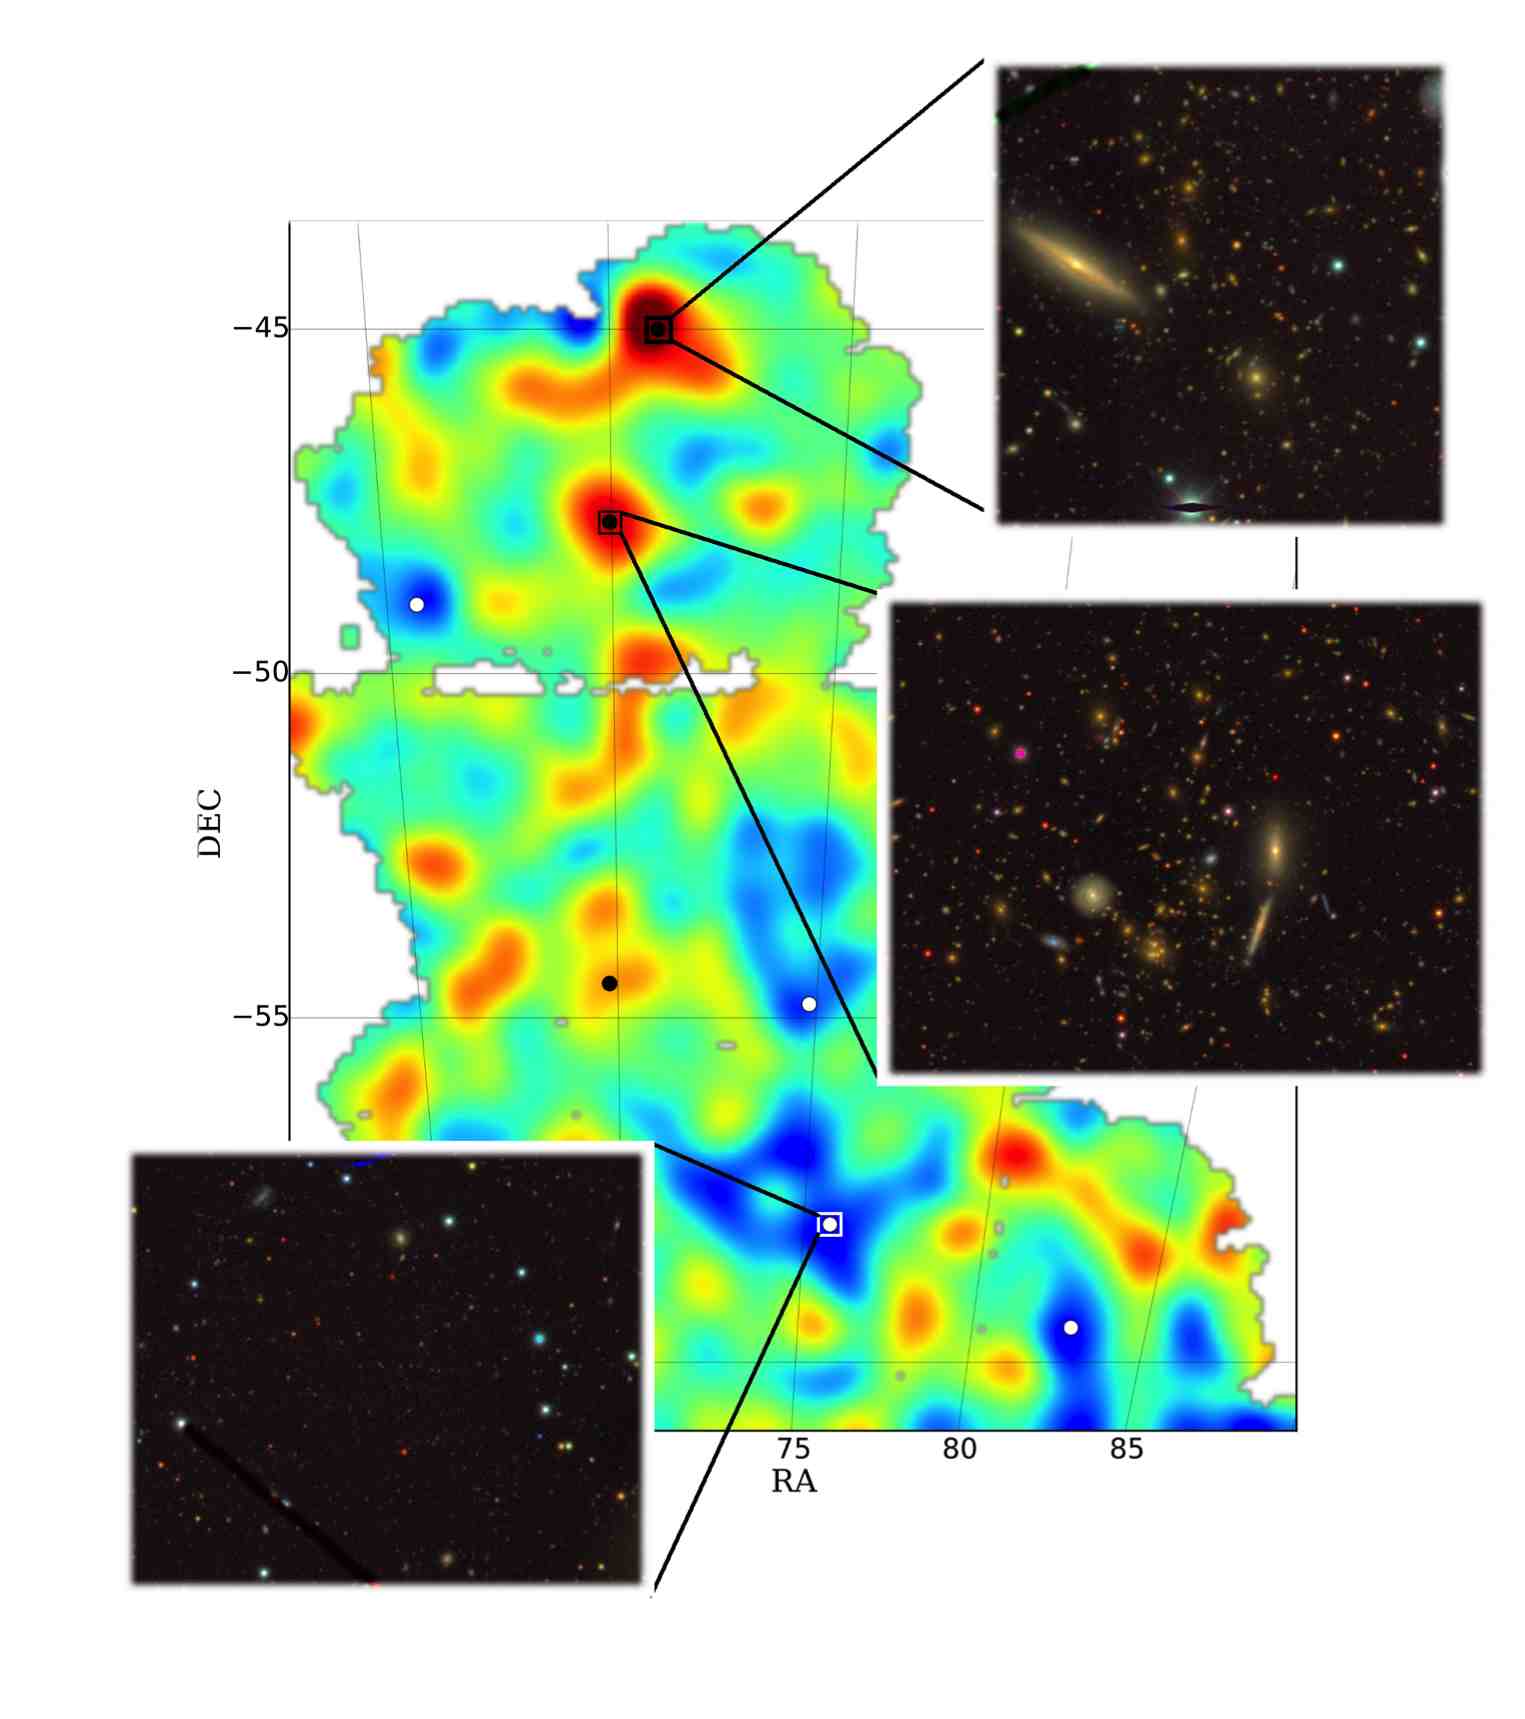
Galaxy clusters, first catalogued by George Abell and others, are peaks in the ‘cosmic web’ of the galaxy distribution. Examples of galaxy clusters are shown in two insets in Figure 8. As the geometry and growth of structure depend on Dark Energy, counting the number of galaxy clusters of a given mass within a given volume of the Universe provides another cosmological test. The main challenge when interpreting cluster counts is that the mass of a cluster (which is mostly Dark Matter) is not directly observable, so we have to calibrate mass-observable relations using techniques such as the Sunyaev-Zel’dovich effect, X-ray emission, and calibration by weak gravitational lensing. Powerful computer simulations play a key role in understanding the formation of structure and in assessing the accuracy of these cluster mass estimates.
3.4 Weak gravitational lensing
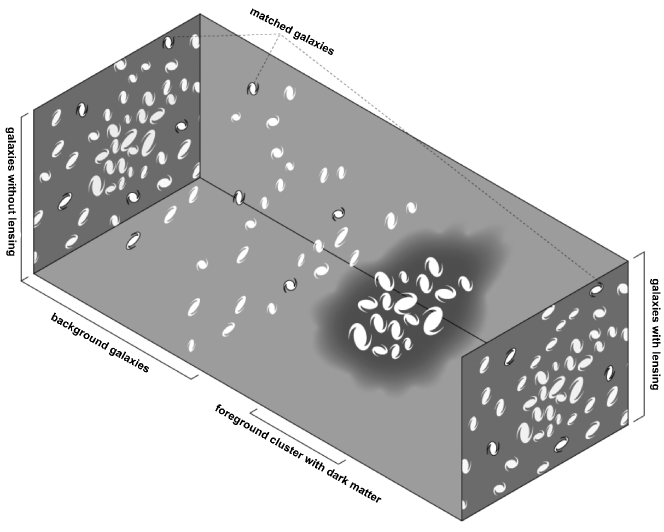
Gravitational lensing was predicted by Einstein’s General Theory of Relativity. The effect is that light rays are bent when they pass through a gravitational field. This was first proved by the solar eclipse experiment in 1919 by Eddington and Dyson. Bending of light from a distant galaxy by a massive cluster along the line-of-sight generates ‘strong lensing’, with the distorted images in the form of apparent ‘arcs’. Milder intervening mass fluctuations produce ‘weak lensing’ (see an illustration in Figure 7). Weak gravitational lensing is sensitive to both the expansion history and the growth history of density fluctuations, and therefore is sensitive to the amounts of Dark Matter and Dark Energy. The apparent distortions of distant galaxies in a small patch of sky will be correlated, since their light has travelled through nearly the same intervening field of Dark Matter; we can use this correlation to statistically tease out the small lensing distortion. This effect, known as cosmic shear, is a tiny distortion of about one percent on average, and it requires very precise, accurately calibrated measurements of many galaxy shapes for its inference. The distorted images can be used to infer a projected mass map (see Figure 8). The growth of clumpiness with cosmic time tells us about the amount of Dark Energy.
3.5 The speed of Gravitational Waves
A somewhat unexpected probe of Dark Energy has emerged from the discovery of Gravitational Waves. The first event, GW150914, a Binary Black Hole merger, was detected by LIGO [21] on 14 September 2015, and subsequently was recognised by the award of the Nobel Prize in Physics 2017. The later he LIGO & Virgo detection [22] of Binary Neutron Star (BNS) merger GW170817 and electromagnetic followups turned out to be relevant for constraining cosmological models. Several ground and space telescopes (including the Dark Energy camera [23] in Chile) captured an optical flash from this Gravitational Wave event. In particular, the Fermi Gamma-ray space telescope detected a flash from the BNS system only 1.7 seconds after the Gravitational Wave measurement. Given the distance of about 130 Million Light years to the host galaxy NGC4993, this implies that the speed of Gravitational Waves is equal to the speed of light to within one part in . This has ruled out certain models of gravity, which have predicted, at least in their simplest form, differences between the speed of gravity and light.
4 The landscape of galaxy surveys
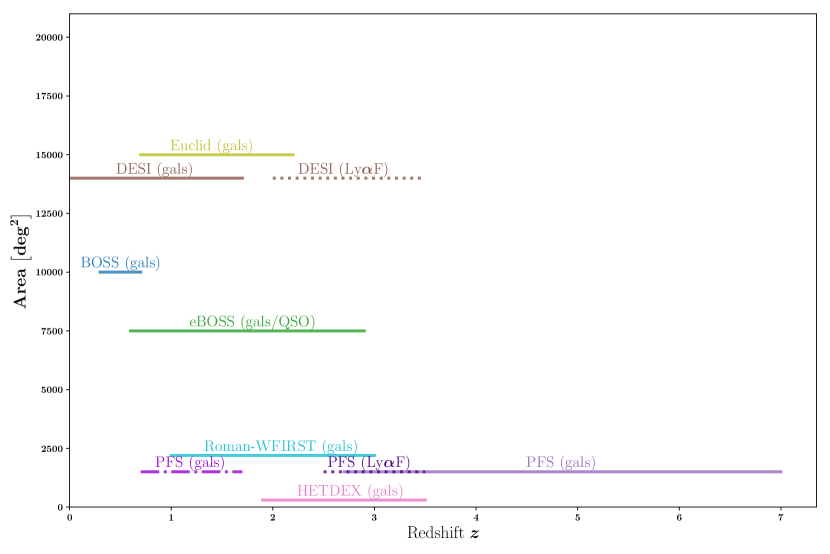
The 1998-1999 results of the accelerating Universe from the Supernovae Type Ia observations have stimulated many galaxy surveys designed to verify and characterise Dark Energy. Back in 2006, the U.S. Dark Energy Task Force (DETF) report classified Dark Energy surveys into numbered stages: Stage II projects were on-going at that time; Stage III were near-future, intermediate-scale projects; and Stage IV were larger-scale projects in the longer-term future. These projects can be further divided into ground-based and space-based surveys. Space-based missions have the advantage of not having to observe through the Earth’s atmosphere, which blurs the light and absorbs infrared light. Further, surveying in Astronomy is divided into spectroscopic and imaging. Spectroscopic surveys produce accurate redshifts of galaxies, but are demanding in terms of observing time. Multi-band photometric surveys can measure far more galaxies, but the deduced ‘photometric redshifts’ are less accurate than spectroscopic redshifts. Among the spectroscopic surveys we note: the current SDSS Baryon Oscillation Spectroscopic Survey (BOSS)555http://www.sdss3.org/surveys/boss.php, eBOSS (‘extended BOSS’)666https://www.sdss.org/surveys/eboss/, the Dark Energy Spectroscopic Instrument (DESI)777http://desi.lbl.gov/ and under construction the Subaru Prime Focus Spectrograph (PFS)888http://pfs.ipmu.jp/factsheet/, 4MOST999http://www.4most.eu/, HETDEX101010https://hetdex.org/hetdex.html, Euclid111111http://www.euclid-ec.org/ and the Nancy Roman Wide-Field Infrared Survey Telescope (WFIRST)121212http://www.stsci.edu/wfirst. The sky area vs. redshift range are shown for some of these surveys in Figure 9.
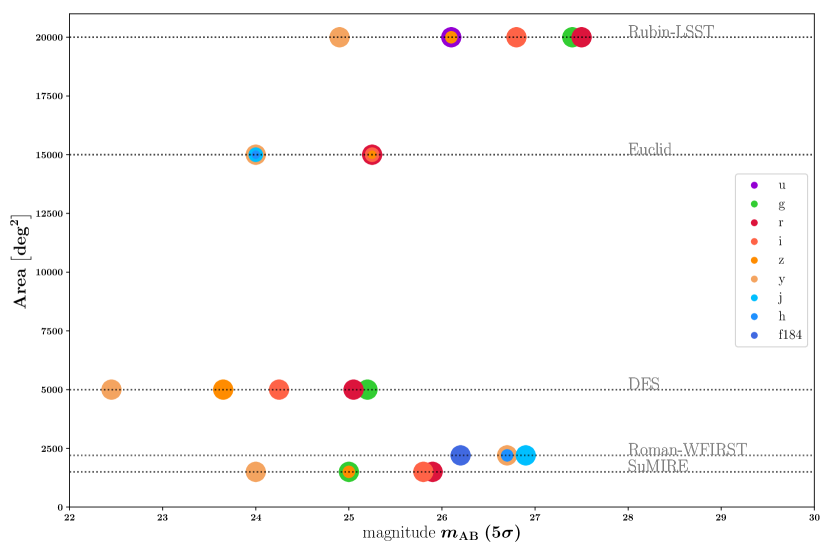
Current imaging surveys include the Dark Energy Survey (DES)131313http://www.darkenergysurvey.org/, the Hyper Suprime Cam (HSC)141414http://www.naoj.org/Projects/HSC/, the Kilo-Degree Survey (KiDS)151515http://kids.strw.leidenuniv.nl/, PAU161616https://www.pausurvey.org, and under construction the Vera Rubin Observatory of Legacy Survey of Space and Time (LSST)171717http://www.lsst.org/, and the above-mentioned Euclid and Roman-WFIRST. Figure 10 shows the sky area vs. magnitudes (per filter) for some of these imaging surveys.
5 The Dark Energy Survey
As discussed in the previous Section, many ongoing and planned imaging and spectroscopic surveys aim at measuring Dark Energy and other cosmological parameters. As a showcase we focus here on DES181818I have chosen DES as a showcase as its observations are already complete. Also, I happen to have an ’insider’s view’, as I have been involved in the project since its early days back in 2004, in particular as co-chair of its Science Committee until 2016, and later as chair of its Advisory Board.. For an overview of DES see the article ‘DES: more than Dark Energy’ [24] and the DES book [25], which tells the story of this experiment, from construction to science.
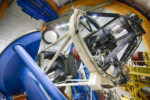
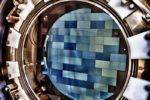
In short, DES is an imaging survey of 5000 square degrees of the Southern sky, utilising a 570 mega-pixel camera (called DECam) on the 4m Blanco telescope in Chile (see Figure 11). Photometric redshifts (approximate distances) to the galaxies were obtained from the multi-band photometry to produce a three dimensional map of 300 million galaxies. The main goal of DES is to determine the Dark Energy equation of state and other key cosmological parameters to high precision. DES has measured using four complementary techniques (described in Section 3) in a single survey: galaxy clustering, counts of galaxy clusters, weak gravitational lensing and thousands of Type Ia Supernovae in a ‘time domain’ survey over 27 square degrees. DES is an international collaboration, with more than 400 scientists from 26 institutions in the US, the UK, Spain, Brazil, Germany, Switzerland and Australia involved. The survey had its first light in September 2012 and started observations in August 2013. Observations were completed in 2019, over 758 nights spread over 6 years.
DES imaged about an eighth of the sky to a depth of approximately 24th magnitude (about 15.8 million times fainter than the dimmest star that can be seen with the naked eye). The quality of the data is excellent – the typical blurring of the images due to the camera, the telescope optics, and the atmosphere is about 0.9 arcseconds. On a typical observing night, the camera took about 200 images; since each DECam digital image is a gigabyte in size, DES typically collected about 200 gigabytes of data on clear nights, ‘big data’ for an astronomy experiment. In addition to serving the scientific interests of the collaboration, the DES data processed by DESDM are being made publicly available on a regular basis and can be downloaded from the internet by anyone in the world. DES scientists are working closely with data sets and scientists from other surveys and observatories. Comparing DES data with complementary data from other surveys allows us to obtain new information and make new discoveries.
5.1 DES joint galaxy clustering and weak lensing: Year One cosmology results
The first major DES cosmology results were announced in August 2017, and published the following year ([26]). This analysis combined galaxy clustering and weak gravitational lensing data from the first year of DES survey data that covered about 1300 square degrees, utilising measurements of three two-point correlation functions (hence referred to as ‘3 times 2pt’): (i) the cosmic shear correlation function of 26 million source galaxy shapes in four redshift bins, (ii) the galaxy angular auto-correlation function of 650,000 luminous red galaxy positions in five redshift bins, and (iii) the galaxy-shear cross-correlation of luminous red galaxy positions and source galaxy shears. The headline results strongly support the CDM cosmological model. Combining the DES Year 1 data with Planck CMB measurements, baryonic acoustic oscillation measurements from the SDSS, 6dF, and BOSS galaxy redshift surveys, and Type Ia Supernova distances from the Joint Light-curve Analysis, this analysis finds the Dark Energy equation of state parameter to be (68% CL) , in spectacular agreement with the cosmological constant model, for which .
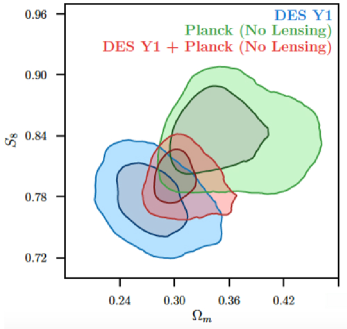
Contrasting the DES and Planck measurements yields an important comparison of the early and late Universe. Planck measures conditions at the epoch of “last (photon) scattering” 370,000 years after the Big Bang. Assuming CDM, the Planck measurement predicts the amount of large-scale clumpiness in the mass distribution today. The DES measurement of that clumpiness is in reasonably good agreement with that prediction, as shown by the overlap of the blue and green contours in Figure 12 (a). This is subject to possible parameter ‘tension’ due to either systematics or the need for new Physics. Both possibilities are currently under further investigation. When the DES and Planck results are combined to obtain tighter constraints, shown by the red contours, it gives for the ratio of the matter density to critical density and for the clumpiness factor ( is the rms fluctuation in spheres of radius of Mpc). The future analysis of the full DES data (Years 1-3 and then Years 1-6), which covers a larger area of sky and goes deeper than the Year 1 data, will provide stronger constraints on these parameters as well as on the time variation of the equation of state parameter of Dark Energy, modified gravity and neutrino mass.
5.2 DES Supernova Year 3 cosmology results
The first DES Supernova Ia (SNe Ia) cosmology results were announced in January 2018 and published a year later [28]. The analysis used a sample of 207 spectroscopically confirmed SNe Ia from the first three years of DES-SN, combined with a low-redshift sample of 122 SNe from the literature, thus 329 SNe Ia in total (see Figure 5). The CDM model, combining DES-SN with Planck, yields a matter density ; for the CDM model (with constant ), the analysis finds , and . These results strongly support the CDM paradigm, and they agree with previous constraints using SNe Ia. Future DES SNe Ia analyses will use a much larger sample of several thousand photometrically classified Supernovae from the full survey.
6 Tension in clumpiness and in the Hubble constant: systematics or new physics?
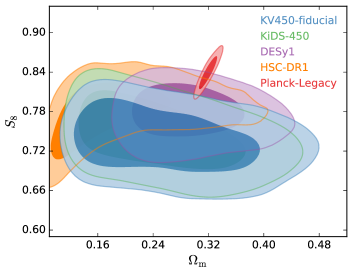
The CDM model has survived detailed observational tests over 30 years. However, it is still undergoing ‘health checks’ from time to time. CDM is the winning model, as demonstrated e.g. in Planck [2], DES [26] and recently by the CMB Atacama Cosmology Telescope (ACT) [29] and eBOSS [30] results. But we have already indicated in the previous chapter some inconsistency in the clumpiness parameter : the one derived from weak lensing is about 3- smaller than the value deduced from Planck (see e.g. the recent KiDS results [31]).
An even larger tension, of about 4.4-, exists between the Hubble Constant measurements from the cosmic ladder in the nearby universe and from the CMB experiments that probe the early universe. Edwin Hubble discovered the law of expansion of the Universe by measuring distances to nearby galaxies. The Hubble Constant is derived from the ratio of the recession velocity and the distance :
| (7) |
Note has units of inverse time, although the units are written as to reflect the way it is being measured. Astronomers have argued for decades about the systematic uncertainties in various methods and derived values over the wide range .
One of the most reliable results on the Hubble constant came from the Hubble Space Telescope (HST) Key Project [32]. This study used the empirical period–luminosity relation for Cepheid variable stars, and calibrated a number of secondary distance indicators, SNe Ia, the Tully–Fisher relation, surface-brightness fluctuations, and Type II Supernovae. This approach was further extended, based on HST observations of 70 long-period Cepheids in the Large Magellanic Cloud combined with Milky Way parallaxes and masers in NGC4258, to yield [33] (SH0ES).
By contrast, the Planck CMB experiment [34] gives a lower value, . The tension of 4.4- between from Planck and the traditional cosmic distance ladder methods is of great interest and under investigation. A low value, , has also been measured by ACT[29], another CMB experiment.
Other methods have been used recently, for example by calibrating of the tip of the red-giant branch applied to SNe Ia, finding [35]. The method of time delay in gravitationally-lensed quasars [36] (H0LiCOW) gives the result , but see a revision [37] to .
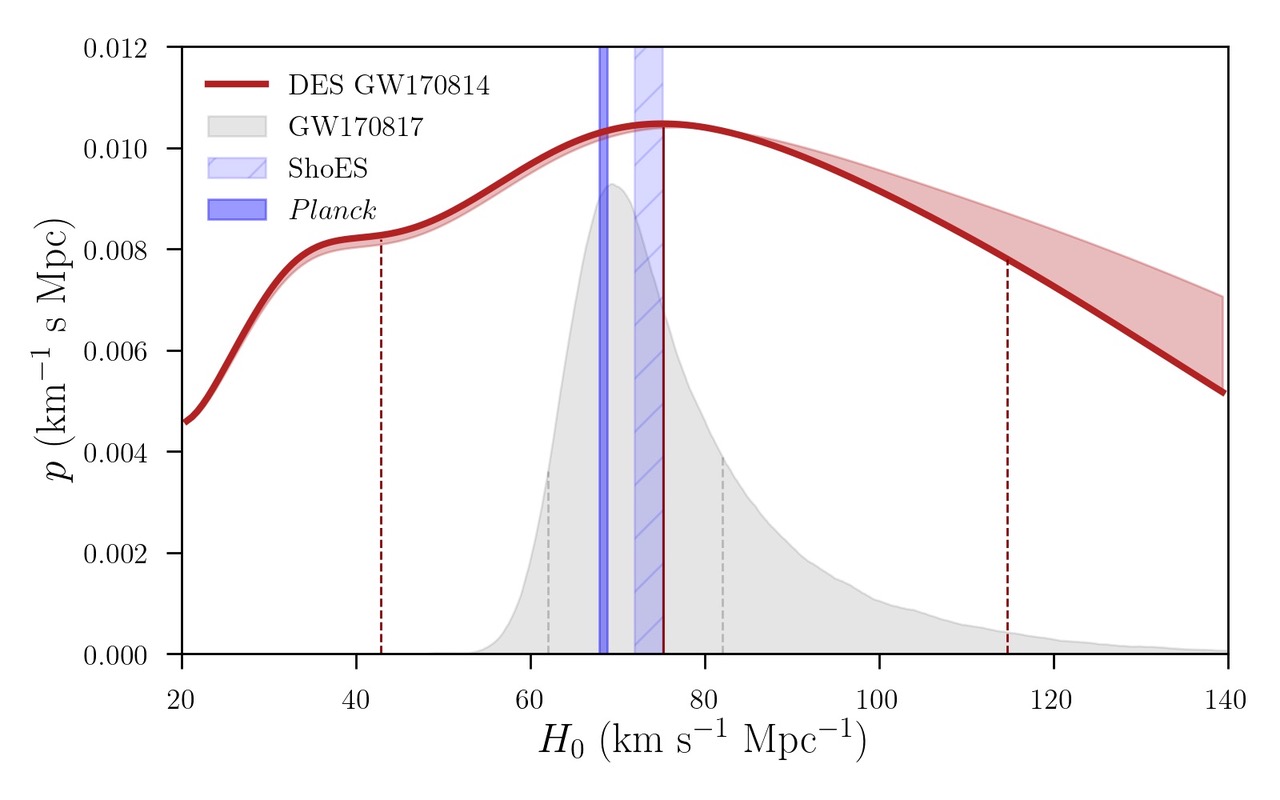
Another method that recently came to fruition is based on Gravitational Waves; the ‘Bright Siren’ applied to the binary neutron star merger GW170817 and the ‘Dark Siren’ implemented on the binary black hole merger GW170814 yield [38] and [39] respectively. With many more gravitational wave events, the future uncertainties on from standard sirens will get smaller. Figure 13 summarizes four of the methods discussed above.
For further discussion of the Hubble Constant measurements see [40] and [41]. There is possibly a trend for higher at the nearby Universe and a lower at the early Universe, which leads some researchers to propose a time-variation of the Dark Energy component or other exotic scenarios. Ongoing studies are addressing the question of whether the Hubble tension is due to systematics in at least one of the probes, or is a signature of new Physics. On the whole, although there are inconsistencies in the Hubble Constant and clumpiness factor, they are not at the level of shaking up the CDM paradigm.
7 Discussion and Outlook
The accelerated expansion of the Universe and the CDM model have been overwhelmingly supported by a host of cosmological measurements. But we still have no clue as to what is causing the acceleration, and what Dark Matter and Dark Energy are. Even if Dark Energy is ‘just’ the enigmatic Cosmological Constant , we desperately need to understand it.
It may well be that the CDM model is indeed the best description of our Universe, with Dark Matter and Dark Energy ingredients that will eventually detected independently, e.g. in the lab. But there is also a chance that the Dark sector is the ‘modern Ether’ and future generations will adopt an entirely different description of the Universe. It is also possible that the community has converged on a single preferred model due to ‘over communication’ [42]. Should a discrepancy between data and the existing cosmological theory be resolved by adding new entities such as Dark Matter and Dark Energy, or by modifying the underlying theory? This reminds us of two cases in the history of studies of our own Solar System. Anomalies in the orbit of Uranus were explained by hypothesizing a previously unseen (i.e. ‘dark’) planet, Neptune, within Newtonian gravity, which was subsequently discovered. On the other hand, anomalies in the perihelion of Mercury were successfully explained by invoking a new theory of gravitation beyond Newton, Einstein’s General Relativity, instead of by the ‘dark’ planet Vulcan (e.g. a discussion in [43] and references therein). Unfortunately, history does not provide a definitive guide to choosing between dark stuff or a new theory of gravity in explaining cosmological observations.
Various speculations have been proposed about the origins of : e.g. that we happen to reside in an unusual patch of the universe (e.g., in a large void), mimicking the appearance of ; that the Cosmological Constant is something different to vacuum energy, as the value predicted by fundamental theory is as much as times larger than observations permit; that perhaps the observed is a superposition of different contributions; that perhaps modifications to General Relativity are required; that a higher-level theory, connecting General Relativity to Quantum Mechanics and Thermodynamics, is still to be discovered; or that we should possibly consider in the context of a Multiverse: anthropic reasoning suggests a large number of universes (‘multiverse’) in which and other cosmological parameters take on all possible values. We happen to live in one of the universes that is ‘habitable’.
It is likely that ultimately the full explanation of Dark Energy of the Universe may require a revolution in our understanding of fundamental Physics. It might even require thinking beyond the boundaries of Physics. Michael Collins, one of the Astronauts of the Apollo 11 mission to the Moon allegedly said “I think a future flight should include a poet, a priest and a philosopher. We might get a much better idea of what we saw.” Likewise, we might need an entirely new perspective on the mystery of Dark Energy.
Acknowledgements
I express thanks to my DES and UCL collaborators for many inspiring discussions on this topic over the years. In particular I thank Richard Ellis for initiating this article, and to Lucy Calder, Josh Frieman, Andrew Liddle, Michela Massimi, Julian Mayers and David Weinberg with whom I have interacted on related review articles, including some chapters in the DES book [25]. Rebecca Martin, Krishna Naidoo and Lorne Whiteway have kindly commented on earlier versions of this article. I acknowledge support from a European Research Council Advanced Grant TESTDE (FP7/291329) and STFC Consolidated Grants ST/M001334/1 and ST/R000476/1.
References
- [1] Einstein, A., Sitz. Knig. Preuss. Akad. 142, 152 (1917); English translation: http://einsteinpapers.press.princeton.edu/vol6-trans/433?ajax
- [2] Planck Collaboration 2018 Results I, arXiv:1807.06205 (2018)
- [3] Riess, A. et al., ApJ, 116, 1009 (1998)
- [4] Perlmutter, S., ApJ, 517, 565 (1999)
- [5] Efstathiou, G.P., Sutherland, W.J., & Maddox, S., Nature, 748, 705 (1990)
- [6] O’Raifeartaigh, C., O’Keeffe, M., Nahm, W. & Mitton, S., arxiV:1701.07261 (2017)
- [7] Eddington, S.A., The Expanding Universe, Cambridge University Press (1920)
- [8] Weinberg, S., Rev. Mod. Phys., 61, 1 (1989)
- [9] Calder, L. & Lahav, O., Astronomy & Geophysics, 49, 1.13 (2008)
- [10] Binney, J. & Tremaine, S., Galactic Dynamics, Princeton University Press (2008)
- [11] Partridge, C., Lahav, O. & Hoffman, Y., MNRAS, 436, L45 (2013)
- [12] McLeod, M., Libeskind, N., Lahav, O, & Hoffman, Y., arXiv: 1606.02694 (2016)
- [13] Weinberg, D. & White, M. in Review of Particle Physics, Particle Data Group, http://pdg.lbl.gov/2019/reviews/rpp2019-rev-dark-energy.pdf (2019)
- [14] Lahav, O. & Liddle, A.R., in Review of Particle Physics, Particle Data Group, http://pdg.lbl.gov/2019/reviews/rpp2019-rev-cosmological-parameters.pdf (2019)
- [15] Lahav, O., Lilje, P.B., Primack, J.R. & Rees, M.J., 251, 128 (1991)
- [16] Calder, L. & Lahav, O., Physics World, Jan 2010, 32, (2010)
- [17] Dark Energy Survey collaboration, ApJ, 872, 2, L30 (2019)
- [18] Cole, S. and the 2dF team, MNRAS, 362, 505 (2005)
- [19] Eisenstein, D. and the SDSS team, ApJ, 633, 560 (2005)
- [20] Chang, C. and the Dark Energy Survey collaboration, PRL, 115, 05130 (2015)
- [21] LIGO Scientific Collaboration, PRL, 116, 061102 (2016)
- [22] LIGO Scientific Collaboration, PRL, 119, 161101 (2017)
- [23] Soares-Santos, M. et al., ApJ Lett., 848 , L16 (2017)
- [24] Dark Energy Survey collaboration, MNRAS, 460, 1270 (2016)
- [25] The Dark Energy Survey: The Story of a Cosmological Experiment, Editors:. O. Lahav, L. Calder, J. Mayers & J. Frieman, World Scientific (2020)
- [26] Dark Energy Survey collaboration, Phys Rev D, 98, 3526 (2018a)
- [27] Hildebrandt, H. et al., arXiv:1812.06076 (2018)
- [28] Dark Energy Survey collaboration, ApJ Lett, 872, 2 (2018b)
- [29] Aiola, S. et al., arXiv:2007.07288 (2020)
- [30] Alam, S. et al. , arXiv:2007.08991 (2020)
- [31] Asgari, M. et al., arXiv:2007.15633 (2020)
- [32] Freedman, W.L. et al., AJ, 553,47(2001)
- [33] Riess, A.G. et al., ApJ, 876, 85, arXiv:1903.07603 (2019)
- [34] Planck collaboration 2018 Results VI, arXiv:1807.06209 (2018)
- [35] Freedman, W.L. et al. , arXiv:1907.05922 (2019)
- [36] Wong, K.C. et al., arXiv:1907.04869 (2019)
- [37] Birrer , A.J. et al., arXiv:2007.02941 (2020)
- [38] LIGO Scientific Collaboration, Nature, 551, 85 (2017)
- [39] Soares-Santos, M. et al., ApJ Lett, 876, 1, L7 (2019)
- [40] Verde, L., Treu, T. & Riess, A.G. arXiv:1907.10625 (2019)
- [41] Efstathiou, G., arXiv:2007.10716 (2020)
- [42] Lahav, O., In Organizations and Strategies in Astronomy II ed. A. Heck, Kluwer Acad. Publ., astroE ph/0105351 (2002)
- [43] Lahav, O, & Massimi, M., Astronomy & Geophysics, 55, 3.12 (2014)