Evolution of Stellar Feedback in H ii Regions
Abstract
Stellar feedback is needed to produce realistic giant molecular clouds (GMCs) and galaxies in simulations, but due to limited numerical resolution, feedback must be implemented using subgrid models. Observational work is an important means to test and anchor these models, but limited studies have assessed the relative dynamical role of multiple feedback modes, particularly at the earliest stages of expansion when H ii regions are still deeply embedded. In this paper, we use multiwavelength (radio, infrared, and X-ray) data to measure the pressures associated with direct radiation (), dust-processed radiation (), photoionization heating (), and shock-heating from stellar winds () in a sample of 106 young, resolved H ii regions with radii 0.5 pc to determine how stellar feedback drives their expansion. We find that the dominates in 84% of the regions and that the median and are smaller than the median by factors of and , respectively. Based on the radial dependences of the pressure terms, we show that H ii regions transition from -dominated to -dominated at radii of 3 pc. We find a median trapping factor of 8 without any radial dependence for the sample, suggesting this value can be adopted in sub-grid feedback models. Moreover, we show that the total pressure is greater than the gravitational pressure in the majority of our sample, indicating that the feedback is sufficient to expel gas from the regions.
1 Introduction
Stellar feedback – the injection of energy and momentum by stars into the interstellar medium (ISM) – originates at the small scales of individual stars and star clusters (1 pc), yet it shapes the ISM on large scales (1 kpc). Stellar feedback is responsible for the low observed star formation efficiencies in Milky Way giant molecular clouds (GMCs; e.g., Zuckerman & Evans 1974; Krumholz & Tan 2007; Evans et al. 2009; Heiderman et al. 2010; Murray 2011; Evans et al. 2014; Lee et al. 2016; Barnes et al. 2017; Vutisalchavakul et al. 2016) and across GMCs in nearby galaxies (e.g., Longmore et al. 2013; Kruijssen et al. 2014; Usero et al. 2015; Bigiel et al. 2016; Leroy et al. 2017; Gallagher et al. 2018; Utomo et al. 2018). This inefficiency arises from feedback processes that dissolve star clusters (e.g., see review by Krumholz et al. 2019) and ultimately destroy their host clouds (e.g., Whitworth 1979; Matzner 2002; Krumholz et al. 2006; Dale et al. 2013).
Stars have several feedback mechanisms: e.g., radiation, photoionization, stellar winds, supernovae (SNe), protostellar jets, and cosmic rays (see reviews by Krumholz et al. 2019 and Rosen et al. 2020, and references therein). Extensive recent efforts have aimed to incorporate many feedback modes in simulations of star-forming cores and GMCs (e.g., Dale et al. 2014; Rosen et al. 2014, 2016; Dale 2017; Tanaka et al. 2017, 2018; Rosen & Krumholz 2020), and in galaxy formation models (e.g. Stinson et al. 2013; Agertz & Kravtsov 2016; Hopkins et al. 2018). While SNe may be the dominant mechanism in shaping galaxies on large scales (e.g., Hopkins et al. 2018), pre-SN feedback from the other mechanisms is crucial to reproduce observed GMC properties (e.g., Grisdale et al. 2018; Fujimoto et al. 2019).
Observational studies are crucial to anchor and test simulations. Individual feedback modes have been assessed for large samples of sources (e.g., Rosero et al. 2019), and measurements of the relative role of multiple feedback modes have been done for particular star-forming regions (e.g. Lopez et al. 2011; Pellegrini et al. 2011; Ginsburg et al. 2017; Lee et al. 2019; Xu et al. 2019) and across many regions (e.g. Lopez et al. 2014; Chevance et al. 2019; Kruijssen et al. 2019; McLeod et al. 2019; Barnes et al. 2020; McLeod et al. 2020). Among these latter works, Lopez et al. (2014, hereafter L14) analyzed multiwavelength data of 32 H ii regions in the Large (LMC) and Small Magellanic Clouds (SMC) to calculate the pressures associated with direct radiation, dust-processed radiation, photoionization heating, and shock-heating from stellar winds and SNe. They found that the warm ( K) gas pressure is the dominant feedback mechanism at the H ii region shells. McLeod et al. (2019) also examined two LMC star-forming complexes using integral-field data from MUSE, characterizing the stellar content, the gas properties, and the kinematics. Consistent with the L14 results, McLeod et al. (2019) determined that photoionization heating drives the dynamics in their sample.
The studies published to date have focused on relatively large ( pc) and evolved ( Myr) H ii regions (except the recent work by Barnes et al. 2020). However, theoretical models (e.g., Krumholz & Matzner, 2009; Geen et al., 2020) suggest that mechanisms other than photoionization may be comparatively more important early in the evolution of H ii regions, when they are significantly smaller and younger than the range probed by L14 and other works. To assess this possibility, in this paper we aim to explore how feedback properties differ at earlier stages in massive star formation and how the driving feedback mechanisms evolve with time. We therefore carry out an analysis similar to that of L14 but targeting a radio/IR-selected sample of much smaller, younger H ii regions.
In Section 2, we describe our sample and data used in our analysis. In Section 3, we review our methods for measuring each form of feedback. In Section 4, we present our results, and in Section 5, we discuss the implications regarding young H ii region dynamics, their evolution, and how our results can inform stellar feedback modeling in numerical simulations. We summarize our conclusions in Section 6.
2 Sample and Data
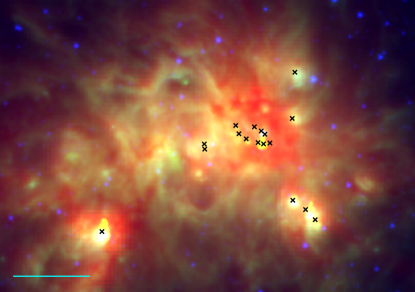
To evaluate the role of feedback mechanisms at the earliest stages of massive star formation, we consider 128 young H ii regions: 49 UCH ii regions (defined as those with radii pc), 67 compact H ii regions (with radii pc), and 12 small H ii regions (with radii pc) from the ATLASGAL survey (Urquhart et al., 2013). We require that the regions have bolometric luminosities measured by Mottram et al. (2011) and reported in Urquhart et al. (2013), limiting the Urquhart et al. (2013) sample of 213 sources to our sample of 128 compact H ii regions. Urquhart et al. (2013) used surveys that were complete down to B0 stars on the other side of the galaxy (ATLASGAL and CORNISH; Purcell et al. 2013). The Mottram et al. (2011) MSX survey is complete down to H ii regions with which matches the ATLASGAL survey well. Therefore, this requirement of in our study gives a representative sample of small H ii regions in the inner Milky Way. Out of the 128 sources, 106 were resolved in the CORNISH survey (Purcell et al., 2013), so we measure the feedback pressures in this sample and set limits on these terms for the 22 unresolved sources. The ATLASGAL survey covered a portion of the Milky Way Galactic plane, from longitude and latitude . These H ii regions were detected in the 5-GHz band by the CORNISH survey (Purcell et al., 2013) and in the 870 m band by the ATLASGAL survey and then confirmed as H ii regions using mid-infrared colors from the GLIMPSE survey (Benjamin et al., 2003; Churchwell et al., 2009). The H ii regions have well-defined radii from the 5-GHz measurements and kinematic distances derived by Urquhart et al. (2013). To illustrate the sample, in Figure 1, we show a three-color image of the massive star-forming region W49A, which contains nearly twenty of the regions considered in this work.
To evaluate the pressures associated with the different feedback modes, we employ radio, infrared (IR), and X-ray observations, as detailed in Section 3. Specifically, to measure the warm (104 K) gas pressure () associated with photoionization, we use the 5-GHz detections from the CORNISH survey (Purcell et al., 2013). To constrain the dust-processed radiation pressure (), we utilize 2MASS J, H, and, K-band photometry (Skrutskie et al., 2006), 8, 12, 14, and 21.3-m data from the RMS catalog (Lumsden et al., 2013), 70-m data from Spitzer MIPS (Carey et al., 2009), 60- and 100-m data from IRAS (Helou & Walker, 1988), and 870 m data from ATLASGAL (Urquhart et al., 2013). We require that our sample has 21.3-m data in order to constrain the peak of the spectral energy distribution (SED). To assess the hot (107 K) gas pressure attributed to shock-heating by stellar winds (), we analyze 0.5–7 keV archival data from the Chandra X-ray Observatory.
3 Methods
To measure the pressures associated with each feedback mode, we adopt methods similar to those of Lopez et al. (2011) and L14, with some differences described in the following sections. As the sources in our sample are not highly resolved, we measure integrated pressures averaged within the H ii region shells. We adopt H ii region radii from Urquhart et al. (2013) using distances measured with galactic kinematics and maser parallaxes. The regions have pc (angular radii of ′′) and are at distances of kpc.
3.1 Direct Radiation Pressure
Following L14, we define the direct radiation pressure as the momentum available to drive motion in the H ii region shells at a radius from the central stars:
| (1) |
where is the bolometric luminosity of the central stars111Note that the factor of 3 in the numerator of equation 1 arises because we are computing the volume-averaged radiation pressure within the H ii region rather than simply the pressure at the surface. The reason for computing the volume-averaged pressure is that is the quantity that appears in the virial theorem describing the overall dynamics of the region (McKee & Zweibel, 1992). For more discussion of why it is important to include this factor, see L14.. Mottram et al. (2011) derived for a subsample of the H ii regions by fitting SED models of young stellar objects (YSOs) to their SEDs (Robitaille et al., 2007). As noted by Urquhart et al. (2013), the ionizing fluxes they measured are consistent with these from Mottram et al. (2011). Thus, we adopt the reported by Mottram et al. (2011) for our H ii regions.
3.2 Dust-processed Radiation Pressure
The stellar radiation is absorbed by dust and thermally re-radiated at longer wavelengths in the IR, thereby enhancing radiation pressure in young star-forming regions. Measuring the dust-processed radiation pressure, , for our sources is significantly more challenging than for the larger H ii regions examined in L14 and similar studies. For evolved sources, the column of material inside and in front of the H ii region is small enough to be optically thin at far-IR and longer wavelengths, and thus one can use dust re-radiation at these wavelengths as a diagnostic of the radiation field seen by the grains. We have intentionally selected much more embedded sources, which may be optically thick in the far-IR regime. Consequently, we estimate the volume-averaged radiation pressure by modelling the complete near-IR to sub-mm SED and then deriving the pressure from the model.
For this purpose, we fit the IR data using synthetic SEDs from models of young stellar objects (YSOs) computed by Robitaille (2017) to find a geometry that produces the IR SED from each region. In an effort to recreate the models adopted by Mottram et al. (2011) from Robitaille et al. (2007), we use the most similar model set out of the 18 available in Robitaille (2017), the spubsmi model set. All model sets include a central star, an option of a passive (non-accreting) disk, a power-law or an accreting, rotationally flattened envelope (Ulrich, 1976), an internal bipolar cavity due to outflows, an ambient medium, and the option of the inner radius of the disk and envelope as either the dust sublimation radius or as a variable. Each model set has 14 parameters that are considered in the fit: stellar radius, stellar temperature, disk mass, disk inner radius, disk outer radius, the power-law index describing disk flaring, disk surface density power, disk scale height, envelope density, the power-law index describing the envelope density profile, envelope centrifugal radius, cavity density, cavity opening angle, and the power-law exponent of the cavity opening.
We chose the spubsmi model set because high-mass YSOs have observed accretion disks (Patel et al., 2005; Kraus et al., 2010); however, we note that no Robitaille (2017) model set has accreting disks, arguing that the difference between a passive and an accreting disk would not noticeably change the SED. We tested different model sets on a sample of our regions, and the spubsmi set fit both the near-IR and far-IR data the best in terms of the resulting values.
We fit the synthetic SEDs produced by this model set to the IR data using the SEDfitter from Robitaille et al. (2007). We used the same extinction law as Forbrich et al. (2010) which has = 5.5 based on the larger grains anticipated in dense star-forming regions. When fitting the data, we limited the distances to within 2 kpc of the values reported by Urquhart et al. (2013). The distance functions mostly as a normalization of the models during fitting: by limiting the distances, we exclude models that have incident fluxes indicative of regions either much farther or much closer than are observed. In addition to this normalization aspect of distance, more distant regions have more material in the beam, so fitting with a single star model would be a worse assumption. Nevertheless, the observed flux is dominated by the brightest source, and with our adequate fits, the assumption seems reasonable. None of the regions have clearly resolved, multiple stars, and from the SED fits, it is not possible for us to distinguish whether the regions are powered by one or more stars.
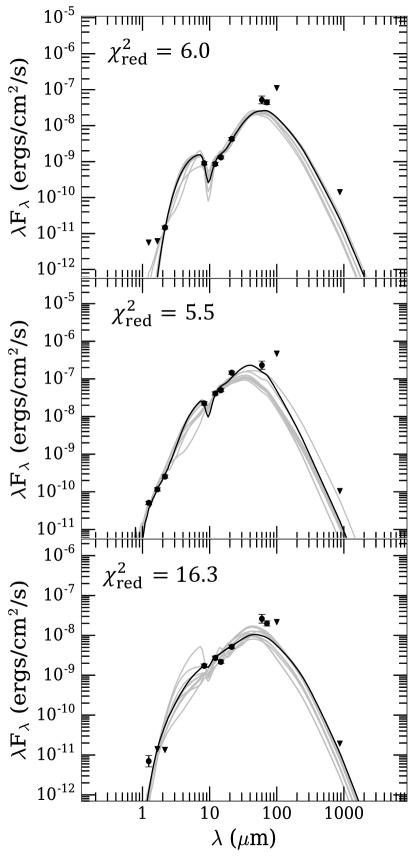
We fit the Robitaille (2017) models to an SED consisting of measurements at J, H, and K-band (from 2MASS), 8, 12, 14, and 21 m (from MSX), 60 and 100 m (from IRAS), 70 m (from Spitzer/MIPS), and 870 m from ATLASGAL, as described in Section 2. For the J, H, K, and 70-m measurements, we compare to the filter-convolved fluxes in the Robitaille (2017) models, while for the other wavelengths, we use the flux at the central wavelength of the filters. Additionally, the apertures of the measurements are necessary for SEDfitter to provide an accurate fit We treat the measurements at 100 and 870 m as upper limits, since the beam sizes for these measurements are much larger than the ′′ sizes of our sample H ii regions. We set the apertures for the data shorter than 21 m, at 60 m, at 70 and 100 m, and at 870 m to 3′′, 10′′, 20′′, and 55′′, respectively. This set of measurements ensures good coverage on both sides of the peak of the SED, enabling strong constraints on the model fits. We show some example fits produced by this procedure in Figure 2.
In our analysis, we include only the regions where the reduced chi-squared from the fit is which limits our sample to 81 sources. Nayak et al. (2016) used a cut of 10 to ensure that only YSOs were included in their sample. We use a less stringent cut on because Urquhart et al. (2013) already confirmed these objects are H ii regions.
Once we determined the best-fit SED model, we took the 14 parameters and recreated the geometry in HYPERION, a 3D Monte-Carlo dust continuum radiative transfer code, to obtain the dust temperature distribution (Robitaille, 2011). HYPERION outputs an axi-symmetric dust temperature map as heated by the radiation from the central source. From the distribution, we calculate for each source by integrating over the two-dimensional axi-symmetric grid of :
| (2) |
where is the radiation constant erg cm-3 K-4 and is the H ii region volume. Note that this expression implicitly assumes that the IR radiation temperature is equal to the dust temperature; this is a reasonable approximation in the highly-opaque regions with which we are concerned. We integrate out to , the observed H ii region radius, to include the dusty shell surrounding the region. We set the dust temperature within the dust sublimation radius to K, the dust sublimation temperature, to account for the energy contained in that radius.
3.3 Warm Ionized Gas Pressure
The photoionization heating from massive stars creates warm, 104 K gas, the classical driver of H ii regions. We measure the pressure from this warm gas by using the ideal gas law:
| (3) |
We adopt a warm-gas temperature of K, and we estimate the density, , to calculate . is the number density of free particles and depends on the ionization state of the gas; if hydrogen is fully ionized and helium is singly ionized, then . We use Equation 5.14b from Rybicki & Lightman (1979) for free-free emission to calculate :
| (4) |
where is the distance to the region, is the flux density at frequency , and is the volume of the region. In this study, we use the measurements from CORNISH at 5 GHz, where free-free dominates. We adopt a Gaunt factor of 5.1 based on Draine (2011a) and van Hoof et al. (2014), which indicate that for a 104K gas observed at 5 GHz, the Gaunt factor is larger than the commonly adopted 1. This higher Gaunt factor lowers our measurements by a factor of 51/2 compared to a Gaunt factor of 1. If instead a was adopted, then the primary result that would change is the transition radius where would become 0.9 pc instead of 3 pc in Section 5.1.
3.4 Hot Gas Pressure
The stars powering the young H ii regions have radiatively-driven stellar winds that shock-heat gas to 106 K (Rosen et al., 2014). This hot gas creates pressure within the region according to the ideal gas law:
| (5) |
where is the electron density in the hot gas, and the factor of 1.9 assumes that He is doubly ionized and the He mass fraction is 0.25.
Based on searches of the Chandra Data Archive, 26 out of 128 have archival observations. Among the 26 sources, only 6 have detections with 10 net counts in the 0.5–7.0 keV band. In these cases, the regions are not resolved222The on-axis PSF of Chandra ACIS is 0.492′′ and the PSF 5′ off-axis increases to 1′′: https://cxc.harvard.edu/proposer/POG/html/chap4.html, and the limited number of counts precludes reliable spectral modeling. However, the high median energies of the counts (3–6 keV) and the elevated hardness ratios333Defined as HR = [(2–8 keV)(0.5–2 keV)]/[(2–8 keV)(0.5–2 keV)], where is the net counts observed in a given bandpass. (0.5–1.0) of the targets suggest that the spectra are quite hard. Previous X-ray studies of young H ii regions have also found that hard X-rays dominate their emission (e.g., Tsujimoto et al. 2006; Anderson et al. 2011), which may indicate very hot plasma temperatures (with keV) and/or extreme column densities (of cm-2) that attenuate the soft X-rays.
In young H ii regions, the origin of the X-ray emission is uncertain: it may be from unresolved point sources, interacting/colliding stellar winds, or wind-blown bubbles (see Tsujimoto et al. 2006). However, the available data have insufficient counts to distinguish between these scenarios. Thus, given that the X-rays may arise from these other channels and not just the shock-heated gas from individual stellar winds, we treat all of the hot-gas measurements as upper limits.
We calculate the upper-limits on for each region by simulating an optically-thin thermal plasma with metallicity of and temperature =0.4 keV. We assume a Galactic column density toward each region using the values from HI4PI Collaboration et al. (2016). We use WebPIMMS444https://heasarc.gsfc.nasa.gov/cgi-bin/Tools/w3pimms/w3pimms.pl to obtain the normalization of the resulting X-ray spectra, which is defined as , where . Given the values and assuming the distance to the regions, we measure by integrating over the volume of the region.
3.5 Errors and Uncertainties in Pressure Terms
To assess uncertainty in our pressure measurements, we examine the largest source of error in each calculation. For , , and , the greatest uncertainty arises from the 10% error in the H ii region radii reported by (Urquhart et al., 2013). Thus, to ascertain the confidence range in the pressure terms, we adopt radii of and compute the associated pressures. For the 22 unresolved regions, we set 0.75′′ as the sources’ angular diameter. These upper limits yield lower limits on the pressures derived for these objects.
4 Results
From our 128 region sample, 106 sources were resolved in the CORNISH survey (Purcell et al., 2013), and 81 meet our requirements for the IR SED fits. We find that 68 of the 81 regions are -dominated, and 3 regions are -dominated. Additionally, 4 regions have (within the uncertainties), and 6 others have (within the uncertainties). Overall, the median () is 17% (11%) of the median in our sample.
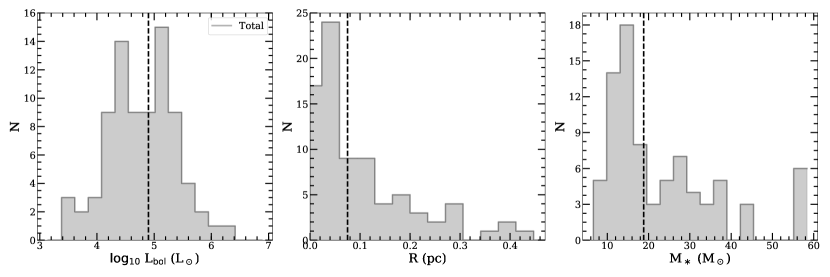
We plot the distribution of , radius , and central star mass for all of the regions in Figure 3. We derive using and the empirical measurements of O stars from Martins et al. (2005) and of B stars from Schmidt-Kaler (1982). We report the parameter ranges covered by the four groups of H ii regions (with , , -dominated, and -dominated regions) in Table 1. For the 81 region sample, the median is 4.9, the median is 0.08 pc, and the median is 18.8 .
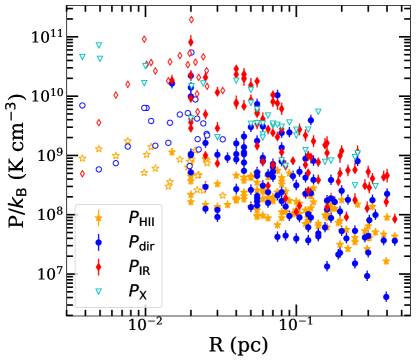
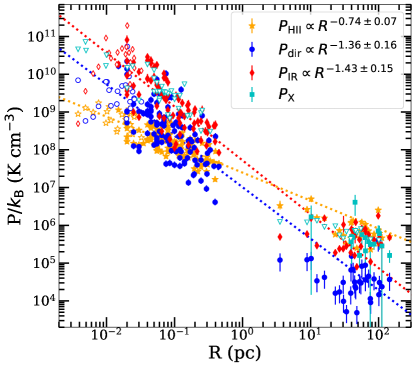
In Figure 4, we plot the pressures derived for the sample, and in Figure 5, we compare our results with those of the evolved H ii regions in the LMC and SMC from L14555We have recomputed the measured by L14, changing the Gaunt factor of in that work to .. The pressure terms decrease with radius, as expected given the increasing volume as the shell expands. L14 found that dominated for the evolved H ii regions, while is nearly an order of magnitude lower in their sample, contrasting the results from the young H ii regions in our sample.
| Property | Units | ||||
|---|---|---|---|---|---|
| Number | 4 | 6 | 3 | 68 | |
| log | L⊙ | 4.1–4.9 | 5.0–6.4 | 5.3–5.8 | 3.5–6.2 |
| M⊙ | 13.0–18.8 | 20.8–58.0 | 31.0-58.0 | 9.8–58.0 | |
| 2.6–5.3 | 1.7–2.6 | 1.2–1.8 | 2.8–121 | ||
| pc | 0.09–0.22 | 0.02–0.26 | 0.02–0.16 | 0.02–0.45 | |
| pc | 0.01–0.04 | 0.03–0.46 | 0.03–0.17 | 0.01–13.5 | |
| / | 3.3–11.66 | 0.24–2.11 | 0.47–2.89 | 0.01–5.51 |
Note. — Range of values from the sample of 81 young H ii regions that have measurements for , , and .
Our results, in combination with those found in L14, can probe the transition from radiation pressure dominated to warm gas pressure dominated H ii regions. Direct radiation pressure, , and have different radial dependencies in a single region: , whereas . The radial dependence of is more complex, since it depends on the opacity of the dusty material around the H ii region as well as its radius, but is also in general expected to fall sharply with . Consequently, a region transitions from being radiation-pressure driven to gas-pressure driven at a characteristic radius (Krumholz & Matzner, 2009):
| (6) |
where we assume a temperature of K, and is the ionizing photon rate in units of photons s-1. The factor represents the amount that radiation pressure is enhanced by trapping energy within the shell from stellar winds (), infrared photons (), or Ly photons ():
| (7) |
where the 1 represents absorption of the direct radiation. We are unable to constrain without X-ray detections of the diffuse gas in the sources, and since Ly trapping is limited by the presence of dust (Henney & Arthur, 1998). Therefore, we assume that .
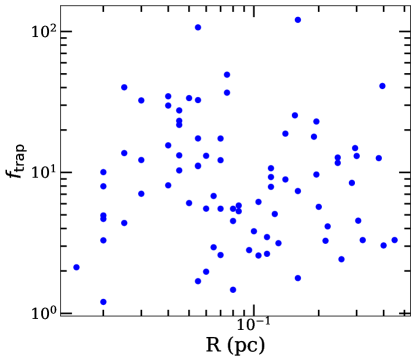
The distributions of , , and are shown in Figure 6. The median values of these parameters are = 8.1, = 0.42 pc, and = 0.24.
5 Discussion
5.1 Feedback Evolution
As shown in Figure 5, and are of similar magnitude for the young H ii regions, but dominates statistically significantly in 68 out of the 81 source sample. By contrast, in the evolved L14 sources, is roughly an order of magnitude lower than , and almost all are -dominated.
Moreover, the young H ii region pressures are orders of magnitude larger than those measured for the evolved sample from L14. This result suggests radial dependence of the pressures. For an individual H ii region, (Equation 4), while (Equation 1). However, we note the heterogeneity of our sample and the L14 sample. For example, based on their luminosities (see Table 1), the young H ii regions considered here are powered by individual O- and B-stars or small star clusters, whereas the L14 sample is driven by star clusters of mass –3. Furthermore, the L14 sample is comprised of H ii regions in the LMC and SMC, where the metallicity is lower (with and 0.2, respectively; Russell & Dopita 1992; Kurt & Dufour 1998).
To assess the radial dependence, we measure the power-law slopes with respect to radius for each pressure term for only the young H ii sample. We use all 106 resolved regions to measure the slopes for and , but we use only the 81 regions with measurements to fit the slope. We find , , and . We note that was measured differently in this work compared to L14: L14 used the Draine & Li (2007) dust models, which did not apply to the embedded H ii regions analyzed here because they are optically thick. Consequently, the best-fit power-law does not reflect the measurements of the evolved H ii regions.
Given the different radial trends between and , we estimate the radius where the sources transition from -dominated to -dominated: 3 pc. This assumes that the dust remains optically thick around the H ii regions out to these large radii, which may not be physically probable. If instead they become optically thin, then this transition would occur at smaller radii. In the future, observations of pc radius H ii regions are necessary to evaluate this transition.
was the dominant form of feedback in the evolved H ii region sample of L14, whereas and were factors of several weaker. The change in the pressure terms between the two H ii region populations demonstrates that the dynamical impact of feedback evolves and that direct and dust-processed radiation can be significant at early times (e.g., yr; Arthur & Hoare 2006; Tremblin et al. 2014) in star-forming regions.
Recently, Barnes et al. (2020) conducted a similar analysis as our work, measuring feedback pressures in H ii regions with effective radii pc in the Milky Way Central Molecular Zone. They found that is the dominant feedback term for sources with 0.1 pc, whereas takes over the energy budget in larger regions. Although Barnes et al. (2020) measured for their regions with 0.5 pc, they did not extend down to smaller radii to estimate because of spatial resolution limitations. However, we note that their estimates of and for sources with 0.5 pc agree within an order-of-magnitude of our results, and their best-fit power-law slopes (of and ) are consistent with our findings (shown in Figure 4) given the uncertainties.
5.2 -Dominated Regions
From the 81 regions discussed in Section 4, we find that 68 sources have as the dominant pressure term. Three regions are -dominated, four regions have comparable and , and six regions have comparable and . We report the range of properties for these four groups of sources (with , , dominant , and dominant ) in Table 1. We note that the of the sources with are in the lower-luminosity end of the sample, whereas the -dominated and regions have higher luminosities. The values for the -dominated and regions are among the lowest in the sample, while the measurements for the -dominated and regions are systematically greater. The range of for the regions with is 3.3–11.66, consistent with expectations that regions with are gas-pressure dominated. As predicted, the vast majority (60 out of 68) of the -dominated regions have , though seven have and one has . We note that the latter source has a relatively low and log , leading to a small of 0.01 pc.
Our results, where 84% of the young regions are -dominated, indicate that radiation pressure can be significant at early times in H ii regions. This finding is consistent with the conclusions of Geen et al. (2020) who employed analytical models of H ii regions and showed that and are most important when the shells are small (with radii 0.1 pc) and at high surface densities. However, our results contrast those from other theoretical studies that evaluated the impact of dust-processed radiation. Rahner et al. (2017) constructed semi-analytic, one-dimensional models of isolated 105–108 clouds with radiation (direct and dust-processed), stellar winds, and SNe. They found that is negligible in their low-mass clouds (105 ) and is only significant in the early phases of the massive GMCs or during recollapse following the initial starburst. Reissl et al. (2018) noted that photons absorbed and re-emitted by dust deposit little momentum in GMCs because they escape promptly, thus limiting the role of in GMC disruption. However, in agreement with our results in combination with those of L14, they find that radiation pressure decreases as star clusters become more extended and evolved. Our observational results reflect H ii regions powered by individual stars or lower-mass clusters at earlier times than considered by Rahner et al. (2017) and at smaller scales than Reissl et al. (2018). Our findings suggest that sub-pc H ii regions may have significant indirect radiation pressure, even if it does not lead to GMC disruption.
-dominated sources have distinct structure and dynamics (e.g. Mathews 1967, 1969; Petrosian et al. 1972; Gail & Sedlmayr 1979) from classical H ii regions which are dominated by (e.g., Strömgren 1939; Savedoff & Greene 1955). In particular, -dominated H ii regions are thought to have density gradients in the gas within the regions (e.g. Dopita et al. 2003, 2006; Draine 2011b) and have swept-up shells of gas and dust (e.g. Draine 2011b; Rodríguez-Ramírez & Raga 2016). Dynamically, radiation pressure leads to faster expansion at early times (e.g. Krumholz & Matzner 2009; Martínez-González et al. 2014; Geen et al. 2020). Given the differences relative to classical H ii regions, our results underscore the importance of including dust and radiative feedback in small-scale massive star formation simulations and high-resolution GMC scale simulations.
5.3 Application to Sub-Grid Feedback Models in Galaxy- and Star Cluster-Scale Simulations
As discussed above, one of the primary takeaways from our results is that dust and radiative feedback should not be neglected in small-scale, high-mass star formation and high-resolution, GMC-scale simulations. Quite often, due to the large computational expense of radiative transfer in numerical simulations (e.g., see Rosen et al., 2017), the dust-processed radiation pressure is neglected. However, our results indicate that during the early evolution of massive star formation is the dominant feedback mechanism regulating H ii region dynamics, at least up to a pc, corresponding to the median value found in our sample.
In the future, simulations can incorporate our observationally-inferred results to model the energy and momentum injection by massive stars into the ISM at these scales by adopting the following sub-grid prescription. Within a radius pc, the rate of energy () and momentum () injection in nearby gas and dust by massive stars is
| (8) | |||||
| (9) |
where is the sum of the stellar luminosity and accretion luminosity. Here, takes into account both the direct radiation and indirect radiation pressure enhancement due to reprocessing by dust. We suggest using a value of following the median value obtained in our sample. Given that we do not find a correlation between H ii region size and (as shown in Figure 7), we conclude that using a constant value for is a reasonable approximation. However, we note that this does likely depend on other physical parameters, e.g. the dust-to-gas ratio, metallicity, and the optical depth per unit dust mass.
5.4 Comparison to Gravitational Pressure
Since these regions are compact they may be actively accreting material and gravitationally collapsing. We test this hypothesis by calculating the gravitational pressure () to compare to our feedback pressures as calculated above. From our models discussed in Section 3, we estimate the gravitational pressure as
| (10) |
where is the gravitational constant, is the total mass within radius (including the star and gas), and is the volume of the H ii region.
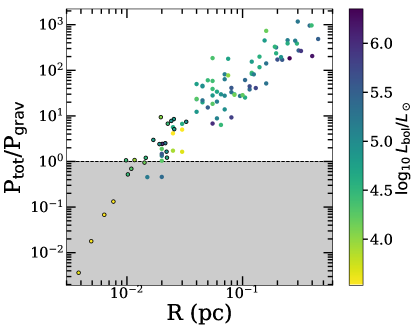
We compare to the total pressure from feedback, , in Figure 8 by plotting their ratio as a function of . The regions with represent those dominated by feedback, while those with (in the shaded region of Figure 8) are collapsing due to gravity. The figure shows that for all but the most compact of our H ii regions, feedback dominates over gravity, and thus is capable of ejecting gas. For the few regions that are collapsing due to gravity, we interpret this result as the late stages of accretion onto the star as these regions are the smallest in our sample and have some of the lowest measurements, which could indicate the stars are still growing. We expect that the feedback pressures will increase over time and then drive H ii region expansion. The existence of accretion-confined H ii regions such as those we have found has long been predicted (e.g., Keto 2002, 2003).
6 Conclusions
In this work, we used radio, IR, and X-ray data to assess the dynamical impact of stellar feedback mechanisms in a sample of 106 resolved, young H ii regions with radii 0.5 pc. We measured the pressures associated with direct radiation (), dust-processed radiation (), photoionization heating (), and stellar winds (). We found that is statistically significantly dominant for 84% (68 out of 81) of the regions, and by comparison, the median () is 17% (11%) of the median in our sample. We set upper limits on due to the lack of X-ray detections, and these limits are comparable to the measured values.
Our young H ii region results contrast with those of L14, who analyzed evolved sources in the LMC and SMC that were mostly -dominated. Our sample yielded radial pressure dependences of , , and . Using these relations, the transition radius from -dominated and -dominated regions would be at 3 pc. We found a median of 8 without any radial dependence for regions 0.5 pc in size, suggesting this value can be adopted in sub-grid feedback models in galaxy- and star cluster-scale simulations. We compared the total pressure to the gravitational pressure in our sources, and we showed that only the smallest H ii regions are dominated by . This result indicates that for the majority of our sources, the feedback pressure is sufficient to expel gas from the regions.
In the future, observations of H ii regions with radii of 0.5–3 pc can fill the gap between the young sources considered here and the evolved sample analyzed by L14. That work will enable stronger constraints on the scale where H ii regions transition from -dominated to -dominated.
References
- Agertz & Kravtsov (2016) Agertz, O., & Kravtsov, A. V. 2016, ApJ, 824, 79, doi: 10.3847/0004-637X/824/2/79
- Anderson et al. (2011) Anderson, C. N., Hofner, P., Shepherd, D., & Creech-Eakman, M. 2011, AJ, 142, 158, doi: 10.1088/0004-6256/142/5/158
- Arthur & Hoare (2006) Arthur, S. J., & Hoare, M. G. 2006, ApJS, 165, 283, doi: 10.1086/503899
- Barnes et al. (2017) Barnes, A. T., Longmore, S. N., Battersby, C., et al. 2017, MNRAS, 469, 2263, doi: 10.1093/mnras/stx941
- Barnes et al. (2020) Barnes, A. T., Longmore, S. N., Dale, J. E., et al. 2020, arXiv e-prints, arXiv:2009.03901. https://arxiv.org/abs/2009.03901
- Benjamin et al. (2003) Benjamin, R. A., Churchwell, E., Babler, B. L., et al. 2003, PASP, 115, 953, doi: 10.1086/376696
- Bigiel et al. (2016) Bigiel, F., Leroy, A. K., Jiménez-Donaire, M. J., et al. 2016, ApJ, 822, L26, doi: 10.3847/2041-8205/822/2/L26
- Carey et al. (2009) Carey, S. J., Noriega-Crespo, A., Mizuno, D. R., et al. 2009, PASP, 121, 76, doi: 10.1086/596581
- Chevance et al. (2019) Chevance, M., Kruijssen, J. M. D., Hygate, A. P. S., et al. 2019, MNRAS, 3155, doi: 10.1093/mnras/stz3525
- Churchwell et al. (2009) Churchwell, E., Babler, B. L., Meade, M. R., et al. 2009, PASP, 121, 213, doi: 10.1086/597811
- Dale (2017) Dale, J. E. 2017, MNRAS, 467, 1067, doi: 10.1093/mnras/stx028
- Dale et al. (2013) Dale, J. E., Ercolano, B., & Bonnell, I. A. 2013, MNRAS, 430, 234, doi: 10.1093/mnras/sts592
- Dale et al. (2014) Dale, J. E., Ngoumou, J., Ercolano, B., & Bonnell, I. A. 2014, MNRAS, 442, 694, doi: 10.1093/mnras/stu816
- Dopita et al. (2003) Dopita, M. A., Groves, B. A., Sutherland, R. S., & Kewley, L. J. 2003, ApJ, 583, 727, doi: 10.1086/345448
- Dopita et al. (2006) Dopita, M. A., Fischera, J., Crowley, O., et al. 2006, ApJ, 639, 788, doi: 10.1086/499762
- Draine (2011a) Draine, B. T. 2011a, Physics of the Interstellar and Intergalactic Medium
- Draine (2011b) —. 2011b, ApJ, 732, 100, doi: 10.1088/0004-637X/732/2/100
- Draine & Li (2007) Draine, B. T., & Li, A. 2007, ApJ, 657, 810, doi: 10.1086/511055
- Evans et al. (2014) Evans, II, N. J., Heiderman, A., & Vutisalchavakul, N. 2014, ApJ, 782, 114, doi: 10.1088/0004-637X/782/2/114
- Evans et al. (2009) Evans, II, N. J., Dunham, M. M., Jørgensen, J. K., et al. 2009, ApJS, 181, 321, doi: 10.1088/0067-0049/181/2/321
- Forbrich et al. (2010) Forbrich, J., Tappe, A., Robitaille, T., et al. 2010, ApJ, 716, 1453, doi: 10.1088/0004-637X/716/2/1453
- Fruscione et al. (2006) Fruscione, A., McDowell, J. C., Allen, G. E., et al. 2006, in Society of Photo-Optical Instrumentation Engineers (SPIE) Conference Series, Vol. 6270, Society of Photo-Optical Instrumentation Engineers (SPIE) Conference Series, 62701V
- Fujimoto et al. (2019) Fujimoto, Y., Chevance, M., Haydon, D. T., Krumholz, M. R., & Kruijssen, J. M. D. 2019, MNRAS, 487, 1717, doi: 10.1093/mnras/stz641
- Gail & Sedlmayr (1979) Gail, H. P., & Sedlmayr, E. 1979, A&A, 77, 165
- Gallagher et al. (2018) Gallagher, M. J., Leroy, A. K., Bigiel, F., et al. 2018, ApJ, 858, 90, doi: 10.3847/1538-4357/aabad8
- Geen et al. (2020) Geen, S., Pellegrini, E., Bieri, R., & Klessen, R. 2020, MNRAS, 492, 915, doi: 10.1093/mnras/stz3491
- Ginsburg et al. (2017) Ginsburg, A., Goddi, C., Kruijssen, J. M. D., et al. 2017, ApJ, 842, 92, doi: 10.3847/1538-4357/aa6bfa
- Grisdale et al. (2018) Grisdale, K., Agertz, O., Renaud, F., & Romeo, A. B. 2018, MNRAS, 479, 3167, doi: 10.1093/mnras/sty1595
- Heiderman et al. (2010) Heiderman, A., Evans, II, N. J., Allen, L. E., Huard, T., & Heyer, M. 2010, ApJ, 723, 1019, doi: 10.1088/0004-637X/723/2/1019
- Helou & Walker (1988) Helou, G., & Walker, D. W., eds. 1988, Infrared Astronomical Satellite (IRAS) Catalogs and Atlases.Volume 7: The Small Scale Structure Catalog., Vol. 7
- Henney & Arthur (1998) Henney, W. J., & Arthur, S. J. 1998, AJ, 116, 322, doi: 10.1086/300433
- HI4PI Collaboration et al. (2016) HI4PI Collaboration, Ben Bekhti, N., Flöer, L., et al. 2016, A&A, 594, A116, doi: 10.1051/0004-6361/201629178
- Hopkins et al. (2018) Hopkins, P. F., Wetzel, A., Kereš, D., et al. 2018, MNRAS, 480, 800, doi: 10.1093/mnras/sty1690
- Keto (2002) Keto, E. 2002, ApJ, 580, 980, doi: 10.1086/343794
- Keto (2003) —. 2003, ApJ, 599, 1196, doi: 10.1086/379545
- Kraus et al. (2010) Kraus, S., Hofmann, K.-H., Menten, K. M., et al. 2010, Nature, 466, 339, doi: 10.1038/nature09174
- Kruijssen et al. (2014) Kruijssen, J. M. D., Longmore, S. N., Elmegreen, B. G., et al. 2014, MNRAS, 440, 3370, doi: 10.1093/mnras/stu494
- Kruijssen et al. (2019) Kruijssen, J. M. D., Schruba, A., Chevance, M., et al. 2019, Nature, 569, 519, doi: 10.1038/s41586-019-1194-3
- Krumholz & Matzner (2009) Krumholz, M. R., & Matzner, C. D. 2009, ApJ, 703, 1352, doi: 10.1088/0004-637X/703/2/1352
- Krumholz et al. (2006) Krumholz, M. R., Matzner, C. D., & McKee, C. F. 2006, ApJ, 653, 361, doi: 10.1086/508679
- Krumholz et al. (2019) Krumholz, M. R., McKee, C. F., & Bland -Hawthorn, J. 2019, ARA&A, 57, 227, doi: 10.1146/annurev-astro-091918-104430
- Krumholz & Tan (2007) Krumholz, M. R., & Tan, J. C. 2007, ApJ, 654, 304, doi: 10.1086/509101
- Kurt & Dufour (1998) Kurt, C. M., & Dufour, R. J. 1998, in Revista Mexicana de Astronomia y Astrofisica Conference Series, Vol. 7, Revista Mexicana de Astronomia y Astrofisica Conference Series, ed. R. J. Dufour & S. Torres-Peimbert, 202
- Lee et al. (2016) Lee, E. J., Miville-Deschênes, M.-A., & Murray, N. W. 2016, ApJ, 833, 229, doi: 10.3847/1538-4357/833/2/229
- Lee et al. (2019) Lee, M. Y., Madden, S. C., Le Petit, F., et al. 2019, A&A, 628, A113, doi: 10.1051/0004-6361/201935215
- Leroy et al. (2017) Leroy, A. K., Schinnerer, E., Hughes, A., et al. 2017, ApJ, 846, 71, doi: 10.3847/1538-4357/aa7fef
- Longmore et al. (2013) Longmore, S. N., Bally, J., Testi, L., et al. 2013, MNRAS, 429, 987, doi: 10.1093/mnras/sts376
- Lopez et al. (2011) Lopez, L. A., Krumholz, M. R., Bolatto, A. D., Prochaska, J. X., & Ramirez-Ruiz, E. 2011, ApJ, 731, 91, doi: 10.1088/0004-637X/731/2/91
- Lopez et al. (2014) Lopez, L. A., Krumholz, M. R., Bolatto, A. D., et al. 2014, ApJ, 795, 121, doi: 10.1088/0004-637X/795/2/121
- Lumsden et al. (2013) Lumsden, S. L., Hoare, M. G., Urquhart, J. S., et al. 2013, ApJS, 208, 11, doi: 10.1088/0067-0049/208/1/11
- Martínez-González et al. (2014) Martínez-González, S., Silich, S., & Tenorio-Tagle, G. 2014, ApJ, 785, 164, doi: 10.1088/0004-637X/785/2/164
- Martins et al. (2005) Martins, F., Schaerer, D., & Hillier, D. J. 2005, A&A, 436, 1049, doi: 10.1051/0004-6361:20042386
- Mathews (1967) Mathews, W. G. 1967, ApJ, 147, 965, doi: 10.1086/149087
- Mathews (1969) —. 1969, ApJ, 157, 583, doi: 10.1086/150098
- Matzner (2002) Matzner, C. D. 2002, ApJ, 566, 302, doi: 10.1086/338030
- McKee & Williams (1997) McKee, C. F., & Williams, J. P. 1997, ApJ, 476, 144, doi: 10.1086/303587
- McKee & Zweibel (1992) McKee, C. F., & Zweibel, E. G. 1992, ApJ, 399, 551, doi: 10.1086/171946
- McLeod et al. (2019) McLeod, A. F., Dale, J. E., Evans, C. J., et al. 2019, MNRAS, 486, 5263, doi: 10.1093/mnras/sty2696
- McLeod et al. (2020) McLeod, A. F., Kruijssen, J. M. D., Weisz, D. R., et al. 2020, ApJ, 891, 25, doi: 10.3847/1538-4357/ab6d63
- Mottram et al. (2011) Mottram, J. C., Hoare, M. G., Urquhart, J. S., et al. 2011, A&A, 525, A149, doi: 10.1051/0004-6361/201014479
- Murray (2011) Murray, N. 2011, ApJ, 729, 133, doi: 10.1088/0004-637X/729/2/133
- Murray & Rahman (2010) Murray, N., & Rahman, M. 2010, ApJ, 709, 424, doi: 10.1088/0004-637X/709/1/424
- Nayak et al. (2016) Nayak, O., Meixner, M., Indebetouw, R., et al. 2016, ApJ, 831, 32, doi: 10.3847/0004-637X/831/1/32
- Patel et al. (2005) Patel, N. A., Curiel, S., Sridharan, T. K., et al. 2005, Nature, 437, 109, doi: 10.1038/nature04011
- Pellegrini et al. (2011) Pellegrini, E. W., Baldwin, J. A., & Ferland, G. J. 2011, ApJ, 738, 34, doi: 10.1088/0004-637X/738/1/34
- Petrosian et al. (1972) Petrosian, V., Silk, J., & Field, G. B. 1972, ApJ, 177, L69, doi: 10.1086/181054
- Purcell et al. (2013) Purcell, C. R., Hoare, M. G., Cotton, W. D., et al. 2013, ApJS, 205, 1, doi: 10.1088/0067-0049/205/1/1
- Quireza et al. (2006) Quireza, C., Rood, R. T., Bania, T. M., Balser, D. S., & Maciel, W. J. 2006, ApJ, 653, 1226, doi: 10.1086/508803
- Rahner et al. (2017) Rahner, D., Pellegrini, E. W., Glover, S. C. O., & Klessen, R. S. 2017, MNRAS, 470, 4453, doi: 10.1093/mnras/stx1532
- Reissl et al. (2018) Reissl, S., Klessen, R. S., Mac Low, M.-M., & Pellegrini, E. W. 2018, A&A, 611, A70, doi: 10.1051/0004-6361/201731698
- Robitaille (2011) Robitaille, T. P. 2011, A&A, 536, A79, doi: 10.1051/0004-6361/201117150
- Robitaille (2017) —. 2017, A&A, 600, A11, doi: 10.1051/0004-6361/201425486
- Robitaille et al. (2007) Robitaille, T. P., Whitney, B. A., Indebetouw, R., & Wood, K. 2007, ApJS, 169, 328, doi: 10.1086/512039
- Rodríguez-Ramírez & Raga (2016) Rodríguez-Ramírez, J. C., & Raga, A. C. 2016, MNRAS, 460, 1876, doi: 10.1093/mnras/stw1144
- Rosen & Krumholz (2020) Rosen, A. L., & Krumholz, M. R. 2020, AJ, 160, 78, doi: 10.3847/1538-3881/ab9abf
- Rosen et al. (2016) Rosen, A. L., Krumholz, M. R., McKee, C. F., & Klein, R. I. 2016, MNRAS, 463, 2553, doi: 10.1093/mnras/stw2153
- Rosen et al. (2017) Rosen, A. L., Krumholz, M. R., Oishi, J. S., Lee, A. T., & Klein, R. I. 2017, Journal of Computational Physics, 330, 924, doi: 10.1016/j.jcp.2016.10.048
- Rosen et al. (2014) Rosen, A. L., Lopez, L. A., Krumholz, M. R., & Ramirez-Ruiz, E. 2014, MNRAS, 442, 2701, doi: 10.1093/mnras/stu1037
- Rosen et al. (2020) Rosen, A. L., Offner, S. S. R., Sadavoy, S. I., et al. 2020, Space Sci. Rev., 216, 62, doi: 10.1007/s11214-020-00688-5
- Rosero et al. (2019) Rosero, V., Tanaka, K. E. I., Tan, J. C., et al. 2019, ApJ, 873, 20, doi: 10.3847/1538-4357/ab0209
- Russell & Dopita (1992) Russell, S. C., & Dopita, M. A. 1992, ApJ, 384, 508, doi: 10.1086/170893
- Rybicki & Lightman (1979) Rybicki, G. B., & Lightman, A. P. 1979, Radiative processes in astrophysics
- Savedoff & Greene (1955) Savedoff, M. P., & Greene, J. 1955, ApJ, 122, 477, doi: 10.1086/146109
- Schmidt-Kaler (1982) Schmidt-Kaler, T. 1982, 4.1.4 Effective temperatures, bolometric corrections and luminosities: Datasheet from Landolt-Börnstein - Group VI Astronomy and Astrophysics · Volume 2B: “Stars and Star Clusters” in SpringerMaterials (https://doi.org/10.1007/10201975_102), Springer-Verlag Berlin Heidelberg, doi: 10.1007/10201975_102. https://materials.springer.com/lb/docs/sm_lbs_978-3-540-31378-6_102
- Skrutskie et al. (2006) Skrutskie, M. F., Cutri, R. M., Stiening, R., et al. 2006, AJ, 131, 1163, doi: 10.1086/498708
- Stinson et al. (2013) Stinson, G. S., Brook, C., Macciò, A. V., et al. 2013, MNRAS, 428, 129, doi: 10.1093/mnras/sts028
- Strömgren (1939) Strömgren, B. 1939, ApJ, 89, 526, doi: 10.1086/144074
- Tanaka et al. (2017) Tanaka, K. E. I., Tan, J. C., & Zhang, Y. 2017, ApJ, 835, 32, doi: 10.3847/1538-4357/835/1/32
- Tanaka et al. (2018) Tanaka, K. E. I., Tan, J. C., Zhang, Y., & Hosokawa, T. 2018, ApJ, 861, 68, doi: 10.3847/1538-4357/aac892
- Tremblin et al. (2014) Tremblin, P., Anderson, L. D., Didelon, P., et al. 2014, A&A, 568, A4, doi: 10.1051/0004-6361/201423959
- Tsujimoto et al. (2006) Tsujimoto, M., Hosokawa, T., Feigelson, E. D., Getman, K. V., & Broos, P. S. 2006, ApJ, 653, 409, doi: 10.1086/507439
- Ulrich (1976) Ulrich, R. K. 1976, ApJ, 210, 377, doi: 10.1086/154840
- Urquhart et al. (2013) Urquhart, J. S., Thompson, M. A., Moore, T. J. T., et al. 2013, MNRAS, 435, 400, doi: 10.1093/mnras/stt1310
- Usero et al. (2015) Usero, A., Leroy, A. K., Walter, F., et al. 2015, AJ, 150, 115, doi: 10.1088/0004-6256/150/4/115
- Utomo et al. (2018) Utomo, D., Sun, J., Leroy, A. K., et al. 2018, ApJ, 861, L18, doi: 10.3847/2041-8213/aacf8f
- van Hoof et al. (2014) van Hoof, P. A. M., Williams, R. J. R., Volk, K., et al. 2014, MNRAS, 444, 420, doi: 10.1093/mnras/stu1438
- Vutisalchavakul et al. (2016) Vutisalchavakul, N., Evans, II, N. J., & Heyer, M. 2016, ApJ, 831, 73, doi: 10.3847/0004-637X/831/1/73
- Whitworth (1979) Whitworth, A. 1979, MNRAS, 186, 59, doi: 10.1093/mnras/186.1.59
- Xu et al. (2019) Xu, J.-L., Zavagno, A., Yu, N., et al. 2019, A&A, 627, A27, doi: 10.1051/0004-6361/201935024
- Zuckerman & Evans (1974) Zuckerman, B., & Evans, II, N. J. 1974, ApJ, 192, L149, doi: 10.1086/181613