Origin of Weak Mg II and Higher Ionization Absorption Lines in an Outflow from an Intermediate-Redshift Dwarf Satellite Galaxy
Abstract
Observations at intermediate redshifts reveal the presence of numerous, compact, weak Mgii absorbers with near to super-solar metallicities, often surrounded by more extended regions that produce Civ and/or Ovi absorption in the circumgalactic medium at large impact parameters from luminous galaxies. Their origin and nature remains unclear. We hypothesize that undetected, satellite dwarf galaxies are responsible for producing some of these weak Mgii absorbers. We test our hypothesis using gas dynamical simulations of galactic outflows from a dwarf satellite galaxy with a halo mass of M⊙, which could form in a larger halo at , to study the gas interaction in the halo. We find that thin, filamentary, weak Mgii absorbers are produced in two stages: 1) when shocked core collapse supernova (SNII) enriched gas descending in a galactic fountain gets shock compressed by upward flows driven by subsequent SNIIs and cools (phase 1), and later, 2) during an outflow driven by Type Ia supernovae that shocks and sweeps up pervasive SNII enriched gas, which then cools (phase 2). The width of the filaments and fragments are pc, and the smallest ones cannot be resolved at 12.8 pc resolution. The Mgii absorbers in our simulations are continuously generated for Myr by shocks and cooling, though each cloud survives for only Myr. Their metallicity is 10–20% solar metallicity and column density is cm-2. They are also surrounded by larger (0.5–1 kpc) Civ absorbers that seem to survive longer. In addition, larger-scale ( kpc) Civ and Ovi clouds are produced in both expanding and shocked SNII enriched gas which is photoionized by the UV metagalactic radiation at intermediate redshift. Our simulation highlights the possibility of dwarf galactic outflows producing highly enriched multiphase gas.
1 Introduction
Galactic outflows appear to regulate the structure and evolution of galaxies, as they heat, ionize, and chemically enrich the surrounding circumgalactic medium (CGM) and even drive unbound winds that can reach the intergalactic medium (IGM) (see e.g. Somerville & Davé, 2015; Heckman, 2017, for reviews). A robust understanding of the stellar feedback processes driving these outflows, however, remains elusive. The observed properties of the outflows and outflow-CGM interaction at multiple wavelengths must be used to constrain theoretical models of the physics governing the outflows and outflow-CGM interaction. The most prominent observed properties are metal absorption lines, seen in the spectra of background quasars, that are believed to arise from inhomogeneities in the CGM. Numerical simulations are required to predict and interpret the observational signatures of these systems (e.g. Oppenheimer et al., 2012; Suresh et al., 2015; Keating et al., 2016; Turner et al., 2017; Oppenheimer et al., 2018; Peeples et al., 2019).
The derived metallicities of weak, low ionization absorbers are almost always greater than 10 solar and are often as high or even higher than the solar value. Some of them are even iron-enhanced compared with solar (Rigby et al., 2002; Charlton et al., 2003; Narayanan et al., 2008; Misawa et al., 2008; Lynch & Charlton, 2007). In addition, analyses of low-redshift absorbers show that there are fewer absorbers at present than in the past, and that most absorbers seem to live in group environments (Muzahid et al., 2017). With all the measured properties above, it is plausible to speculate that weak absorbers are created by transient processes, such as galactic outflows that carry metals and are less active in the modern Universe. The outflows may originate in satellite dwarf galaxies hosted by a larger halo that are too dim to be observed.
The covering fraction of the weak absorbers is estimated to be in the CGM of galaxies brighter than 0.001L∗(Narayanan et al., 2008; Muzahid et al., 2017). There would be on the order of a million tiny, weak absorbers per galaxy if a spherical geometry were assumed (Rigby et al., 2002). It has been argued, however, that weak absorbers reside instead in filamentary and sheet-like structures (Milutinovic et al., 2006).
Many of these systems show absorption by multiple high ionization species at the same velocity, often with additional components offset by 5-150 km s-1 (Milutinovic et al., 2006). Civ surveys at z in the environments of sub-Lyman Limit Systems (sLLS) suggest that Civ clouds are more diffuse (n to cm-3) and larger than Mgii clouds, with sizes between 0.1 kpc and 10 kpc (Simcoe et al., 2004; Schaye et al., 2007; Lehner et al., 2016). Some of Civ clouds may have expanded from denser, more compact Mgii clouds (Schaye et al., 2007). These Civ systems may be interpreted as being in photoionization equilibrium at T, and their metallicities are found to be solar to even solar or more (Simcoe et al., 2004; Schaye et al., 2007; Lehner et al., 2016). There are also many Ovi absorption systems, which are more likely to have an origin in photoionized gas (rather than collisionally ionized gas) at z2 due to the greater intensity of the EBR. The detections of Ovi by Turner et al. (2014, 2015), however, suggest the presence of a collisionally ionized gas phase for impact parameters 100 proper kpc (pkpc) of large, star-forming galaxies at z.
In this paper, we test our hypothesis that galactic outflows from satellite dwarf galaxies, too dim to detect in the halo of a larger L∗ galaxy, produce compact weak Mgii absorbers surrounded by larger regions that produce Civ and Ovi absorption. Using a small-scale hydrodynamical simulation of a dwarf galaxy, we find such structures are produced by repeated shocks and radiative cooling in the gaseous halo of the galaxy. We will highlight important physical processes at work which regulate the production of low and high ionization clouds, to be explored in larger-scale simulations in the next paper. We describe our numerical method in Section 2 and the dynamics of SNII and SNIa driven outflows and their interaction with surrounding gas, including the production of dense clumps and filaments, in Section 3. In Section 4, we study the distributions of weak Mgii absorbers and surrounding Civ and Ovi absorbers in our simulation, and compare them to the properties of observed systems, followed by a resolution study (Section 5) and a summary (Section 6).
2 Numerical Method
We use the adaptive mesh refinement hydrodynamics code Enzo (Bryan et al., 2014) to simulate repeated supernova explosions in the disk of a dwarf galaxy. We solve the equations of hydrodynamics using a direct-Eulerian piecewise parabolic method (Colella & Woodward, 1984; Bryan et al., 2014) and a two-shock approximate Riemann solver with progressive fallback to more diffusive Riemann solvers in the event that higher order methods produce negative densities or energies. Our simulation box has dimensions () = (6.5536, 6.5536, 32.768) kpc, initially with (32, 32, 160) cells. Only half the galactic disk above its midplane is simulated. We refine cells to resolve shocks with a standard minimum pressure jump condition (Colella & Woodward, 1984) and to resolve cooling at turbulent interfaces where the sound crossing time exceeds the cooling time. We use 4 refinement levels resulting in a highest resolution of 12.8 pc (standard simulation). We also ran the same simulation with 3 refinement levels as a comparative resolution study (low-res simulation), and by applying 6 refinement levels in a region where Mgii filaments form in order to test the effects of resolution on fragmentation (high-res zoom simulation). We assume a flat CDM cosmology with the 2018 Planck Collaboration measured parameters , , , and (Aghanim et al., 2019).
2.1 Galaxy Model
We model a dwarf galaxy at redshift with a halo mass M⊙, and a virial radius kpc. This model has a disk gas mass, M⊙. We adopt a Burkert (1995) dark matter potential with a core radius pc and central density g cm-3, although this potential profile is a fit to the observed rotation curves of nearby dwarf galaxies rather than those at z=2. Our choice of and ensures that the resulting potential profile reproduces a Navarro et al. (1997) dark matter potential with for the same dwarf halo at pc. The gas is described as a softened exponential disk:
| (1) |
where is the total mass of gas in the disk, and and are the radial and vertical gas disk scale heights (Tonnsen & Bryan, 2009). We chose pc based on the exponential disk approximation of Mo et al. (1998), with , and pc based on the thin disk approximation (Toomre, 1963) with an effective sound speed, km s-1 (Fujita et al., 2009). Given this gas density distribution in the disk, the gas temperature and pressure are calculated to maintain the disk in hydrostatic equilibrium with the surrounding halo potential in the -direction, and the rotational velocity of the gas disk is set to balance the radial gravitational force and the pressure gradient. The disk temperature varies between K and a few K, and the maximum circular velocity is km s-1 with the escape velocity from the potential km s-1. Our model galaxy is placed in a static halo background with g cm-3 so that the gas mass within the virial radius is M. The metallicity of all the gas in the box is initially set at with mean molecular weight .
2.2 Cooling
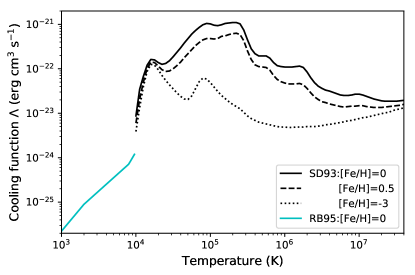
Figure 1 shows the cooling curves used in our simulations. We use radiative cooling curves as a function of temperature above K for gas in collisional ionization equilibrium (CIE) with various metallicities: [Fe/H]=-3, -2, -1.5, -1, -0.5, 0, +0.5 (Sutherland & Dopita, 1993). A radiative cooling rate for gas in a cell with a metallicity is computed by interpolating between the cooling curves. Cooling of gas below temperature K is approximated with the cooling curve of Rose & Bregman (1995) computed for solar metallicity. Although, for example, Maio et al. (2007) shows that the cooling rate stays approximately the same between and K for gas with a metallicity below , we justify the simplification below K by noting that cooling below K has a negligible effect on the formation and fragmentation of dense clouds as cooling in shocked gas and turbulent mixing layers is limited by numerical resolution rather than by radiative cooling (Fujita et al., 2009; Gronke & Oh, 2018, 2020). We justify CIE assumption because past simulations show that the effects of non-equilibrium ionization (NEI) do not much boost high ion distributions even in shocked coronal gas (Kwak & Shelton, 2010; Armillotto et al., 2016; Cottle et al., 2018). We do not include the effects of a metagalactic UV background radiation in our simulation, but we incorporate them when we post-process the simulations to compute the ion distributions (see Sect. 4). The modification of the ionization fraction by a UV background would affect only the lower density gas that does not dominate the cooling.
2.3 Starburst
In our study, we set up an instantaneous starburst of total stellar mass M⊙ at the disk center. We use Stellar Yields for Galactic Modeling Applications (SYGMA Ritter et al., 2018) to model the chemical ejecta and feedback from simple stellar populations (SSPs). SYGMA is part of the open-source chemical evolution NuGrid framework (NuPyCEE222http://www.nugridstars.org). We compute the average mechanical luminosities and the average metal ejection rates for M M⊙. They are erg s-1 and M⊙ yr-1 for the initial 40 Myr, which is the lifetime of the smallest B star to go core collapse Type II supernova (SNII), and erg s-1 and M⊙ yr-1 at times Myr powered by Type Ia supernovae (SNIa). The metals produced by SNII and SNIa are followed and advected separately.
To drive a constant-luminosity outflow, during every time step
we add mass () and
energy ( and ) to a spherical source
region with a radius of 102.4 pc. We choose to increase the amount of
mass added from the SYGMA values to ensure that the temperature of hot gas in the
outflows is K, which is far from the peak of the
cooling curve at K, but well below the value implied by
only accounting for the ejecta. This additional mass accounts for
the mass evaporated off the swept-up shells in the absence of an
implementation of thermal heat conduction. Therefore, we use M⊙ yr-1 for the SNII driven
outflow and M⊙ yr-1 for the SNIa
driven outflow. The total mass added for 1 Gyr
is only M⊙ which is less than 1 of
Mdisk.
2.4 Ion Analysis
We use the TRIDENT analysis tool (Hummels et al., 2017) to calculate the ionization fractions of the species of interest based on the cell-by-cell density, temperature, and metallicity. First, the estimation for the number density of an element X is
| (2) |
where Z is the metallicity from the simulation, and is the solar abundance by number. Ionization fractions are pre-calculated over a grid of temperature, density, and redshift in photoionization equilibrium (PIE) with the metagalactic UV background radiation by Haardt & Madau (2012), using the photoionization software CLOUDY (Ferland et al., 2013). Thus by linearly interpolating over the pre-calculated grid, TRIDENT returns the density of an ion, i, of an element, X as
| (3) |
where is the ionization fraction of the ith ion.
To generate an absorption profile along a ray through the simulation box, the absorption produced by each grid cell is represented by a single Voigt profile at its instantaneous velocity , with a Doppler parameter specified by the temperature in the cell.
3 Results
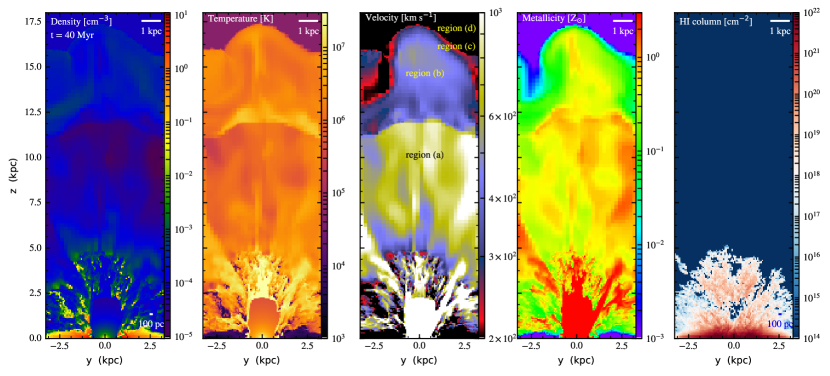
Figure 2 shows density, temperature, total velocity, and metallicity slices along the y-z plane at the disk center and a neutral hydrogen (HI) column density distribution along axis in the - plane at t=40 Myr. The HI distribution is calculated with Trident.
The swept-up shell driven by repeated SNII explosions cools quickly due to its high density. Because it is expanding into a stratified atmosphere, it accelerates and fragments into multiple clumps and shells due to the Rayleigh-Taylor (RT) instability. Figure 2 shows that the hot, thermalized interior gas expands freely through the fragments, forming a supersonic, energy-driven outflow. Kelvin-Helmholtz instabilities ablate the sides of these fragments as the hot gas streams past them. This outflow continues to shock the CGM, and a classic superbubble (Weaver et al., 1977) forms in the CGM, as seen in Figure 2: region (a) expanding SNII enriched gas at v400–1000 km s-1, region (b) shocked SNII enriched gas, region (c) swept-up CGM shell which is very thin and light because there is not much to sweep due to its low density, and region (d) the ambient CGM beyond the outer shock front at z17 kpc. Expanding SNII enriched gas and shocked SNII enriched gas are divided at the inner shock front at z12 kpc, and shocked SNII enriched gas extends out to a contact discontinuity with the CGM.
In our simulations, the high-density, low-temperature fragments of swept-up ISM material are not resolved after Myr with our refinement criteria of strong pressure gradients or the sound crossing time exceeding the cooling time. They are Lyman Limit Systems (LLSs) and sub-Damped Lyman-alpha Absorbers (DLAs) with cm-2 that will likely produce strong Mgii absorbers (see rightmost figure in Figure 2). The focus of this study is instead on weak Mgii absorbers that are observed to be associated with sub-LLSs with cm-2. These unresolved swept-up ISM fragments in the outflow quickly mix with the surrounding hot, metal enriched gas, but the total amount of disk gas mixed in the outflow is only 3–5 of the disk mass initially placed on the grid. We also note that the powerful SNII driven outflow leaves the box starting at Myr; by to 300 Myr, 38% to 58% of the metal-carrying gas has left the box.
After the last SNII goes off at Myr, SNIa’s drive the outflow, but with a mechanical luminosity that is more than two orders of magnitude smaller. SNIa-enriched gas expands at km s-1 through the tunnel created by the previous SNII outflow, but by Myr the disk gas being pushed aside by the SNII outflow flows back to the central source region, blocking the passage for SNIa-enriched gas. Meanwhile, the shocked SNII-enriched gas (region b) near the inner shock front ( kpc) begins to descend toward the disk, while the outer shock front (the outer edge of region c) keeps moving at km s-1 in the CGM and soon leaves the box. By Myr, descending shocked SNII enriched gas accumulates at the inner shock front and cools to form denser, cool shells that eventually fragment by RT instability.
The sliced density distribution in the - plane at kpc from the disk center at Myr (left in Figure 3) shows the formation of such fragments in the form of clumps and filaments. They are also visible as clumps and filaments in a projected distribution of neutral hydrogen along the -axis at Myr (left in Figure 4). These clumps and filaments will potentially produce weak Mgii absorbers (we discuss our ion analysis in the next section). We call this process phase 1 formation. They are made of SNII enriched outflow gas and their metallicity is –. The size of clumps and the thickness of filaments are 100 pc. This size may be limited by our numerical resolution of 12.8 pc (Fujita et al., 2009; Gronke & Oh, 2018). We discuss the effects of resolution further in Sec. 5.
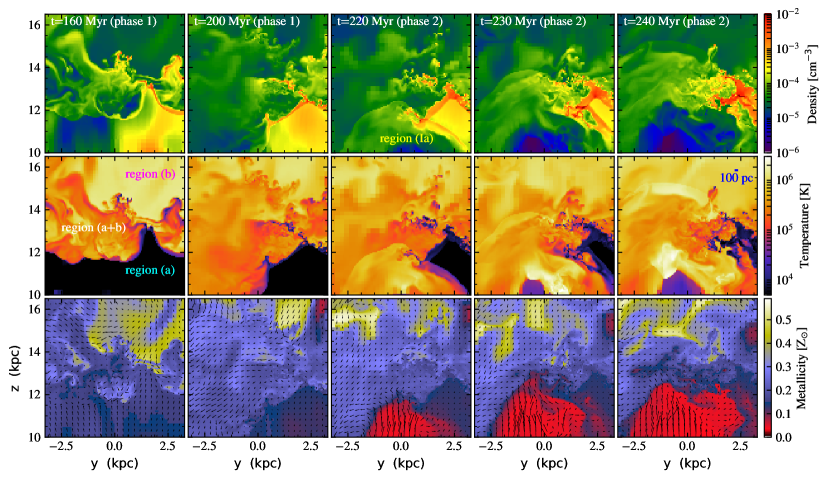
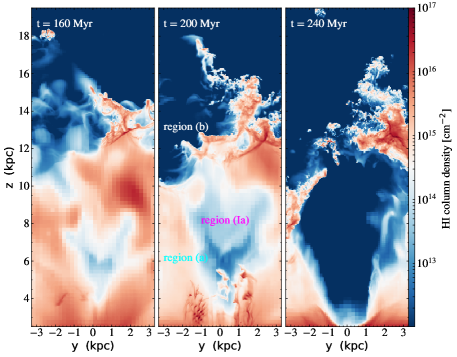
Shortly after Myr, a superbubble created by repeated SNIa explosions blows out of the dense ISM and SNIa enriched gas regains a tunnel for expansion, forming a SNIa driven outflow traveling at –500 km s-1. In the projected distribution of neutral hydrogen at Myr (middle panel in Fig. 4), fragments of swept-up ISM after blowout are visible framing a tunnel for outflow, and hot, low-density SNIa enriched gas in the outflow is seen as a cavity with cm-2 (we define SNIa enriched gas as region Ia).
By Myr, this SNIa driven outflow (region Ia) expands into the cooled SNII enriched gas and the clumps and filaments of shocked SNII enriched gas (region b), shocking and sweeping them and forming more clumps and filaments. Figure 3 shows such a process clearly in a selected region at kpc. These are potential candidates for weak Mgii absorbers, too: we call this process phase 2 formation. Their metallicity and size are likewise – and 100 pc. Hotter and lower-density shocked SNII enriched gas carries more metals (–) and lies above kpc.
The SNIa driven outflow continues to shock and sweep gas as well as clumps and filaments to the sides, and by Myr, all the clumps and filaments as well as 58% of SNII outflow gas and 8% of SNIa outflow gas have left the box. Then, there is only very low-density gas with n cm-3 left above the disk in the box. The metallicity of SNIa enriched gas is as the metal production rate is about two orders of magnitude smaller than that of SNII, so it is still too early for any significant enrichment by SNIa. We stopped computing at Myr.
With a realistic star formation history with multiple star clusters scattered in time and place, we expect phase 1 and phase 2 formation to be repeated in time and place to produce more clumps and filaments. We will test this scenario in a larger simulation box in our next paper.
4 Weak Mgii Absorbers and Civ/Ovi absorbers
We calculate the fractions of Hi, Hii, Mgii, Civ, and Ovi ions using Trident as described in Section 2.4 by assuming all the gas in our simulation to be in photoionization equilibrium (PIE) with the UVB radiation at a given redshift (Haardt & Madau, 2012). Our simulation does not include the effects of UVB radiation, so for example, expanding SNII enriched gas tends to overcool to lower temperature, K. However, this overcooled, low-density ( cm-3) gas contributes very little to the total ion budgets, and denser clouds that produce Mgii absorbers are self-shielded to the surrounding UVB radiation as long as n cm-3 at z=2 (Rahmati et al., 2013). Thus overcooling will not significantly affect our analysis (see Appendix).
4.1 Overview
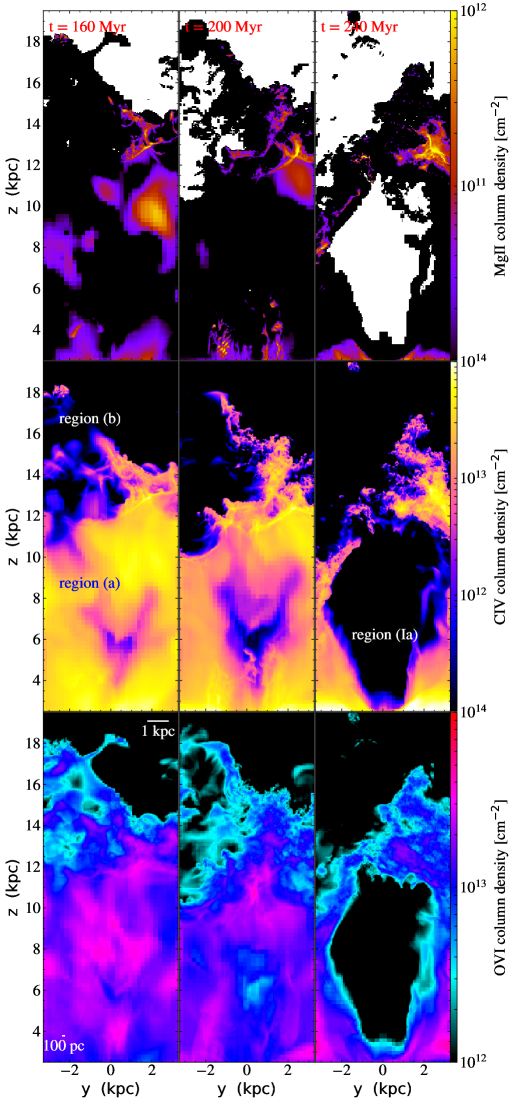
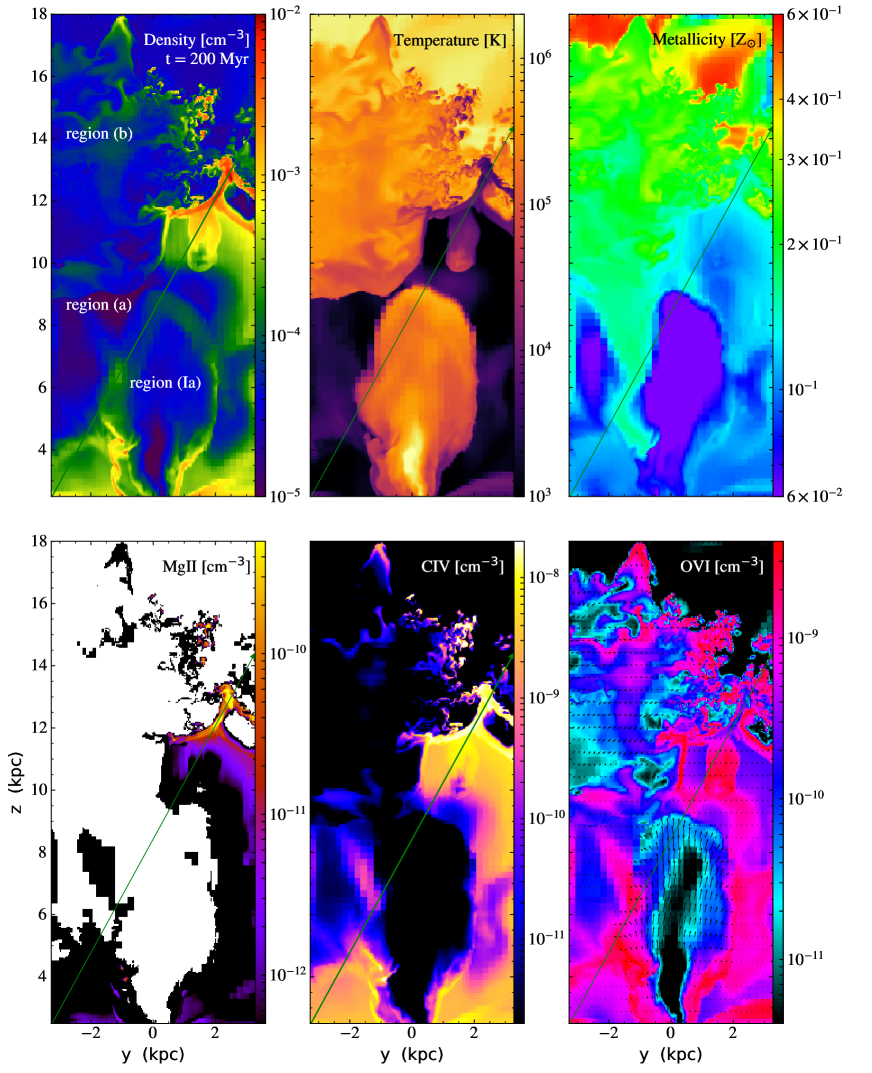
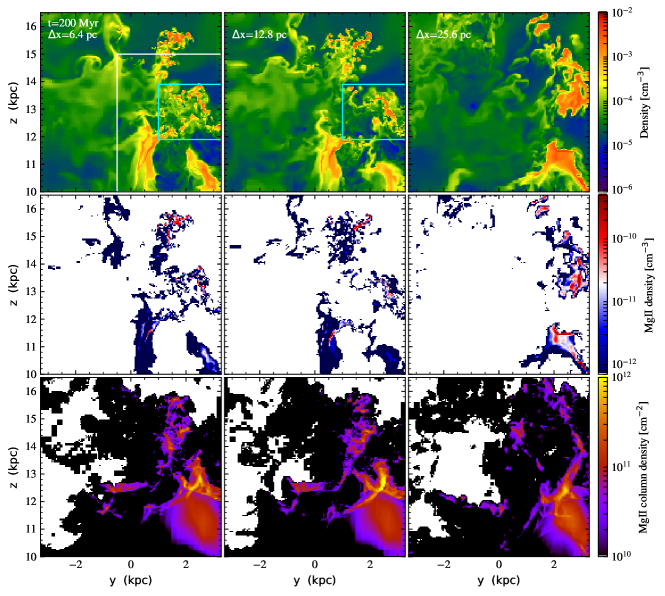
Figure 5 shows projected density distributions of Mgii, Cvi, and Ovi ions along the x-axis in the y-z plane at t=160, 200, and 240 Myr, and Figure 6 shows sliced density, temperature, metallicity, Mgii, Cvi, and Ovi ion density distributions at x=+1.92 kpc from the disk center in the y-z plane at t=200 Myr. This sight line was selected as an example with a large pathlength through low ionization gas.
The clumps and filaments have hydrogen number densities, n to cm-3, and their sizes/thickness, 100 pc, which is the smallest scale our simulation can resolve, as discussed in Section 3. Individual weak Mgii absorbers seem to survive for Myr, before they are mixed and diluted with the surrounding, warmer, lower-density gas, but they are continuously produced through phase 1 to phase 2 formation for over 150 Myr from a single instantaneous starburst source. Weak Mgii absorption with cm-2 is also found in a blob of gas that carries a swept-up ISM shell fragment in the expanding SNII enriched gas seen at e.g. [y,z]=[+2 kpc, 10 kpc] (see top left figure in Figure 5) and in fragmented shells of ISM swept-up by the SNIa driven outflow at e.g. z=2–4 kpc (see top middle figure in Figure 5). The blob has cooled slowly without fragmentation, and its size is kpc. It is expanding into the phase 1 shells in region (b) above, but SNIa driven outflow will shock and sweep up expanding SNII enriched gas including the blob in region (a) and the phase 1 shells in region (b) to produce phase 2 shells and fragments (see top right figure in Figure 5).
Higher ion absorbers are found in region (a) where expanding SNII enriched gas cools and in region (b) where shocked SNII enriched gas cools in phase 1 and phase 2. In both cases, the hydrogen number density of the absorbers is na few cm-3, but the absorbers in region (a) extend over 1-4 kpc while the absorbers in region (b) are smaller, 500 pc–1 kpc. The sizes of high ion absorbers agree with the observed estimates for Civ absorbers by Misawa et al. (2008) and Schaye et al. (2007). They are 100 pc - 5 kpc in a sub-LLS ( cm-2) or Ly forest environment ( cm-2).
Civ absorbers in region (b) are clumpy and filamentary and some surround weak Mgii absorbers, so both of them arise from the same clumps and filaments created in phase 1 and phase 2 formation. However, Civ ions in these clumps and filaments survive longer than Mgii ions by another 20-30 Myr. Our simulations suggest clouds that produce Mgii absorbers also produce Civ absorbers, and Mgii absorbers probe the densest parts of the clouds while Civ absorbers extend out to more diffuse, larger regions. In the process of mixing, the regions that produce Mgii absorption disappear first due to dilution, so our simulations agree with a picture proposed by Schaye et al. (2007) that expanding Mgii absorbers with high metallicity (ZZ⊙) produce Civ absorbers.
Ovi absorbers in region (b) appear even more diffuse, arising in larger ( kpc) clouds, that are not necessarily the same clouds that host Mgii and Civ clouds nor in the same phase. On the other hand, most Ovi absorbers in region (a) arise from the same clouds that host Civ absorbers in the same phase.
We find that 1-3 of high ions by mass are from collisional ionization, and they are found in coronal Ovi absorbers in region (b). This is consistent with observational analyses that photoionization dominates in sub-LLS and Ly forest environments at intermediate to high redshift. (e.g. Simcoe et al., 2004; Schaye et al., 2007; Lehner et al., 2016).
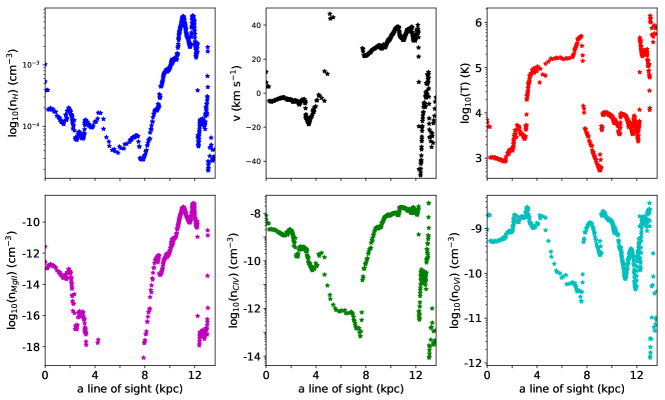
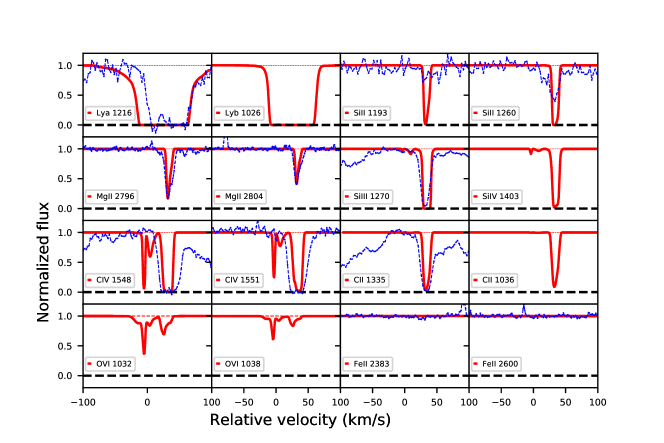
Figure 7 shows physical values along a line of sight through the simulation box, which is noted in green in Figure 6, and Figure 8 shows mock spectra created along the sightline with Trident. Along the sightline, there are two Mgii absorbers which correspond to two peaks in Figure 6 and in the bottom left plot of Figure 7. They are shocked cooling shells in region (b) and are only separated by a small velocity in the spectrum, despite their spatial separation (v2 km s-1 at v38 km s-1), which is visible in the absorption profile as a slight asymmetry(Figure 8).
The same shells produce Civ absorption, but no Ovi absopbtion. Ovi absorbers in region (b) are in a different, coronal phase. Civ absorbers in region (a) are few kpc in size: one is at z2.5 kpc with a positive velocity (v10 km s-1), one is at z2.5-4 kpc with a nagative velocity (v-5 km s-1), one is at z10–11 kpc (cooler, v30 km s-1) and the other is at z11–12 kpc (warmer, v40 km s-1), both below the cooling shell (v38 km s-1). The first two absorbers produce the double absorption profiles in Figure 8, and the last two absorbers produce the saturated absorption profile at v=20–45 km s-1, together with Civ absorbers in region (b).
Ovi absorbers in region (a) arise from the same cold clouds, producing two sets of double absorption profiles, but the sightline is also going through a turbulent mixing layervof swept-up shells by the SNIa driven outflow at z=5–7 kpc. Its temperature is 105 K. The signal is buried in the double absorption profiles at v10 km s-1. The Ovi absorber in region (b) is coronal and turbulent with v-10–40 km s-1, but is weak compared with the other Ovi absorbers.
We note that some SNII outflow gas in region a cools to temperature below K by t200 Myr, however, this overcooled, low-density ( cm-3) gas only makes a little contribution to Civ and Ovi column column densities (see Appendix).
4.2 Comparison to observations
4.2.1 Column densities and metallicities
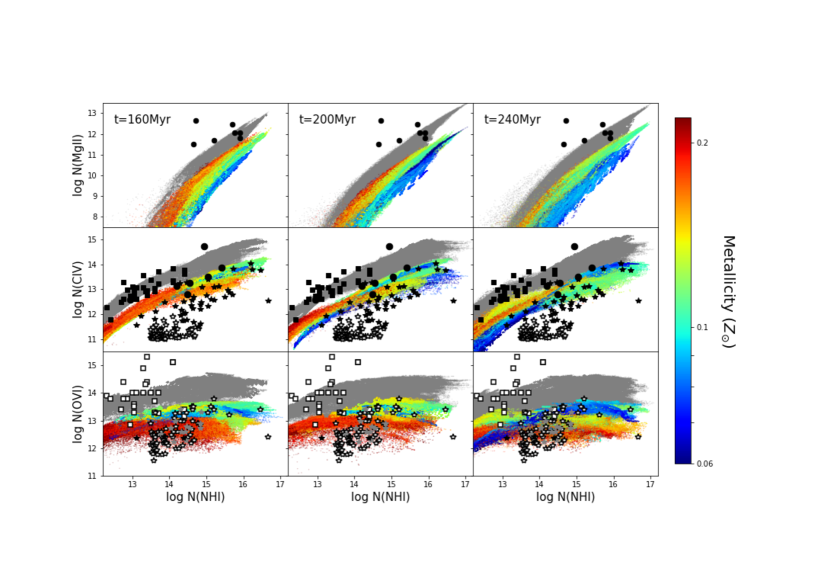
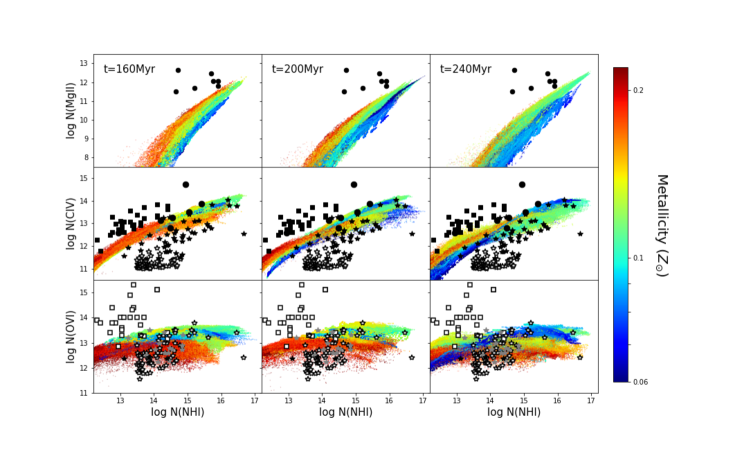
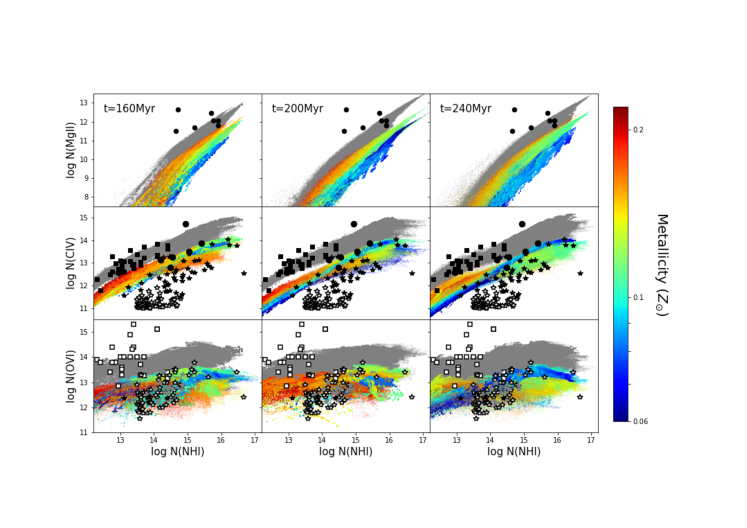
In Figure 9, we show the relations between ion column densities and HI column densities in our simulation at t=160, 200, and 240 Myr in sightlines parallel to each of the three cardinal axes, and compare them with the observed relations. The colors indicate Mgii, Civ, and Ovi density weighted metallicities respectively. Effective lower limits to the Mgii, Civ, and Ovi column densities are , , and cm-2 in our simulations. Mgii, Civ, and Ovi absorbers in our simulation are enriched to Z=0.1-0.2 Z⊙ by SNII from an instantaneous starburst, as the SNIa contribution is negligible at this point.
Top figures in Figure 9 show that sightlines with higher metallicities have higher Mgii column densities at given HI column densities, and they are compared to the Mgii-HI observations from three Mgii absorbers at z from Misawa et al. (2008) and four Mgii absorbers at lower redshift (z=0.65-0.91) from Charlton et al. (2003) and Ding et al. (2005). The Mgii column densities in our simulation are up to 1 order of magnitude smaller than the observed values at the given HI column densities, cm-2 (i.e. sub-LLS). This is mainly because our simulation can only be run up to Myr before most gas leaves the grid: metal mixing and cooling should be computed for a much longer duration, also including the SNIa metal contribution. Moreover, we set the initial metallicity of our dwarf disk and halo gas to be Z= Z⊙, to study the effects of metal contribution by our simulated starburst alone. Thus, we are likely underestimating the metallicities of Mgii absorbers. If we assume that all the gas in our simulation box has a solar metallicity, the boosted Mgii column densities (grey points in Figure 9) agree more with the observed values.
At lower cm-2(i.e. sub-LLS to Ly forest), there is no dense cloud formation in our simulation thus no Mgii clouds with cm-2. There are two Mgii absorbers with cm-2 at z2 (Misawa et al., 2008) and their Mgii column densities are larger than predicted by our simulations for sightlines with this by two orders of magnitude. This might also be due to lower metal enrichment in our simulation. The estimated metallicities for the two absorbers are very high, Z=0.63-0.79 and even super solar, Z Z⊙ respectively. This discrepancy could also be related to the limited simulation resolution. We hope to study the possible formation of super solar, weak Mgii clouds with our future global simulations.
Simulated Civ column density distributions appear to agree better with the observed column densities of Civ absorbers that are found in the same sightlines with the Mgii absorbers studied by Misawa et al. (2008). These Civ absorbers are in sub-LLS environments, and have similar metallicities, Z=0.1-0.3 Z⊙ to our simulation values, except for one absorber with Z=0.8 Z⊙: this metal rich Civ absorber is in a structure related to the super solar, weak Mgii absorber with Z Z⊙.
On the other hand, our simulated Civ column densities are smaller than those of the Civ absorbers studied by Schaye et al. (2007): the disagreement is by an order of magnitude. This is probably because these absorbers are selected for the high metallicities, Z Z⊙. They are found in Ly forest environments and are smaller in size (500 pc – 1 kpc). In our simulation, smaller Civ clouds are found in region (b) and arise from the same clouds that currently host or used to host even smaller, weak Mgii absorbers in sub-LLS to Ly forest environments. Our metallicity boosted values better agree with the observations (Figure 9). The upper limits for Ovi column densities associated with the observed Civ absorbers (Schaye et al., 2007) are also above what our simulation predicts, and lie in the metallicity boosted grey area, just like most of the observed weak Mgii and Civ absorbers. There is no other information about their physical properties available.
The observed Civ column densities by D’Odorico et al. (2016) appear to agree with our simulated values at cm-2, however, they are much lower than our simulated values, by up to one order of magnitude, at cm-2. These Civ absorbers are observed at a higher redshift, z, and the majority of them have their estimated metallicities between Z⊙ and Z⊙, much lower than our simulated values. There is no information about the physical properties available for the Civ and Ovi absorbers observed by D’Odorico et al. (2016). The data for Ovi column densities are mostly upper limits except three detections of which one shows a very weak Civ line and another shows none. Out of 15 Ovi possible detections with single lines, six of them do not show an associated Civ line. Despite the estimated low metal contents, the observed Ovi column densities and their upper limits appear to agree better with our simulated values at all HI environments. The sizes and thermal properties are unknown for these Civ and Ovi absorbers.
We note that the observed estimates and upper limits for Civ and Ovi column densities at given HI column densities vary over 4 orders of magnitudes. This may be due to the presence of HI dominated gas in observed sightlines which originate in regions that are not covered by our simulations. However, for Mgii absorbes and associated Civ absorbers, a major reason for the discrepancy seems to be a lack of metal enrichment as well as the low initial metallicity of disk and halo gas in our simulation. We speculate that galactic outflows from repeated bursts of star formation for a longer duration ( Gyr) will eventually create high-metallicity, complex structures of multiphase gas.
4.2.2 Covering fractions
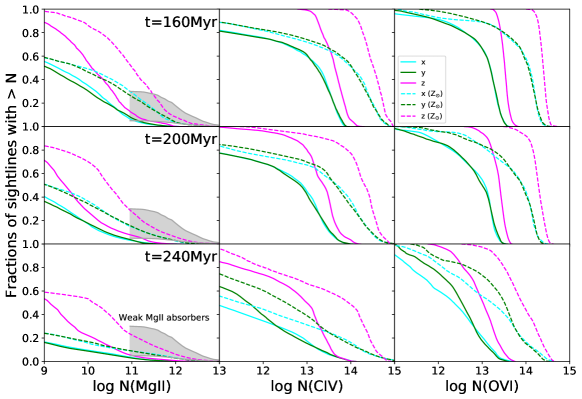
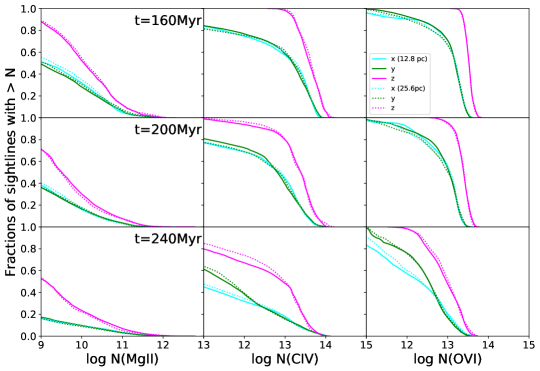
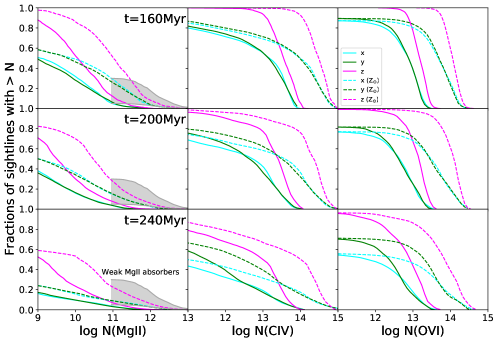
Figure 10 shows fractions of sight lines that occupy our simulation box above the galactic disk and within the virial radius as functions of Mgii, Civ, and Ovi column densities along x, y, an z axes at three different times. The Grey region in Figure 10 depicts predicted fractions of sight lines as a function of column densities of the observed weak Mgii absorbers at various redshifts by Rigby et al. (2002); Charlton et al. (2003); Ding et al. (2005); Misawa et al. (2008); Narayanan et al. (2008), based on an assumption that they cover of a halo. The total covering fraction of weak Mgii absorbers in L∗ galactic haloes is estimated to be by Narayanan et al. (2008); Muzahid et al. (2017). If a sightline goes through N dwarf satellite galaxies, the covering fraction in each dwarf halo would need to be approximately 0.3/N. We would need a similar fraction of dwarf satellite haloes to be covered with weak Mgii absorbers, if undetected, satellite dwarf galaxies are responsible for producing weak Mgii absorbers in a L∗ halo.
Weak Mgii absorbers with column densities greater than the observed minimum, cm-2 occupy about only of the dwarf halo in our simulation. However, this is a lower limit for the covering fraction because of SNII outflow gas leaves the box by Myr. Boosting the metallicities of all the gas to 1 Z⊙ (see dashed lines in Figure 10) raises the fractions of sight lines with cm-2 to , but there is still a deficiency of Mgii clouds with higher column densities, cm-2. Most observed weak Mgii absorbers have column densities cm-2. As we argued in the previous section, repeated bursts of star formation will likely create more clumps and filaments, like the brightest structures in Figure 5, through cycles of phase 1 and phase 2 formation. Then, a larger fraction of the dwarf galaxy halo may be covered with moderately dense Mgii absorbers. However, the formation of denser, high column density, weak Mgii clouds may require other mechanisms that involve more gas and more metals with stronger shocks, as the shell density scales like the square of the Mach number in the isothermal shocks expected, so more powerful outflows may be responsible for the higher column density Mgii absorbers. In addition, interaction of outflows with cosmological infall will likely produce stronger shocks, so possibly denser clouds. Note we have a static background in our simulations. However, cooling is strongly limited by numerical resolution, so gas behind isothermal shocks will not cool to the theoretical density (n) even with 0.2 pc resolution Fujita et al. (2009).
We can estimate the number density of weak Mgii absorbers per unit comoving path length to be 0.21 assuming for cm-2 when metallicity is boosted to Z=Z⊙, 1.13 Mpc-3 for halo comoving number density with Mhalo at z=2 (Murray et al., 2013), and () kpc2 for halo proper cross section. This yields a value comparable to at z found by Narayanan et al. (2008) and at z=2.34 by Codoreanu et al. (2018). Likewise, the number density of high ionization clouds (Civ and Ovi) per unit comoving path length is estimated to be with . As a reference, it is at z 3 based on Figure 6 of D’Odorico et al. (2016), which includes all CIV systems along a line of sight, not necessarily only those confined to the CGM of galaxies. The covering fractions of Civ and Ovi ions are measured to be 0.3-0.8 at impact parameters pMpc around star-forming galaxies at z2.4 (Turner et al., 2014). It is interesting to note that the comoving Mgii mass density seems to increase nearly a factor of 10 from z=2.34 to z=4.77 (Codoreanu et al., 2018) with a large number of weak Mgii absorbers even up to z7 (Bosman et al., 2017). This high incidence of Mgii absorbers suggests that they are associated with dwarf galaxies, including smaller, numerous galaxies during the epoch of reionization, and the presence of the abundant weak Mgii absorbers must be explained without more powerful outflows from larger galaxies.
We assess this as follows: 1) a SNII driven outflow is launched from a star cluster every 100 Myr, the time by which gas flows back to the central source region in our simulation, and it takes 50 Myr for a SNII driven outflow with v=200-400 km s-1 to reach the shocked enriched gas from previous outflows (region b). 2) SNIa drive a superbubble and an outflow after SNII stop in 50 Myr (we choose 50 instead of 40 Myr for simplicity), and it takes 100 Myr for a SNIa driven outflow to reach region (b) based on our simulation result. 3) repeated bursts last for 1 Gyr. 4) interaction from a newly launched outflow produces weak Mgii absorbers that cover 3-6 of our dwarf halo and those weak Mgii absorbers survive for at least 150 Myr based on our simulation result. Then, we estimate that the covering fraction of dwarf halos by weak Mgii absorbers will be 12-24. This number should go up once the CGM is more metal enriched, because the covering fraction of 3-6 is computed when metallicities of absorbers are Z=0.1-0.2 Z⊙. We hope to test this hypothesis with our future global simulation in a larger box with repeated bursts in time and place.
5 Resolution Study
Our standard simulation employs a highest resolution of 12.8 pc with four refinement levels, thus resolves pc structures for our purposes. We base the estimate of roughly eight cells being required to minimally resolve structures on two arguments. First, the numerical dissipation range for supersonic turbulence computed with Enzo extends over almost an order of magnitude (e.g. Kritsuk et al., 2007, Figure 5), similar to most other grid codes (Kitsionas et al., 2009). Second, modeling of a cloud in a supersonic flow shows that a radius of six zones using a second-order method is insufficient to capture fragmentation by instabilities (Mac Low & Zahnle, 1994, Figure 4).
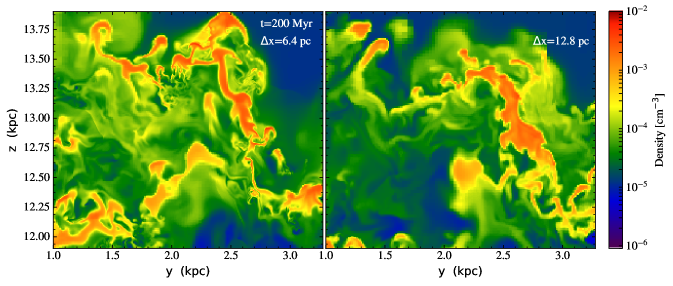
To study the extent to which the production of clumps and filaments as well as their sub-structures and fragmentation are dependent on numerical resolution, we ran the same simulation with 3 refinement levels (low-res simulation), and by applying 5 refinement levels in a region where the largest filaments form at [x,y,z]=[(-0.5 kpc, 3.28 kpc), (-0.5 kpc, 3.28 kpc), (10 kpc, 15 kpc)] (high-res zoom simulation). We only ran the high-res zoom simulation up to t=200 Myr.
Figure 11 shows phase 1 formation of filaments and clumps computed with the three different resolutions. Figure 11 compares the degrees of fragmentation in high-res zoom and our standard simulations. In the high-res zoom simulation, gas fragments into thinner filaments and smaller clouds compared with our standard simulation. The smallest structures are resolved across 8 cells, so they are 50 pc in the high-res zoom simulation compared with 100 pc in our standard simulation. These filaments and clumps will further fragment into smaller pieces with higher resolution. Gas structures seem drastically different in the low-res simulation, with much larger clouds compared with the higher resolution runs.
Despite the differences in fragmentation seen in simulations with different resolutions, there is no significant difference in projected Mgii distributions (bottom figures). We see no change in the fraction of weak Mgii absorbers with high column densities, and the covering fractions of weak Mgii absorbers as well as Civ and Ovi absorbers remain practically the same. We will add ion versus Hi column density distributions with metallicities (Figure 13) and ion covering fractions as functions of column densities (Figure 14) for the low-res simulation in the appendix.
We conclude that resolution has a small effect on the projected distribution of dense clumps and filaments, and this in turn warns us to be very careful when we interpret observations (Peeples et al., 2019). There is a possibility that, at much higher resolution filaments and fragments will further ”shatter” into pc sized cloudlets that agree with some of the observed Mgii absorbers (Gronke & Oh, 2018; McCourt et al., 2018; Gronke & Oh, 2020; Begelman, 1990), but to test this possibility requires 1/10th pc resolution in a galactic-scale simulation which is not feasible at the moment. Opposing fragmentation is possible cloud coalescence, which may be numerically challenging to reproduce in 3D simulations (Waters & Proga, 2019).
6 Summary
In this paper, we use hydrodynamical simulations of galactic outflows to explore the production of weak Mgii absorbers and Civ and Ovi absorbers in the CGM of a dwarf satellite galaxy with a halo mass of M⊙ at , expected to be hosted by a larger halo. With our standard numerical resolution of 12.8 pc, we model the formation of superbubbles and outflows from a galactic disk assuming a single instantaneous starburst in a simulation box with dimensions (6.5536, 6.5536, 32.768) kpc, and study the interaction and cooling of metal enriched outflowing gases. Although we ran the simulations only for a duration of 300 Myr, as most metal enriched gas leaves the simulation box by this time, our results highlight the possibility of dwarf galactic outflows producing transient, but continuously generated Mgii clouds as well as larger Civ and Ovi clouds in sub-LLS and Ly forest environments.
Our main findings are:
-
•
Thin, filamentary, weak Mgii absorbers are produced in two stages:
-
–
phase 1 shocked SNII enriched gas loses energy and descends toward expanding SNII enriched gas and is shocked, cools, and fragments.
-
–
phase 2 SNIa driven outflow gas shocks the SNII enriched gas as well as phase 1 shells, which then cool and fragment.
The width of the filaments and fragments are pc with our standard numerical resolution. A single Mgii cloud survives for 60 Myr, but we suggest Mgii absorbers will continuously be produced through cycles of phase 1 and phase 2 formation for Myr by repeated bursts of star formation.
-
–
-
•
Civ absorbers are produced in expanding SNII enriched gas (region a) and shocked SNII enriched gas (region b). Civ absobers in region (a) extend over 1–4 kpc and Civ absorbers in region (b) are smaller, 500 pc–1 kpc, but they are both cool and photoionized. The smaller Civ absorbers originate from the same clouds that produce weak Mgii absorbers, and they surround the dense Mgii clouds. As the clouds get destroyed and mixed with the surrounding gas, Mgii absorbers disappear first, but Civ absorbers survive for another 20–30 Myr.
-
•
Ovi absobers are also produced in expanding SNII enriched gas in region (a) and shocked SNII enriched gas in region (b). Ovi absorbers in region (a) originate from the same cool clouds that produce Civ absorbers, but Ovi absorbers in region (b) are not coincident with Mgii absorbers or Civ absorbers. Their sizes are over 1 kpc.
-
•
Civ absorbers and most Ovi absorbers are cool, photoionized clouds while Ovi absorbers arising in turbulent mixing layers in region (b) are hotter and collisionally ionized. Photoinization dominates in sub-LLS and Ly environments at intermediate redshft .
-
•
The metallicities of Mgii, Civ, and Ovi absorbers are Z=0.1–0.2 Z by t=200–300 Myr, with only one cycle of phase 1 and phase 2 formation in a dwarf disk and halo with a low initial metallicity, Z=0.001 Z. We speculate that the clouds forming in shocked outflow gas (region b) will be progressively enriched with more metals when bursts of star formation are repeated.
-
•
A lower limit for the covering fraction of weak Mgii absorbers in our dwarf halo is 3–6 because we compute only one cycle of phase 1 and phase 2 formation and more than half the metal enriched gas leaves the simulation box early. To reproduce the observed estimate for the covering fraction in a L∗ halo (30) with outflows from such galaxies alone, sightlines must go through haloes of multiple dwarf satellite galaxies. We also speculate that the covering fraction in a single dwarf halo will be boosted with repeated bursts with many cycles of phase 1 and phase 2 formation in a large simulation box that covers the entire halo.
There are two major problems in our current simulations: 1) a deficiency of weak Mgii absorbers with high column density, cm-2 and 2) low metallicity of weak Mgii absorbers.
1) The formation of denser, high column, weak Mgii absorbers may require stronger shocks with more powerful outflows and/or outflows interacting with dynamic infall. Repeated outflows shocking the clumps and filaments formed by previous outflows may also produce denser Mgii clouds. However, cooling behind shocks is limited by numerical resolution. Our resolution study shows that the sizes of filaments and fragments decrease by a factor of two with a resolution twice as high, however, the projected properties are insensitive to changes in resolution that is pc. We may need less than a pc scale resolution to address this problem.
2) The metallicity, less than solar, of our Mgii absorbers is the result of our assumption of a single instantaneous starburst and the limited duration of our simulations ( Myr) neglecting the SNIa metal contribution. Starting with a higher initial metallicity for our dwarf disk and halo gas will also alleviate the problem.
This paper nonetheless highlights the possibility of galactic outflows from invisible, dwarf satellite galaxies to produce highly enriched, multiphase gas. We hope to address the remaining problems with our next, more global simulations.
References
- Aghanim et al. (2019) Aghanim, N., Akrami, Y., & Ashdown, M. 2019, arXiv:1807.06209
- Armillotto et al. (2016) Armillotto, L., Fraternali, F., & Marinacci, F. 2016, Monthly Notices of the Royal Astronomical Society, 462, 4157
- Begelman (1990) Begelman, M. C. & Fabian, A. C. 1990, Monthly Notices of the Royal Astronomical Society, 244, 26
- Bosman et al. (2017) Bosman, S. E. I., Becker, G. D., Haehnelt, M. G., et al. 2017, Monthly Notices of the Royal Astronomical Society, 470, 1919
- Bryan et al. (2014) Bryan, G. L., Norman, M. L., O’Shea, B. W., et al. 2014, The Astrophysical Journal Supplement Series, 211, 19
- Burkert (1995) Burkert, A. 1995, Astrophysical Journal Letters, 447, L25
- Charlton et al. (2003) Charlton, J. C., Ding, J., Zonak, S. G., et al. 2003, The Astrophysical Journal, 589
- Codoreanu et al. (2018) Codoreanu, A., Ryan-Weber, E. V., Crighton, N. H., et al. 2018, Monthly Notices of the Royal Astronomical Society, 472, 1023
- Colella & Woodward (1984) Colella, P., & Woodward, P. R. 1984, Journal of Computational Physics, 54, 171
- Cottle et al. (2018) Cottle, J., Scannapieco, E., & Bruggen, M. 2018, The Astronomical Journal, 864
- Ding et al. (2005) Ding, J., Charlton, J. C., & Churchill, C. W. 2005, Astrophysical Journal, 621, 612
- D’Odorico et al. (2016) D’Odorico, V., Cupani, G., Cristiani, S., et al. 2016, Monthly Notices of the Royal Astronomical Society, 463, 2690
- Ferland et al. (2013) Ferland, G. J., Porter, R. L., van Hoof, P. A. M., et al. 2013, Revista Mexicana de Astronomía y Astrofísica, 49, 137
- Fujita et al. (2009) Fujita, A., Martin, C. L., Mac Low, M.-M., New, K. C. B., & Weaver, R. 2009, ApJ, 698, 693 (F09)
- Gronke & Oh (2018) Gronke, M., & Oh, S. P. 2018, MNRAS, 480, L111
- Gronke & Oh (2020) —. 2020, MNRAS, 494, L27
- Haardt & Madau (2012) Haardt, F., & Madau, P. 2012, The Astrophysical Journal, 746, 125
- Heckman (2017) Heckman, T. M. 2017, Book chapter for ’Handbook of Supernovae’ (arxiv:1701.09062), 47
- Hummels et al. (2017) Hummels, C. B., Smith, B. D., & Silvia, D. W. 2017, The Astrophysical Journal, 847, 17
- Keating et al. (2016) Keating, L. C., Puchwein, E., Haehnelt, M. G., Bird, S., & Bolton, J. S. 2016, Monthly Notices of the Royal Astronomical Society, 461, 606
- Kitsionas et al. (2009) Kitsionas, S., Federrath, C., Klessen, R. S., et al. 2009, Astronomy & Astrophysics, 508, 541
- Kritsuk et al. (2007) Kritsuk, A. G., Norman, M. L., Padoan, P., & Wagner, R. 2007, The Astrophysical Journal, 665, 416
- Kwak & Shelton (2010) Kwak, K., & Shelton, R. L. 2010, The Astrophysical Journal, 719, 523
- Lehner et al. (2016) Lehner, N., O’Meara, J. M., Howk, J. C., Prochaska, J. X., & Fumagalli, M. 2016, The Astrophysical Journal, 833, 283
- Lynch & Charlton (2007) Lynch, R. S., & Charlton, J. C. 2007, The Astrophysical Journal, 666, 64
- Mac Low & Zahnle (1994) Mac Low, M.-M., & Zahnle, K. 1994, ApJ, 434, L33
- Maio et al. (2007) Maio, U., Dolag, K., Ciardi, B., & Tornatore, L. 2007, Monthly Notices of the Royal Astronomical Society, 379, 963
- McCourt et al. (2018) McCourt, M., Oh, S. P., O’Leary, R., & Madigan, A.-M. 2018, MNRAS, 473, 5407
- Milutinovic et al. (2006) Milutinovic, N., Rigby, J. R., Masiero, J. R., et al. 2006, The Astrophysical Journal, 641, 190209
- Misawa et al. (2008) Misawa, T., Charlton, J. C., & Narayanan, A. 2008, The Astrophysical Journal, 679, 220
- Mo et al. (1998) Mo, H. J., Mao, S., & White, S. D. M. 1998, Monthly Notices of the Royal Astronomical Society, 295, 319
- Murray et al. (2013) Murray, S. G., C.Power, & A.S.G.Robotham. 2013, Astronomy and Computing, 3-4, 23
- Muzahid et al. (2017) Muzahid, S., Fonseca, G., Roberts, A., et al. 2017, Monthly Notices of the Royal Astronomical Society
- Narayanan et al. (2008) Narayanan, A., Charlton, J. C., Misawa, T., Green, R. E., & Kim, T.-S. 2008, The Astrophysical Journal, 689, 782
- Navarro et al. (1997) Navarro, J. F., Frenk, C. S., & White, S. D. M. 1997, ApJ, 490, 493
- Oppenheimer et al. (2012) Oppenheimer, B. D., Dave, R., Katz, N., Kollmeier, J. A., & Weinberg, D. H. 2012, Monthly Notices of the Royal Astronomical Society, 420, 829
- Oppenheimer et al. (2018) Oppenheimer, B. D., Schaye, J., Crain, R. A., Werk, J. K., & Richings, A. J. 2018, Monthly Notices of the Royal Astronomical Society, 481, 835
- Peeples et al. (2019) Peeples, M. S., Corlies, J., Tumlinson, J., et al. 2019, The Astrophysical Journal, 873
- Rahmati et al. (2013) Rahmati, A., Pawlik, A. H., Raicevic, M., & Schaye, J. 2013, Monthly Notices of the Royal Astronomical Society, 430, 2427
- Rigby et al. (2002) Rigby, J. R., Charlton, J. C., & Chrchill, C. W. 2002, The Astrophysical Journal, 565, 743
- Ritter et al. (2018) Ritter, C., Cote, B., Herwig, F., Navarro, J. F., & Fryer, C. L. 2018, The Astrophysical Journal Supplement Series, 237, 42
- Rose & Bregman (1995) Rose, A., & Bregman, J. N. 1995, ApJ, 440, 634
- Schaye et al. (2007) Schaye, J., Carswell, R. F., & Kim, T.-S. 2007, Monthly Notices of the Royal Astronomical Society, 379, 1169
- Simcoe et al. (2004) Simcoe, R. A., Sargent, W. L. W., & Rauch, M. 2004, The Astrophysical Journal, 606, 92
- Somerville & Davé (2015) Somerville, R. S., & Davé, R. 2015, ARA&A, 53, 51, doi: 10.1146/annurev-astro-082812-140951
- Suresh et al. (2015) Suresh, J., Bird, S., Vogelsberger, M., et al. 2015, Monthly Notices of the Royal Astronomical Society, 448, 895
- Sutherland & Dopita (1993) Sutherland, R. S., & Dopita, M. A. 1993, ApJS, 88, 253
- Tonnsen & Bryan (2009) Tonnsen, S., & Bryan, G. L. 2009, The Astrophysical Journal, 694, 789
- Toomre (1963) Toomre, A. 1963, ApJ, 138, 385. http://dx.doi.org/10.1086/147653
- Turk et al. (2011) Turk, M. J., Smith, B. D., Oishi, J. S., et al. 2011, The Astrophysical Journal Supplement Series, 192, 9
- Turner et al. (2017) Turner, M. L., Schaye, J., Crain, R. A., et al. 2017, Monthly Notices of the Royal Astronomical Society, 471, 690
- Turner et al. (2014) Turner, M. L., Schaye, J., Steidel, C. C., Rudie, G. C., & Strom, A. L. 2014, Monthly Notices of the Royal Astronomical Society, 445, 794
- Turner et al. (2015) —. 2015, Monthly Notices of the Royal Astronomical Society, 450
- Waters & Proga (2019) Waters, T., & Proga, D. 2019, ApJ, 876, L3
- Weaver et al. (1977) Weaver, R. W., McCray, R., Castor, J., Shapiro, P., & Moore, R. 1977, Astrophysical Journal, 218, 377