Morphology of the Light Curves for the X-ray Novae H 1743-322 and GX 339-4 during their Outbursts in 2005–2019
Abstract
Based on long-term SWIFT, RXTE, and MAXI observations of the
X-ray novae H 1743-322 (IGR J17464-3213) and GX 339-4, we
have investigated the morphology and classified the light curves
of their X-ray outbursts. In particular, we have confirmed the
existence of two radically different types of outbursts, soft
(S) and hard (H), in both sources and revealed their varieties,
ultrabright (U) and intermediate (I). The properties and origin
of the differences in the light curves of these outbursts are
discussed in terms of the truncated accretion disk model.
DOI: 10.1134/S1063773720040052
Keywords: black holes, low-mass X-ray binaries, X-ray transients, X-ray novae, nonstationary accretion.
2020464205231251[223]
December 2, 2019
INTRODUCTION
Nonstationary (flaring) X-ray binaries in which a stellar-mass () black hole (or a neutron star with a weak, G, magnetic field) and a low-mass () main-sequence star serve as a compact object and a normal component, respectively, are called X-ray novae. During their outbursts X-ray novae become the brightest sources in the X-ray sky (Sunyaev et al. 1988, 1991; Grebenev et al. 1993, 1997; Tanaka and Shibazaki 1996; Grove et al. 1998; Remillard and McClintock 2006; Belloni 2010).
As a rule, the orbital periods of X-ray novae are several hours (Cherepashchuk 2013). This ensures that the Roche lobe is filled (or almost filled) by the normal star and makes an efficient transfer of its matter through the inner Lagrange point (L1) possible. The energy release through the accretion of this matter by the black hole (neutron star) feeds the binary’s X-ray outburst. Since the accreting matter has a large angular momentum, accretion occurs with the formation of an extended accretion disk around the compact object in which the matter slowly spirals in toward the center.
At present, it is unclear whether the outbursts of X-ray novae are associated with some processes in the normal star leading to its swelling to the Roche lobe volume or the mass transfer occurs continually, but most of the time the matter does not reach the black hole, but is accumulated in the outer disk regions and flows inward only on reaching some critical mass. Typical X-ray nova outbursts last for months; the duration of especially powerful ones can reach one year. During the quiescent (off) state the flux from novae drops below the detection level by wide-field X-ray telescopes and all-sky monitors. Nevertheless, the observations of some known X-ray novae by telescopes with mirror optics have shown that the X-ray flux does not disappear completely, but only drops by 4–5 orders of magnitude. The intervals between outbursts in some novae are tens of years or more. Previously unknown sources of this type are discovered almost every year, i.e., at the epoch of X-ray astronomy they flare up for the first time. In other novae outbursts occur quasi-regularly on a time scale of one or two years. However, we know only a few such recurrent transients, whereas the total number of observed X-ray novae approaches already fifty (see, e.g., Cherepashchuk 2013).
The matter that “broke through” to the black hole as a result of the nonstationary accretion episode “spreads” over the accretion disk to form the observed X-ray light curve (Lyubarskii and Shakura 1987; Lipunova and Shakura 2000; Suleimanov et al. 2008). As a rule, for powerful outbursts in the standard 2–10 keV X-ray band it has a characteristic shape called FRED (fast rise–exponential decay). Hard ( keV) radiation is observed on the first days and on the descent of the light curve. However, there are also differences both between the outbursts of different sources and between the individual outbursts of the same object. Outbursts during which hard radiation dominated throughout its duration are known (Sunyaev et al. 1991; Grove et al. 1998; Mereminskiy et al. 2017).
Hardness variations reflect the fact that in the course of outburst development the X-ray novae alternately pass several different states differing by their X-ray energy spectra: hard, intermediate hard, soft, intermediate soft, and two-component ones (Makishima et al. 1986; Grebenev et al. 1997; Belloni 2010). Clearly, these states are associated with different regimes of disk accretion being realized in these binary systems at a given specific time.
The variety of spectral states of X-ray novae finds a natural explanation in the so-called truncated disk model. According to this model, the accretion disk consists of two geometrically separated regions: outer — cold ( keV), geometrically thin, opaque and, hence, radiating like a blackbody (it is responsible for the soft component in the X-ray spectrum of the nova; see Shakura and Sunyaev 1973) and inner — high-temperature ( keV), geometrically thick, but optically thin — semitransparent (it is responsible for the hard power-law X-ray emission component; see, e.g., Shapiro et al. 1976; Sunyaev and Truemper 1979). The transition between the regions is determined by the evaporation of the cold outer disk under the action of viscous energy release in it. According to the model, one or the other state of the X-ray nova is observed, depending on the position of the boundary between the outer and inner regions (and, accordingly, their surface areas and contributions to the total radiation spectrum). It would seem that the radius of the boundary between the regions should increase with accretion rate (the area of the hot zone should grow with energy release; see Shakura and Sunyaev 1973). However, observations show that this does not happen, at least there is no direct proportionality here.
In this paper we make an attempt to check the validity of the described picture of the state transition and the truncated disk model in general by studying the X-ray light curves for the outbursts of two recurrent, widely known X-ray novae, H 1743-322 and GX 339-4, observed in them over almost 15 years. Most of these outbursts were investigated to some extent by various instruments directly during their development and decay, but, as far as we know, nobody has compared the properties of different outbursts and analyzed their entire set.
THE SOURCES H 1743-322 AND GX 339-4
The X-ra y transient H 1743-322 was discovered by the HEAO-1 observatory during its powerful 1977 outburst that lasted days. However, its position in the sky was determined ambiguously and is given in the catalog of the main HEAO-1 A1 instrument (Wood et al. 1984) with a large offset (the source in this catalog was even called differently, H 1741-322). After this outburst the source had remained in the off state for many years. A new outburst from this region was recorded only in March 2003 (Revnivtsev et al. 2003) by the INTEGRAL observatory (Winkler et al. 2003) and was mistaken for the outburst of a new transient named IGR J17464-3213 due to the position error in the catalog by Wood et al. (1984). The association with H 1743-322 was clarified by Markwardt (2003), who pointed to the mentioning of a different possible position of H 1741-322, which coincides within the error limits with the position of IGR J17464-3213, in the paper by Gursky et al. (1978) based on HEAO-1 A3 data.
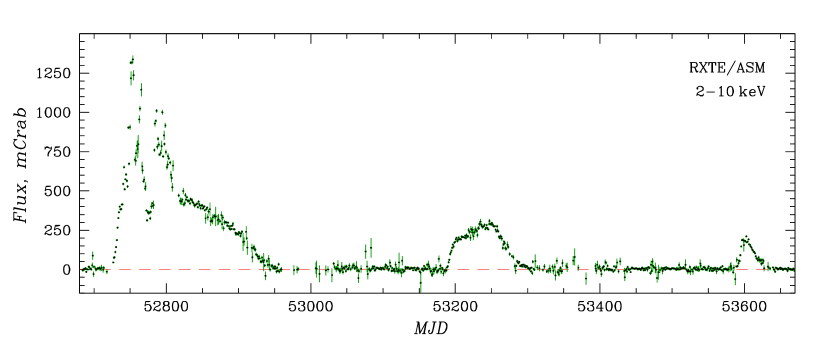
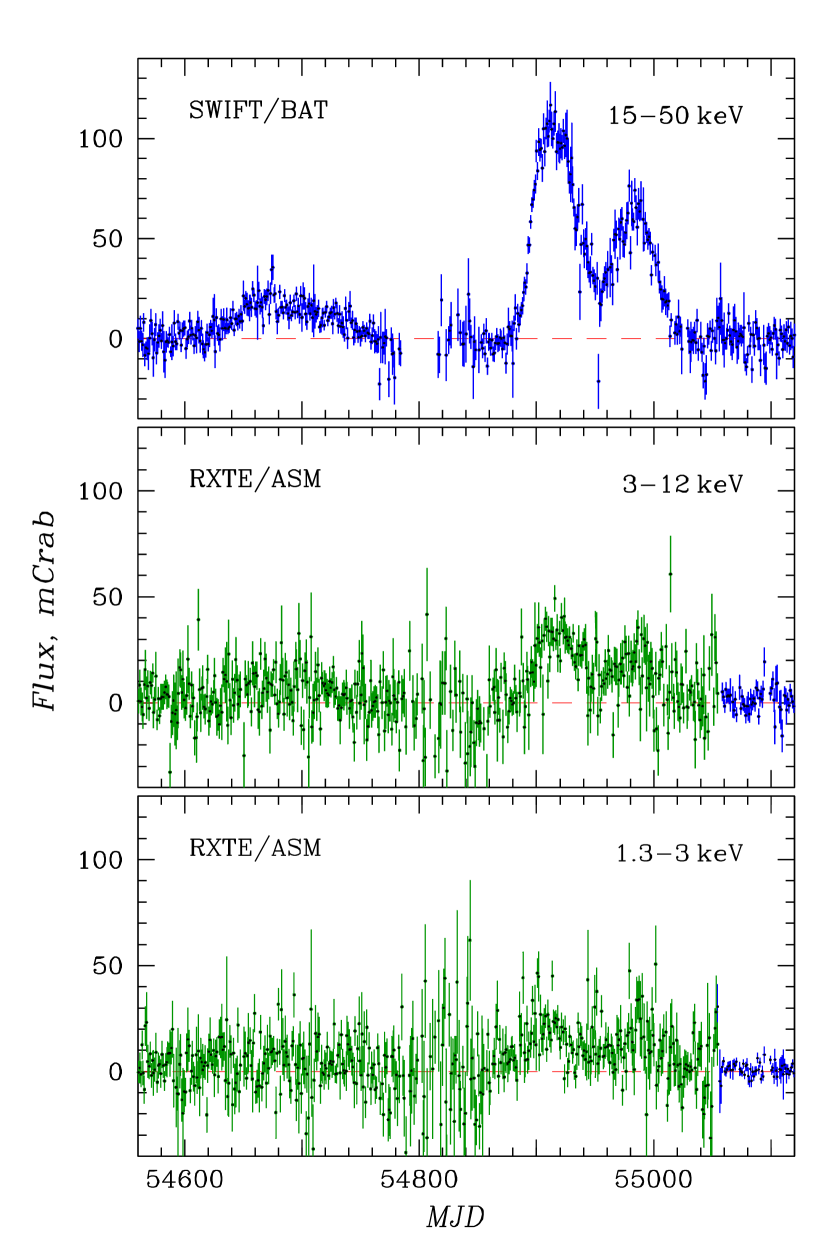
The 2003 outburst was very powerful, lasted eight months, and passed through the entire spectrum of states — from hard (Revnivtsev et al. 2003) to soft (Kretschmar et al. 2003) and back (Grebenev et al. 2003; Tomsick and Kalemci 2003). Based on RXTE data (Jahoda et al. 1996), Swank (2004) reported the onset of a new outburst of the source in July 2004. A faint outburst was also recorded by RXTE in August 2005 (Swank et al. 2005). It was also observed by the Neil Gehrels SWIFT observatory (Gehrels et al. 2004). The source’s light curve measured by the all-sky monitor (ASM) of the RXTE observatory during these three outbursts is shown in Fig. 1. The first two outbursts differ greatly in power, duration, and time profile from the third and all the succeeding outbursts observed since that time every 8–9 months. In this paper we will investigate the third and succeeding outbursts, which are more typical for this X-ray nova.
The optical counterpart of H 1743-322 has not yet been established. The assumption about accretion onto a black hole is based on the commonality of the X-ray properties of this source with the observational manifestations of other X-ray novae, in particular on the observation of radio and X-ray jets from it (Corbel et al. 2005). Since the source’s position in the sky is close to the Galactic center direction, it is generally believed that it is actually located near the center at a distance kpc. Steiner et al. (2012) estimated the distance to the source more rigorously by analyzing the data on the jet kinematics: kpc.
The X-ra y transient GX 339-4 (also designated as 4U 1658-48), like the X-ray source Cyg X-1, is a long-known and best-studied (canonical) Galactic binary system containing a black hole. In contrast to Cyg X-1, GX 339-4 is a member of a low-mass X-ray binary. The source is also the first known recurrent transient whose outbursts are repeated on a time scale of several years.
Discovered by the OSO-7 satellite in 1973 as an unusual highly variable X-ray source (Markert et al. 1973), GX 339-4 was studied in detail by the ARIEL-6 (Motch et al. 1983), TENMA (Makishima et al. 1986), GINGA (Miyamoto et al. 1991), GRANAT (Grebenev et al. 1991, 1993) satellites and all of the succeeding missions.
The optical star V 821 Ara of this binary system revolves
around the compact object with a 1.76-day period (Cherepashchuk
2013); the mass function of the compact object (Hynes et al. 2003) leaves no doubt that it is a
black hole. The distance to the source is estimated to lie
within the range kpc (Hynes et
al. 2004).
MAXI/GSC data
| Outburst | Type | |||||||||||
| N | MJD | YYYY–MM | MJD | days | days | mCrab | mCrab | |||||
| 1 | 2 | 3 | 4 | 5 | 6 | 7 | 8 | 9 | 10 | |||
| 1 | 53590– | 53640 | 2005–08 | 53595 | 50 | – | U | |||||
| 2 | 54464– | 54512 | 2008–01 | 54469 | 48 | 874 | U | |||||
| 3 | 54732– | 54804 | 2008–10 | 54744 | 72 | 268 | I1 | |||||
| 4 | 54973– | 55036 | 2009–05 | 54979 | 63 | 241 | S | |||||
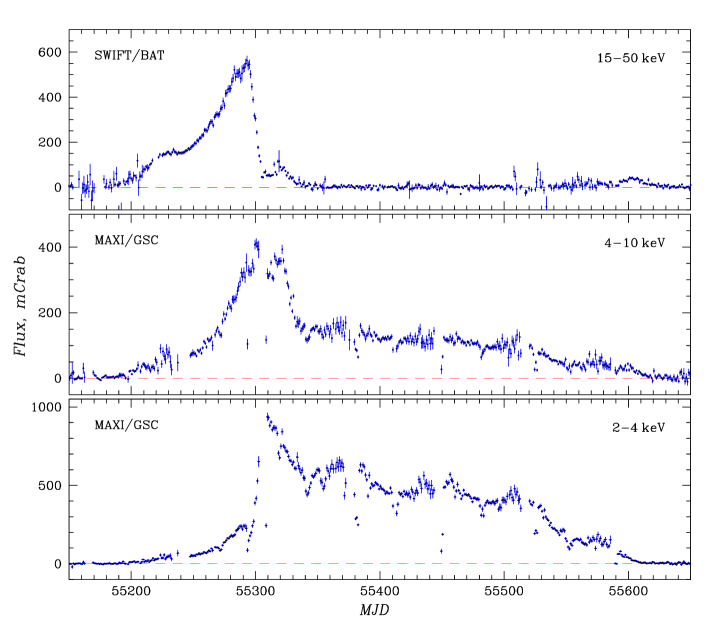
| 5 | 55195– | 55245 | 2010–01 | 55195 | 50 | 222 | S | |||||
| 6 | 55411– | 55471 | 2010–08 | 55418 | 60 | 216 | S | |||||
| 7 | 55535– | 55577 | 2011–01 | 55565 | 42 | 124 | M | |||||
| 8 | 55656– | 55712 | 2011–04 | 55667 | 56 | 121 | I2 | |||||
| 9 | 55924– | 55972 | 2011–12 | 55924 | 48 | 268 | H | |||||
| 10 | 56191– | 56233 | 2012–10 | 56199 | 42 | 267 | H | |||||
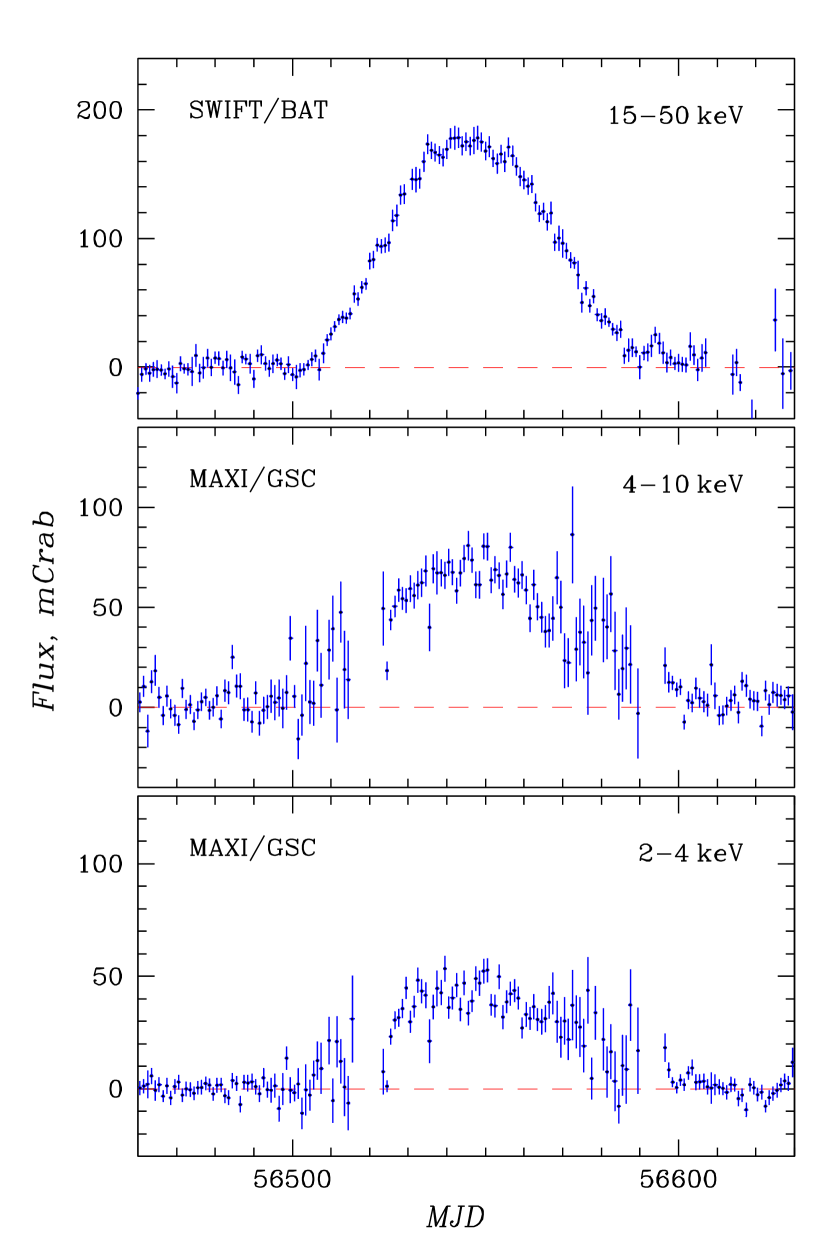
| 11 | 56500– | 56556 | 2013–08 | 56510 | 56 | 309 | S | |||||
| 12 | 56911– | 56974 | 2014–10 | 56930 | 63 | 411 | H | |||||
| 13 | 57177– | 57229 | 2015–06 | 57188 | 52 | 266 | H | |||||
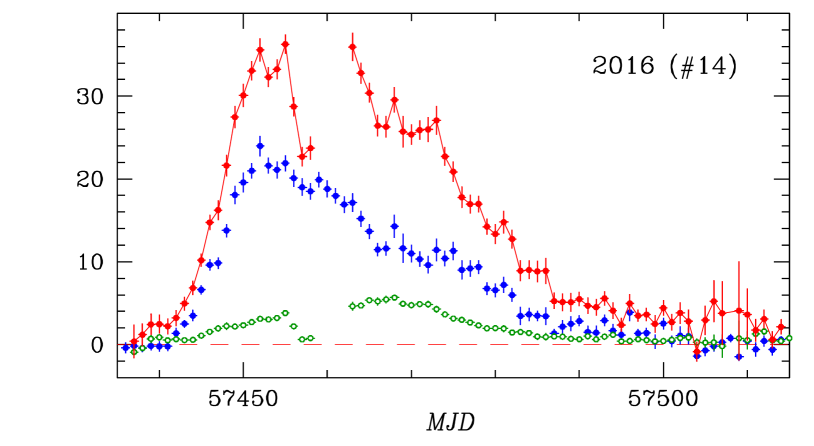
| 14 | 57442– | 57500 | 2016–03 | 57452 | 58 | 265 | H | |||||
| 15 | 57694– | 57760 | 2016–11 | 57707 | 66 | 252 | H | |||||
| 16 | 57957– | 58013 | 2017–08 | 57971 | 56 | 263 | H | |||||
| 17 | 58361– | 58404 | 2018–09 | 58383 | 43 | 404 | H | |||||
| The outburst number and start-end dates (MJD). | ||||||||||||
| The year, month, and date (MJD) of reaching the peak flux in the outburst. | ||||||||||||
| The outburst duration. | ||||||||||||
| The recurrence time (the interval between the onset of this outburst and the onset of the previous one). | ||||||||||||
| The peak flux in the hard (H: 15–50 keV) and soft (S: 2–4 or 1.3–3 keV during the MAXI/GSC | ||||||||||||
| and RXTE/ASM observations, respectively) bands. | ||||||||||||
| The radiation softness (the ratio of the fluxes in the S and H bands). | ||||||||||||
| The type of outburst (hard – H, soft – S, ultrasoft – U, intermediate – I, micro-outburst – M). | ||||||||||||
| The timing characteristics for this outburst were determined from the soft (S) band. | ||||||||||||
INSTRUMENTS AND OBSERVATIONS
The work is based on the archival publicly accessible data of observations of these X-ray sources by the Neil Gehrels SWIFT (Gehrels et al. 2004) (data from the BAT hard X-ray telescope with a coded aperture were used; Barthelmy et al. 2005), RXTE (Jahoda et al. 1996) (data from the ASM X-ray all-sky monitor were used), and MAXI (Matsuoka et al. 2009) (onboard the International Space Station (ISS), data from the GSC X-ray all-sky monitor were used; Mihara et al. 2011) orbital astrophysical observatories. These instruments have a wide field of view and carry out quasi-regular observations of many bright cosmic sources.
The light curves of the novae H 1743-322 and GX 339-4 in the hard 15–50 keV band were taken from the site swift.gsfc.nasa.gov/results/transients. They were constructed from the SWIFT/BAT data by the telescope designers within the framework of an X-ray transient monitoring program (Krimm et al. 2013). Each point of the light curves is the day-averaged flux based on at least 64 s of observations of the source. The light curves span the time interval from February 12, 2005, to December 24, 2019. A complete detailed description of the light curve construction procedure and the limitations taken into account in it can be found in the mentioned paper by Krimm et al. (2013).
The light curves in the softer X-ray bands before MJD 55200 were taken from the site xte.mit.edu/asm lc.html of the RXTE/ASM monitor. They were provided by the instrument designers in the 1.3–3 and 3–12.2 keV bands. After MJD 55200 (from August 15, 2009, to December 24, 2019) we used data from the MAXI/GSC monitor: the light curves in the 2–4 and 4–10 keV bands were taken from the site maxi.riken.jp/top/slist.html. Each point on the light curves of both instruments is the day-averaged flux from the source. It is based on 5–10 scans with a duration s for RXTE/ASM and several scans with a duration s performed every 92 min for MAXI/GSC.
For all instruments the measured photon fluxes were converted to
mCrabs ( of the flux from the Crab nebula) based on the
results of regular observations of the nebula by these
instruments presented at the above sites.
RESULTS
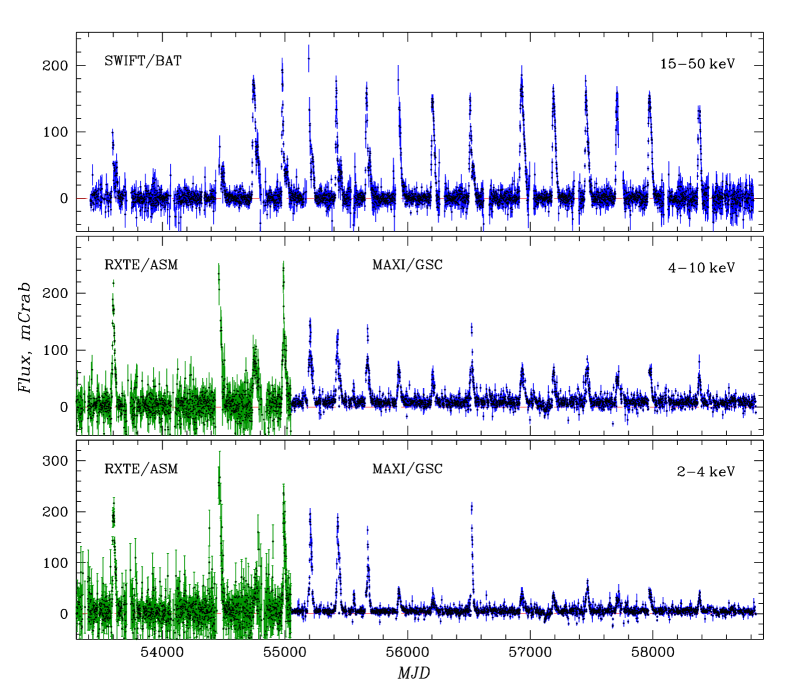
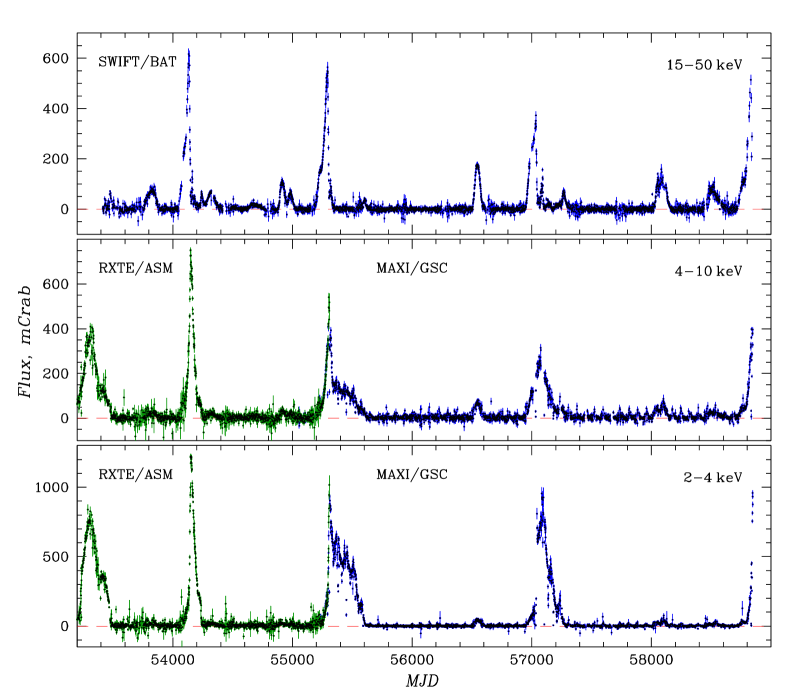
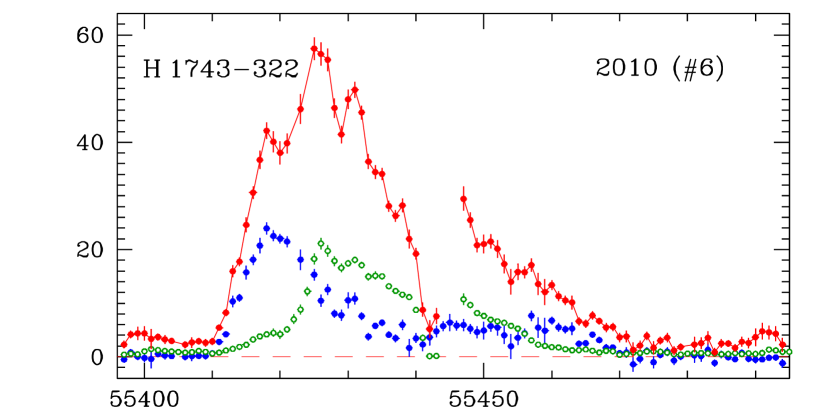
Figure 2 shows long-term (2005–2019) light curves of the X-ray nova H 1743-322 in three energy bands, 2–4 and 4–10 keV (from ISS/MAXI/GSC or RXTE/ASM data) and 15–50 keV (from SWIFT/BAT data).
In years elapsed since January 2005 the source experienced 17 outbursts. The last outburst occurred in 2018 (Grebenev and Mereminskiy 2018; Williams et al. 2020). It follows from the figure that in the hard band, except for the first five years of its observations by SWIFT (during which two moderately strong, mCrab, outbursts occurred), all of the outbursts had virtually the same intensity, reaching mCrab at maximum. The situation in soft bands, 4–10 keV and especially 2–4 keV, is different; here, in addition to three ultrabright (with a flux mCrab) and four moderately bright (with a flux mCrab) outbursts, outbursts whose peak flux did not exceed mCrab were regularly observed. Clearly, the radiation from the source during these outbursts was much harder than that during the bright ones.
Table 1 gives some parameters of the outbursts from this
source: the outburst number and start-end date (MJD) (columns 1
and 2, respectively), the year and month of reaching the peak
flux (3), MJD of the peak flux (4), the outburst duration in
days (5), the recurrence time (the time between the onset of a
given outburst and the onset of the previous one) (6), the peak
flux in the hard (H: 15–50 keV) and soft (S: 2–4 keV) bands
(columns 7 and 8), and the softness of the radiation from
the source (the ratio of the fluxes in the soft and hard bands,
column 9). The timing characteristics were determined from the
light curve in the hard band (except for outburst 7). In the
soft band they slightly differ, in particular, the peak flux, as
a rule, is reached several days later than in the hard
one. However, the accuracy of these characteristics does not
exceed a few days due to the statistical errors of measurement
of the light curves and is insufficient for reliable conclusions
about their energy dependence to be drawn. Note that many
outbursts exhibit a quasi-recurrence with a period
days.
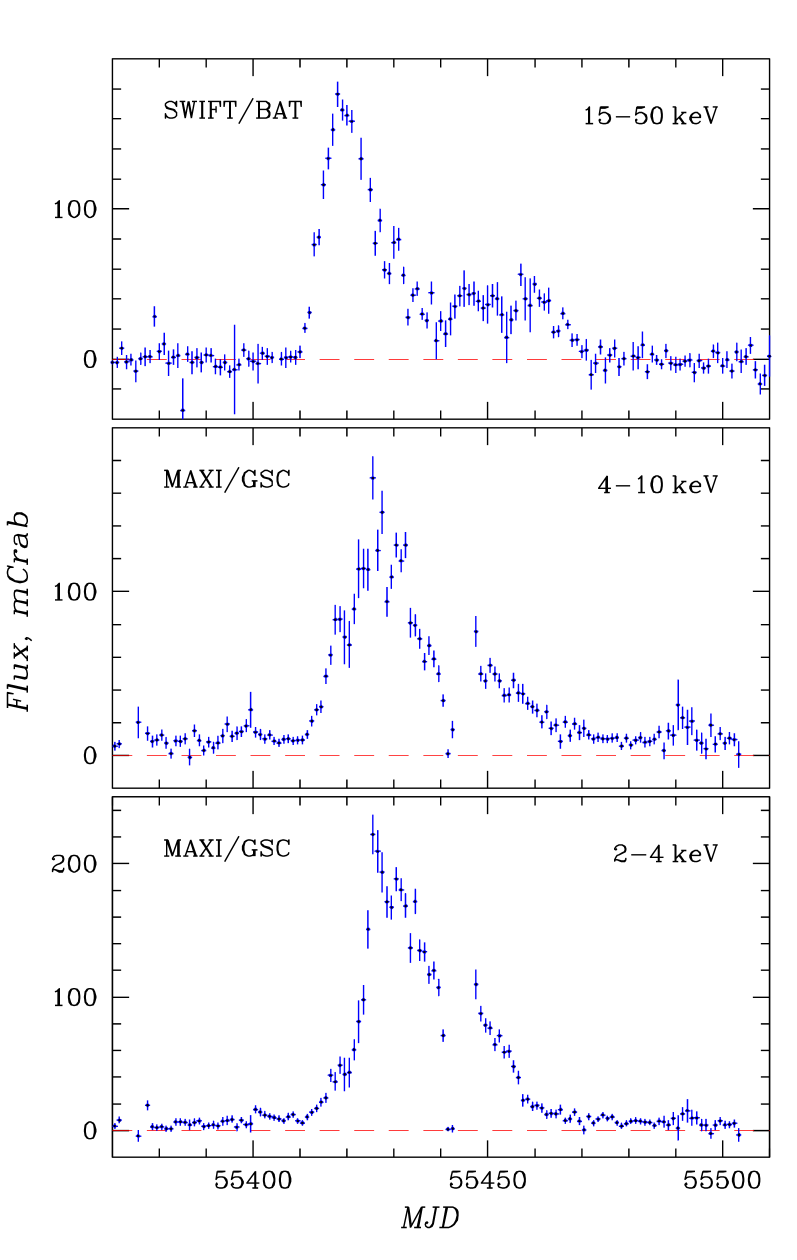
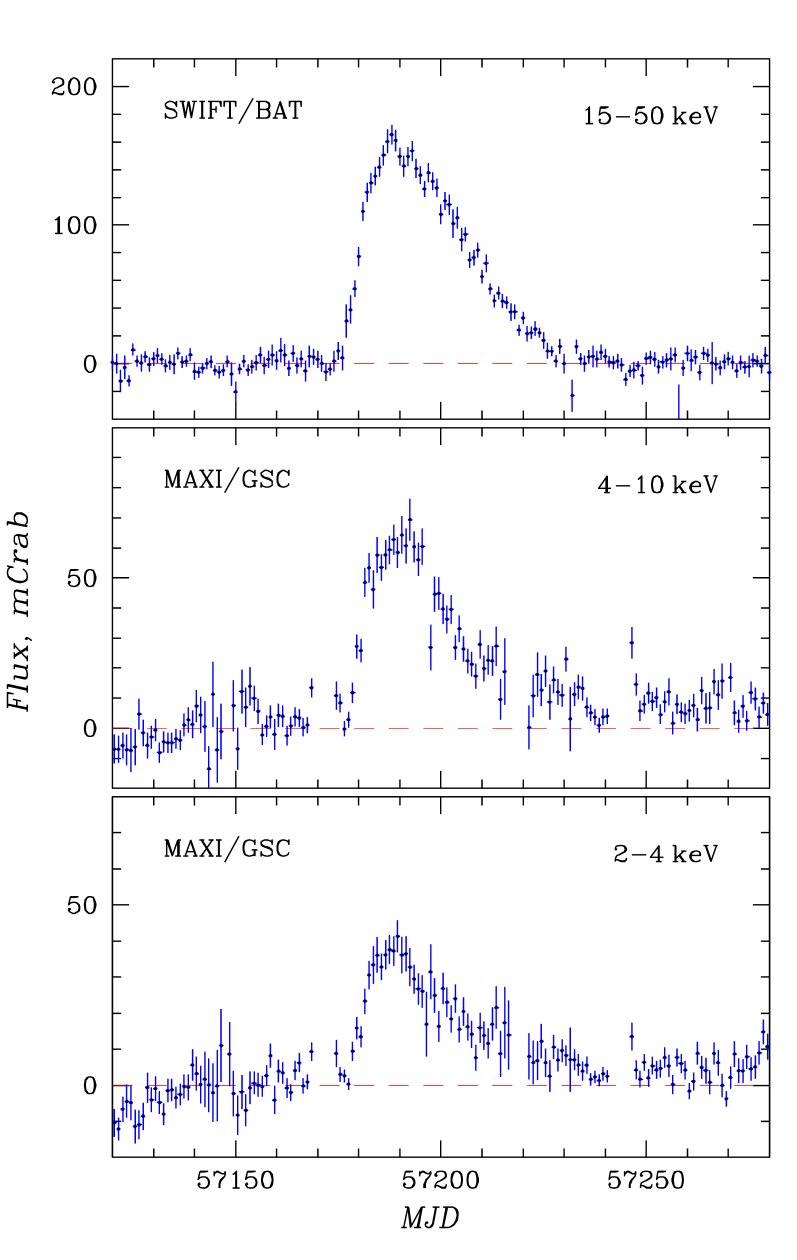
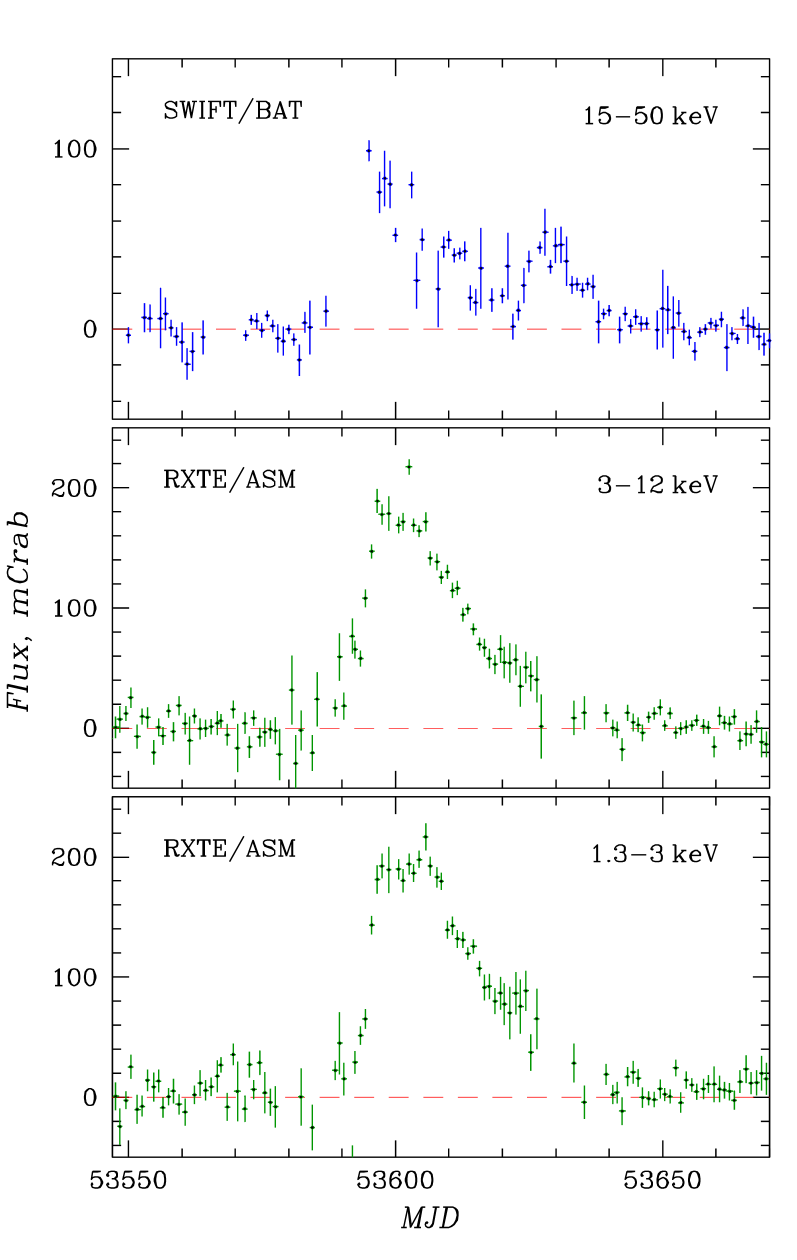
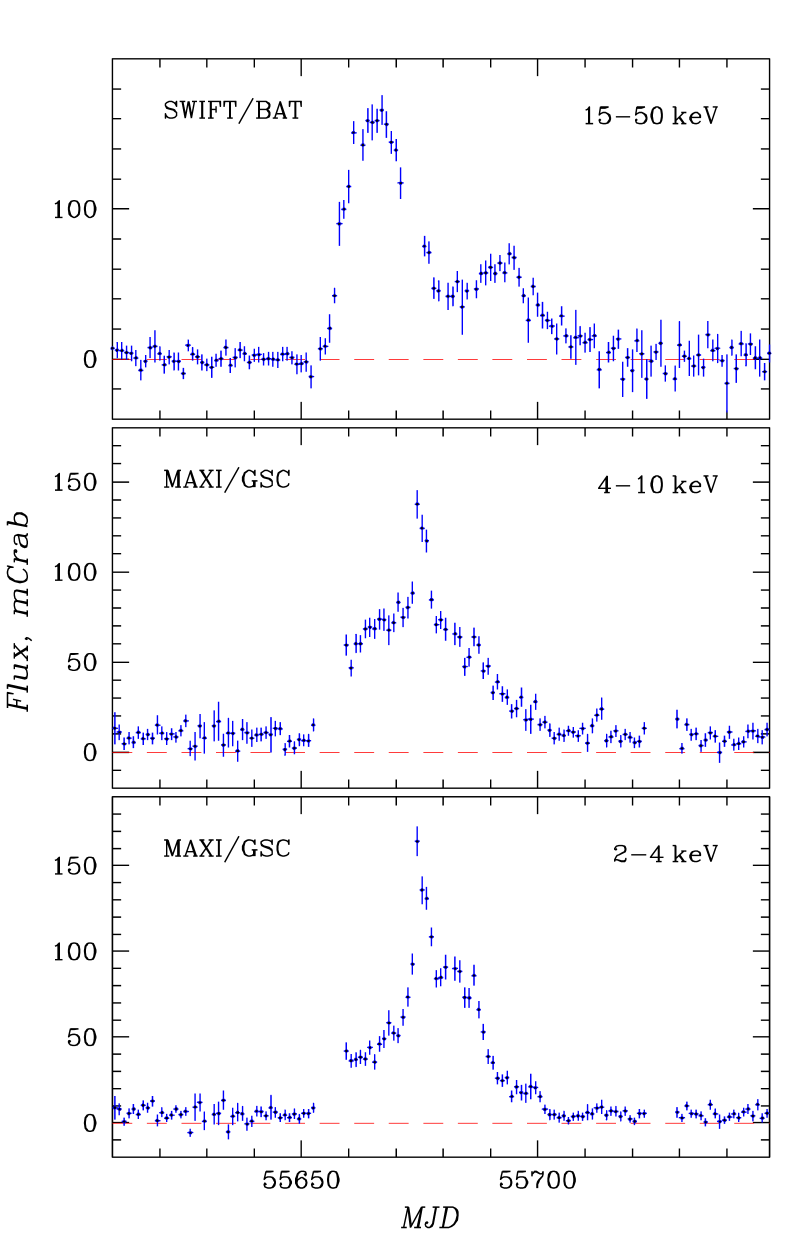
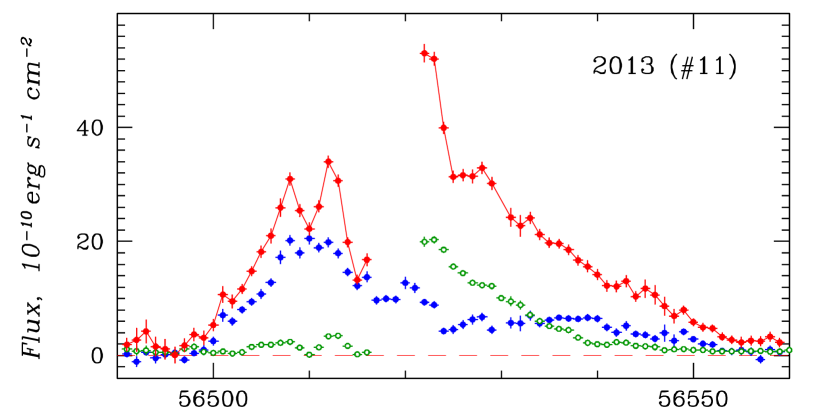
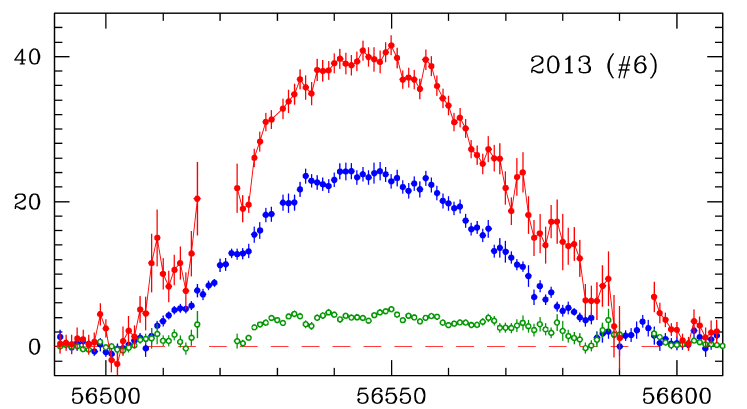
Obviously, the outbursts of this X-ray nova can be divided at least into two most commonly encountered types — soft (S) and hard (H). Figures 3 and 4 present typical profiles for outbursts of these types (outbursts 6 and 13 from Table 1). (column 9) lies in the range 0.9–1.4 for the soft outbursts and 0.24–0.37 for the hard ones. Apart from a several times greater amplitude of the peak fluxes in the soft 2–4 and 4–10 keV bands, the S outbursts are characterized by a more complex shape of the light curve in the hard 15–50 keV band: after reaching its peak, the flux decreases quite rapidly (on a time scale of 20–30 days) by a factor of 4–5 and then is kept at this level for another days. During an H outburst the photon flux in the hard band decays noticeably more slowly (on a time scale of 50–60 days), while the outburst light curve itself has a simple shape without features resembling FRED. For each outburst column 10 in the table gives its type.
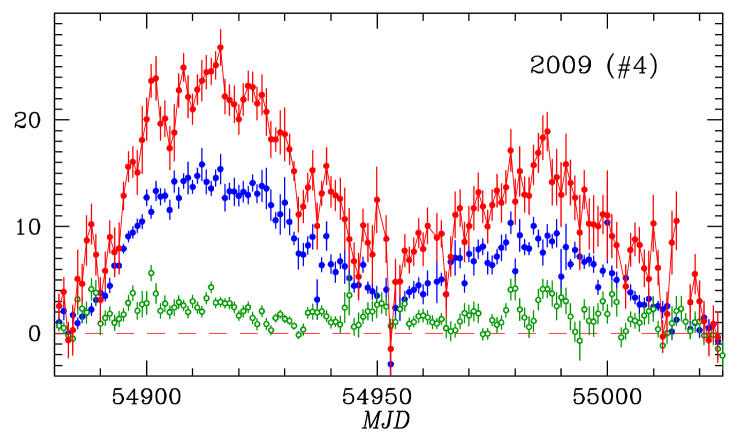
The two early (before 2008) outbursts are designated in the table as U (ultrasoft) ones. In many respects they are similar to the S outbursts, but are slightly brighter in the soft bands than the remaining outbursts of this type and much (by a factor of 2–3) fainter in the hard one. Their softness falls within the range 2.2–3.5. Figure 5 presents a light curve for the 2005 outburst of this type (outburst 1 from Table 1). The 2009 outburst 4 (assigned to the S type) is as bright in the soft bands as the U outbursts, but in the hard band it is comparable to the remaining S outbursts (the softness of its radiation is near the upper boundary of the range of values for the S outbursts).
If the entire activity period of the X-ray nova H 1743-322, from 2005 up until now, is described, then it can be seen that before 2011 the source experienced mostly soft U and S outbursts, while beginning since 2011 it completely passed to H outbursts.
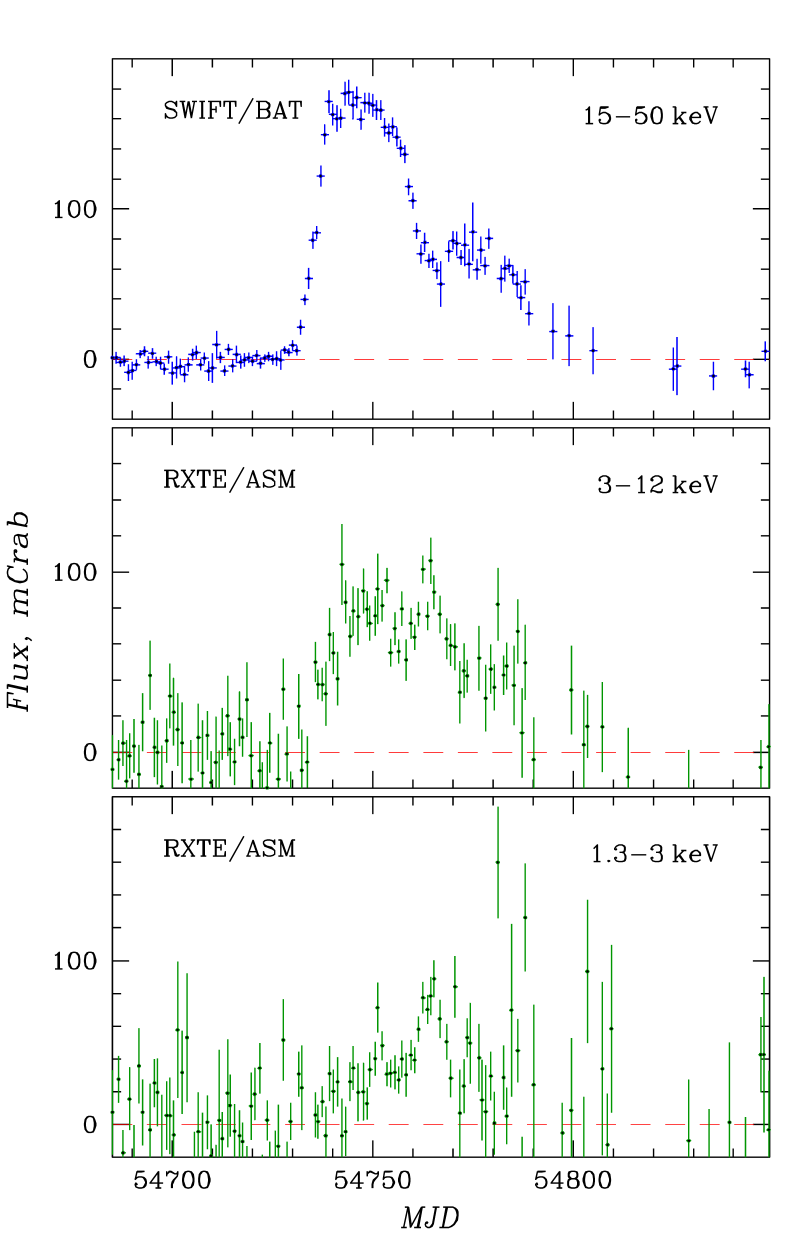
It can be seen from Table 1 that there are also other more rare types of outbursts (in the table they are designated as I1, I2, and M). Types I (intermediate) are shown in Figs. 6 and 7. The first outburst begun in October 2008 (3 in the table) has clear signatures of an S outburst, but, at the same time, a low intensity in the soft 1.3–3 keV energy band (in this band the outburst was observed by RXTE/ASM). As can be seen from Fig. 6, the data point that gave a flux of mCrab in the table is most likely a random outlier. The softness is near the lower boundary of the range of its variations for the S outbursts. The second outburst (8, with its peak in April 2011) also formally resembles an S outburst, but in the soft bands, were it not for the short (3–4 days) radiation pulse, it would be much closer to the H outbursts.
Finally, the outburst designated as M (micro-outburst), number 7
in the table, begun in January 2011 was distinguished both by an
anomalously low amplitude in the soft bands ( mCrab),
which could still be attributed to its hardness, and by a very
low flux in the hard band, mCrab ( upper
limit), which does not allow us to assign it to the hard H
outbursts. It should be noted, however, that the SWIFT/BAT data
during this outburst were of a rather low quality.
Outbursts of GX 339-4
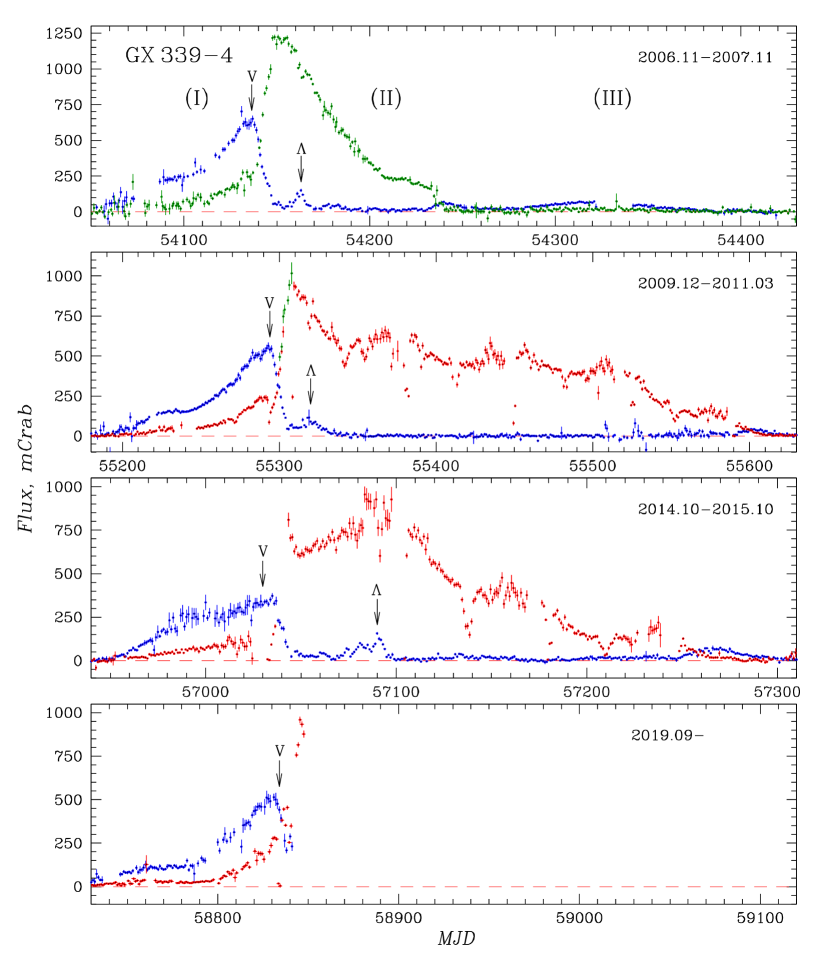
Figure 8, which is analogous to Fig. 2, shows long-term light curves of the X-ray transient GX 339-4. In 15 years the source experienced 11 outbursts, i.e., they occurred a factor of 1.5 more rarely than those in the X-ray nova H 1743-322. Below we will not consider the earliest outburst observed in MJD 53200–53500, because it was not recorded in the hard band (the SWIFT satellite had not yet begun to operate in its orbit). The characteristics of the remaining ten outbursts are given in Table 2.
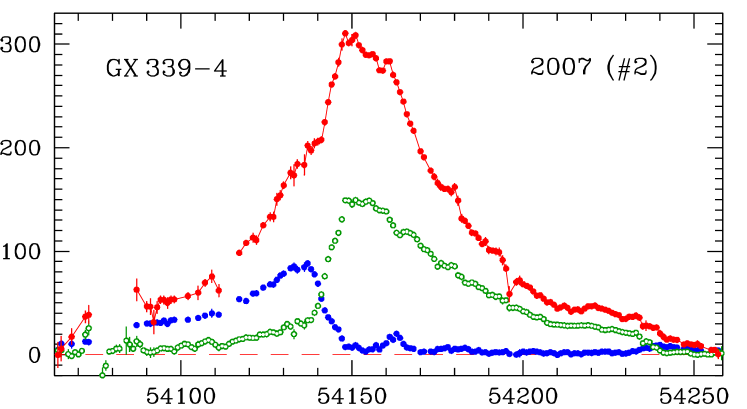
The table and Fig. 8 show that the outbursts of GX 339-4, like the outbursts of the X-ray nova H 1743-322, were distinguished by a great variety. In particular, both soft (S or U) and hard (H) outbursts were also present among them. Figure 9 and farther Fig. 11 below give examples of light curves for such outbursts with a much better time resolution. The time profiles of the outbursts that reached the maximum of their hard radiation in April 2010 (5 in the table, type S) and September 2013 (6 in the table, type H) are shown.
The outburst in Fig. 9, just as all other soft outbursts, was several times brighter than the similar outbursts of H 1743-322, slightly softer (–1.87) and noticeably longer than them (300–500 days). It follows from Table 2 (columns 7 and 9) that the peak flux in the soft band during these outbursts was reached 15–20 (and for outburst 7 almost 50) days later than in the hard one. Therefore, using for their description looks somewhat formal. Nevertheless, this parameter characterizes the softness of the X-ray radiation from the outbursts quite well and we will continue to use it to maintain the commonality of their analysis in these two sources. Outburst 7 was attributed to the ultrasoft (U) outbursts, because its reached . On the whole, however, the S and U outbursts of GX 339-4 have much in common with the giant outburst H 1743-322 in 2003. In particular, they exhibit pronounced phases of initial hard (phase I), extended soft (phase II), and final hard (phase III) spectral states of the source.
Figure 10 compares the light curves for all soft (S and U) outbursts of GX 339-4 in two energy bands: hard 15–50 keV (blue circles) and soft 2–4 keV (red or green circles). The Roman numerals on the upper panel indicate the phases of the light curve. Interestingly, during phase I (hard state) the light curves of the source in the soft and hard bands rise in a correlated way, identically. This means that (1) some fraction of the soft X-ray radiation is emitted by the source even in this state and (2) it most likely originates in the same region where the hard radiation does. It can also be seen that phase II of the soft state (the outburst in the soft band) differs greatly for different outbursts in duration, time of reaching the peak flux, and light curve shape itself. During this phase the hard flux with a delay of 20–30 days relative to the onset of the soft outburst drops almost to zero.
In another 10–20 days, during phase II (near the peak of the soft flux), a short-term manifestation of activity is observed on the light curves of these outbursts in the hard band — a faint burst of hard radiation. Such bursts are indicated in the figure by the arrows denoted by . This activity may be associated with a rise in the temperature of the inner blackbody disk regions (Shakura and Sunyaev 1973) or with a manifestation of the hot corona above the cold blackbody disk (Galeev et al. 1979). Thus, it can have an origin different from the origin of the hard Comptonized radiation of the source observed during phases I and III.
Note also the dip at the boundary of phases I and II in the soft light curve with a duration days present in all soft outbursts. The dips are indicated in Fig. 10 by the arrows denoted by V. In view of the obvious similarity between the light curves in the hard and soft bands during phase I, it can be assumed that the radiation in the soft band has a different nature at different outburst phases. During phase I it is closely related to the hard spectral component — is its extension (for example, a power-law one) and, accordingly, is formed in the same high-temperature region; it disappears simultaneously with the hard component. During phase II it has a completely different nature and is formed in the geometrically separated cold opaque region. The dip stems from the fact that when the soft radiation correlated with the hard one has already disappeared, the soft blackbody flux has not yet reached the value required for a smooth monotonic behavior of the light curve. To some extent its appearance is a result of the choice of a fairly narrow soft band. The bolometric light curve should most likely be smooth, while the missing radiation during the dip is emitted in the intermediate 4–15 keV band.
| Outburst | Type | ||||||||||||
| N | MJD | YYYY–MM | MJD | days | days | mCrab | days | mCrab | |||||
| 1 | 2 | 3 | 4 | 5 | 6 | 7 | 8 | 9 | 10 | 11 | |||
| 1 | 53759– | 53878 | 2006–04 | 53846 | 119 | – | – | H | |||||
| 2 | 54060– | 54385 | 2007–02 | 54131 | 325 | 301 | 54150 | S | |||||
| 3 | 54631– | 54758 | 2008–07 | 54675 | 127 | 571 | – | H | |||||
| 4 | 54884– | 55023 | 2009–03 | 54912 | 139 | 253 | – | H | |||||
| 5 | 55178– | 55632 | 2010–04 | 55293 | 454 | 294 | 55308 | S | |||||
| 6 | 56508– | 56604 | 2013–09 | 56543 | 96 | 1330 | – | H | |||||
| 7 | 56946– | 57300 | 2015–01 | 57035 | 354 | 438 | 57083 | U | |||||
| 8 | 58020– | 58160 | 2017–11 | 58082 | 140 | 1074 | 58104 | H | |||||
| 9 | 58475– | 58599 | 2018–12 | 58483 | 124 | 455 | 58537 | H | |||||
| 10∗ | 58716– | 58841 | 2019–12 | 58831 | 125 | 241 | 58846 | S | |||||
| The outburst number and start-end dates (MJD). | |||||||||||||
| The year, month, and date (MJD) of reaching the peak flux in the outburst in the H band. | |||||||||||||
| The outburst duration. | |||||||||||||
| The recurrence time (the interval between the onset of this outburst and the onset of the previous one). | |||||||||||||
| The peak flux in the hard (H: 15–50 keV) and soft (S: 2–4 or 1.3–3 keV during the MAXI/GSC and | |||||||||||||
| RXTE/ASM observations, respectively) bands. | |||||||||||||
| The date (MJD) of reaching the peak flux in the outburst in the S band. | |||||||||||||
| The radiation softness (the ratio of the fluxes in the S and H bands). | |||||||||||||
| The type of outburst (hard – H, soft – S, ultrasoft – U). | |||||||||||||
| ∗ The underlined values are a lower limit, because the outburst has not finished. | |||||||||||||
The light curves of the outburst presented in Fig. 11, along with the light curves for other hard outbursts of this source, are very similar to those for the hard outbursts of the X-ray nova H 1743-322. However, their profile has a more symmetric (triangular) shape with approximately the same rise and decay phases. The peak flux of the hard outbursts changed from outburst to outburst by a factor of 2–3, while the softness of the radiation from the source (, column 10 in Table 2) during some outbursts exceeded that for the hard outbursts of H 1743-322 () by a factor of . The duration of the outbursts also exceeded that of the H outbursts in H 1743-322, on average, by a factor of 1.5–2.
Curiously, the hard outbursts of this source always precede the onset of a soft outburst, which differs greatly from the behavior of the outbursts in the X-ray nova H 1743-322. In this case, whereas the delay between the hard and soft outbursts at the beginning was days, in the succeeding outbursts it already reached days, while two hard precursor outbursts at once were observed in the last outburst, which just reached the peak flux at the end of our observations. Clearly, this correlation of the H and S outbursts is by no means a chance one and there must be some hidden connection between them. However, we have no reason to directly attribute them to one outburst event, as was done with the faint bursts of hard radiation observed on the descent of the light curves for the powerful S events (2, 5, and 7 in the table and Fig. 10).
Outburst 4 from Table 2 begun in March 2009 is of interest. Although it undoubtedly belongs to the H type (it was hardly recorded in two soft energy bands), in the hard band (see Fig. 8) its profile has a pronounced two-component shape that, as we saw above using H 1743-322 as an example, is one of the signatures of S outbursts. In Fig. 12 the light curves measured during this outburst are presented with a better time resolution111The same figure shows the previous very faint hard outburst 3 occurred in July 2008.. We see that the two-component profile of outburst 4 actually bears no resemblance to the profile of the S outbursts in H 1743-322 (the second component has the appearance of not a step, but a new, almost equally powerful outburst in all bands). In this case, we most likely deal with a superposition of two H outbursts. Below we will show that this is actually the case.
DISCUSSION
Apart from the formal difference in maximum attained accretion rate, the observed differences in the outbursts of X-ray novae can be explained by the presence (or absence) of a soft component in the broadband spectrum of their X-ray radiation associated with the outer cold, optically thick accretion disk region radiating like a blackbody (Shakura and Sunyaev 1973).
Accretion Disk Evaporation
The cold opaque region should always be present in the disk — at least on its far periphery, where the sudden infall or accumulation of matter being transferred from the normal star occurs (in this case, however, the radiation from the cold region falls into the optical and infrared range). We are interested in the X-ray radiation and, therefore, the question is how closely toward the black hole this region extends, i.e., at what radius the transition from the cold disk to the high-temperature inner region occurs.
Evaporation of the cold disk (Meyer et al. 2000) under conditions when the mechanisms of heat removal in this disk (by radiation or heat conduction) cannot cope with the viscous release of the gravitational energy of accreting matter growing toward the disk center can serve as a cause of this transition. Since at the first stage of outburst development (Lyubarskii and Shakura 1987) from the matter accumulated on the periphery not as much of it flows toward the black hole — an initial disk (“tongue”) of relatively low surface density is formed, the formation of an extended high-temperature region, radiating in the hard X-ray band near the black hole should not cause a surprise. Subsequently, the accretion rate grows, the surface density of the matter in the disk and its optical depth increase. This allows the heat to be removed more efficiently by radiation; accordingly, the area of the cold disk region grows, while that of the hot one decreases.
The closer the cold disk approaches the black hole, the greater the fraction of the gravitational energy of its matter released during accretion is irradiated in the soft blackbody component of the broadband spectrum of the X-ray nova, and the higher the temperature of this radiation must be. Accordingly, the fraction of the energy radiated in the inner high-temperature zone must decrease.
Position of the Truncation Radius of the Cold Disk
A verification of the fact that the ratio of energy release in the two parts of the disk changes could be a confirmation of this picture of outburst development in the truncated disk model. After all, an alternative variant of outburst development, where the radius separating the accretion disk into two components remains constant, while the observed variability is related exclusively to the change in accretion rate and the corresponding change in cold disk temperature, is possible in principle. The temperature of the inner disk zone in this case can also change with accretion rate, but not the fraction of the energy being release in it. Besides, completely different origins of the hard X-ray radiation during accretion onto a black hole are discussed — its formation in the hot, optically thin corona forming above the cold disk surface (Galeev et al. 1979; Haardt and Maraschi 1991) or in the relativistic jets emitted from the core of a black hole and observed in a number of sources in the radio, optical, and soft X-ray bands (see, e.g., Espinasse and Fender 2018).
The energy redistribution in the radiation spectra of X-ray novae (a change in the ratio of energy release in the two parts of the disk) is clearly seen from the shape of the light curves for their outbursts in the hard band: in comparison with the regular (FRED) light curve of H outbursts, the light curves of S and U outbursts are distorted starting from some time — a dip is formed in them, as if a certain fraction of their luminosity suddenly disappears, — and are restored at a level expected for the regular light curve only much later. It is clear where this fraction of the luminosity in the hard band vanishes — a soft X-ray outburst of the source begins exactly at this time.
Bolometric Light Curves
It is interesting how smoothly the accretion rate onto the black hole changes during such a transition — how the bolometric luminosity of the source behaves. In Fig. 13 we attempted to answer this question by reconstructing the broadband X-ray light curves of the X-ray novae H 1743-322 (left) and GX 339-4 (right) during some of their S and H outbursts. For this purpose, the photon fluxes (in mCrab) from these novae in the three 2–4, 4–10, and 15–50 keV energy bands222The outbursts of GX 339-4 in 2007 and 2009 were investigated with RXTE/ASM; accordingly, the soft 1.3–3 and 3–12.2 keV bands were used in constructing the light curves of these outbursts. were converted to the radiation fluxes (in ) via the spectrum of the Crab nebula. The photon spectrum of the nebula was specified in the form
The 4–10 keV flux was converted to the 4–15 keV flux. As a result, an estimate of the flux from the X-ray novae in a wide continuous range, 2–50 keV, was obtained.
We see that the bolometric light curves for the S (in 2010 and 2013) and H (in 2016) outbursts of H 1743-322 reconstructed in this way were in many respects similar — had the same profile shape (FRED) and differed only by the normalization (the H outburst was fainter). The transition from the hard state to the soft one in the S outbursts was not accompanied by any features in the bolometric light curves. The same can also be said about the bolometric light curves of the X-ray transient GX 339-4 — the light curve of its soft outburst in 2007 has a smooth dome shape, nothing in it points to the transition from the hard state to the soft one. The light curves of the hard outbursts occurred in 2009 and 2013 in many respects resemble this light curve, but are characterized by a lower brightness and a flatter top.
The presented light curves of GX 339-4 slightly differ in shape from the light curves of H 1743-322: their rise and decay phases have almost the same slope and duration333This definitely does not pertain to the 2009–2011 outburst of this source, which had a highly asymmetric shape, but is apparently true for the 2014–2015 outburst as well (see Fig. 10).. According to the self-similar solution of the nonlinear partial differential equation that describes unsteady disk accretion onto a black hole (Lyubarskii and Shakura 1987), this is possible if the scattering by electrons dominates in the opacity of matter in the region of main energy release at both phases. In this case, the accretion rate changes with time as where the exponent at the rise phase and at the decay phase, when the remnants of the fallen matter flow down over the disk. If the bremsstrahlung processes dominate in the opacity of matter, then and (Lyubarskii and Shakura 1987). Given the power of the outbursts in GX 339-4, the dominance of scattering in the opacity seems natural.
Features in the Light Curves
As has already been noted, the transition between the states in the soft outbursts of both sources did not lead to clear features in their bolometric light curves. At the same time, there were features (“dips” and “knees” of various intensities) in the light curves at other times (see Fig. 13). They are also seen in the light curves in the narrow 2–4 and 15–50 keV bands obtained by different instruments, i.e., they are definitely not an instrumental effect. A strong dip shortly after the passage of the peak flux, along with several fainter features, can also be seen in the light curve for the hard outburst of H 1743-322 occurred in 2016. Dips and bursts are also seen in the light curves for the hard outbursts of the X-ray transient GX 339-4. In the light curve for the soft outburst of the source in 2007 these features are less pronounced, possibly, due to its high brightness.
These features can be formed due to the accretion flow instabilities arising in the disk, primarily in its inner radiation-dominated part (Shakura and Sunyaev 1976). Although the disk averaged accretion rate remains constant, it can undergo significant changes locally and on a short time scale due to the instability.
Another reason for the appearance of “steps” and dips in the bolometric light curve can be the transition in the opacity of disk matter from the Thomson regime, whereby the scattering by electrons dominates in the matter-radiation interaction, to the bremsstrahlung one, when the free-free absorption processes begin to lead (Lipunova and Shakura 2000).
The largest feature (a dip or a step) with a duration days observed in the light curves of all three outbursts may also be related to some large-scale nonuniformity of the flow of matter in the disk, for example, the passage of a ring perturbation — a wave containing much residual matter, and an eclipse of the region of main energy release (the inner regions of the cold disk and partly the hot cloud) by it.
2009 Outburst
The 2009 outburst of GX 339-4 has a two-component light curve that resembles the light curve of an S outburst in the hard band. Previously we have already noted that a superposition of two H outbursts rather than one S outburst is most likely observed in this case. The bolometric light curve of this event in Fig. 13 confirms this assumption: the two-component light curve of this outburst was retained and even enhanced, while the corresponding dips in the hard light curves of the S outbursts are smeared and virtually disappear in their bolometric light curves (this is particularly clearly seen in the light curves for the outbursts of H 1743-322 occurred in 2010 and 2013).
Soft Radiation in the Hard State
We have already noted above that during phase I of S-outburst development in GX 339-4 its light curves in the soft and hard bands behaved in a correlated way. This can also be clearly seen from Fig. 13 (the 2007 outburst). Such a behavior can be explained only by assuming that the observed soft X-ray radiation from the source is formed in the same disk region as its hard radiation, i.e., in the inner hot zone. Figure 13 shows that during their hard H outbursts, when the boundary of the cold accretion disk region recedes far from the black hole, both X-ray novae GX 339-4 and H 1743-322 also emit a noticeable soft X-ray flux. Obviously, this radiation must be formed in the high-temperature cloud surrounding the black hole.
Grebenev (2020) showed that the X-ray spectrum forming in a cloud of high-temperature plasma, when its intrinsic low-frequency radiation is Comptonized, must behave precisely in this way. As a result of detailed numerical computations including both Compton photon scattering and bremsstrahlung photon production and absorption processes in the plasma, he showed that the hard power-law spectrum typical for X-ray novae naturally extends to the infrared, optical, and ultraviolet ranges and only at lower energies does it transform into a rapidly decaying Rayleigh-Jeans spectrum. Therefore, the soft X-ray radiation observed during the hard state of the nova must be simply a power-law extension of the hard X-ray radiation from the source.
Nature of the Two Types of Outbursts
We saw that the spectral state of the source at a specific time is largely determined by the position of the cutoff radius (the radius at which the cold opaque disk evaporates and transforms into a high-temperature semitransparent disk). However, it is unclear whether this position depends only on the accretion rate onto the black hole or also on the entire history of the X-ray outburst development. It is also unclear what dictates the choice of the type of outburst realized in a given accretion episode.
Figure 14 presents hardness-intensity diagrams for the outbursts of different types observed in the X-ray nova GX 339-4 in 2006–2007 (S type, yellow circles) and in 2013 and 2017 (H type, blue squares). We took the ratio of the 15–50 and 2–4 keV fluxes (the measured RXTE/ASM 1.3–3 keV flux was reduced to the 2–4 keV band) as the hardness and the integrated 2–50 keV flux as the intensity. The fluxes were converted from the photon fluxes in the same way as was described above when constructing Fig. 13. Such diagrams were constructed and studied previously by Belloni (2010).
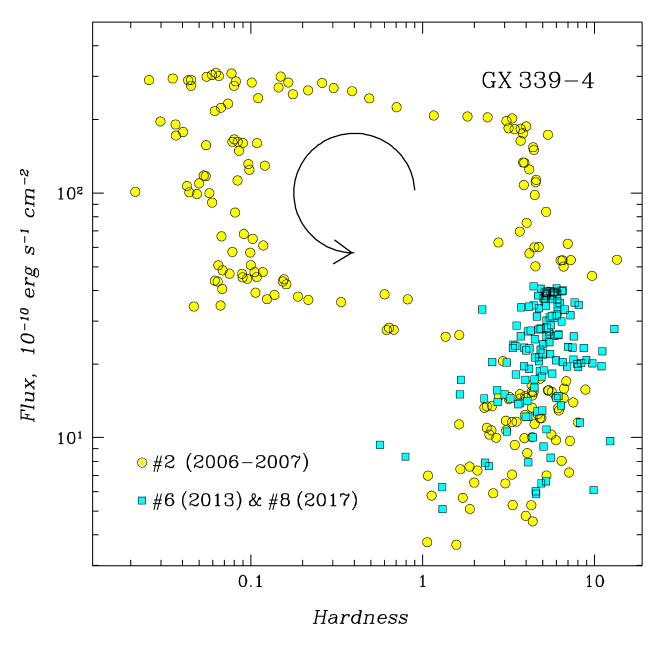
The circular arrow in the figure indicates the course of development of the source’s soft outburst. We see that at the onset of the outburst the source was in the hard state with a hardness . At some time, on reaching the peak flux in the 15–50 keV band, the edge of the cold disk begins to tangibly shift toward the black hole, leading to a dominance of the soft blackbody component in the source’s X-ray spectrum. The radiation hardness drops to , i.e., the source passes to the soft spectral state. It is even possible that the cold edge of the disk reaches the radius of the innermost stable circular orbit near the black hole () and the high-temperature region disappears completely. During the transition between the states the total luminosity of the source (accretion rate) continues to slowly increase. That is why the peak flux in the soft band in such outbursts, as a rule, is reached later and is greater in absolute value that the peak flux in the hard band (see Fig. 10).
After some time the accretion rate begins to drop, the central zone of the cold disk begins to evaporate, and a cloud of high-temperature plasma is again formed around the black hole and begins to increase in size. The spectral hardness rapidly rises to its original value . It is important that the reverse transition from the source’s soft state to the hard one occurs at a noticeably (by an order of magnitude) lower bolometric luminosity (lower accretion rate) than does the direct transition. Clearly, some time delay dependent on the history (hysteresis) is present in the outburst development. However, at the end of its development the outburst reaches the same curve of the hardness-intensity dependency from which it started.
The behavior of the hard (H) outbursts at the initial stage differs little from the behavior of the soft ones. However, subsequently both hard outbursts considered stopped in their development and this happened at the very beginning of the loop formed on this diagram by the soft outburst. After some time they returned back to the region of low fluxes along the same hardness curve along which they came.
It seems quite probable that in these accretion episodes too little matter was transferred to the black hole for a normal powerful (soft) outburst to be formed. The required accretion rate, at which a sufficiently extended outer disk with a high surface density would be formed, was not reached. Since no hysteresis manifestations were observed, the position of the cutoff radius of this disk (its edge) either was entirely controlled by the accretion rate or the disk edge was too far from the center and the disk radiation had no noticeable effect on the observed X-ray spectrum of the source.
CONCLUSIONS
Our analysis of the data from the continuous RXTE, SWIFT, and MAXI monitoring of the recurrent X-ray novae H 1743-322 and GX 339-4 in 2005–2019 shows the following:
-
1.
Depending on the profile shape of the light curves in the soft 2–4 keV and hard 15–50 keV energy bands, the outbursts of these X-ray novae can be assigned to one of several characteristic types: hard (H), soft (S), ultrasoft (U), intermediate (I), and, possibly, micro-outbursts (M).
-
2.
The difference between the types of outbursts is successfully explained in the truncated accretion disk model and is related to the presence (I, S, and U outbursts) or absence (H outbursts) of a powerful soft blackbody component in the source’s broadband X-ray spectrum forming in the outer cold opaque accretion disk region.
-
3.
The appearance of a blackbody component in the source’s X-ray spectrum (phase II of the I, S, and U outbursts) is accompanied by a sharp decrease in its hard X-ray flux (thus, it is associated not just with a change in the surface temperature of the outer disk, but with a shift of its inner edge toward the black hole).
-
4.
The soft X-ray component in the spectra of the X-ray novae during their hard spectral state (during the H outbursts or during phases I and III of the S and U outbursts) is not associated with the cold disk region but is formed in the same hot inner region as the hard radiation (this is suggested by the similarity of the soft and hard light curves for the novae in this spectral state noted above (see also Grebenev et al. 2016); this component is most likely just an extension of the source’s hard power-law spectrum, forming in the inner disk region as a result of Comptonization, to the softer X-ray band).
-
5.
The bolometric light curves for a number of outbursts in the X-ray nova GX 339-4 had a nearly symmetric shape with equal rise and decay phases, they differed sharply from the light curves of the X-ray nova H 1743-322 characterized by a fast rise and a slow decay; the symmetric shape of the light curves can arise from the greater intensity of the outbursts in GX 339-4 and the predominance of Thomson scattering in the opacity of accreting matter in its disk.
-
6.
The dip in the light curve of the X-ray nova GX 339-4 in the soft 2–4 keV band when passing from phase I to phase II of the soft (S and U) outbursts is associated with the change in the shape of the nova spectrum when the soft power-law X-ray component disappears in it and a soft blackbody X-ray component appears (and with the narrowness of the range used to construct this light curve).
-
7.
The faint recurrent burst of activity observed in the hard 15–50 keV light curves for the S and U outbursts of the X-ray nova GX 339-4 during its phase II (simultaneously with the attainment of its peak flux in the soft 2–4 keV band) can also have a different nature than that of the hard outbursts during phases I and III; it can be a consequence of the rise in the surface temperature of the cold part of the disk near its inner edge (Shakura and Sunyaev 1973) or the appearance of a hot corona above the disk (Galeev et al. 1979).
-
8.
The hard outbursts of the X-ray transient GX 339-4 (one or more) always precede its long soft outbursts, whereas the outbursts of the X-ray nova H 1743-322 had a more complex distribution — after the giant 2003 outburst only soft U, S, and I outbursts were observed for 5–6 years, and virtually only hard outbursts occurred subsequently.
-
9.
The choice of which type of outburst is realized at a given time seems to depend only on the attained maximum accretion rate onto the source and, accordingly, on the total mass of the matter transferred during the outburst to the black hole. A soft (powerful) outburst develops only in the case where the accretion rate reaches some critical value. The position of the cutoff (truncation) radius, at which the cold opaque disk evaporates and turns into a high-temperature semitransparent disk, is determined in these outbursts not only by the accretion rate, but also by the entire history of the outburst development. In the hard outbursts the position of the cutoff radius either is entirely controlled by the accretion rate or the cold disk is cut off too far from the black hole to have a noticeable effect on the source’s radiation.
ACKNOWLEDGMENTS
The study is based on the MAXI data provided by RIKEN (JAXA) and the MAXI team, the SWIFT data provided by NASA and the SWIFT team, and the RXTE data provided by the ASM/RXTE team.
FUNDING
A. G., Yu. D., V. K., and K. O. are grateful to the Space
Research Institute of the Russian Academy of Sciences
for the organization of the work practice during which
this study was performed. S. G., I. M., and A.P. are grateful to
Basic Research Program no. 12 of the Russian Academy
of Sciences (“Questions of the Origin and Evolution of
the Universe with the Application of Methods of Ground-Based
Observations and Space Research”) and the Russian
Foundation for Basic Research (project no. 17-02-01079-a) for
their financial support.
References
- [1]
- [2] .D. Barthelmy, L.M. Barbier, J.R. Cummings, E.E. Fenimore, N. Gehrels, D. Hullinger, H.A. Krimm, C.B. Markwardt, et al., Space Sci. Rev. 120, 143 (2005).
- [3]
- [4] .M. Belloni, Lect. Notes Phys. 53 794 (2010).
- [5]
- [6] . M. Cherepashchuk, Close Binary Stars (Fizmatlit, Moscow, 2013) [in Russian].
- [7]
- [8] . Corbel, P. Kaaret, R. P. Fender, A. K. Tzioumis, J. A. Tomsick, and J. A. Orosz, ApJ 632, 504 (2005).
- [9]
- [10] . Espinasse and R. Fender, MNRAS 473, 4122 (2018).
- [11]
- [12] . A. Galeev, R. Rosner, and G. S. Vaiana, ApJ 229, 318 (1979).
- [13]
- [14] . Gehrels, G. Chincarini, P. Giommi, K.O. Mason, J.A. Nousek, A. A. Wells, N. E. White, S. D. Barthelmy, et al., ApJ 611, 1005 (2004).
- [15]
- [16] . A. Grebenev, \astl 46, in press (2020).
- [17]
- [18] . A. Grebenev and I. A. Mereminskiy, \atel 12007, 1 (2018).
- [19]
- [20] . A. Grebenev, R. A. Sunyaev, M. N. Pavlinskii, and I. A. Dekhanov, \sval 17, 413 (1991).
- [21]
- [22] . Grebenev, R. Sunyaev, M. Pavlinsky, E. Churazov, M. Gilfanov, A. Dyachkov, N. Khavenson, K Sukhanov, et al., A&AS 97, 281 (1993).
- [23]
- [24] .A. Grebenev, R.A. Sunyaev, and M.N. Pavlinsky, \asr 19, 15 (1997).
- [25]
- [26] . A. Grebenev, A. A. Lutovinov, and R. A. Sunyaev, \atel 189, 1 (2003).
- [27]
- [28] . A. Grebenev, A. V. Prosvetov, R. A. Burenin, R. A. Krivonos, and A. V. Meshcheryakov, \astl 42, 69 (2016).
- [29]
- [30] . E. Grove, W. N. Johnson, R.A. Kroeger, K. McNaron-Brown, J. G. Skiboe, and B. F. Phlips, ApJ 500, 899 (1998).
- [31]
- [32] . Gursky, H. Bradt, R. Doxsey, D. Schwartz, J. Schwarz, R. Dower, G. Fabbiano, R. E. Griffiths, et al., ApJ 223, 973 (1978).
- [33]
- [34] . Haardt and L. Maraschi, ApJ 380, L51 (1991).
- [35]
- [36] . I. Hynes, D. Steeghs, J. Casares, P. A. Charles, and K. O’Brien, ApJ 583, L95 (2003).
- [37]
- [38] . I. Hynes, D. Steeghs, J. Casares, P. A. Charles, and K. O’Brien, ApJ 609, 317 (2004).
- [39]
- [40] . Jahoda, J. H. Swank, A. B. Giles, M. J. Stark, T. Strohmayer, W. Zhang, and E. H. Morgan, SPIE 2808, 59 (1996).
- [41]
- [42] . Kretschmar, J. Chenevez, F. Capitanio, A. Orr, G. Palumbo, and S. Grebenev, \atel 180, 1 (2003).
- [43]
- [44] . A. Krimm, S. T. Holland, R. H. D. Corbet, A. B. Pearlman, P. Romano, J. A. Kennea, J. S. Bloom, S. D. Barthelmy, et al., ApJS 209, 14 (2013).
- [45]
- [46] . V. Lipunova and N. I. Shakura, A&A 356, 363 (2000).
- [47]
- [48] u. E. Lyubarskii and N. I. Shakura, \sval 13, 386 (1987).
- [49]
- [50] . Makishima, Y. Maejima, K. Mitsuda, H. V. Bradt, R. A. Remillard, I. R. Tuohy, R. Hoshi, and M. Nakagawa, ApJ 308, 635 (1986).
- [51]
- [52] . H. Markert, C. R. Canizares, G. W. Clark, W. H. G. Lewin, H. W. Schnopper, and G. F. Sprott, ApJ 184, L67 (1973).
- [53]
- [54] . B. Markwardt, \atel 136, 1 (2003).
- [55]
- [56] . Matsuoka, K. Kawasaki, S. Ueno, H. Tomida, M. Kohama, M. Suzuki, Y. Adachi, M. Ishikawa, et al., PASJ 61, 999 (2009).
- [57]
- [58] . A. Mereminskiy, E. V. Philippova, R. A. Krivonos, S. A. Grebenev, R. A. Burenin, and R. A. Sunyaev, \astl 43, 167 (2017).
- [59]
- [60] . Meyer, B. F. Liu, and E. Meyer-Hofmeister, A&A 361, 175 (2000).
- [61]
- [62] . Mihara, M. Nakajima, M. Sugizaki, M. Serino, M. Matsuoka, M. Kohama, K. Kawasaki, H. Tomida, S. Ueno, and N. Kawai, PASJ 63, S623 (2011).
- [63]
- [64] . Miyamoto, K. Kimura, and S. Kitamoto, ApJ 383, 784 (1991).
- [65]
- [66] . Motch, M. J. Ricketts, C. G. Page, S. A. Ilovaisky, and C. Chevalier, A&A 119, 171 (1983).
- [67]
- [68] . A. Remillard and J. E. McClintock, ARA&A 44, 49, (2006).
- [69]
- [70] . Revnivtsev, M. Chernyakova, F. Capitanio, N. J. Westergaard, V. Shoenfelder, N. Gehrels, and C. Winkler, \atel 132, 1 (2003).
- [71]
- [72] . I. Shakura and R. A. Sunyaev, A&A 24, 337 (1973).
- [73]
- [74] . I. Shakura and R. A. Sunyaev, MNRAS 175, 613 (1976).
- [75]
- [76] . L. Shapiro, A. P. Lightman, and D. M. Eardley, ApJ 204, 187 (1976).
- [77]
- [78] . F. Steiner, J. E. McClintock, and M. J. Reid, ApJ 745, L7 (2012).
- [79]
- [80] . F. Suleimanov, G. V. Lipunova, and N. I. Shakura, A&A 491, 267 (2008).
- [81]
- [82] . A. Sunyaev and J. Truemper, Nature 279, 506 (1979).
- [83]
- [84] . Sunyaev, V. Arefiev, K. Borozdin, M. Gilfanov, V. Efremov, A. Kaniovskii, R. Churazov, E. Kendziorra, et al., \sval 17, 413 (1991).
- [85]
- [86] . A. Sunyaev, I. Yu. Lapshov, S. A. Grebenev, V. V. Efremov, A. S. Kaniovskii, D. K. Stepanov, S. N. Yunin, E. A. Gavrilova, et al., \sval 14, 327 (1988).
- [87]
- [88] . Swank, \atel 301, 1 (2004).
- [89]
- [90] . H. Swank, R. Remillard, and C. B. Markwardt, \atel 576, 1 (2005).
- [91]
- [92] . Tanaka and N. Shibazaki, ARA&A 34, 607 (1996).
- [93]
- [94] . A. Tomsick and E. Kalemci, \atel 198, 1 (2003).
- [95]
- [96] . R. A. Williams, S. E. Motta, R. Fender, J. Bright, I. Heywood, E. Tremou, P. Woudt, D. A. H. Buckley, et al., MNRAS, in press (2020) [arXiv:1910.00349].
- [97]
- [98] . Winkler, T.J.-L. Courvoisier, G. Di Cocco, N. Gehrels, A. Gimenez, S. Grebenev, W. Hermsen, J.M. Mas-Hesse, et al., A&A 411, L1 (2003).
- [99] . S. Wood, J. F. Meekins, D. J. Yentis, H. W. Smathers, D. P. McNutt, R. D. Bleach, E. T. Byram, T. A. Chupp, et al., ApJS 56, 507 (1984).
- [100]
Translated by V. Astakhov