New_connection \excludeversionOld_connection
A Reassessment of the Evidence for Macroscopic Quantum Tunneling in a Josephson Junction
Abstract
Switching current distributions have for decades been an indispensable diagnostic tool for studying Josephson junctions. They have played a key role in testing the conjecture of a macroscopic quantum state in junctions at millikelvin temperatures. The conventional basis of the test has been the observation of temperature independence of SCD peak widths, and that led to affirmative conclusions about a crossover. A different criterion is proposed here - the distance of the SCD peak from the junction critical current - and its efficacy is demonstrated. This test has distinct advantages in terms of precision, and it is found that, for three example experiments, the evidence for a crossover to the conjectured macroscopic quantum state is unequivocally negative. The implications of this finding for superconducting qubits are considered.
pacs:
74.50.+r, 85.25.Cp, 03.67.LxI Introduction
Soon after the Josephson effect had been confirmed in 1963 a classical equivalent circuit for a Josephson junction was proposed, the so-called RCSJ model. For many decades this RCSJ model was successful in predicting the outcome of experiments on superconducting circuits that employed Josephson devices, and it remains so. At the beginning of the 1980s a hypothesis was advanced Leggett which suggested that a Josephson junction, at temperatures typically below about , would crossover to a “macroscopic quantum” state. If true, this was thought to give rise to a transformation of the junction into an “artificial atom” which was expected to open the door to the development of Josephson qubits. Above about the RCSJ model would still be appropriate, but below that temperature the classical RCSJ model would give way to quantum descriptions.
Experiments were devised for the purpose of confirming the existence of this macroscopic quantum state by seeking evidence of macroscopic quantum tunneling (MQT), just as the earlier experiments had confirmed the Josephson effect itself. These new efforts were based on interpretations of the distributions of switching currents that are exhibited in swept bias experiments. As shown in BCJJAP , the crossover, if it exists, would have a distinct signature that could be easily detected. The first report of success at seeing the crossover effect appeared in 1981 VossWebb . This was followed by a number of studies, all seeming to corroborate the quantum hypothesis. By the end of the 1980s, it was generally considered that the macroscopic quantum state had been validated, and from then on a junction operated at the base temperature of a dilution refrigerator could be presumed to be an artificial atom.
Here the evidence for that presumption is reassessed. A new test is introduced for determining when, or if, a Josephson junction exhibits evidence of macroscopic quantum tunneling, and the test is applied to data from three independent swept bias experiments dating from 1981 to 2013. Theory and experiment are compared, especially in the crucial region below .
II Switching Current Distributions
A Josephson junction with phase has stored potential energy . The pre-factor in this expression is the Josephson energy:
| (1) |
The total potential energy of a junction, when an additional bias current is supplied, is
| (2) |
where . This is the well known washboard potential which consists of periodic wells due to the term superimposed on the tilting action of the bias current. If the applied current is less than the junction critical current () then the system resides in a well of finite depth, but at the well has zero depth. The junction can escape from the well via classical thermal activation Kramers , at a rate
| (3) |
where with being the zero bias Josephson plasma frequency, is the temperature, and is the barrier height.
| (4) |
The barrier height and the plasma frequency are both directly set by the bias current ; as it changes, they change.
If the bias current is steadily increased from zero, then at some moment the junction will escape from the potential well and for light damping bounce down successive wells. This will be indicated by an abrupt switch to a non-zero junction voltage. If the experiment is repeated, the bias at which the junction voltage switches will be different. However if these sweeps are repeated many times, at the same temperature, then the accumulated switching current data may be plotted and a switching current distribution (SCD) peak is the result.
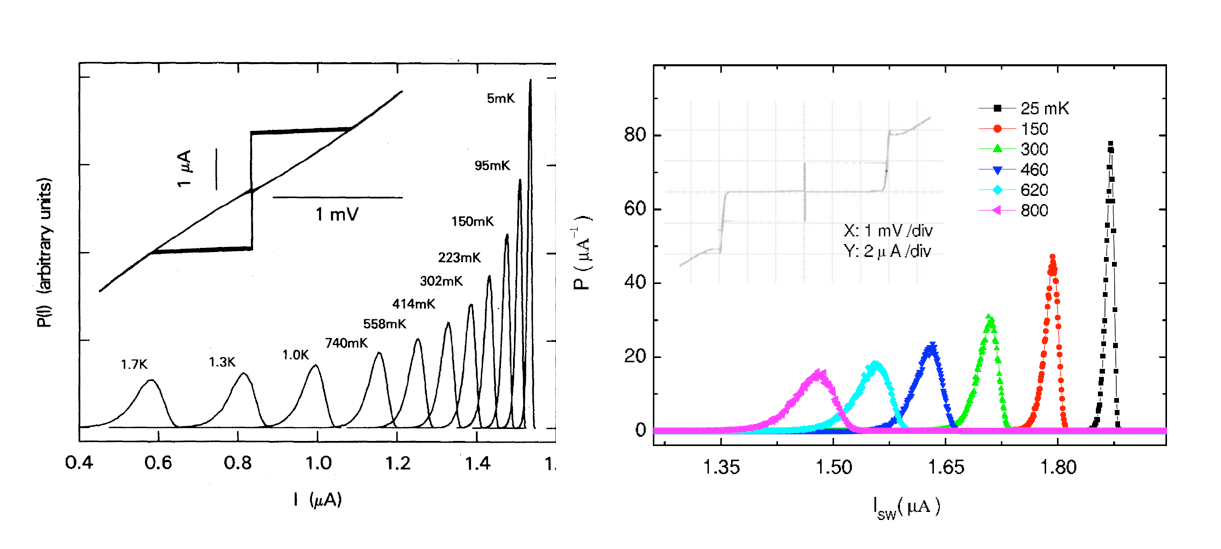
These SCD peaks are the experimental data from which the behavior of the Josephson junction can be surmised. Examples of SCD data from two experiments are shown in Fig. 1. Generally speaking, the behavior of switching current peaks at temperatures above about is in accord with classical thermally induced escape processes.
Swept bias experiments have been central to searches for other phenomena such as microwave induced transitions microwaves .
III Macroscopic Quantum Tunneling
In a macroscopic quantum state escape from a potential well to a finite voltage running mode could happen via macroscopic quantum tunneling (MQT) through the potential barrier, rather than by thermal activation (TA) over the barrier.
| (5) |
where is the quality factor of the junction ().
The expression for escape due to quantum tunneling, Eq.(5), is a limiting form generally considered applicable only for the lowest temperatures. It is a widely held opinion that any judgment as to whether quantum theory actually does describe experiments must include temperature enhancement effects in a revised expression for the escape rate. MQT escape rates are expected to increase slightly with finite temperature. We note that an enhanced escape rate (greater than ) means it is easier to escape from the well, so escape will occur sooner in the sweep. Therefore a finite temperature effect will result in SCD peaks being shifted to lower bias positions. For this reason the MQT escape peak expected from Eq.(5) must represent a maximum possible bias position for an SCD peak; no quantum peak can advance beyond this point no matter how low the sample temperature. So there should be a “cutoff” value for activation peak positions.
This finite temperature effect, as it applies to the particular case of Josephson junctions, appeared in Grabert where the enhanced escape rate in the weak damping limit was obtained from the zero temperature rate Eq.(5) according to the following expressions (Eqs.3.16, 3.3, 3.11 in Grabert ):
| (6) |
where:
| (7) | ||||
| (8) |
with a damping constant for the Josephson junction and is a Riemann number.
The most obvious attribute of macroscopic quantum tunneling, Eq.(5 ), is its temperature independence. As was demonstrated in BCJJAP , even accounting for thermal enhancement, only a small local region around the crossover point is affected, below which temperature independence occurs. Therefore, temperature independence in SCD peaks is the hallmark of a macroscopic quantum state in a Josephson junction.
IV Prevailing Methods for Interpreting SCD Peaks
In 1981 R.F. Voss and R.A. Webb VossWebb reported “the first compelling evidence for the existence of quantum tunneling of a macroscopic variable” in a Josephson junction. They chose to present their experimental data in the form of a plot of SCD peak width versus log temperature. The primacy given to peak width was possibly due to the known dependence of width expected of the thermal activation process. In other words, it might have been thought that a log temperature scale would focus on any deviations from TA theory. However, the supposition that data which deviated from TA expectations would necessarily fall ino a category of vindicating MQT thery is certainly flawed.
The upper panel in Fig. 2 is Fig.3 from VossWebb . The stretching effect of the log temperature scale is quite evident. The dotted line labelled “MQT theory with damping” corresponds to a supposed crossover point at , This presentation is meant to foster the impression that the width data switch to a freezing line, but a careful inspection shows this is not the case - the peak widths continued to decline as the temperature was lowered. Furthermore, the SCD peaks shown in Fig.1 of VossWebb (left panel in Fig. 1)) certainly do not exhibit independence of temperature below , as was claimed in the Abstract of VossWebb - the peak is obviously shifted compared to the peak at .
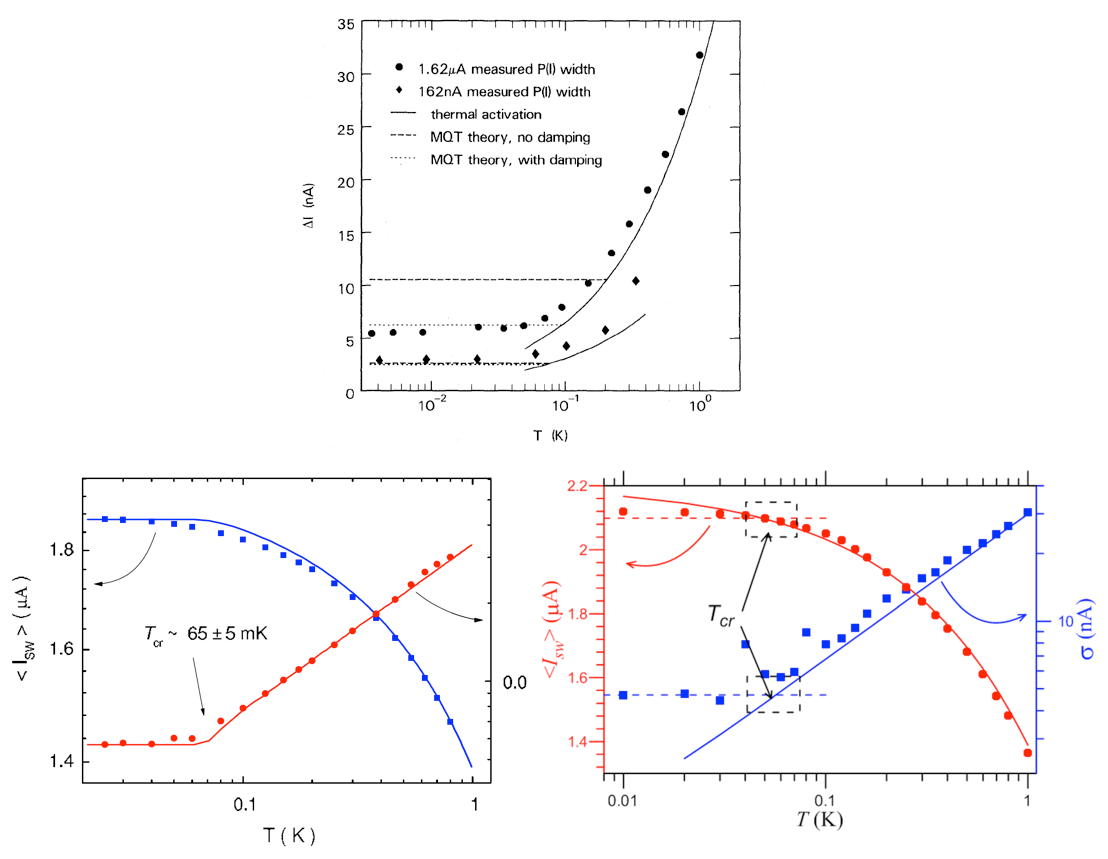
Also shown in Fig.2 are more recent results also claiming to vindicate the MQT hypothesis via observations of SCD peak freezing. The lower left panel is from Yu with a claimed and the lower right panel is from Oelsner with a claimed . Again, the approach set out in VossWebb was followed - temperature scales are logarithmic and the focus is on peak widths. However, values for peak position, are generally more precise because they are of order , whereas peak widths are much smaller at . In these plots, at the lowest temperatures where the peaks have become very narrow, the widths exhibit significant scatter and so the added horizontal lines depicting SCD peak freezing are misleading. Plainly the peaks do not exhibit the temperature independence required of MQT.
V A New Method for Interpreting SCD Peaks
Gross & Marx GrossMarx noted that in the classical regime the width of an SCD escape peak and also its reduced distance below the critical current, (), would both scale as . This same result appeared in Likharev . Because SCD peaks become sharper at low temperatures, their positions () can be pinpointed easily whereas their diminishing widths become increasingly difficult to extract from the peak data. Thus the distance test, () is superior when looking for deviations from classical thermal activation and this approach is now explored.
In Fig.3 we present a plot of reduced distance versus temperature, based on the simulation described in BCJJAP . That simulation employed an algorithm that for the first time was able to generate an entire SCD peak at a given temperature directly from escape rates, either alone or in combination. In this example thermal activation Eq.3 was combined with either macroscopic quantum tunneling Eq.5, or with thermally enhanced macroscopic quantum tunneling Eq.6. It is evident in the figure that above the crossover, thermal activation dominates, while below the crossover MQT or thermally enhanced MQT dominate as the escape mechanism. Also apparent in the simulation output is the fact that thermal enhancement of MQT makes little difference to the outcome and its effects are confined to the small zone around the crossover temperature.
The parameters for this simulation were: , , , with a bias sweep rate of (based on the experiment in Yu ). These are fairly typical values for Josephson junctions with low damping, so apart from the exact numbers on the axes of the plot, this characteristic shape should be seen in experimental data for any junction - if it is undergoing a TA-to-MQT crossover.
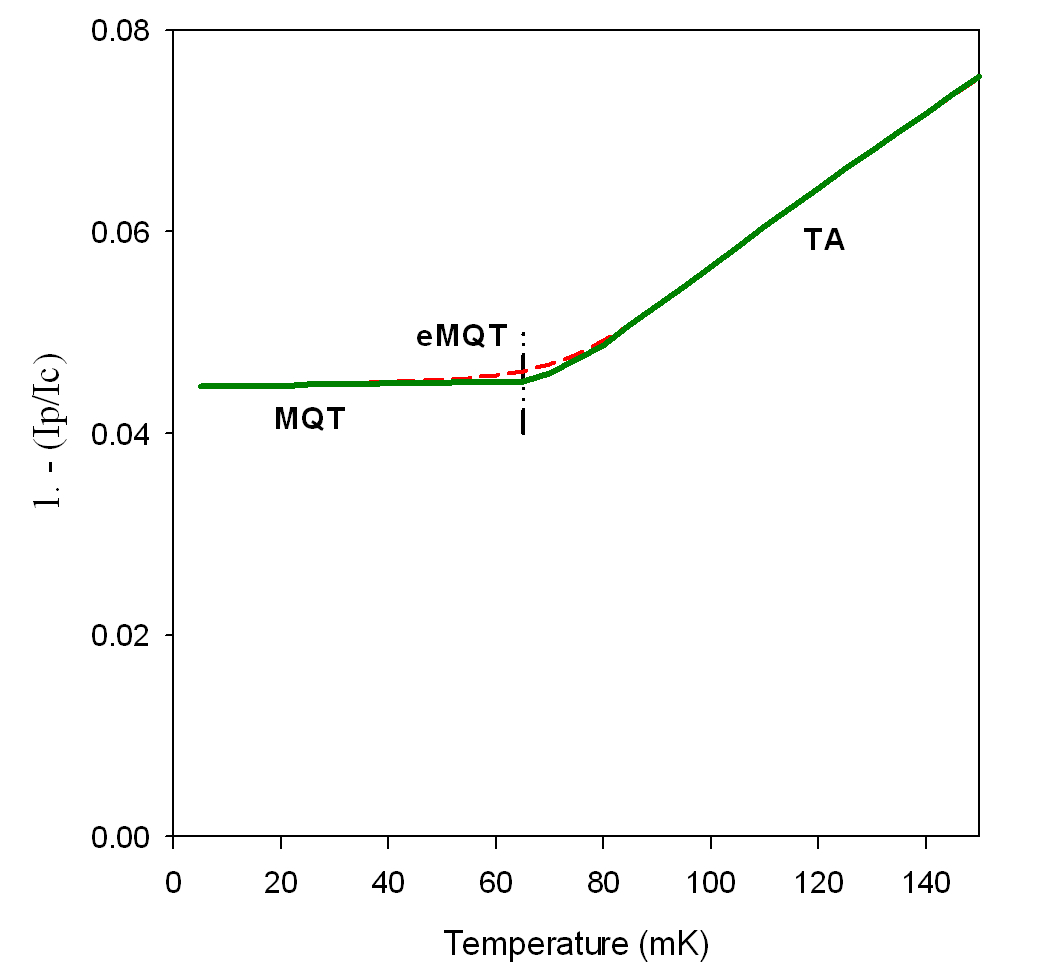
The temperature independence that ultimately occurs below the crossover is the signature of MQT. In Leggett2 the point is made that “for realistic parameter values the crossover should be fairly sharp”, and indeed that is what this simulation shows.
Any experiment must exhibit this behavior if it is to claim an observation of MQT. We now apply this method to the experimental results discussed previously.
V.1 Experiment of Voss & Webb
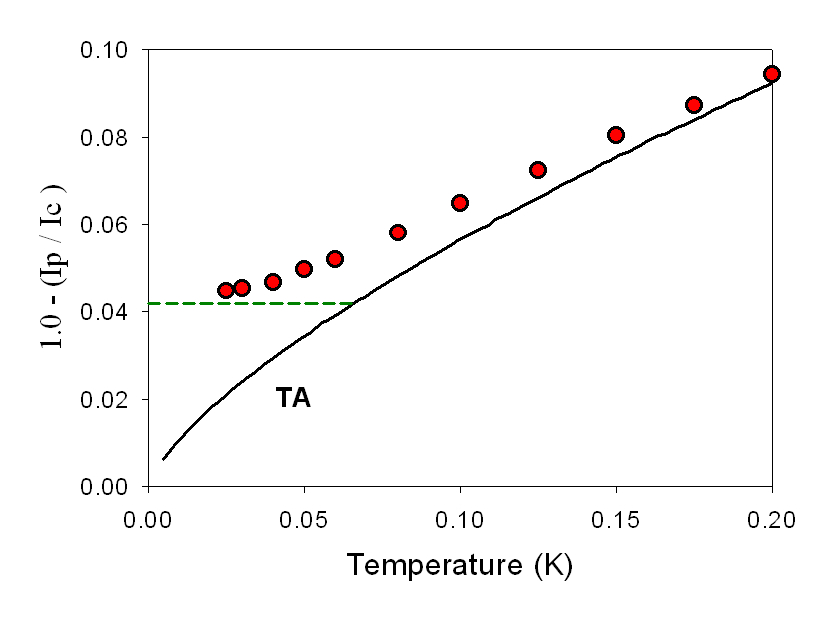
We have digitized the peak positions from Fig.1 of VossWebb . The corresponding distance parameter () is plotted as a function of temperature, with a linear scale, in Fig.4.
Clearly, the experimental data track the thermal activation curve down to about at which point they smoothly peel away from TA. There is no resemblance to Fig.3 and no peak freezing - thus no crossover to macroscopic tunneling.
V.2 Experiment of Yu et al.
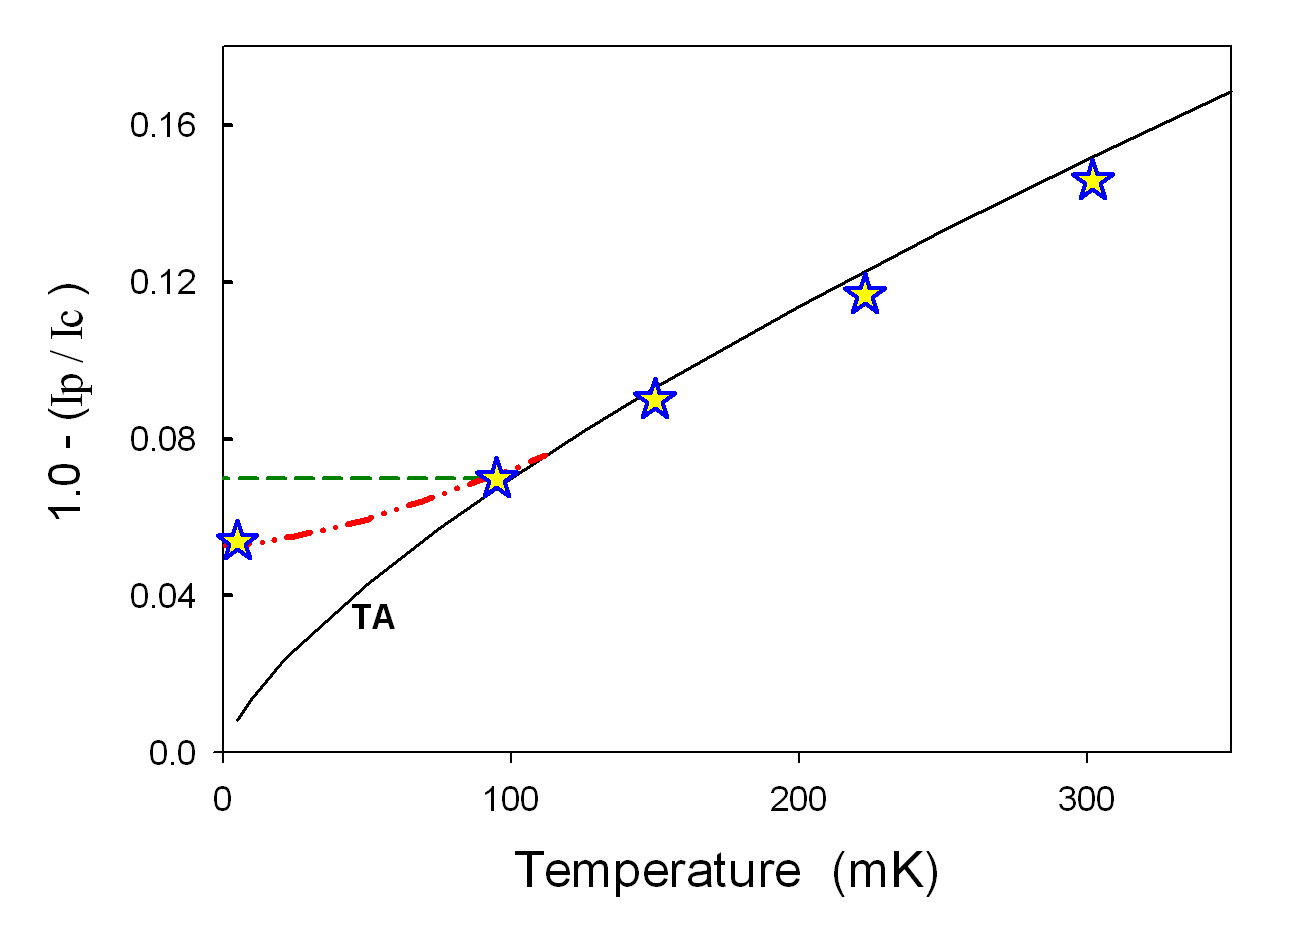
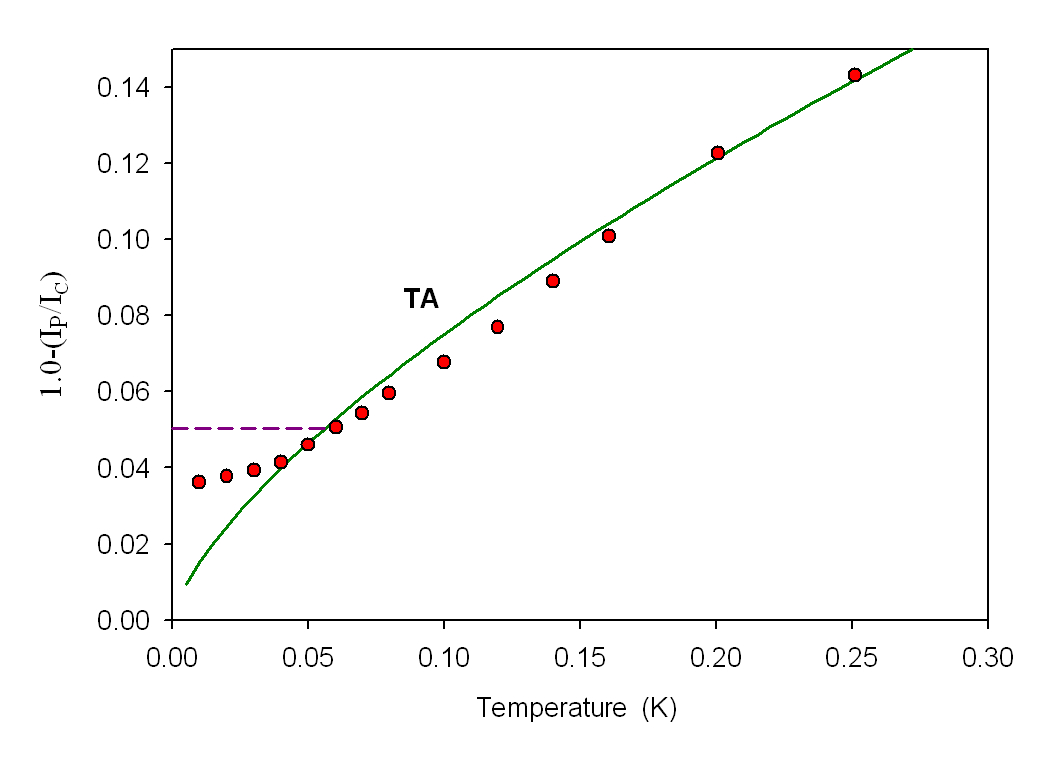
We have digitized the SCD peak positions from Fig.2 of Yu . The corresponding distance parameter () is plotted as a function of temperature, with a linear scale, in Fig. 5.
The crossover temperature for this Josephson junction was given as . As in the preceding case, the trend in experimental data is a gradual peeling away from the TA characteristic. Below there is no temperature independence of the peaks, as shown in Fig.3, and hence no crossover to MQT.
V.3 Experiment of Oelsner et al.
We have digitized the peak positions from Fig. 1 of Oelsner et al. Oelsner and plot them in the distance format of () versus temperature, see Fig. 6. There is obviously a significant departure from simple thermal activation, but as in the previous cases, there is obviously no peak freezing and therefore no evidence of a crossover to MQT.
VI Josephson Qubits
We now consider the impact of our negative conclusion regarding the conjecture of a macroscopic quantum state for Josephson junctions, with paricular regard to superconducting qubit architectures.
A phase qubit is the combination of a Josephson junction and an external source of bias current. The energy of this qubit as a function of the junction phase is
| (9) |
where is the Josephson energy , is the critical current of the junction, and is the bias current normalized to . The first term is the phase dependent junction energy and the second term is the contribution from the bias source. This is the so-called tilted washboard potential. Note that it is the cosine term that superimposes potential wells on the linear bias energy.
A flux qubit is simply a junction in a superconducting loop with an externally applied flux bias . The total energy as a function of the net flux threading the loop, , is
| (10) |
This expression utilizes a connection between junction phase and net loop flux - it is where is the flux quantum. The second term is a parabola whose minimum is positioned at a net loop flux . The system energy is thus a parabola with superimposed potential wells that originate from the Josephson junction. With zero applied flux, the minimum of occurs at the bottom of a single well at . With nonzero applied bias flux, the single well at the bottom splits into two wells separated by a central barrier.
Finally, there is the charge qubit, an arrangement basically consisting of a Josephson junction and a very small metal island (Cooper pair box). For this device, the total energy is
| (11) |
where is the charging energy to place a Cooper pair on the island; is a charge, expressed in units of , induced on the island by an applied gate voltage , and is the number of tunneled Cooper pairs. This device architecture was modified in the “transmon” qubit, introduced in 2007, which yielded enhanced performance leading to “dramatically improved dephasing times” Koch .
It is readily apparent from Eqs. (9,10,11) that all three types of superconducting qubit share a common crucial feature - the potential wells that are created by the Josephson junctions. These wells all have the same initial depth . Discrete energy levels are the sine qua non of qubits - for the case of the transmon, see for example Fig. 3 in Koch and Fig. 1(b) in Orlando .
These Josephson devices can have the possibility of being qubits only if the junction itself is in a macroscopic quantum state. If the well for a Josephson junction is not quantized even at low temperatures, then the wells in the phase qubit, flux qubit, and charge qubit cannot be quantized either. Then those configurations would be similar to other conventional superconducting circuits, for example a Josephson junction coupled to a transmission lineVanDuzer . In that case, Josephson junctions could not form qubits.
VII Summary
Each of the three experiments reviewed here VossWebb Yu Oelsner published in 1981, 2010, and 2013, claimed to confirm the macroscopic quantum tunneling hypothesis. SCD peak freezing is a direct consequence of macroscopic quantum tunneling, as discussed in BCJJAP and exemplified in the simulation results shown in Fig.3. But such freezing did not occur in any of the three experiments. These three devices were typical, not exceptional, so any inference must be applicable to Josephson junctions generally. The essence of the situation is that direct consequences of the expressions for macroscopic quantum tunneling (Eqs.5 and 6) are absent from the experimental observations. The unavoidable conclusion is that no macroscopic quantum tunneling occurred and thus a macroscopic quantum state does not exist in Josephson junctions.
More than a decade ago, a review of superconducting qubits ClarkeWilhelm stated: “The first evidence of quantum behavior in a Josephson junction came from experiments in which macroscopic quantum tunneling was found to occur and energy levels were found to be quantized”; clearly this was a rush to judgement.
Acknowledgement 1
The author expresses his appreciation to Matteo Cirillo for his insightful comments on this work. Niels Grønbech-Jensen made significant contributions to the earlier phases of this project.
References
- (1) A. O. Caldeira and A. J. Leggett, Phys. Rev. Lett. 46, 211 (1981).
- (2) J.A. Blackburn, M. Cirillo, and N. Grønbech-Jensen, Journal of Applied Physics 122, 133904 (2017).
- (3) R.F. Voss and R.A. Webb, Phys. Rev. Lett. 47, 265 (1981).
- (4) H. A. Kramers, Physica 7, 284 (1940).
- (5) H.F. Yu, X.B. Zhu, Z.H. Peng, W.H. Cao, D.J. Cui, Ye Tian, G.H. Chen, D.N. Zheng, X.N. Jing, Li Lu, S.P. Zhao, and S. Han, Phys. Rev. B 81, 144518 (2010).
- (6) J.M. Martinis, M.H. Devoret, J. Clarke, Phys. Rev. Lett. 55, 1543 (1985).
- (7) M. H. Devoret, J. M. Martinis, and J. Clarke, Phys. Rev. Lett. 55, 1908 (1985).
- (8) J.M. Martinis, M.H. Devoret, and J. Clarke, Phys. Rev. B 35, 4682 (1987).
- (9) J.M. Martinis and H. Grabert, Phys. Rev. B 38, 2371 (1988).
- (10) G. Oelsner, L.S. Revin, E. Il’ichev, A.L. Pankratov, H.-G. Meyer, L. Grönberg, J. Hassel, and L.S. Kuzmin, Appl. Phys. Lett. 103. 142605 (2013)
- (11) R. Gross and A. Marx, Eq. 3.4.15 in Chapter 3, Applied Superconductivity: Josephson Effect and Superconducting Electronics, Walter-Meissner-Institute, Garching (2005).
- (12) K.K. Likharev, Dynamics of Josephson Junctions and Circuits, Gordon and Breach Science Publishers, (1986), page 84.
- (13) A.J. Leggett, page 67, Chapter 2 of Fundamentals and Frontiers of the Josephson Effect, F. Tafuri (ed.), Springer Series in Materials Science 2019.
- (14) J. Koch, T.M. Yu, J. Gambetta, A.A. Houck, D.I Schuster, J. Majer, A. Blais, M.H. Devoret, S.M. Girvin, and R.J. Schoelkopf, Phys. Rev. A76, 043319 (2007).
- (15) M.J. Peterer, S.J. Bader, X. Jin, F. Yan, A. Kamal, T.J. Gudmuundsen, P.J. Leek, T.P. Orlando, W.D. Olover, and S. Gustavsson, Phys. Rev. Lett. 114, 010501 (2015).
- (16) Principles of Superconductive Devices and Circuits, T. Van Duzer and C.W. Turner, Elsevier New York (1981).
- (17) J. Clarke and F.K. Wilhelm, Nature 453, 1031(2008).