Constraints on Axion-like Particles from a Hard -ray Observation of Betelgeuse
Abstract
We use the first observation of Betelgeuse in hard -rays to perform a novel search for axion-like particles (ALPs). Betelgeuse is not expected to be a standard source of -rays, but light ALPs produced in the stellar core could be converted back into photons in the Galactic magnetic field, producing a detectable flux that peaks in the hard -ray band (). Using a 50 ks observation of Betelgeuse by the NuSTAR satellite telescope, we find no significant excess of events above the expected background. Using models of the regular Galactic magnetic field in the direction of Betelgeuse, we set a 95% C.L. upper limit on the ALP-photon coupling of GeV-1 (depending on magnetic field model) for ALP masses eV.
Introduction.—Axion-like particles (ALPs) are ultralight pseudoscalar bosons with a two-photon vertex , predicted by several extensions of the Standard Model (see Jaeckel and Ringwald (2010); Di Luzio et al. (2020) for a recent review). In the presence of an external magnetic field, the coupling leads to the phenomenon of photon-ALP mixing Raffelt and Stodolsky (1988). This effect is exploited by several ongoing and upcoming ALP search experiments (see Irastorza and Redondo (2018); Di Luzio et al. (2020); Sikivie (2020) for recent reviews).
The photon-ALP coupling would also cause ALPs to be produced in stellar plasmas via the Primakoff process Raffelt (1986). Therefore astrophysical observations offer unique sensitivity to ALPs. Analyses of the lifetime of helium-burning stars in globular clusters have excluded the couplings (95% confidence level, C.L.) for Ayala et al. (2014); Straniero et al. (2015); Carenza et al. (2020). This is the strongest bound on the ALP-photon coupling in a wide mass range. A comparable bound, (95% C.L.) for , was derived by the CAST experiment, which searches for ALPs produced in the Solar core that are re-converted into -rays in a large laboratory magnetic field Anastassopoulos et al. (2017).
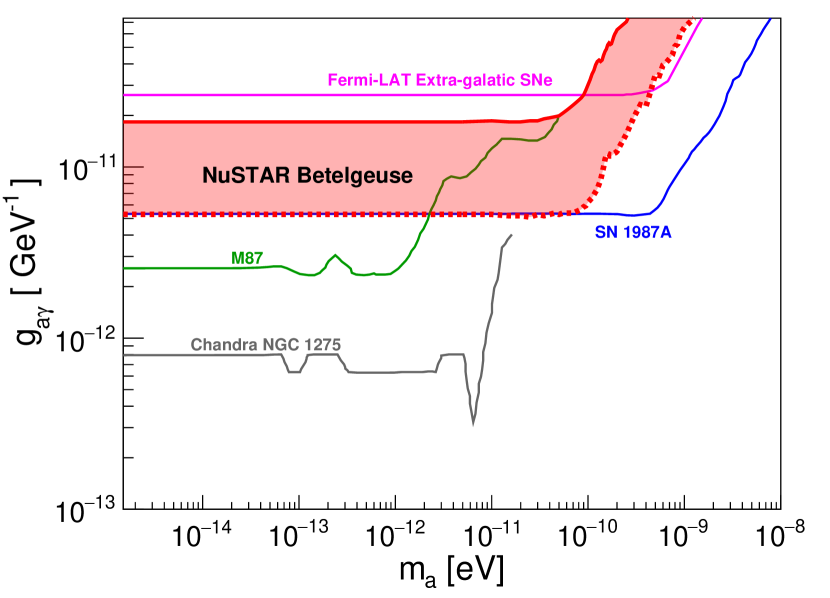
At lower ALP masses, as shown in Fig. 1, more stringent bounds are derived from supernovae and galaxy cluster observations. A recent reanalysis of the SN 1987A limit, derived from the non-observation of gamma-rays induced by conversion in the Galactic magnetic field of ALPs produced in the supernova core, excludes for (95% C.L.) Payez et al. (2015). A search for gamma-ray bursts from extra-galactic supernovae with the Fermi Large Area Telescope (LAT) has yielded a weaker limit, for ALP masses Meyer and Petrushevska (2020), under the assumption of at least one supernova occurring in the LAT field of view. However, the SN 1987A bound has been questioned due to uncertainties on the response of the GRS instrument on the SMM satellite Forrest et al. (1980), and both of these bounds are subject to uncertainties due to the modeling of core-collapse supernovae and Galactic magnetic fields. The most stringent limits to date on low-mass ALPs come from the search for -ray spectral distortions in the active galactic nucleus NGC 1275 at the center of the Perseus cluster, induced by conversion in the intra-cluster medium. These exclude (99.7% C.L.) for Reynolds et al. (2019). However, these results could be weakened by several orders of magnitude if the intra-cluster magnetic field has been mis-modeled Libanov and Troitsky (2020).
Here, we exploit the fact that Betelgeuse, a nearby red supergiant star, provides an excellent laboratory for ALPs, as proposed in a seminal paper by E. Carlson Carlson (1995). Betelgeuse ( Orionis, spectral type M2Iab) is an ideal candidate for ALP searches, as it has a hot core, and thus is potentially a copious producer of ALPs that, after re-conversion in the Galactic magnetic field, produces a photon signal peaked in the hard -ray range, and is in region of Hertzsprung-Russel diagram where no stable corona is expected, and thus has essentially zero standard astrophysical -ray background Posson-Brown et al. (2006). This basic idea can be extended to other stellar objects, such as clusters of hot, young stars Dessert et al. (2020). Betelgeuse has the additional advantage that it is nearby, at a distance Harper et al. (2008, 2017), and thus in a region of the local magnetic field that is relatively easier to constrain with future observations.
In this work, we use a dedicated observation of Betelgeuse by the NuSTAR satellite telescope to derive limits on the ALP-photon coupling (95% C.L.) for masses (depending on the assumed value of the regular Galactic magnetic field). We derive a range of ALP spectra expected from Betelgeuse, depending on its precise evolutionary stage. We then derive the expected -ray spectra after conversion in the regular Galactic magnetic field, and compare to our spectral measurement in the energy range 3–79 keV. For low-mass ALPs, these limits are a factor of 3 deeper than the limits from CAST, and are comparable to the limits expected from next-generation ALP experiments such as ALPS-II Bähre et al. (2013) and BabyIAXO Armengaud et al. (2019); Di Vecchia et al. (2019). They are competitive with the constraints from SN 1987A, though with independent sources of systematic uncertainty. We emphasize that the preponderance of astrophysical exclusions that overlap in this region of parameter space, each with a separate modeling assumptions and sources of uncertainty, builds confidence in the robustness of these constraints.
ALP and photon fluxes from Betelgeuse.—In the minimal scenarios, ALPs have only a two-photon coupling, described by the Lagrangian Raffelt and Stodolsky (1988):
| (1) |
This interaction allows for ALP production in a stellar medium primarily through the Primakoff process, in which thermal photons are converted into ALPs in the electrostatic field of ions, electrons and protons. The ALP production rate via the Primakoff process in a stellar core can be calculated as (see, e.g., Carlson (1995)),
| (2) | |||||
where is the photon energy, the temperature, and with the inverse of the screening length, introduced by the finite range of electric field surrounding charged particles in the plasma. Once produced, ALPs can easily escape the star since their mean free path in stellar matter is sufficiently large for the values of mass and coupling we are interested in. The total ALP spectrum can then be obtained by integrating Eq. (2) over the volume of the star, , which can be well parametrized by fitting the stellar model (see Supplementary Material for details).
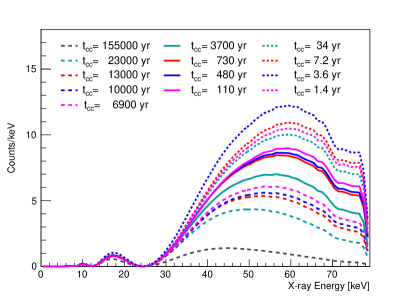
The ALP spectrum thus depends on the physical structure and chemical evolution of the star. Betelgeuse, due to its relative proximity, has fairly well-constrained observed values of luminosity, effective temperature, and metallicity (see Supplementary Material). However, the time until core-collapse is not well known, and as the temperature and density of the core increase as the star approaches supernova, this introduces significant uncertainty on the predicted ALP spectra. We use the Full Network Stellar evolution code (FuNS Straniero et al. (2019)) to derive 13 models of the Betelgeuse ALP source spectrum, parametrized by the time until core-collapse, . These range from an optimistic ALP production scenario ( = 1.4 yr) to a conservative ALP flux scenario ( = yr), as shown in Tab. S1.
The interaction in Eq. (1) may also trigger ALP–photon oscillations in external magnetic fields, such as those found in our galaxy, thus producing a detectable -ray flux. The calculation of the ALP-photon re-conversion probability simplifies if we restrict ourselves to the case in which is homogeneous. The magnetic field of the Galaxy is known to change on scales of 1 kpc, corresponding to the arm and inter-arm regions, and between the Galactic disk and halo Han (2017); Jansson and Farrar (2012); Xu and Han (2019). Motivated by the relative proximity of Betelgeuse in the Galactic disk, we assume conversion in a homogenous regular magnetic field. Although the magnetic structure of the Galaxy is certainly more complex – including turbulent fields with coherent lengths (200 pc) or smaller Xu and Han (2019); Pelgrims et al. (2020); Beck et al. (2016), such as due to supernovae, molecular clouds, and our own Local Bubble – this assumption follows the convention of previous astrophysical bounds, e.g. SN 1987A Payez et al. (2015). This allows for consistent comparison between constraints. A detailed treatment of the effect of magnetic field correlations lengths and amplitudes on the conversion probability is deferred to a later dedicated theoretical study.
In this framework, the differential photon flux per unit energy arriving at Earth is
| (3) |
The ALP-photon conversion probability is Bassan et al. (2010):
| (4) |
where is the transverse magnetic field, namely its component in the plane normal to the path between Earth and Betelgeuse, is the momentum transfer, and is the magnetic field length.
| (5) | |||||
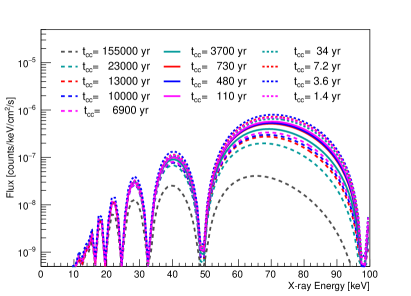
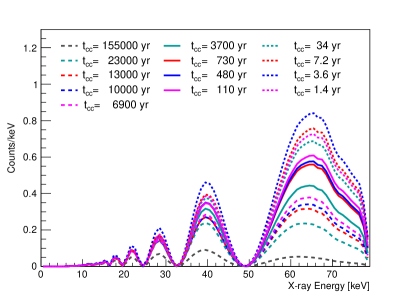
is the electron density Cordes and Lazio (2002). Practically, the differential photon flux per unit energy arriving at Earth can be numerically calculated by Eq. (S2) where the parameters are fitted with stellar evolution model and listed in Tab. S1. The predicted ALP-photon spectra are illustrated in Fig. S2.
For small values of (small ALP mass) and our assumed homogenous field, the expected ALP flux does not depend strongly on the distance to the source, as the drop in flux with distance is compensated by an increase in the conversion probability (Eq. (4–5)). Thus we ignore any uncertainty due to the distance to Betelgeuse for the small ALP masses considered here. For large (for large ALP mass), the increase in the conversion probability with the distance is lost because of incoherence effects.
Even within the simplifying assumption of a uniform regular magnetic field, the exact value of the magnetic field in the direction of Betelgeuse introduces a considerable source of uncertainty in our estimate of the -ray flux. The reported values of the local regular magnetic field, translated to in the direction of Betelgeuse, vary between 0.4 G Jansson and Farrar (2012) and 3.0 G Harvey-Smith et al. (2011). Here we are using 1.4 G Xu and Han (2019) as a representative value and 0.4 G and 3.0 G as the lower and upper bound.
Spectral analysis.—The NuSTAR observatory Harrison et al. (2013); Madsen et al. (2015); Perez et al. (2019); Roach et al. (2020) is the first focusing high-energy -ray telescope in orbit. Its 3–79 keV energy range is ideal for probing ALP signals from Betelgeuse. NuSTAR has two identical co-aligned telescopes, each consisting of an independent optic and focal-plane detector, referred to as FPMA and FPMB. Each telescope subtends a field-of-view of approximately , with a half-power diameter of for a point source near the optical axis.
We use a dedicated NuSTAR observation of Betelgeuse taken on 23 August 2019 (ObsID 30501012002). We processed the data using the standard NuSTAR data reduction pipeline, NuSTARdas v1.8.1 distributed in heasoft v6.24, and the latest calibration package (CALDB.indx20191219). We used the flags SAAMODE=OPTIMIZED and TENTACLE=YES to exclude time intervals with elevated instrument backgrounds, coinciding with the telescope passing through the South Atlantic Anomaly (SAA). After this filtering, the total cleaned exposure was 49.2 ks for FPMA, and 48.4 ks for FPMB.
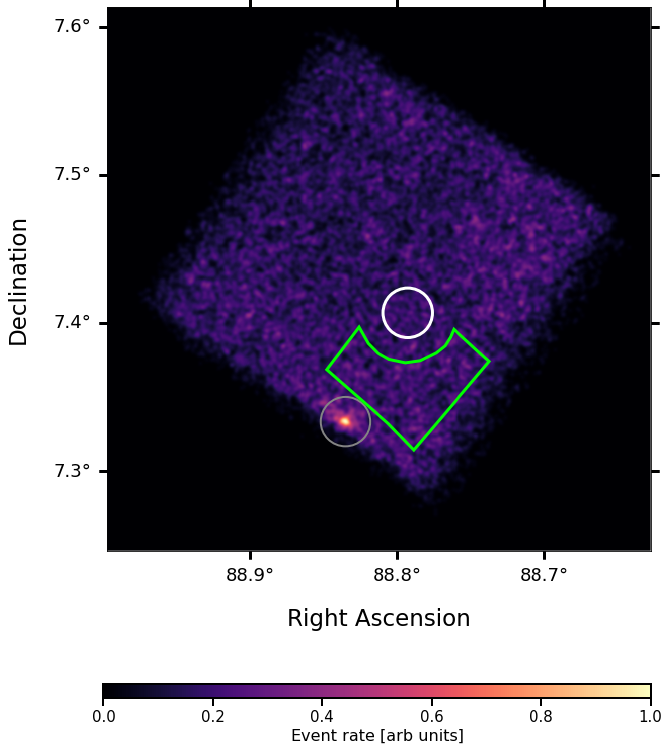
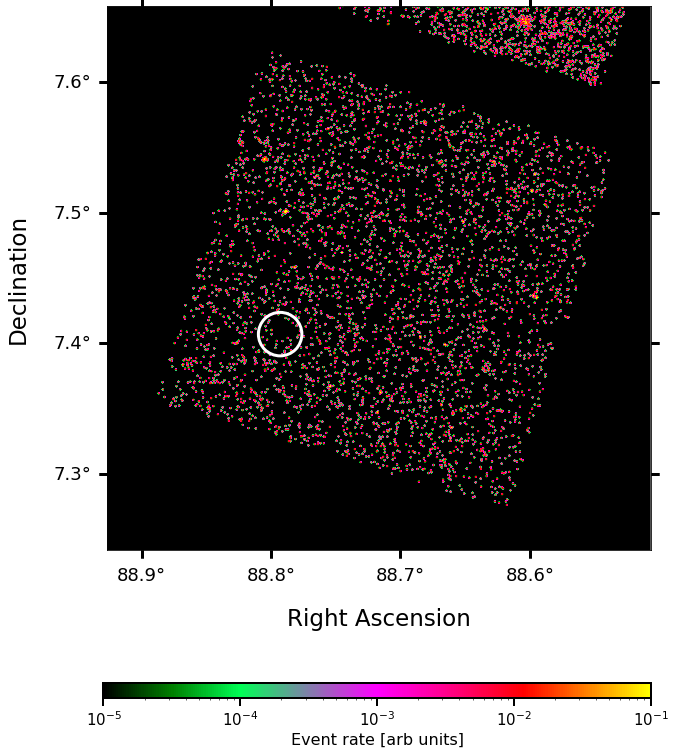
We extract spectra with nuproducts, using a circular source region of radius around the star’s equatorial coordinates (RA 88.79293∘, Dec. 7.40706∘) van Leeuwen (2007). We simultaneously extract the instrument response files used to generate the ALP signal spectra that would be observed in this same region, in particular the Auxiliary Response File (ARF) which defines the energy-dependent effective area for this source region, and the Redistribution Matrix File (RMF) which contains the detector quantum efficiency and energy resolution Harrison et al. (2013).
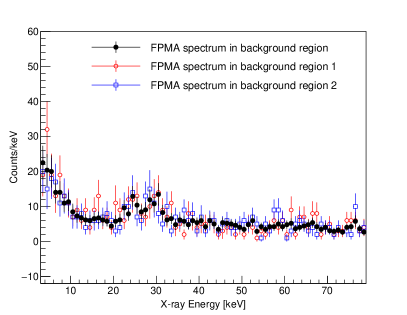
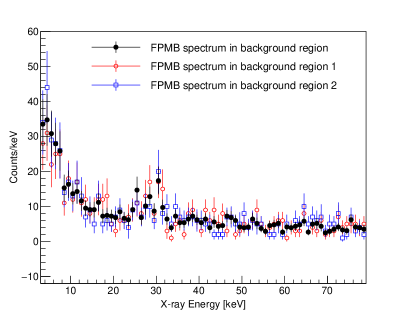
We extract background spectra from nearby regions, as shown in Fig. S3. These regions are separated from the center of the source region by at least in order to ensure that contamination from the source region is below the level of . In addition, we observe a point source near the edge of both FPMs, whose position is consistent with Chandra source Evans et al. (2010). This source is not detected above 10 keV, but to be conservative we choose the background region to be at least from this object. The background region is chosen to be on the same detector chip as the source region, in order to properly describe any spatially-varying backgrounds. In particular, the NuSTAR instrumental background, including -ray lines resulting from fluorescence/activation of the instrument materials, is known to vary between detector chips, and the stray light from the cosmic -ray background varies radially along the detector plane Wik et al. (2014). Our results are robust to alternate choices of background region, as shown in the Supplementary Material.
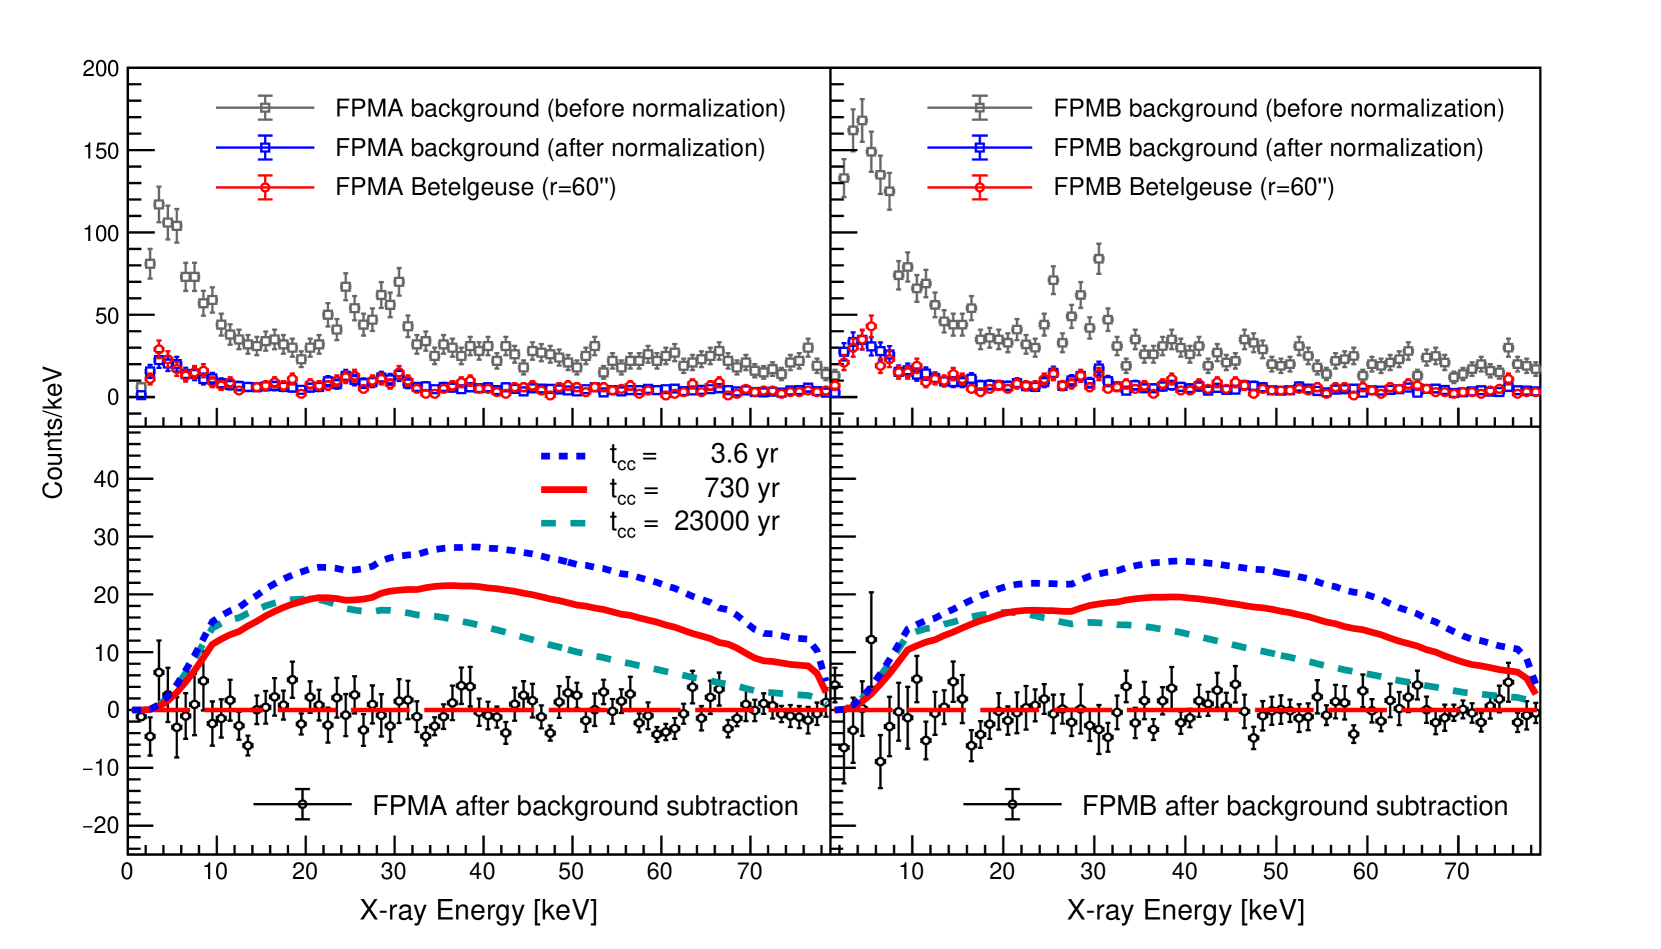
The observed -ray spectra for FPMA and FPMB in the source region and background region are shown in top panel of Fig. 2. Both source and background rates are higher for FPMB than for FPMA, due to the higher instrumental background in this detector. The background-subtracted source spectra are shown in the lower panel of Fig. 2. These were prepared by normalizing the background spectra by the area of the source extraction region, following the procedure in nuproducts. After background subtraction, the source spectrum fluctuates around zero counts. We confirm that our upper limit on the background-subtracted count rate from Betelgeuse is consistent with that measured in soft -rays (0.3–8 keV) using data from Chandra (see the Supplementary Material).
The source spectra after the background subtraction is compared to examples of the predicted -ray spectra from ALP production, for the case of , and , also shown in the lower panel of Fig. 2. We numerically calculate the ALP-produced photon spectrum that would be detected by NuSTAR by folding the predicted spectrum from Eq. (S2) through the instrument response files extracted by nuproducts for this source region.
Data analysis and results.—Based on the predicted number of photons from ALPs () and the expected number of background events () in our source region, we first optimized the energy range used for our analysis by maximizing the figure-of-merit /. This was done before inspecting our source data. Because of the difference in shape for the predicted ALP spectra, we use three different energy ranges: 10–60 keV for the model with = 1.55 yr, 10–70 keV for = 6900–23000 yr, and 10–79 keV for = 1.4–3700 yr. The number of source events () and expected background events () in the optimized energy ranges for FPMA and FPMB are listed in Tab. 1. The observed events in Betelgeuse source region are consistent with the expected background events within the statistic uncertainties for both FPMA and FPMB.
| Photon Energy | FPMA | FPMB | ||
| 10—60 keV | 313 | 315.8 | 352 | 362.7 |
| 10—70 keV | 354 | 359.8 | 397 | 406.4 |
| 10—79 keV | 384 | 392.7 | 433 | 441.2 |
To fit the data, an unbinned likelihood function is constructed as Junk (1999)
| (6) |
where
| (7) |
Here, is the total number of events observed in our source region, and ) is the total number of events expected in our source region for the case of an ALP signal. is the energy-dependent ALP signal PDF, defined for given , , , and (examples are shown in the lower panel of Fig. 2 and Fig. S2). is the background PDF, obtained by normalizing the background spectrum to the source region size using nuproducts, as described above. and are the nuisance parameter and fractional systematic uncertainty of the background; Gauss(, ) is the Gaussian penalty term. Given the statistics of expected background events in the observation region, is set at 10% for both FPMA and FPMB, but allowed with independent Gaussian fluctuation.
The standard profile likelihood test statistic Cowan et al. (2011); Feldman and Cousins (1998) is used to derive constraints on the ALP-photon coupling . The test statistic is defined as
| (8) |
For each choice of , , and , we scan through the ALP-photon coupling , and perform two maximum likelihood fits, one with the as its best fit value , and the other with fixed at . The nuisance parameters are all allowed to vary in both to achieve the best fit. We derive the 95% C.L. upper limit on assuming ) follows a half- distribution with a single degree of freedom Cowan et al. (2011).
The main sources of uncertainty on the ALP signal are the choice of stellar model () and assumed value of the transverse local Galactic magnetic field strength (). Rather than accounting for these as nuisance parameters in the likelihood function, we derive separate 95% C.L. limits on for each of the 13 stellar models for each of our three assumed values of .
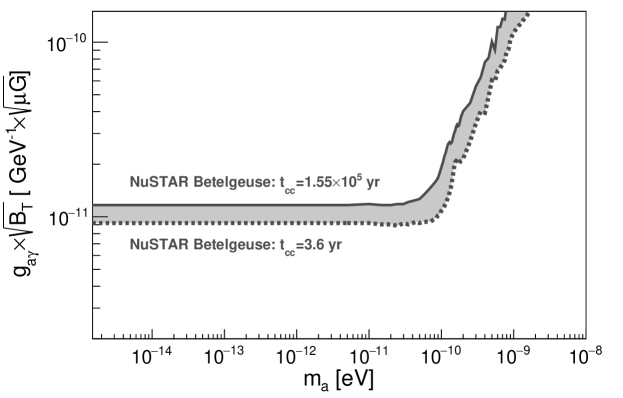
The final 95% C.L. upper limit on is shown in Fig. 3 and Fig. 1. The region labeled in red is excluded by this work while the width of the light red band reflects the uncertainty due to choice of stellar model and . Using our most conservative assumptions ( = 1.55 yr and = 0.4 ), we set an upper limit of for . In the scenario that predicts the highest ALP flux ( = 3.6 yr and = 3.0 ), we derive an upper limit of for .
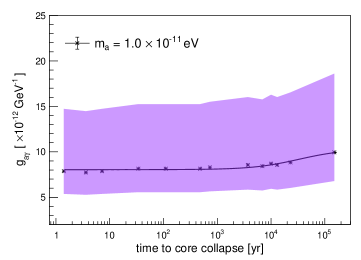
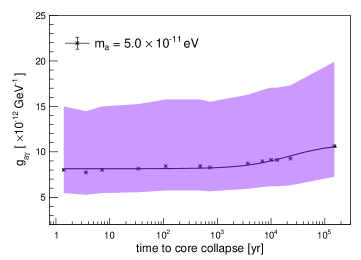
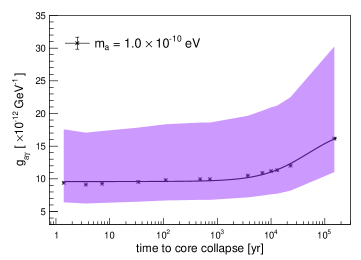
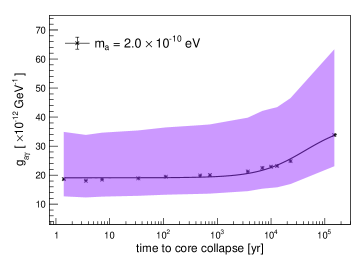
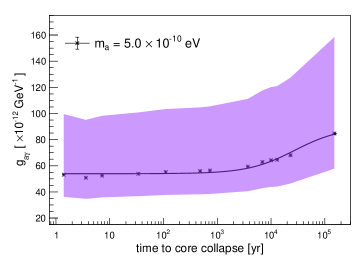
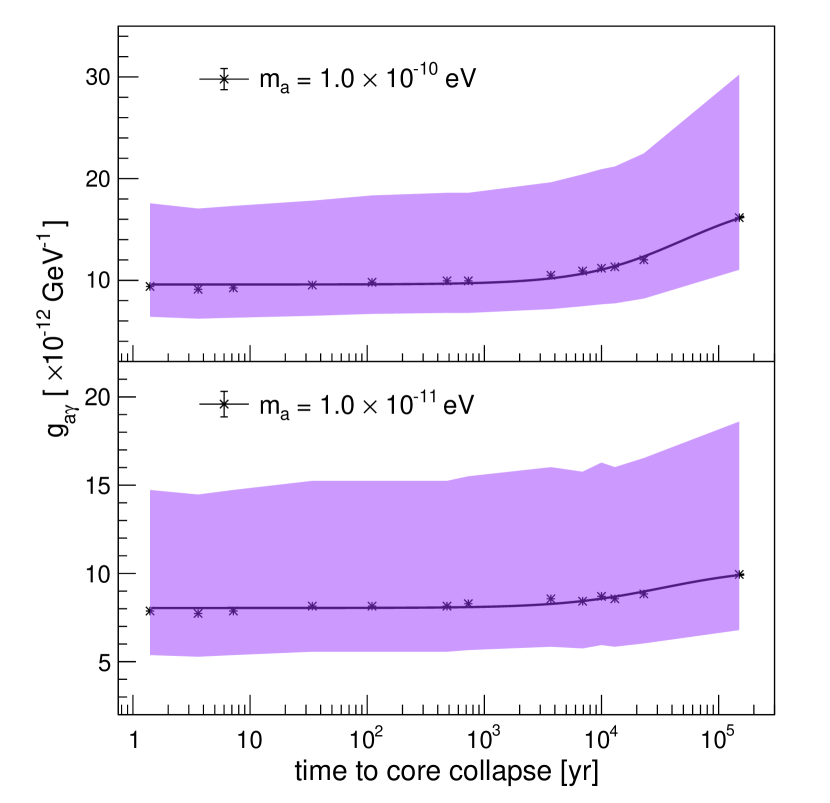
The uncertainty in our derived limit is dominated by our choice of , since the ALP-photon conversion probability of Eq. (4) scales as . The separate contributions to the uncertainty are illustrated in Fig. 4, which shows the evolution of our derived for different . The solid black line is a fit to the derived for = 1.4 , shown by the black points. The width of the magenta band then indicates the uncertainty due to our lower and upper bounds on . The dependence on our assumed is further illustrated in Fig. S6, where we show our constraint in terms of for our range of .
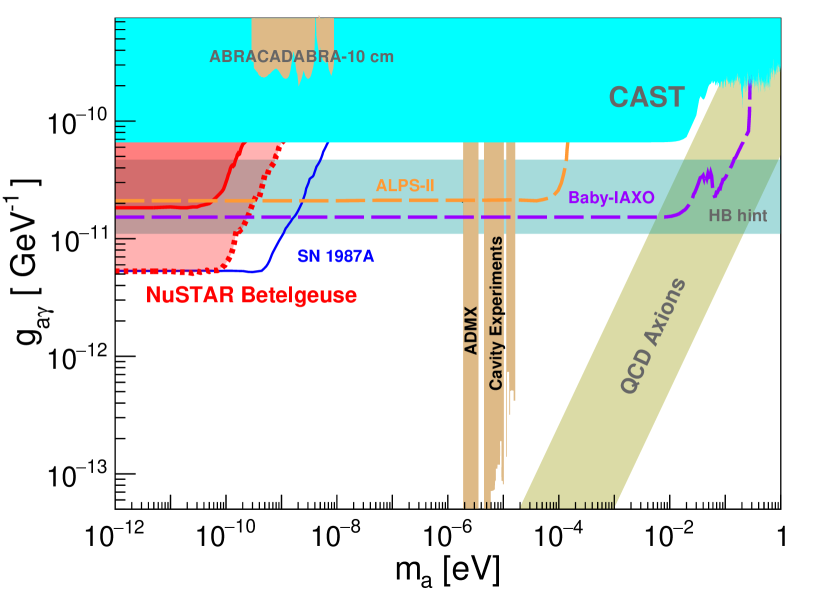
Conclusions and Discussions.—Fig. 3 shows the current theoretical and experimental ALP landscape. This includes the current constraints from CAST Anastassopoulos et al. (2017), ABRACADABRA-10cm Ouellet et al. (2019a), and cavity experiments such as ADMX Braine et al. (2020). The yellow band indicates the preferred region in which the axion couples to quantum chromodynamics (QCD) and could be a solution to the strong-CP problem Di Luzio et al. (2017), and the hatched band indicates the region where an ALP could explain the observed excess cooling of horizontal branch stars Giannotti et al. (2016, 2017). The limits derived in this work exceed those set by CAST by a factor of 3 for , and are comparable in this low-mass space to the sensitivity of even next-generation experiments such as ALPS-II Bähre et al. (2013) and BabyIAXO Armengaud et al. (2019); Di Vecchia et al. (2019).
Fig. 1 compares our result to other astrophysical constraints in the low-mass ALP regime. Our most conservative limit exceeds the bounds from extra-galactic supernovae Meyer and Petrushevska (2020) for eV, and in our most optimistic ALP flux scenario our limit is comparable to that derived from the non-observation of gamma-rays from SN 1987A Payez et al. (2015). However, the supernova bounds have been questioned due to the modeling of core-collapse supernovae. For eV, our limits are superseded by those derived from the lack of spectral variation observed by Chandra in the active galactic nucleus NGC 1275 Reynolds et al. (2019) and in the core of M87 Marsh et al. (2017). We caution, though, that more recent analysis shows that these results could be weakened by several orders of magnitude depending on the relative magnitude of the regular and turbulent intracluster magnetic fields that are assumed Libanov and Troitsky (2020).
We emphasize that since each of these astrophysical constraints has unique sources of systematic error that may affect the final result, it is worthwhile to survey similar regions of parameter space with multiple techniques. The constraints presented here assume conversion in a homogeneous regular magnetic field, which allows for consistent comparison with previous astrophysical bounds, e.g. SN 1987A Payez et al. (2015). Although the magnetic structure of the Galaxy is certainly more complex, compared to more distant sources, the proximity of Betelgeuse should allow future observations to better constrain the relevant small-scale variations in magnetic structure, especially the ultra-local magnetic fields of the Solar region which are not yet completely mapped (e.g. Salvati (2010); Frisch et al. (2012); Xu and Han (2019)). The combination of the novel ALP constraint presented here with multiple overlapping astrophysical constraints, each with separate modeling assumptions and uncertainties, builds confidence in the robustness of the exclusion of this corner of parameter space for low-mass ALPs.
We finally comment that a synergy between our astrophysical approach and direct ALP searches might lead to surprises and also unexpected benefits. Indeed, it might be that a future low-mass ALP experiment such as ABRACADABRA Ouellet et al. (2019b), DM-Radio Silva-Feaver et al. (2017), or IAXO Armengaud et al. (2019) would discover an ALP in the region where optimistic assumptions on Galactic -field and stellar model would have led to an exclusion from Betelgeuse. In this case one would come back to our original assumptions. Taking into account the typical uncertainty on the -field one would give a lower limit on the time until the core-collapse for Betelgeuse, as shown in Fig. 4 for an ALP mass and a coupling in the range . Intriguingly ALPs might represent the only possibility to extract such information about the fate of Betelgeuse.
I Acknowledgements
We thank D. R. Wik and S. Rossland for helpful discussions on the NuSTAR instrument background; J.L. Han and S. Zhang for discussions concerning the Galactic magnetic field in the direction of Betelgeuse; Benjamin Safdi, Christopher Dessert, John Beacom, Shunsaku Horiuchi and Kenny C. Y. Ng for helpful comments and discussions. The NuSTAR observations described in this work were awarded under NASA Grant No. 80NSSC20K0031. The computational aspects of this work made extensive use of the following packages: saoimage ds9 distributed by the Smithsonian Astrophysical Observatory; the scipy ecosystem, particularly matplotlib and numpy; and astropy, a community-developed core python package for Astronomy. This research has made use of data and software provided by the High Energy Astrophysics Science Archive Research Center (HEASARC), which is a service of the Astrophysics Science Division at NASA/GSFC and the High Energy Astrophysics Division of the Smithsonian Astrophysical Observatory. We thank the NuSTAR Operations, Software and Calibration teams for support with the execution and analysis of these observations. This research made use of the NuSTAR Data Analysis Software (NuSTARDAS), jointly developed by the ASI Science Data Center (ASDC, Italy) and the California Institute of Technology (USA). M.X. and M.G. were supported by NASA Grant No. 80NSSC20K0031. O.S. has been supported by the Agenzia Spaziale Italiana (ASI) and the Instituto Nazionale di Astrofsica (INAF) under the agreement n. 2017-14-H.0 - attività di studio per la comunità scientifica di Astrofisica delle Alte Energie e Fisica Astroparticellare. A.M. is partially supported by the Italian Istituto Nazionale di Fisica Nucleare (INFN) through the “Theoretical Astroparticle Physics” project and by the research grant number 2017W4HA7S “NAT-NET: Neutrino and Astroparticle Theory Network” under the program PRIN 2017 funded by the Italian Ministero dell’Università e della Ricerca (MUR). B.G. was supported under NASA contract NNG08FD60C.
References
- Di Luzio et al. (2020) Luca Di Luzio, Maurizio Giannotti, Enrico Nardi, and Luca Visinelli, “The landscape of QCD axion models,” Phys. Rept. 870, 1–117 (2020), arXiv:2003.01100 [hep-ph] .
- Jaeckel and Ringwald (2010) Joerg Jaeckel and Andreas Ringwald, “The Low-Energy Frontier of Particle Physics,” Ann. Rev. Nucl. Part. Sci. 60, 405–437 (2010), arXiv:1002.0329 [hep-ph] .
- Raffelt and Stodolsky (1988) Georg Raffelt and Leo Stodolsky, “Mixing of the Photon with Low Mass Particles,” Phys. Rev. D 37, 1237 (1988).
- Sikivie (2020) Pierre Sikivie, “Invisible Axion Search Methods,” arXiv e-prints (2020), arXiv:2003.02206 [hep-ph] .
- Irastorza and Redondo (2018) Igor G. Irastorza and Javier Redondo, “New Experimental Approaches in the Search for Axion-Like Particles,” Prog. Part. Nucl. Phys. 102, 89–159 (2018), arXiv:1801.08127 [hep-ph] .
- Raffelt (1986) Georg G. Raffelt, “Astrophysical Axion Bounds Diminished by Screening Effects,” Phys. Rev. D 33, 897 (1986).
- Ayala et al. (2014) Adrian Ayala, Inma Domínguez, Maurizio Giannotti, Alessandro Mirizzi, and Oscar Straniero, “Revisiting the Bound on Axion-Photon Coupling from Globular Clusters,” Phys. Rev. Lett. 113, 191302 (2014), arXiv:1406.6053 [astro-ph.SR] .
- Straniero et al. (2015) Oscar Straniero, Adrian Ayala, Maurizio Giannotti, Alessandro Mirizzi, and Inma Dominguez, “Axion-Photon Coupling: Astrophysical Constraints,” in 11th Patras Workshop on Axions, WIMPs and WISPs (2015) pp. 77–81.
- Carenza et al. (2020) Pierluca Carenza, Oscar Straniero, Babette Döbrich, Maurizio Giannotti, Giuseppe Lucente, and Alessandro Mirizzi, “Constraints on the coupling with photons of heavy axion-like-particles from Globular Clusters,” Phys. Lett. B 809, 135709 (2020), arXiv:2004.08399 [hep-ph] .
- Anastassopoulos et al. (2017) V. Anastassopoulos et al. (CAST), “New CAST Limit on the Axion-Photon Interaction,” Nature Phys. 13, 584–590 (2017), arXiv:1705.02290 [hep-ex] .
- Payez et al. (2015) Alexandre Payez, Carmelo Evoli, Tobias Fischer, Maurizio Giannotti, Alessandro Mirizzi, and Andreas Ringwald, “Revisiting the SN1987A Gamma-Ray Limit on Ulltralight Axion-Like Particles,” J. Cosm 02, 006 (2015), arXiv:1410.3747 [astro-ph.HE] .
- Meyer and Petrushevska (2020) Manuel Meyer and Tanja Petrushevska, “Search for Axionlike-Particle-Induced Prompt Gamma-Ray Emission from Extragalactic Core-Collapse Supernovae with the Fermi Large Area Telescope,” Phys. Rev. Lett. 124, 231101 (2020), arXiv:2006.06722v2 [astro-ph.HE] .
- Forrest et al. (1980) D. J. Forrest et al., “The Gamma Ray Spectrometer for the Solar Maximum Mission,” Solar Physics 65, 15–23 (1980).
- Marsh et al. (2017) M.C. David Marsh, Helen R. Russell, Andrew C. Fabian, Brian P. McNamara, Paul Nulsen, and Christopher S. Reynolds, “A New Bound on Axion-Like Particles,” J. Cosmol. Astropart. Phys. 12, 036 (2017), arXiv:1703.07354 [hep-ph] .
- Reynolds et al. (2019) Christopher S. Reynolds, M. C. David Marsh, Helen R. Russell, Andrew C. Fabian, Robyn Smith, Francesco Tombesi, and Sylvain Veilleux, “Astrophysical Limits on Very Light Axion-Like Particles from Chandra Grating Spectroscopy of NGC 1275,” Astrophys. J. 890, 59 (2019), arXiv:1907.05475 [hep-ph] .
- Libanov and Troitsky (2020) Maxim Libanov and Sergey Troitsky, “On the Impact of Magnetic-Field Models in Galaxy Clusters on Constraints on Axion-Like Particles from the Lack of Irregularities in High-Energy Spectra of Astrophysical Sources,” Phys. Lett. B 802, 135252 (2020), arXiv:1908.03084 [astro-ph.HE] .
- Carlson (1995) E. D. Carlson, “Pseudoscalar Conversion and X-Rays from Stars,” Phys. Lett. B 344, 245–251 (1995).
- Posson-Brown et al. (2006) Jennifer Posson-Brown, Vinay L. Kashyap, Deron O. Pease, and Jeremy J. Drake, “Invisible Giant: Chandra’s Limits on X-rays from Betelgeuse,” arXiv e-prints (2006), arXiv:astro-ph/0606387 [astro-ph] .
- Dessert et al. (2020) Christopher Dessert, Joshua W. Foster, and Benjamin R. Safdi, “X-ray Searches for Axions from Super Star Clusters,” arXiv e-prints (2020), arXiv:2008.03305 [hep-ph] .
- Harper et al. (2008) Graham M. Harper, Alexander Brown, and Edward F. Guinan, “A New VLA-Hipparcos Distance to Betelgeuse and its Implications,” Astron. J. 135, 1430–1440 (2008).
- Harper et al. (2017) G. M. Harper, A. Brown, E. F. Guinan, E. O’Gorman, A. M. S. Richards, P. Kervella, and L. Decin, “An Updated 2017 Astrometric Solution for Betelgeuse,” Astron. J. 154, 11 (2017).
- Bähre et al. (2013) Robin Bähre et al., “Any light particle search II – Technical Design Report,” JINST 8, T09001 (2013), arXiv:1302.5647 [physics.ins-det] .
- Armengaud et al. (2019) E. Armengaud et al. (IAXO), “Physics potential of the International Axion Observatory (IAXO),” JCAP 06, 047 (2019), arXiv:1904.09155 [hep-ph] .
- Di Vecchia et al. (2019) Paolo Di Vecchia, Maurizio Giannotti, Massimiliano Lattanzi, and Axel Lindner, “Round Table on Axions and Axion-like Particles,” PoS Confinement2018, 034 (2019), arXiv:1902.06567 [hep-ph] .
- Straniero et al. (2019) Oscar Straniero, Inma Dominguez, Luciano Piersanti, Maurizio Giannotti, and Alessandro Mirizzi, “The Initial Mass-Final Luminosity Relation of Type II Supernova Progenitors: Hints of New Physics?” Astrophys. J. 881, 158 (2019), arXiv:1907.06367 [astro-ph.SR] .
- Han (2017) J. L. Han, “Observing interstellar and intergalactic magnetic fields,” Annual Review of Astronomy and Astrophysics 55, 111–157 (2017).
- Jansson and Farrar (2012) Ronnie Jansson and Glennys R. Farrar, “A New Model of the Galactic Magnetic Field,” Astrophys. J. 757, 14 (2012), arXiv:1204.3662 [astro-ph.GA] .
- Xu and Han (2019) J. Xu and J. L. Han, “Magnetic fields in the solar vicinity and in the Galactic halo,” Monthly Notices of the Royal Astronomical Society 486, 4275–4289 (2019).
- Beck et al. (2016) Marcus C. Beck, Alexander M. Beck, Rainer Beck, Klaus Dolag, Andrew W. Strong, and Peter Nielaba, “New constraints on modelling the random magnetic field of the MW,” JCAP 05, 056 (2016), arXiv:1409.5120 [astro-ph.GA] .
- Pelgrims et al. (2020) V. Pelgrims, K. Ferrière, F. Boulanger, R. Lallement, and L. Montier, “Modeling the magnetized Local Bubble from dust data,” Astronomy and Astrophysics 636, A17 (2020), arXiv:1911.09691 [astro-ph.GA] .
- Bassan et al. (2010) Nicola Bassan, Alessandro Mirizzi, and Marco Roncadelli, “Axion-Like Particle Effects on the Polarization of Cosmic High-Energy Gamma Sources,” J. Cosmol. Astropart. Phys. 05, 010 (2010), arXiv:1001.5267 [astro-ph.HE] .
- Cordes and Lazio (2002) James M. Cordes and T.J.W. Lazio, “NE2001. I. A New model for the galactic distribution of free electrons and its fluctuations,” (2002), arXiv:astro-ph/0207156 .
- Harvey-Smith et al. (2011) Lisa Harvey-Smith, Gregory J. Madsen, and Bryan M. Gaensler, “Magnetic Fields in Large Diameter Hii Regions Revealed by the Faraday Rotation of Compact Extragalactic Radio Sources,” Astrophys. J. 736, 83 (2011), arXiv:1106.0931 [astro-ph.GA] .
- Harrison et al. (2013) Fiona A. Harrison et al., “The Nuclear Spectroscopic Telescope Array (NuSTAR) High-Energy X-Ray Mission,” Astrophys. J. 770, 103 (2013), arXiv:1301.7307 [astro-ph.IM] .
- Madsen et al. (2015) Kristin K. Madsen et al., “Calibration of the NuSTAR High Energy Focusing X-ray Telescope,” Astrophys. J. Suppl. 220, 8 (2015), arXiv:1504.01672 [astro-ph.IM] .
- Perez et al. (2019) Kerstin Perez, Roman Krivonos, and Daniel R. Wik, “The Galactic Bulge Diffuse Emission in Broadband X-Rays with NuSTAR,” Astrophys. J. 884, 153 (2019), arXiv:1909.05916 [astro-ph.HE] .
- Roach et al. (2020) Brandon M. Roach, Kenny C. Y. Ng, Kerstin Perez, John F. Beacom, Shunsaku Horiuchi, Roman Krivonos, and Daniel R. Wik, “NuSTAR Tests of Sterile-Neutrino Dark Matter: New Galactic Bulge Observations and Combined Impact,” Phys. Rev. D 101, 103011 (2020), arXiv:1908.09037 [astro-ph.HE] .
- van Leeuwen (2007) F. van Leeuwen, “Validation of the New Hipparcos Reduction,” Astron. Astrophys. 474, 653–664 (2007).
- Evans et al. (2010) I. N. Evans et al., “The Chandra Source Catalog,” Astrophys. J. Suppl. Ser. 189, 37–82 (2010), arXiv:1005.4665 [astro-ph.HE] .
- Wik et al. (2014) D. R. Wik et al., “NuSTAR Observations of the Bullet Cluster: Constraints on Inverse Compton Emission,” Astrophys. J. 792, 48 (2014), arXiv:1403.2722 [astro-ph.HE] .
- Brun and Rademakers (1997) R. Brun and F. Rademakers, “ROOT: An object oriented data analysis framework,” Nucl. Instrum. Meth. A 389, 81–86 (1997).
- Junk (1999) Thomas Junk, “Confidence Level Computation for Combining Searches with Small Statistics,” Nucl. Instrum. Meth. A 434, 435–443 (1999), arXiv:hep-ex/9902006 .
- Cowan et al. (2011) Glen Cowan, Kyle Cranmer, Eilam Gross, and Ofer Vitells, “Asymptotic Formulae for Likelihood-Based Tests of New Physics,” Eur. Phys. J. C 71, 1554 (2011), [Erratum: Eur.Phys.J.C 73, 2501 (2013)], arXiv:1007.1727 [physics.data-an] .
- Feldman and Cousins (1998) Gary J. Feldman and Robert D. Cousins, “A Unified Approach to the Classical Statistical Analysis of Small Signals,” Phys. Rev. D 57, 3873–3889 (1998), arXiv:physics/9711021 .
- Ouellet et al. (2019a) Jonathan L. Ouellet et al., “First Results from ABRACADABRA-10 cm: A Search for Sub-eV Axion Dark Matter,” Phys. Rev. Lett. 122, 121802 (2019a), arXiv:1810.12257 [hep-ex] .
- Braine et al. (2020) T. Braine et al. (ADMX), “Extended Search for the Invisible Axion with the Axion Dark Matter Experiment,” Phys. Rev. Lett. 124, 101303 (2020), arXiv:1910.08638 [hep-ex] .
- Di Luzio et al. (2017) Luca Di Luzio, Federico Mescia, and Enrico Nardi, “Redefining the Axion Window,” Phys. Rev. Lett. 118, 031801 (2017), arXiv:1610.07593 [hep-ph] .
- Giannotti et al. (2016) Maurizio Giannotti, Igor Irastorza, Javier Redondo, and Andreas Ringwald, “Cool WISPs for stellar cooling excesses,” JCAP 05, 057 (2016), arXiv:1512.08108 [astro-ph.HE] .
- Giannotti et al. (2017) Maurizio Giannotti, Igor G. Irastorza, Javier Redondo, Andreas Ringwald, and Ken’ichi Saikawa, “Stellar Recipes for Axion Hunters,” JCAP 10, 010 (2017), arXiv:1708.02111 [hep-ph] .
- Salvati (2010) M. Salvati, “The local Galactic magnetic field in the direction of Geminga,” Astronomy and Astrophysics 513, A28 (2010), arXiv:1001.4947 [astro-ph.HE] .
- Frisch et al. (2012) P. C. Frisch, B-G Andersson, A. Berdyugin, V. Piirola, R. DeMajistre, H. O. Funsten, A. M. Magalhaes, D. B. Seriacopi, D. J. McComas, N. A. Schwadron, J. D. Slavin, and S. J. Wiktorowicz, “The Interstellar Magnetic Field Close to the SUN. II.” The Astrophysical Journal 760, 106 (2012).
- Ouellet et al. (2019b) Jonathan L. Ouellet et al., “Design and Implementation of the ABRACADABRA-10 cm Axion Dark Matter Search,” Phys. Rev. D 99, 052012 (2019b), arXiv:1901.10652 [physics.ins-det] .
- Silva-Feaver et al. (2017) M. Silva-Feaver et al., “Design Overview of DM Radio Pathfinder Experiment,” IEEE Transactions on Applied Superconductivity 27, 1–4 (2017).
- Fabian and Barcons (1992) A. C. Fabian and X. Barcons, “The Origin of the X-Ray Background,” Annu. Rev. Astron. Astrophys. 30, 429–456 (1992).
- Revnivtsev et al. (2003) Mikhail Revnivtsev, M. Gilfanov, R. Sunyaev, K. Jahoda, and C. Markwardt, “The Spectrum of the Cosmic X-Ray Background Observed by RTXE/PCA,” Astron. Astrophys. 411, 329–334 (2003), arXiv:astro-ph/0306569 .
- Fruscione et al. (2006) Antonella Fruscione, Jonathan C. McDowell, Glenn E. Allen, et al., “CIAO: Chandra’s data analysis system,” Proc. SPIE, 6270, 62701V (2006), 10.1117/12.671760.
- Andriamonje et al. (2007) S. Andriamonje et al. (CAST), “An Improved limit on the axion-photon coupling from the CAST experiment,” JCAP 04, 010 (2007), arXiv:hep-ex/0702006 .
- Le Bertre et al. (2012) T. Le Bertre, L. D. Matthews, E. Gérard, and Y. Libert, “Discovery of a detached H I gas shell surrounding Orionis,” Mon. Not. R. Astron. Soc 422, 3433–3443 (2012), arXiv:1203.0255 [astro-ph.SR] .
- Perrin et al. (2004) G. Perrin, S. T. Ridgway, V. Coudé du Foresto, B. Mennesson, W. A. Traub, and M. G. Lacasse, “Interferometric observations of the supergiant stars Orionis and Herculis with FLUOR at IOTA,” Astron. Astrophys 418, 675–685 (2004), arXiv:astro-ph/0402099 [astro-ph] .
- Lambert et al. (1984) D. L. Lambert, J. A. Brown, K. H. Hinkle, and Johnson, “Carbon, nitrogen and oxygem abundances in Betelgeuse,” Astrophysical Journal 284, 223–237 (1984).
- Meynet et al. (2013) G. Meynet, L. Haemmerlé, S. Ekström, C. Georgy, J. Groh, and A. Maeder, “The past and future evolution of a star like Betelgeuse,” in EAS Publications Series, EAS Publications Series, Vol. 60, edited by P. Kervella, T. Le Bertre, and G. Perrin (2013) pp. 17–28, arXiv:1303.1339 [astro-ph.SR] .
- Dolan et al. (2016) Michelle M. Dolan, Grant J. Mathews, Doan Duc Lam, Nguyen Quynh Lan, Gregory J. Herczeg, and David S. P. Dearborn, “Evolutionary Tracks for Betelgeuse,” Astrophys. J. 819, 7 (2016), arXiv:1406.3143 [astro-ph.SR] .
Supplemental Materials: Constraints on Axion-like Particles from a Hard -ray Observation of Betelgeuse
II Betelgeuse Stellar Models
The total ALP number per time and energy can be obtained integrating Eq. (2) over the volume of the star, . We find that, with an excellent approximation, the ALP source spectrum has the following form Andriamonje et al. (2007)
| (S1) |
where , while is the normalization, coincides the average energy, and is the spectrum index. The values of , and depend on various structural parameters characterizing the core of the star, such as temperature, density and chemical composition. To this aim, we will make use of stellar models computed using the FuNS code (see Straniero et al. (2019) for a detailed description of this code and the adopted input physics). Alpha Orionis (Betelgeuse) is a red supergiant whose luminosity, effective temperature and metallicity are, respectively, (Le Bertre et al. (2012)), K (Perrin et al. (2004)), and (Lambert et al. (1984)). These data constrain the initial mass between 18 and 22 , in good agreement with previous determinations (Meynet et al. (2013); Dolan et al. (2016)). We note that the uncertainty of Betelgeuse mass contributes much smaller effect for ALP-photon production than the time to core collapse or , and is thus ignored here. In our analysis we adopted a model of 20 with solar composition.
Extant models of stars with mass M⊙ may evolve to the red supergiant stage at the onset or at the end of the core-He burning, depending on the assumed efficiency of the semiconvective mixing (see the discussion in section 2.2 in Straniero et al. (2019)). In the FuNS model, scarce semiconvective mixing is usually assumed, so that the star becomes a red supergiant since the beginning of the core-He burning. This phase lasts for yrs, during which the central temperature and density remain more or less the same. After the core He is exhausted, the stellar luminosity increases and attains a maximum value during the C-burning phase. After that, the luminosity remains constant, until the final core collapse. However, during this phase, which lasts a few yrs, the temperature and the density within the core undergo constant and substantial increases. In turn, a significant increase of the ALP-production rate is expected (the ALP production rate is a steep function of the temperature).
Since the precise evolutionary status cannot be determined from the observed stellar properties, we have considered a set of stellar models taken at different times before the core-collapse. All of these stellar models match the observed and . In this way we may trace the expected evolution of the ALP flux during the red supergiant phase of Betelgeuse. The luminosity, the central temperature and the time to the core collapse of these models are reported in Tab. S1. Model 0 assumes Betelgeuse is still in the core-He burning phase; models 1–4 are before C burning; models 5–9 are during the C burning; model 11 is during the Ne burning; and model 12 is at the beginning of the O burning. Fig. S1 illustrates the temperature profiles of some of the 13 models for the most internal 6 .

| Model | Phase | [yr] | [keV] | ||||
| 0 | He burning | 155000 | 4.90 | 3.572 | 1.36 | 50 | 1.95 |
| 1 | before C burning | 23000 | 5.06 | 3.552 | 4.0 | 80 | 2.0 |
| 2 | before C burning | 13000 | 5.06 | 3.552 | 5.2 | 99 | 2.0 |
| 3 | before C burning | 10000 | 5.09 | 3.549 | 5.7 | 110 | 2.0 |
| 4 | before C burning | 6900 | 5.12 | 3.546 | 6.5 | 120 | 2.0 |
| 5 | in C burning | 3700 | 5.14 | 3.544 | 7.9 | 130 | 2.0 |
| 6 | in C burning | 730 | 5.16 | 3.542 | 12 | 170 | 2.0 |
| 7 | in C burning | 480 | 5.16 | 3.542 | 13 | 180 | 2.0 |
| 8 | in C burning | 110 | 5.16 | 3.542 | 16 | 210 | 2.0 |
| 9 | in C burning | 34 | 5.16 | 3.542 | 21 | 240 | 2.0 |
| 10 | between C/Ne burning | 7.2 | 5.16 | 3.542 | 28 | 280 | 2.0 |
| 11 | in Ne burning | 3.6 | 5.16 | 3.542 | 26 | 320 | 1.8 |
| 12 | beginning of O burning | 1.4 | 5.16 | 3.542 | 27 | 370 | 1.8 |
By folding Eq. (3) from Eq. (2), (4) and (5), the differential photon flux per unit energy arriving at Earth can be numerically calculated :
| (S2) |
where
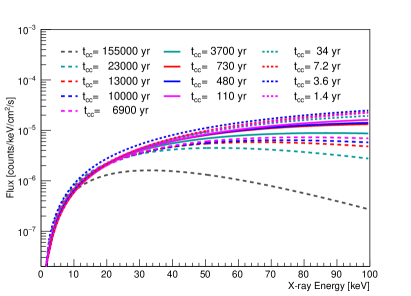
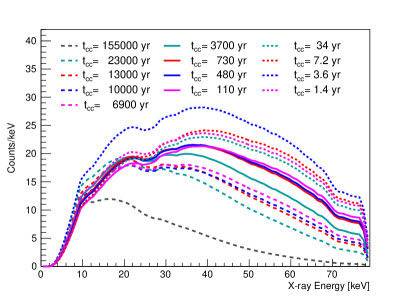
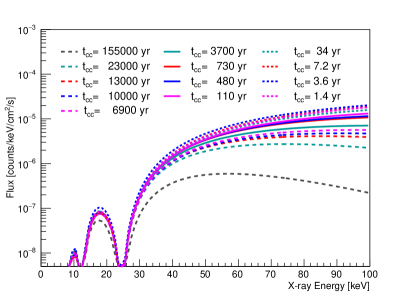
Using the fitted parameters in Tab. S1, Fig. S2 shows the predicated -ray spectra before and after NuSTAR instrument response for typical ALP masses in this work.
III NuSTAR Background Modeling
The NuSTAR instrument background spectral model contains several components, which may be broadly categorized as having astrophysical or detector origins. Our ALP search does not require a detailed parametrization of the NuSTAR instrument background, so we summarize the most important aspects here and refer the reader to Refs. Wik et al. (2014); Perez et al. (2019) for a detailed description. Our primary concern is the uniformity of the instrument background between the source spectral extraction region and the background spectral extraction region. The background components that are known to have significant spatial variation across the detector arrays are the unfocused cosmic -ray background (CXB) and -rays from fluorescence/activation of the instrument structure. The CXB level is observed to be nearly uniform on the sky for the angular and energy acceptance of a single NuSTAR observation Fabian and Barcons (1992); Revnivtsev et al. (2003), but the shadowing effects of the optics bench and aperture stops produce a radially-varying intensity pattern for the unfocused CXB. The intensity of the detector background is known to vary between the detector chips, though is largely constant within each chip Wik et al. (2014). Both the unfocused CXB gradient and the detector emission motivate the choice of a background region as close as possible to—and ideally on the same detector chip as—the source region, as shown in Fig. S3.

We further confirm the spatial uniformity of background by comparing the -ray spectra with different choices of background region on the same detector chip. In addition to the polygon region shown in Fig. S3, we also choose the other two circle regions (60′′ radius) which are 120′′ away from the Betelgeuse center. Using the data process described above, we extract the -ray spectrum in each background region. Fig. S4 compares the spectra from three background regions after the normalization of region size for FPMA and FPMB. This confirms that our analysis is robust to the exact choice of background spectral extraction region, and that our background region accurately models the instrumental and astrophysical background underlying our source region.
IV Chandra Observation of Betelgeuse
As a cross-check of our results, we use a 5 ks Chandra observation of Betelgeuse. Chandra has lower, and better understood, instrument background than NuSTAR, but its low-energy range (10 keV) makes it less powerful for constraining the expected ALP-induced spectrum. We thus use the Chandra data to verify that our derived 95% C.L. on is consistent with this low-background, low-energy dataset. We analyzed an archival Chandra observation, ObsID 3365, which used the ACIS-I configuration in FAINT mode and was taken on 16 December 2001. We reprocessed the data using the standard tool from the CIAO v.4.12 software, with updated calibration files (CALDB v4.9.2.0, Fruscione et al. (2006)). The resultant cleaned data had a 4.899 ks exposure. Fig. S5 shows the observation image for keV soft -ray events from Chandra. The short exposure time and low count rates made analyzing background-subtracted spectra difficult. Rather, we used the new CIAO tool, which computes values and limits for various parameters such as point source count rate and photon flux (https://cxc.harvard.edu/ciao/threads/aprates/index.html).
Upper limits for the keV energy range emission from Betelgeuse for ObsID 3365 were first reported by Posson-Brown et al. (2007) (see Table 4 there). We used the same source () and background (, ) regions centered on the star’s equatorial position, and with calculated a upper limit that matched the reported upper limit count rate. We then extended our analysis to the keV energy range. The resultant upper limits are 4.6 counts, or counts s-1. By counting the total events in the energy range keV, the constrains on is set as for the most optimistic stellar model and , and for the most conservative stellar model and for . These values are well within our excluded regions, and thus we confirm that our results are consistent with this low-energy dataset.
V Constraints on
As shown in Eq. S2, the ALP-photon flux scales as . To separately discuss the uncertainty from Betelgeuse stellar model () and magnetic field (), we also present our results as the constraints on the production of and in Fig. S6. We set a constraint of for eV for yr, and for eV for yr.
VI Evolution of for more ALP masses
Fig. S7 illustrates the evolution as the remaining time for core collapse of Betelgeuse for more ALP masses.