Carbon, isotopic ratio 12C/13C and nitrogen in solar twins: constraints for the chemical evolution of the local disc
Abstract
Abundances of light elements in dwarf stars of different ages are important constraints for stellar yields, Galactic chemical evolution and exoplanet chemical composition studies. We have measured C and N abundances and 12C/13C ratios for a sample of 63 solar twins spanning a wide range in age, based on spectral synthesis of a comprehensive list of CH A-X and CN B-X features using HARPS spectra. The analysis of 55 thin disc solar twins confirms the dependences of [C/Fe] and [N/Fe] on [Fe/H]. [N/Fe] is investigated as a function of [Fe/H] and age for the first time for these stars. Our derived correlation [C/Fe]-age agrees with works for solar-type stars and solar twins, but the [N/Fe]-age correlation does not. The relations [C,N/Fe]-[Fe/H] and [C,N/Fe]-age for the solar twins lay under-solar. 12C/13C is found correlated with [Fe/H] and seems to have decreased along the evolution of the local thin disc. Predictions from chemical evolution models for the solar vicinity corroborate the relations [C,N/Fe]-[Fe/H], 12C/13C-age and [N/O]-[O/H], but do not for the 12C/13C-[Fe/H] and [C/O]-[O/H] relations. The N/O ratio in the Sun is placed at the high end of the homogeneous distribution of solar twins, which suggests uniformity in the N-O budget for the formation of icy planetesimals, watery super-earths and giant planets. C and N had different nucleosynthetic origins along the thin disc evolution, as shown by the relations of [C/N], [C/O] and [N/O] against [O/H] and age. [C/N] and [C/O] are particularly observed increasing in time for solar twins younger than the Sun.
keywords:
stars: abundance – stars: fundamental parameters – stars: solar-type – Galaxy: evolution – Galaxy: solar neighbourhood – planets and satellites: formation1 Introduction
A key aspect of the formation of stars and their planets regards to the pristine chemical composition of their parental cloud of gas and dust. Various connections between the chemical composition of planet-host stars and the planet frequency are observed and proposed such as primordial abundance anomalies, planet engulfment events, retention of refractory elements by rocky planets and/or core of giant planets, and due to the formation of Jupiter analogs, which could trap significant quantity of dust exterior to their orbits preventing large amounts of refractory elements from being accreted to the forming star (Santos et al., 2001, 2004; Fischer & Valenti, 2005; Meléndez et al., 2009; Ramírez et al., 2011; Wang & Fischer, 2015; Ghezzi et al., 2018; Petigura et al., 2018; Teske et al., 2019; Booth & Owen, 2020).
The abundances of carbon, nitrogen and oxygen beyond the ice line in a protoplanetary disc of gas/dust (or simply nebula) are strictly related to the efficiency on the assembling of planetesimals to form planetary embryos (bodies with sizes between the Moon and Mars) and cores of giant planets. This is because at large distances from the central protostar, the icy planetesimals existent there due to lower temperatures have their mutual sticking process enhanced (Haghighipour, 2013; Marboeuf et al., 2014). By developing a model that computes the chemical composition and the ice-to-rock mass ratio in icy planetesimals throughout protoplanetary discs of different masses, Marboeuf et al. (2014) derived that the ice content of these bodies is mainly dominated by H2O, CO, CO2, CH3OH, and NH3. Their models predict the ice-to-rock ratio in icy planetesimals to be equal to 1(0.5), like observed in the Solar System’s comets, but still 2-3 times lower than usually considered in planet formation models. Therefore, in some sense, the pristine content of CNO in a star plays an important role for the potential planetary formation around it, and this could also be imprinted in the chemical composition and structure of the formed planets (and vice-versa).
The chemical evolution of the solar neighbourhood is based on the stellar yields of all elements and other key ingredients, such as the star formation rate, the matter infall from the halo, the radial gas and star flows across the disc, the vertical gas outflows from the disc, the stellar initial mass function, the relative rates of different kinds of supernovae and the frequency of close binaries (Tinsley, 1980; Pagel, 2009; Matteucci, 2012). The production of C, N, O and Fe along time, as well as of other abundant elements, will determine the temporal evolution of their abundances in the interstellar medium (ISM), and will be imprinted in the composition of stars and their planets.
The CNO surface abundances in evolved stars are modified by the nuclear burning together with internal mixing processes (Charbonnel, 1994; Gratton et al., 2000; Maas et al., 2019). Therefore, dwarf stars are fundamentally indispensable to be observed in order to trace the CNO enrichment in the ISM.
Whilst carbon is a primary element (i.e., it is synthesized starting from H and He in the parent star), nitrogen is considered a primary element (when produced, e.g., in low-metallicity fast-rotating massive stars, see Meynet & Maeder (2002a)) as well as a secondary one (when synthesized from 12C or 16O nuclei already present since the star birth). The intermediate-mass (2-3 M 7-9 M⊙) and massive (M 7-9 M⊙) stars are the C and N main sources to pollute the ISM due to their shorter lifetimes relative to low-mass stars (M 2-3 M⊙), although 1-2 M⊙ stars may also eject some amount of C and N through the first thermal pulse on the asymptotic giant branch, AGB (Karakas & Lugaro, 2016). The relative contributions between intermediate-mass and massive stars for the C and N productions are still uncertain (Meynet & Maeder, 2002a, b).
The carbon main isotope 12C is essentially made by the triple- process. The isotope 13C is residually made by different ways (Meynet & Maeder, 2002b): (a) in the CN cycle also named as CNO-I cycle (H burning in intermediate-mass and massive stars), (b) in the 12C burning (low-metallicity fast-rotating massive stars), and (c) through proton-capture nucleosynthesis on the AGB (intermediate-mass stars with hot bottom burning just below the convective envelope).
Nitrogen basically comes from C and/or O, becoming its production more complex than carbon. The most abundant isotope 14N is synthesized and ejected to the ISM through distinct ways: (i) in the complete CNO-II cycle and ejected through the thermal pulses on the AGB phase for isolated stars only (Pettini et al., 2002); (ii) through the 12C burning in low-metallicity fast-rotating massive stars and ejected by their strong winds (Meynet & Maeder, 2002a); (iii) through a proton-capture reaction in the hot base of the convective envelope and ejected during the AGB phase of intermediate-mass stars (like 13C) (Marigo, 2001; Meynet & Maeder, 2002a); and (iv) in the CN cycle from 12C and ON cycle from 16O in stars of any mass and ejected by them. However, the relative importance of these processes is not very well determined.
Oxygen – an -element – is mainly ejected to the ISM in the pre-supernova phase of the type II supernovae core collapse events (SN-II) (Chiappini et al., 2003). On the chemical enrichment scenario of the solar neighbourhood, iron peak elements (Fe as a template) come from a combinative production by type Ia supernovae (SN-Ia) and SN-II. In fact, the observed decrease of [-element/Fe] versus [Fe/H] in the thick and thin disc stars reflects the relative importance of SN-Ia over SN-II along the formation history of the Galaxy’s disc (Feltzing et al., 2003; Bensby et al., 2003; Meléndez et al., 2008; Alves-Brito et al., 2010; Recio-Blanco et al., 2014; Weinberg et al., 2019).
Explosions of classical novae in close binary systems specifically play an important role on the production of the rare CNO isotopes 13C, 15N and 17O (Romano et al., 2019; José & Hernanz, 2007). On the other hand, SN-Ia events eject negligible amounts of CNO elements to the ISM.
Therefore, the ratios C/Fe, N/Fe, 12C/13C, C/N, C/O and N/O in dwarf stars provide valuable information about the main nucleosynthetic processes for these elements over the evolution of the Galaxy’s disc. For instance, the relative contributions of yields of single massive stars, yields of isolated AGB stars (low and intermediate-mass stars), SN-II/SN-Ia ratio and close binary fraction could be understood through robust Galactic chemical evolution (GCE) models with those observations as constraints (Chiappini et al., 2003; Kobayashi et al., 2011; Sahijpal, 2013; Romano et al., 2017, 2019). Specifically, Romano et al. (2017) states that measurements of 12C/13C in wide samples of nearby dwarfs would be very useful for construction of representative GCE models.
Analysing nearby solar twins provide an opportunity for studying the chemical evolution of the local disc with time around the solar metallicity, because they can encompass very different ages ranging since about the formation of the thin disc until now (Tucci Maia et al., 2016). The opportunity becomes more interesting when the solar twins have very well-determined fundamental parameters, resulting in precise relative ages. Bedell et al. (2018), Spina et al. (2018) and Nissen (2015) have recently investigated how abundance ratios [X/Fe] in solar twins are related to age and [Fe/H]. Bedell et al. (2018) and Nissen (2015), for instance, similarly obtained that [C/Fe] and [O/Fe] increase with the stellar age, but they did not include nitrogen and 12C/13C in their studies.
We point out that nitrogen has not been derived for the current sample of solar twins yet, albeit a first analysis of N in 11 solar twins was performed by Meléndez et al. (2009). The main reason is due to a lack of measurable atomic lines in the optical region and also because absorption features of molecules (e.g. CH, NH and CN) are actually spectral blends requiring spectral synthesis. For instance, equivalent widths of a weak atomic N I line at 7468.3 Å and spectral synthesis of NH in the ultraviolet were used in the study of solar-type stars by Ecuvillon et al. (2004). More recently, Da Silva et al. (2015) and Suárez-Andrés et al. (2016), handling samples of solar-type dwarfs, found that giant planet hosts are nitrogen-rich (in the [N/H] scale) when compared with their control samples of dwarfs without known planets. However, the increase of [N/Fe] as a function of [Fe/H] and the negative trend of [N/Fe] with the stellar age, as observed in both works, do not imply on any significant difference between the two stellar groups.
In the current work we have homogeneously measured precise abundances of carbon and nitrogen plus the carbon main isotopic ratio 12C/13C, in a sample of well-studied solar twins, having distances up to 100 pc and spanning a wide range of ages since around the formation epoch of the Galaxy’s thin disc until a few hundreds Myr ago (Bedell et al., 2018; Spina et al., 2018; Botelho et al., 2019). The analysis of our results is focused on the distributions of a set of CNO abundance ratios as a function of the age and metallicity of these solar twins in order to provide unprecedented and self-consistent constraints for GCE modelling (e.g. Romano et al., 2017; Sahijpal, 2013).
Our paper is organized as follows. In Section 2, we present the sample of solar twins, their main parameters and the spectroscopic data. Section 3 details the homogeneous chemical analysis carried out differentially to the Sun for deriving the C abundance, the 12C/13C isotopic ratio and the N abundance based on the spectral synthesis of molecular features of the electronic systems CH A-X, CH A-X and CN B-X, respectively. In Section 4, we study the behaviour of [C/Fe], [N/Fe], 12C/13C, [C/N], [C/O] and [N/O] as a function of [Fe/H] and isochrone stellar age, and also [C/N], [C/O] and [N/O] as a function of [O/H] (other stellar metallicity indicator). Finally, Section 5 summarizes our main results and conclusions.
2 Solar twins sample and data
The sample is composed of 67 solar twins, stars with atmospheric parameters very similar to the Sun, within around K in and dex in and [Fe/H] (Ramírez et al., 2009), studied previously by Bedell et al. (2018), Spina et al. (2018) and Botelho et al. (2019). The atmospheric parameters are those by Spina et al. (2018). The typical errors in , and [Fe/H] are 4 K, 0.012, 0.004 dex, respectively, using line-by-line differential spectroscopic analysis relative to the Sun by means of equivalent width (EW) measurements of Fe I and Fe II. We also adopted the isochronal ages and masses derived by Spina et al. (2018), who employed the q2 code by applying the isochrone method with the use of the Yonsei-Yale isochrones (as described in Ramírez et al. (2014a, b)). This sample spans a wide range in age, i.e. from 500 Myr up to 8.6 Gyr with a typical error of 0.4 Gyr, which gives us a good understanding of the evolution of the Galactic disc. We considered the elemental abundances from Spina et al. (2018), which analysed 12 neutron-capture elements (Sr, Y, Zr, Ba, La, Ce, Pr, Nd, Sm, Eu, Gd, and Dy), and the abundances of 17 additional elements (C, O, Na, Mg, Al, Si, S, Ca, Sc, Ti, V, Cr, Mn, Co, Ni, Cu and Zn) from Bedell et al. (2018). The elemental abundances in both works were also measured based on a line-by-line analysis relative to the Sun.
We have adopted the line-of-sight rotational velocity and macro-turbulence velocity given in Dos Santos et al. (2016) to reproduce the line broadening of our sample of solar twin stars.
The spectra were obtained with the HARPS spectrograph (High Accuracy Radial velocity Planet Searcher) on the 3.6m telescope of the ESO (European Southern Observatory) La Silla Observatory in Chile (Mayor et al., 2003). The HARPS spectra cover 3780-6910 Å with a resolving power (R = 115,000). Stacking all HARPS spectra of each star resulted in a very high signal-to-noise ratio (SNR) of approximately 800 per pixel as measured around 6000 Å, with a minimum of 300 per pixel and a maximum of 1800 per pixel. The solar spectrum used in this work is a combination of several exposures of sunlight reflected from the asteroid Vesta, also observed with HARPS. Table 1 shows the photospheric parameters, broadening velocities, isochrone age and oxygen abundance of the solar twins sample.
| Star ID | log | [Fe/H] | age | [O/H] | ||||
|---|---|---|---|---|---|---|---|---|
| (K) | (dex) | (km.s-1) | (km.s | (km.s-1) | (Gyr) | (dex) | ||
| Sun | 5777 | 4.440 | 0.000 | 1.00 | 3.20 | 2.04 | 4.56 | 0.00 |
| HIP 003203 | 58689 | 4.5400.016 | -0.0500.007 | 1.160.02 | 3.27 | 3.82 | 0.500.30 | -0.1390.021 |
| HIP 004909 | 58617 | 4.5000.016 | 0.0480.006 | 1.110.01 | 3.33 | 4.01 | 0.600.40 | -0.0380.017 |
| HIP 006407 | 57757 | 4.5050.013 | -0.0580.006 | 0.980.01 | 2.96 | 2.30 | 1.900.70 | -0.1100.013 |
| HIP 007585 | 58223 | 4.4450.008 | 0.0830.003 | 1.010.01 | 3.37 | 1.90 | 3.500.40 | 0.0540.005 |
| – | – | – | – | – | – | – | – | – |
| HIP 118115 | 57984 | 4.2750.011 | -0.0360.003 | 1.100.01 | 3.55 | 0.89 | 8.000.30 | -0.0880.010 |
3 Determination of C, N and 12C/13C
The uniform determination of the C abundance was performed from a set of selected absorption lines of the molecular electronic system A-X of 12CH (hereafter CH A-X, Jorgensen et al. (1996)) and the N abundance from a set of selected lines of the molecular electronic system A-X of 12C14N (the CN Violet System, hereafter CN B-X, Brooke et al. (2014)). The homogeneous determination of the 12C/13C isotopic ratio was obtained by using features from the CH A-X system too (12CH A-X lines mixed with 13CH A-X lines). We used the C abundance for deriving the N abundance (in the analysis of CN B-X lines), and for extracting the 12C/13C ratio. Although Bedell et al. (2018) have already determined the C abundance for this same solar twin sample, it was necessary to proceed with a new determination in order to make a homogeneous chemical analysis, because Bedell et al. (2018) used equivalent widths of atomic and molecular lines to derive the carbon abundance (C I and CH A-X), and in the current work we adopt the spectral synthesis technique for mensurable and almost isolated lines of CH A-X that were carefully selected based on their sensitivity to the C abundance variation. We used the same stellar parameters and model atmosphere grid (ATLAS9 by Castelli & Kurucz (2004)), as presented in Spina et al. (2018). We also adopted the same version of the MOOG code, 2014 (Sneden, 2014) that solves the photospheric radiative transfer with line formation under the LTE (local thermodynamic equilibrium) approximation. The non-LTE analysis of molecular spectral lines is an unexplored territory in the literature, but those effects are probably more important in stars with extended atmospheres (Lambert et al., 2013), rather than in our sample of dwarf stars.
Throughout our differential analysis, we have also adopted the standard parameters for the Sun: = 5777 K, = 4.44, [Fe/H] = 0.00 dex, and = 1.00 km.s-1 (e.g. Cox & Pilachowski, 2000). The adopted solar chemical composition is that by Asplund et al. (2009). The abundance of oxygen, as derived by Bedell et al. (2018) for the same solar twins sample, is taken into account along the whole spectral synthesis procedure for determining the abundances of C and N and the isotopic ratio 12C/13C, since the molecular dissociative equilibrium is solved by the MOOG code.
The atomic line list has been compiled from the VALD database (Ryabchikova et al., 2015), and we have added the following molecular lines from the Kurucz database (Kurucz, 2018): 12C1H and 13C1H lines of the A-X system (Jorgensen et al., 1996), 12C1H and 13C1H lines of the B-X system (Jorgensen et al., 1996), 12C12C, 12C13C and 13C13C lines of the d-a system (Brooke et al., 2014), 12C14N, 12C15N and 13C14N lines of the B-X system (Brooke et al., 2014), and 14N1H and 15N1H lines of the A-X system (Kurucz, 2017). We have verified the impact of the variation of 12C/13C and 14N/15N, respectively, on the selected CH A-X and CN B-X lines, and we found that those molecular lines are insensitive to change in these isotopic ratios (the difference in the resulting abundance is always smaller than the abundance error). The adopted dissociative energies of CH, C2, CN and NH are those by Barklem & Collet (2016).
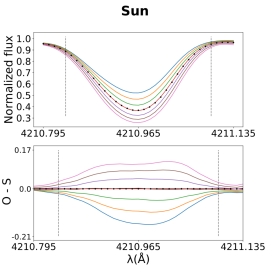
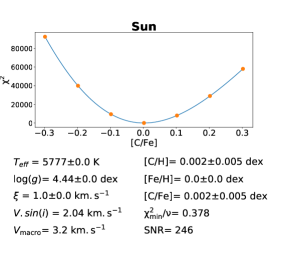
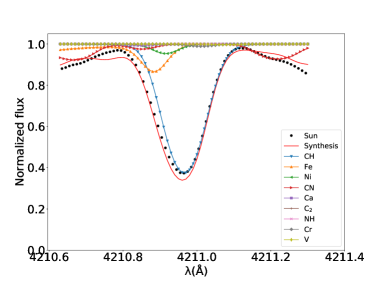
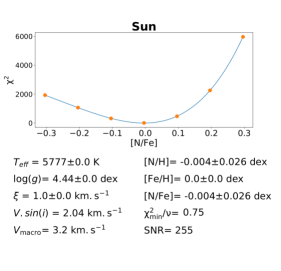
The first step for our differential chemical analysis relative to the Sun was the selection of (almost) isolated lines of CH A-X, CN B-X and features of 13CH A-X (13CH-12CH partially mixed lines). To help us on this search, we adopted the solar atlas of Wallace et al. (2011), which identifies various molecular and atomic lines. We could find, then, the best candidates of CH A-X and CN B-X non-perturbed lines. This atlas also allowed us to identify continuum points (or pseudo-continuum in some cases) for a better flux normalization between observed spectrum and model spectra. After this step, a detailed investigation is made via spectral synthesis to address the individual contributions of all species in the region. Finally, a global calibration is made to finely reproduce the HARPS observed solar spectrum over each selected molecular absorption. An automated Python code adjusts the -value under a line-by-line approach for each selected region. We obtained [X/Fe] near to zero (absolute value always smaller than or equal to 0.005 dex) for the calibration relative to the Sun for the derived abundances of C and N in all selected lines, and 12C/13C between 87.3 and 90.7 for the resulting isotopic ratio in all selected features (see Fig. 1, Fig. 2 and Fig. 3 in the following sub-sections, in which we show examples). The next step was to search for continuum points and adequate windows for every molecular line/feature, including an inspection of the effective sensitivity to the variation of the measured parameter (C, N or 12C/13C). We employ the same procedure to extract the elemental abundance based on the minimization, as applied in (Botelho et al., 2019). The minimizing of is only computed in a window around the central wavelength of the line/feature, directly providing the best abundance or isotopic ratio among the synthetic spectra generated for different values of abundance or isotopic ratio; , where and are the flux of the observed and synthetic spectrum, respectively, is the error in the observed flux, and represent the wavelength point. The observed flux error is estimated as a function of the continuum SNR, that is SNRcontinuum. The of every spectral synthesis fit is plotted as a function of [X/Fe] for deriving the C and N abundances, and versus 12C/13C ratio for obtaining this isotopic ratio. An automated procedure has been used for performing the spectral synthesis fit in order to measure a final representative abundance or isotopic ratio.
Even though the spectral synthesis has been applied automatically for each molecular line/feature (CH A-X, CN B-X and 13CH A-X), we have performed a general visual inspection of all spectral synthesis fits. The stars HIP 010303, HIP 030037, HIP 038072 and HIP 083276 were eliminated from our measurements, because their spectral fits for all CH A-X selected lines were unreliable, not providing a representative abundance of C, and therefore becoming impossible to derive N and 12C/13C. Perhaps there is a problem with the data reduction in that region for those stars, as the computed are very high in comparison with the distribution of the other stars.
In summary, we were able to measure C, 12C/13C and N in 63 solar twins from high-resolution high-quality spectra through a self-consistent and homogenous procedure.
3.1 Carbon and nitrogen abundances
In order to derive the carbon abundance, eleven lines of the (0,0) vibrational band and one of the (1,0) vibrational band of the CH A-X system were selected in the spectral range 4211-4387 Å. Table 2 shows the twelve CH A-X lines. For obtaining the nitrogen abundance, we selected five CN B-X lines in 4180-4212 Å, from the bands (0,0), (1,0) and (2,0), respectively 2, 2 and 1 line. The five CN B-X lines are shown in Table 3. We have also verified that the selected lines of 12CH A-X and 12C14N B-X are insensitive to the variation of the main isotopic ratios of C and N (12C/13C and 14N/15N). Table 4 and Table 5, respectively, present the line list of 2 Å wide centered at the central wavelength of the selected CH A-X and CN B-X lines, whose values have been calibrated to the solar spectrum.
| line | window | n. pixels | blue continuum | red continuum | band | n. lines | |
|---|---|---|---|---|---|---|---|
| (Å) | (Å) | (Å) | (Å) | (, ) | |||
| CH4210 | 4210.96 | 4210.83-4211.10 | 27 | 4207.54-4207.60 | 4211.55-4211.62 | (0,0) | 3 |
| CH4212 | 4212.65 | 4212.54-4212.76 | 22 | 4211.56-4211.62 | 4212.94-4213.00 | (0,0) | 3 |
| CH4216 | 4216.60 | 4216.50-4216.70 | 20 | 4214.10-4214.16 | 4218.53-4218.59 | (1,0) | 3 |
| CH4217 | 4217.23 | 4217.11-4217.35 | 24 | 4214.10-4214.16 | 4218.53-4218.59 | (0,0) | 3 |
| CH4218 | 4218.71 | 4218.61-4218.81 | 20 | 4217.90-4217.96 | 4218.93-4218.99 | (0,0) | 3 |
| CH4248 | 4248.72 | 4248.64-4249.01 | 37 | 4246.26-4246.33 | 4251.50-4251.57 | (0,0) | 2 |
| 4248.94 | 1 | ||||||
| CH4255 | 4255.25 | 4255.14-4255.36 | 22 | 4253.40-4253.46 | 4256.67-4256.73 | (0,0) | 2 |
| CH4278 | 4278.85 | 4278.77-4279.14 | 37 | 4278.55-4279.59 | 4281.66-4281.70 | (0,0) | 2 |
| 4279.06 | 1 | ||||||
| CH4281 | 4281.96 | 4281.84-4282.08 | 24 | 4281.66-4281.70 | 4283.48-4283.54 | (0,0) | 3 |
| CH4288 | 4288.73 | 4288.62-4288.87 | 25 | 4287.20-4287.28 | 4290.55-4290.60 | (0,0) | 4 |
| CH4378 | 4378.25 | 4378.13-4378.37 | 24 | 4377.62-4377.68 | 4379.86-4379.93 | (0,0) | 3 |
| CH4387 | 4387.06 | 4386.94-4387.16 | 22 | 4385.50-4385.58 | 4392.38-4392.45 | (0,0) | 3 |
| line | window | n. pixels | blue continuum | red continuum | band | n. lines | |
|---|---|---|---|---|---|---|---|
| (Å) | (Å) | (Å) | (Å) | (, ) | |||
| CN4180 | 4180.02 | 4179.95-4180.08 | 13 | 4179.06-4179.12 | 4181.01-4181.06 | (2,0) | 3 |
| CN4192 | 4192.94 | 4192.84-4193.03 | 19 | 4192.72-4192.78 | 4195.77-4195.85 | (1,0) | 3 |
| CN4193 | 4193.40 | 4193.33-4193.45 | 14 | 4192.72-4192.78 | 4195.77-4195.85 | (1,0) | 3 |
| CN4195 | 4195.95 | 4195.87-4196.01 | 14 | 4195.77-4195.85 | 4203.26-4203.32 | (0,0) | 3 |
| CN4212 | 4212.25 | 4212.15-4212.34 | 19 | 4211.56-4211.63 | 4212.92-4212.98 | (0,0) | 6 |
| CH4210 | ||||
| wavelength | species code | species | ||
| (Å) | (eV) | |||
| 4209.9650 | 606.0 | 1.559 | 0.316E-03 | C2 |
| 4209.9710 | 607.0 | 0.258 | 0.135E-05 | CN |
| 4209.9760 | 607.0 | 2.348 | 0.682E-04 | CN |
| 4209.9760 | 607.0 | 0.998 | 0.941E-05 | CN |
| 4209.9870 | 607.0 | 4.001 | 0.289E-03 | CN |
| — | — | — | — | — |
| 4211.9670 | 606.0 | 1.574 | 0.257E02 | C2 |
| CN4180 | ||||
| wavelength | species code | species | ||
| (Å) | (eV) | |||
| 4179.0220 | 607.0 | 3.822 | 0.226E-02 | CN |
| 4179.0270 | 606.0 | 1.515 | 0.211E-09 | C2 |
| 4179.0360 | 24.0 | 3.849 | 0.486E-03 | Cr I |
| 4179.0380 | 107.0 | 1.139 | 0.110E-06 | NH |
| 4179.0390 | 607.0 | 3.518 | 0.211E-02 | CN |
| — | — | — | — | — |
| 4181.0140 | 606.0 | 1.538 | 0.469E-08 | C2 |
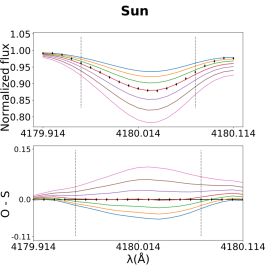
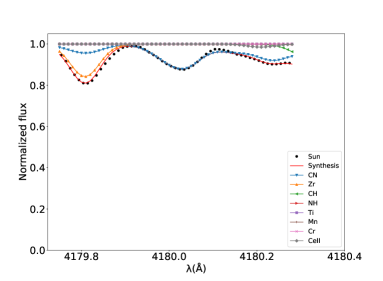
For performing the spectral synthesis fit of every selected line of CH A-X and CN B-X, seven synthetic spectra are computed with uniform step of 0.10 dex in [X/Fe] (X: C and N respectively) that are resampled in wavelength to that sampling of the observed spectrum. After that, the continuum level of the observed spectrum needs to be fitted to the continuum level of each synthetic spectrum; the continuum correction is multiplicative and derived by using both blue and red continuum ranges (see Tab. 2 and Tab. 3). For deriving the resulting elemental abundance from each molecular line, the between the model and observed spectra is computed in the line window. The window covers from 20 up to 37 pixels for the CH A-X lines and from 13 up to 19 pixels for the CN B-X lines. The C abundance is derived first (as a simple mean) and then the N abundance is obtained (simple average too), after fixing the C abundance. Both C and N abundances were used to measure of the 12C/13C isotopic ratio, making the overall chemical analysis self-consistent. Figure 1 and Figure 2 are examples of spectral synthesis calibration to the solar spectrum, from which the C and N measurements are derived from, respectively, a CH A-X line and a CN B-X line, showing diagnostic plots for the individual contributions from different species in the line profile and for the spectral synthesis itself as well as the graph of as a function of [X/Fe], whose minimum directly provides the resulting elemental abundance. None resulting abundance from every CH A-X and CN B-X line was excluded by a 3 clipping criterium.
The minimization procedure directly provides a good estimation for the error in [X/Fe]. The abundance error is derived when increases by degrees of freedom from the minimum value along the polynomial fitting curve versus [X/Fe], such that is the number of pixels in the window less a single free parameter (the elemental abundance itself). The uncertainties in abundance due to the photospheric parameter errors plus the impact of the continuum level adjustment, considering the influence of the flux noise, have been added in quadrature to that error from the spectral synthesis itself ( estimation). For estimating the final error in the N abundance, the whole carbon abundance error is also taken into account. We have also estimated the impact of the oxygen abundance error in the abundances of carbon of nitrogen, and we found that the influence is negligible (i.e. the difference in the resulting abundance is always smaller than 1 milidex). The error in [X/H] is computed in quadrature with the error in [Fe/H]. The global error in [X/Fe] derived from each molecular line is roughly dependent on the local SNR (measured in the spectral region of the molecular lines). The SNR changes from 250 per pixel up to 600 per pixel for the CH A-X line regions, and from 200 per pixel up to 500 per pixel for the CN B-X line regions.
Concerning the C abundance derivation by Bedell et al. (2018) for the same solar twins sample, we have found a systematic difference in the [C/H] scale of about -0.04 dex between our determinations and their average [C/H] abundance ratios based on EW measurements from C I and CH A-X lines. However, this small discrepancy is lower than the data dispersion (e.g. a standard linear fit provides a of 0.08 dex).
The final abundances in C and N ([X/Fe] scale) for the 63 analyzed solar twins are computed as simple averages of the measured abundances from the selected individual molecular lines. The errors in the final [C/Fe] and [N/Fe] are estimated as simple means of their individual values. The error in [C/Fe] varies from 0.004 up to 0.011 dex with an average value around 0.006 dex (the error in [C/H] changes from 0.004 up to 0.013 dex). The error in [N/Fe] varies from 0.015 up to 0.057 dex, whose average value lies around 0.030 dex (the error in [N/H] changes from 0.016 up to 0.057 dex).
3.2 12C/13C isotopic ratio
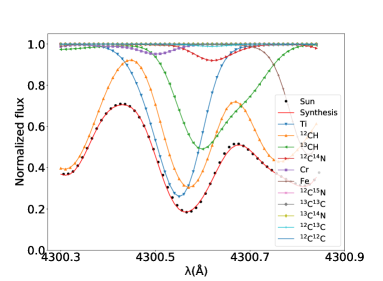
In order to self-consistently derive the 12C/13C isotopic ratio, our previous measurements of the C and N concentrations were adopted. We found six 13CH-12CH A-X features around the G band of CH at 4300 Å (all containing lines of the (0,0) vibrational band of the CH A-X system) that are sensitive to the variation of the 12C/13C ratio. Table 6 shows these CH A-X selected features (in fact, 13CH A-X lines mixed with 12CH A-X lines). Table 7 presents the line list covering 2 Å centered at the central wavelength of the 13CH-12CH A-X selected features, whose values have been calibrated to the solar spectrum.
| feature | window | n. pixels | blue continuum | red continuum | band | n. lines | |
|---|---|---|---|---|---|---|---|
| (Å) | (Å) | (Å) | (Å) | (, ) | |||
| 13CH4297 | 4297.10 | 4297.03-4297.17 | 14 | 4292.83-4292.88 | 4304.93-4305.01 | (1,0) | 6 |
| 13CH4298 | 4298.14 | 4298.08-4298.21 | 13 | 4292.83-4292.88 | 4304.93-4305.01 | (1,0) | 3 |
| 13CH4299A | 4299.42 | 4299.34-4299.51 | 17 | 4292.83-4292.88 | 4304.93-4305.01 | (1,0) | 7 |
| 13CH4299B | 4299.74 | 4299.65-4299.83 | 18 | 4292.83-4292.88 | 4304.93-4305.01 | (1,0) | 8 |
| 13CH4300 | 4300.67 | 4300.58-4300.76 | 18 | 4292.83-4292.88 | 4304.93-4305.01 | (1,0) | 5 |
| 13CH4303 | 4303.32 | 4303.24-4303.40 | 16 | 4292.83-4292.88 | 4304.93-4305.01 | (1,0) | 3 |
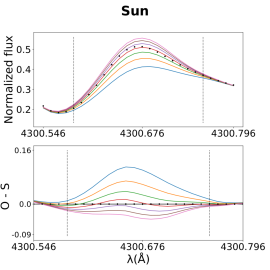
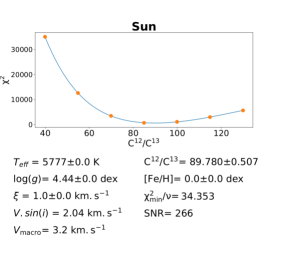
Analogously to the measurements of the C and N abundances, seven synthetic spectra are computed to derive the 12C/13C isotopic ratio assuming a uniform step of 15 in this free parameter. The model spectra are resampled in wavelength to the sampling of the observed spectrum. The observed continuum level is also individually fitted to the continuum level of each synthetic spectrum (see Tab. 6). For deriving the resulting isotopic ratio from each 13CH-12CH A-X selected feature, the between the model and observed spectra is also computed along the feature window (covering from 13 up to 18 pixels). Both C and N abundances were used to measure of the 12C/13C isotopic ratio, making the overall chemical analysis self-consistent. Along the procedure of spectral synthesis, whilst the isotopic ratio 14N/15N is fixed to the solar value, the ratio 12C/13C to be measured starts from the solar value. We have adopted the values suggested by Asplund et al. (2009) for the Sun (14C/15C = 89.4 0.2 and 14N/15N = 435 57). Figure 3 is an example of spectral synthesis calibration to the solar spectrum, from which 12C/13C is derived by using a 13CH-12CH A-X selected feature. This figure shows diagnostic plots for the individual contributions from different species in the line profile and for the spectral synthesis itself as well as the graph of versus 12C/13C, in which the isotopic ratio is recovered from the minimum value.
| 13CH4297 | |||
|---|---|---|---|
| wavelength | species code | ||
| (Å) | (eV) | ||
| 4296.1010 | 606.01313 | 2.145 | 0.731E-01 |
| 4296.1030 | 606.01313 | 1.329 | 0.637E-01 |
| 4296.1060 | 606.01213 | 2.043 | 0.111E-01 |
| 4296.1060 | 607.01314 | 2.349 | 0.302E-04 |
| 4296.1080 | 106.00112 | 1.247 | 0.550E-02 |
| — | — | — | — |
| 4298.1000 | 607.01214 | 0.566 | 0.259E-03 |
By adopting the 3 clipping criterium over the measurements of the resulting 12C/13C isotopic ratios for every sample star, four 13CH-12CH A-X features have been used for 7 stars, five features for other 7 stars, and all of them have been useful for the 49 remaining stars.
The estimation of the error in 12C/13C is similar to that performed for the C and N abundances, i.e. the minimization approach objectively gives the error due to the spectral synthesis procedure itself. The basic error in 12C/13C is estimated from the variation of in ( - 1) unities along the polynomial fitting curve -12C/13C, where is the number of pixels in the window. The error due to the spectral synthesis is added in quadrature with the propagated photospheric parameter errors, the uncertainties in the C abundance and the errors from the impact of the continuum level adjustment. We have also estimated the impact of the error in the oxygen abundance over the error of the isotopic ratio, and we found that the influence is negligible. We have verified that the global error in 12C/13C derived from each molecular feature is roughly dependent on the local SNR (measured in the correspondent spectral regions). The SNR changes from 170 per pixel up to 400 per pixel for the 13CH-12CH A-X feature regions.
Like the C and N abundances, the final 12C/13C isotopic ratios for the 63 analyzed solar twins are computed as simple averages of the individual measurements from the 13CH-12CH A-X features, and their errors as simple means of the individual errors. The error in 12C/13C varies from 1.9 up to 10.5, having 4.3 as an average value.
4 Analysis of the results
We have measured C, 12C/13C and N in 63 solar twins from HARPS high-resolution high-quality spectra through a self-consistent, homogeneous and automated procedure. Seven old -enhanced solar twins (HIP 014501, HIP 028066, HIP 030476, HIP 065708, HIP 073241, HIP 074432 and HIP 115577) and the single solar twin anomalously rich in -process elements HIP 064150 were excluded from the further analysis, in order to be consistent with the analyses carried out by Bedell et al. (2018) and Spina et al. (2018) on other elements for the same solar twins sample, representing a Galaxy’s homogeneous population (i.e. the local thin disc (Ramírez et al., 2012)). Therefore, the remaining 55 thin disc solar twins are investigated for studying correlations of [C/Fe], [N/Fe], 12C/13C, [C/N], [C/O] and [N/O] with [Fe/H] and age, as well as [C/N], [C/O] and [N/O] versus [O/H].
The nearby -enhanced stars are in average older than the ordinary thin disc stars (Adibekyan et al., 2011; Haywood et al., 2013). The -rich stars, which have [</Fe>] higher in about 0.1 dex, are split into two Galaxy’s disc different stellar populations, carrying on two distinct dynamical histories, in contrast with the local thin disc stars. Whilst the metal-poor -rich stars actually belong to the thick disc based on their kinematics and orbital parameters, the metal-rich -rich stars exhibit nearly circular orbits close to the Galactic plane (similarly to the thin disc stars). Those seven old -enhanced solar twins could be either thick disc ’metal-rich’ stars (Bedell et al., 2018) or might have likely come from inner disc regions, as speculated by Adibekyan et al. (2011) for the metal-rich -rich stars.
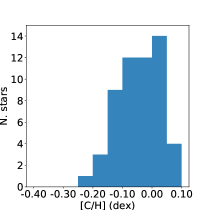
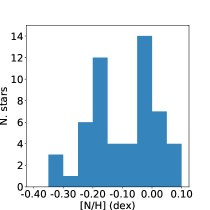
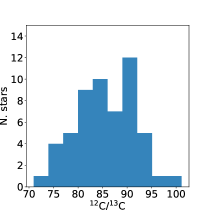
The determination of the C abundance, N abundance and 12C/13C ratio reached, respectively, 100, 100 and 80 per cent of completeness in terms of all selected molecular lines under the 3-clipping criterium. Table 8 compiles our measurements for the 63 solar twins. Figure 4 shows the distributions of [C/H], [N/H] and 12C/13C among 55 thin disc solar twins.
Regarding the 55 thin disc solar twins, [C/Fe] changes from -0.129 up to 0.042 dex and [C/H] from -0.207 up to 0.080 dex. Their average values, respectively, are about -0.040 dex ( = 0.033 dex), and -0.042 dex ( = 0.070 dex). The mean errors of [C/Fe] and [C/H] are, respectively, 0.006 and 0.007 dex; their respective variations are: 0.004-0.011 dex and 0.004-0.013 dex. [N/Fe] changes from -0.313 up to 0.023 dex and [N/H] from -0.310 up to 0.087 dex. Their average values, respectively, are about -0.094 dex ( = 0.075 dex), and -0.096 dex ( = 0.108 dex). The average errors in [N/Fe] and [N/H] are the same, i.e. around 0.030 dex. The standard deviations of the [N/Fe] and [N/H] errors are, respectively, 0.016 and 0.057 dex.
Also regarding the 55 thin disc solar twins, the isotopic ratio 12C/13C varies from 70.9 up to 101.1, presenting an average value around 85.8 ( = 6.2). The error in 12C/13C varies from 1.9 up to 10.5, having 4.3 as an average value (like for all 63 solar twins).
We have investigated [C/Fe], [N/Fe], 12C/13C, [C/N], [C/O] and [N/O] as a function of [Fe/H] and isochrone stellar age, and also [C/N], [C/O] and [N/O] as a function of [O/H]. Only 12C/13C is analysed as a function of [C/Fe] and [N/Fe]. We adopt linear dependence for all relations, based on those 55 thin disc solar twins, whose results are discussed in the following subsections. We have used the Kapteyn kmpfit package111https://www.astro.rug.nl/software/kapteyn/index.html to do all fits to the data. The KMPFIT code performs a robust linear fit versus , which minimizes the orthogonal distance of the overall data points to the fitting curve, taking into account the errors in both variables and under a variance weighting approach. The Sun data are not included in all linear fits. Table 10 compiles the results of all computed linear fits for [C/Fe], [N/Fe], 12C/13C, [C/N], [C/O] and [N/O] as a function of [Fe/H] and age; Table 9 for 12C/13C as a function of [C/Fe] and [N/Fe]; and Table 11 for [C/N], [C/O] and [N/O] as a function of [O/H].
| Star ID | [C/H] | [C/Fe] | [N/H] | [N/Fe] | 12C/13C |
|---|---|---|---|---|---|
| (dex) | (dex) | (dex) | (dex) | ||
| Sun | 0.0020.001 | 0.0020.001 | 0.0020.018 | 0.0020.018 | 88.70.5 |
| HIP 003203 | -0.1290.012 | -0.0790.010 | -0.3010.056 | -0.2510.056 | 84.99.8 |
| HIP 004909 | -0.0180.011 | -0.0660.009 | -0.1220.042 | -0.1700.042 | 89.38.5 |
| HIP 006407 | -0.0920.012 | -0.0340.010 | -0.1800.045 | -0.1220.045 | 87.97.5 |
| HIP 007585 | 0.0400.006 | -0.0430.005 | -0.0350.024 | -0.1180.024 | 87.03.2 |
| – | – | – | – | – | – |
| HIP 118115 | -0.0540.007 | -0.0180.006 | -0.1960.030 | -0.1600.030 | 85.14.0 |
4.1 [C/Fe] and [N/Fe] versus [Fe/H] and age
Concerning the relations between [C,N/Fe] and [Fe/H] in the small range of metallicity of solar twins (Fig. 5), we have found that: (i) [C/Fe] is anti-correlated with [Fe/H] with a slope of -0.0560.012 (the relative error of the negative slope is about 21 per cent); and (ii) there is a tentative correlation between [N/Fe] and [Fe/H] (slope relative error of 35 per cent or just 2.8 of significance).
The Sun seems slightly above, when compared against the fits of [C/Fe] and [N/Fe] versus [Fe/H] of the solar twins (within about 1 of deviation in average from the linear relations). This result is expected indeed, because Meléndez et al. (2009) found, as confirmed afterwards by other works (Ramírez et al., 2009, 2010; Nissen, 2015; Bedell et al., 2018), that the Sun is slightly deficient in refractory elements relative to volatile ones in comparison with most of solar twins. Being C and N volatile elements and Fe a refractory element, thus the Sun is slightly enhanced in C and N relative to Fe. The 50 per cent equilibrium condensation temperatures of C, N, O and Fe, for the solar nebula and the Solar System composition taking into account the total pressure at 1 AU, are respectively 40, 123, 180 and 1334 K (Lodders, 2003).
We can see relatively good agreements by comparing our derived relations [C/Fe]-[Fe/H] and [N/Fe]-[Fe/H] with those by Da Silva et al. (2015) done over a more extended range in [Fe/H] than solar twins, for a sample of 120 thin disc FGK dwarfs. Restricting the results from Da Silva et al. (2015) to the small metallicity range of solar twins, there would be a negative trend between [C/Fe] and [Fe/H] and no trend between [N/Fe] and [Fe/H], with the Sun data also slightly above the overall data set. Unfortunately, Da Silva et al. (2015) did not publish the slopes for the anti-correlation and correlation [C/Fe] vs. [Fe/H] found respectively for stars with [Fe/H] below and above zero, neither for the positive correlation [N/Fe] vs. [Fe/H] found along the [Fe/H] whole range. Suárez-Andrés et al. (2017) recently presented linear fits between [C/Fe] and [Fe/H] for a huge sample of 1110 solar-type stars. They also derived [C/Fe]-[Fe/H] fits for stars with [Fe/H] below and above the solar value. We cannot do the same unfortunately, because the [Fe/H] amplitude of our solar twins sample is much smaller. On the other hand, we are able to split our sample in terms of stellar age due to a wide coverage in this parameter (see the following paragraphs and last subsection in the case of the carbon abundance ratios). The Suárez-Andrés et al. (2017)’s sample was split into two groups of stars with planets of different masses and a large comparison sample of stars without detected planets. Additionally, they performed linear fits between [C/H] and [Fe/H] for these subsamples over the whole wide metallicity range (-1.4 [Fe/H] +0.6 dex). For the stellar sample without planets, Suárez-Andrés et al. (2017) found a slope of +0.9700.008 that agrees within 1 with the slope derived by us for this relation (+0.9890.015). Note that the solar twins sample of the current work has only two known planet-host stars so far. On the other hand, Nissen (2015) studied the chemical content of a sample of 21 solar twins like us (just 3 of them holding known planets). However, Nissen (2015) did not provide any fit for the [C/Fe]-[Fe/H] relation. By inspecting the results for carbon, there seems to be a negative trend between [C/Fe] and [Fe/H], as derived by us for a larger solar twins sample. Suárez-Andrés et al. (2016) obtained, for a restricted sample of 32 solar-type stars without known planets, no correlation between [N/Fe] and [Fe/H] in the range -0.45 [Fe/H] +0.55 dex (the slope that they found has a large error, i.e. +0.0400.070). The whole sample of Suárez-Andrés et al. (2016) has 74 stars, 42 of which holding detected planets until the publication date. The slope for the tentative correlation [N/Fe]-[Fe/H] derived by us for solar twins also agrees within 1 with the result from Suárez-Andrés et al. (2016).
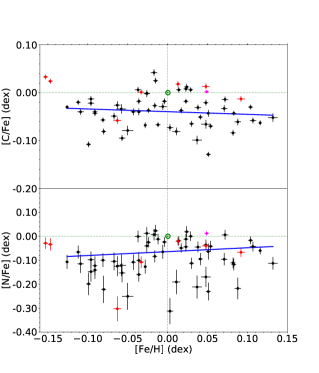
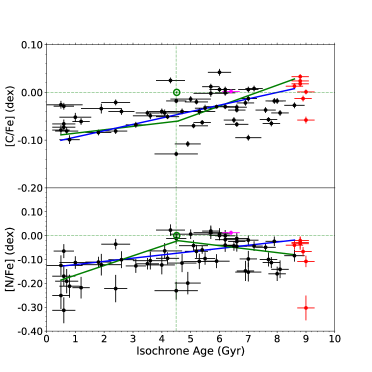
The linear fits of [C,N/Fe] as a function of the isochrone stellar age over the wide range of ages of our solar twins sample (Fig. 5) provide the following results: (i) [C/Fe] is positively well correlated with the stellar age (slope of +0.0130.001 dex.Gyr-1 with a relative error of 8 per cent, i.e. 13 of significance); and (ii) [N/Fe] is also positively well correlated with the stellar age (slope of +0.0130.002 dex.Gyr-1 with a relative error of about 15 per cent). The Sun again seems slightly above, when compared with the derived fits of both [C/Fe] and [N/Fe] versus age of the solar twins (1.2 of deviation in average from the linear relations), confirming the Sun is slightly deficient in refractory elements relative to volatile ones in comparison with solar twins (Meléndez et al., 2009; Nissen, 2015; Bedell et al., 2018).
The analysis of the abundance ratios as a function of the stellar age is extended with linear fits that fix a break point at the Sun’s age, whose value is very well stablished (the fit results are added in Tab. 10). The sample of 55 thin disc solar twins is split into stars with ages up to the Sun’s age (23 “young” solar twins) and stars with ages greater than the solar age (32 “old” solar twins). Analogously to the global single linear fits, the alternative broken linear fits (applied with the Python.Scipy ODR function) perform the minimization of the orthogonal distances of the data points to the fitting function taking into account the errors in both variables. By fixing the abscissa of the break point, the fitting computation is simplified (four free parameters instead of five) and two linear functions are derived with a connection/transition at the solar age. Each broken linear fit is shown associated with the global fit in the same plot (right panel in Fig. 5, bottom panel in Fig. 7 plus Fig. 9). For instance, Da Silva et al. (2015) applied independent linear fits of [X/Fe] versus isochrone stellar age for a sample of FGK dwarfs also considering ages below and above the Sun’s age (X: C, N, O, Na, Mg, Si, Ca, Ti, V, Mn, Fe, Ni, Cu and Ba).
Whilst [C/Fe] is found to have a tentative correlation with age for the “young” solar twins, it is correlated with age for the “old” solar twins, such that the broken linear fit matches well the overall behaviour of [C/Fe] based on the global linear fit (Fig. 5). The broken linear fit exhibits overall effective abundance ratio dispersion comparable to the dispersion of the global single fit. We estimate an effective of 0.039 dex over the whole age scale against 0.037 dex of the global fit ( sqrt(( + )/2)). The broken linear fit [N/Fe]-age gives a stronger correlation with age for the “young” solar twins in comparison with the global fit (slope of +0.041(0.008) dex.Gyr-1), and a negative trend for the “old” solar twins (see Fig. 5 and Tab. 10). However, there is an overall decrease of [N/Fe] with time from the older solar twins towards the younger solar twins, like seen in the global single fit. The effective dispersion of the broken fit over the whole age scale is also equivalent to the dispersion of the global single fit (overall of 0.067 dex against 0.070 dex of the global fit).
If we could consider our solar twins relations [C,N/Fe]-age as roughly representative for the local thin disc evolution, rude estimates for the current [C/Fe] and [N/Fe] ratios in the local ISM would be respectively -0.11 and -0.13 dex (as suggested by the global fits’ linear coefficients). In addition to these estimates, the global fits also suggest that [C/Fe] and [N/Fe] would be respectively around 0.00 and -0.02 dex for 8.6 Gyr ago in the local ISM, which is close to “the formation epoch” of the thin disc. The [C/Fe]-age broken fit for the solar twins younger and older than the Sun also provides the same rude estimates for the current and ancient values of [C/Fe] in the local ISM. In fact, the precision of absolute values for both abundance ratios estimated for the past and the present has less statistical significance in comparison with their overall distribution and variation in time. At least, we are confident to predict that both [C/Fe] and [N/Fe] in the local ISM are certainly under-solar nowadays as well as they were close to the solar ratios in average 8.6 Gyr ago.
Therefore, [C/Fe] and [N/Fe] have decreased along the evolution of the Galactic thin disc in the solar neighbourhood during nearly 9 Gyr. This is likely due to a higher relative production of iron in the local disc (by basically SN-Ia in binary systems) in comparison with the nucleosynthesis of carbon and nitrogen (by single low-mass/intermediate-mass AGB stars plus metal-rich massive stars too). Whilst the carbon-to-iron ratio decreases in time and with the iron abundance, the nitrogen-to-iron ratio decreases in time but seems to increase with the iron abundance. Consequently, it is complicated to reach a conclusive statement about the impact of the ratio AGB-stars/SN-Ia or even the frequency of isolated stars relative to binary stars, to consistently explain the lowering of the carbon-to-iron and nitrogen-to-iron ratios over time.
We have found a few GCE models (Kobayashi et al., 2011; Sahijpal, 2013) that partially agree with our estimates for the [C/Fe] and [N/Fe] abundance ratios at the solar neighbourhood. The GCE models with AGB yields by Kobayashi et al. (2011) predict [N/Fe] around 0.0 dex for “the formation epoch” of the thin disc (see Fig. 13 in this publication considering [Fe/H] = -1.5 dex as the minimum metallicity for the thin disc stars), predicting a 12C/13C isotopic ratio around 80 in the current time (see Figs. 17-19 in this publication). The models case A by Sahijpal (2013) predict [C/Fe] around -0.1 dex in the current time (see Fig. 5 in this paper), and the grid model #30 of the case A given by the same work specifically predicts [C/Fe] around the solar value for “the formation epoch” of the thin disc (also see Fig. 5 in this publication, assuming an initial [Fe/H] = -1.5 dex).
Besides these comparisons against theoretical predictions, all the GCE models by Romano et al. (2019) predict an anti-correlation between [C/Fe] and [Fe/H] around the solar ratios, like we observe, and three of them show a positive correlation between [N/Fe] and [Fe/H], as our result. There are only two models that simultaneously reproduce both observed relations for our solar twins sample, but just roughly and qualitatively. Like the others, these fiducial models entitled MWG-02 and MWG-07 are multi-zone models with two almost independent infall episodes, a star formation rate proportional to both star and total surface mass density, the Kroupa initial mass function (IMF) with a slope = 1.7 for the range of massive stars, and a specific set of stellar yields for low-mass/intermediate-mass stars, super-AGB stars (7-9 M⊙) and massive stars (see more details in Romano et al. (2019)). The particular nucleosynthesis prescriptions of the MWG-02 model is based on the stellar yields of low-mass/intermediate-mass stars from Karakas (2010), the stellar yields of massive stars from Nomoto et al. (2013) with no stellar rotation effects considered, and absence of contributions by super-AGB stars, hypernovae and novae. The ingredients of the MWG-07 model are: stellar yields of low-mass/intermediate-mass stars, super-AGB stars and super solar metallicity stars from Ventura et al. (2013), the stellar yields of massive stars from Limongi & Chieffi (2018) with no stellar rotation effects included, and absence of contributions by hypernovae and novae.
Nissen (2015) also obtained a linear correlation of [C/Fe] as a function of age for a smaller sample of solar twins, whose slope (0.01390.0020 dex.Gyr-1) and intercept (-0.1100.011 dex) are very close to our results. Similarly to Nissen (2015), Da Silva et al. (2015) did an important work, presenting for 140 FGK dwarfs a series of linear fits of abundance ratios [X/Fe] as a function of [Fe/H] and isochrone stellar age. Since Da Silva et al. (2015) performed independent fits for ages below and above the solar age without publishing the slopes, we can just make a qualitative comparison. Whilst they found a nearly global positive trend of [C/Fe] versus age, agreeing with our prediction, their data suggest an overall negative trend for [N/Fe] as a function of age, opposite to our global single fit over the whole age scale, like Suárez-Andrés et al. (2016), who also found negative trends of [N/Fe] as a function of age for more restricted samples of solar-type stars with and without known planets in comparison with Da Silva et al. (2015). On the other hand, we have found a negative trend of [N/Fe] with age only for the solar twins older than the Sun.
Very recently, Nissen et al. (2020) have proposed that the relations between several abundance ratios and stellar age derived from observations of solar type-stars ([C/Fe] and [Fe/H] included) might be represented by two distinct sequences that would be interpreted as evidence of two episodes of star formation induced by the accretion of gas onto the Galactic disc. The separation of the two sequences in the stellar age scale would be around 5-6 Gyr, approaching close to the formation epoch of the Sun (see Figure 3 in their paper showing the age-metallicity relation). This result would substantiate the fits of [C,N/Fe] as a function of stellar age for FGK dwarfs younger and older than the Sun done by Da Silva et al. (2015) and alternatively done in the current work too, or even of [C,N/Fe] as a function of [Fe/H] by Da Silva et al. (2015), and [C/Fe] as a function of [Fe/H] by Suárez-Andrés et al. (2017) for stars with [Fe/H] below and above zero.
We are able then to qualitatively compare our thin disc solar twins relation [C/Fe]-age against the results from Nissen et al. (2020) obtained very recently for 72 nearby solar-type stars with -0.3 [Fe/H] +0.3 dex through the analysis of HARPS spectra. They split their sample into two distinct stellar populations based on their age-[Fe/H] distribution: old stars and young stars. Nissen et al. (2020) found [C/Fe] increasing with the stellar age, like we have derived too. A linear fit would not be good enough to reproduce the whole data distribution of both populations, which cover ages from 0 up to 11 Gyr. None kind of fit was tried by them (rather than a linear fit, perhaps, a higher order polynomial fitt would work for their data distribution). Coincidently, they found that [C/Fe] tends to decrease from about +0.1 dex 10 Gyr ago down to around -0.1 dex now, such that the carbon-to-iron ratio would be very close to the solar value nearly to 8.6 Gyr ago, like we observe.
Our relations [C/Fe]-[Fe/H] and [C/Fe]-age derived for local thin disc solar twins can also be compared with the very recent carbon abundance measurements obtained for 2133 FGK dwarfs by Franchini et al. (2020) in the Gaia-ESO Survey. They classified their sample stars as thin and thick disc members by using independent chemical, kinematical and orbital criteria. The under-solar anti-correlation of [C/Fe] versus [Fe/H] found by us qualitatively agrees with the Franchini et al. (2020)’s relation obtained for thin disc dwarfs, specially in the cases of the kinematical and orbital classifications (unfortunately they did not apply any kind of fit to their data). The overall increase of [C/Fe] as a function of age found by us is compatible with the Franchini et al. (2020)’s results for the thin disc stars, which cover ages from 2 up to 12 Gyr (again, the kinematical and orbital classifications provide better agreements). Differently from our analysis, the variation of the carbon-to-iron ratio seems to better follow a high-order polynomial function of age rather than a linear fit. They obtained [C/Fe] increasing from about -0.12 dex 2 Gyr ago up to near the solar level 12 Gyr ago.
4.2 12C/13C versus [C/Fe], [N/Fe], [Fe/H] and age
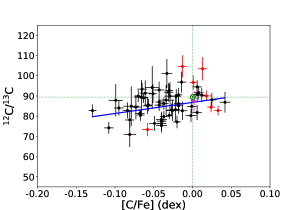
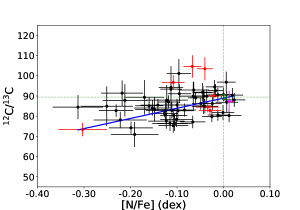
Since we have homogeneously measured the abundances of C, N and the isotopic ratio 12C/13C, we investigate effects due to some internal mixing process associated with the CNO cycles that could have changed these photospheric chemical abundances, perhaps altering their pristine chemical composition. According to the plots of 12C/13C versus [C/Fe] and [N/Fe] (Fig. 6), the 12C/13C ratio is somehow correlated with [C/Fe] (slope with a relative error of 25 per cent, i.e. 3.9 of significance), as expected from some mixing process connected with a CNO cycle. On the other hand, the C isotopic ratio is not anti-correlated with [N/Fe], instead being positively correlated (slope with a relative error of about 16 per cent), unlike expectations for CNO processing. These trends are compatible with no deep internal mixing in association with products from the CNO cycle.
| [C/Fe] | [N/Fe] | |||||
|---|---|---|---|---|---|---|
| slope | intercept | slope | intercept | |||
| (dex-1) | (dex-1) | |||||
| 12C/13C | 5514 | 86.80.8 | 6.0 | 50.28.2 | 88.90.8 | 6.3 |
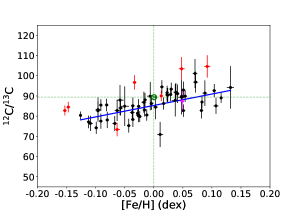
The linear fit of 12C/13C as a function of metallicity (Fig. 7) demonstrates that 12C/13C is positively well correlated with [Fe/H] for the solar twins sample in their metallicity range -0.126 [Fe/H] +0.132 dex (slope of +56.57.2 Gyr-1, i.e. slope with a relative error of just 13 per cent). The isotopic ratio 12C/13C increases from 78.2 up to 92.8 in the interval of metallicity of our sample stars (a variation of 3 of the derived fit). In fact, the statistical significance of this observational result is basically on the overall increase of the isotopic ratio as a function of [Fe/H], putting the absolute extreme values aside. Surprisingly, the GCE models follow an opposite trend with [Fe/H], something that is worth exploring in further GCE models.
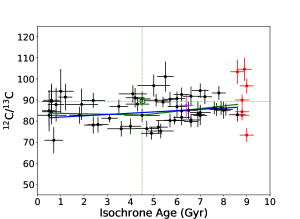
The linear fit of 12C/13C as a function of the isochrone stellar age (Fig. 7) shows that 12C/13C is marginally correlated with age for the solar twins sample (slope of +0.6140.250 Gyr-1, i.e. slope with a relative error of 41 per cent, or just 2.5 of significance). There seems to be a positive trend between this isotopic ratio and the isochrone age, presenting overall decrease of 12C/13C from a value of 86.6 (8.6 Gyr ago) down to 81.3 in the current time (a variation of only 0.8 of the derived fit). The broken linear fit splitting the sample into solar twins younger and older than the Sun is statistically equivalent to the global single fit (also see Tab. 10).
The result from the 12C/13C-age relation is very interesting indeed in association with the other derived relation 12C/13C-[Fe/H]. We remind the reader that the fundamental statistical significance of our result is focused on the negative trend found between the isotopic ratio and the time rather than the absolute values of the predictions for the local ISM now and 8.6 Gyr ago. The GCE models must prove or not this observational evolutive trend. Nevertheless, the decrease of 12C/13C in time would be perharps expected along the evolution of the Galactic disc due to the delayed contribution of the low-mass/intermediate-mass AGB stars.
The terrestrial 12C/13C = 89.40.2 (Coplen et al., 2002), as suggested by Asplund et al. (2009) to represent the current solar value (and his pristine value too), is in between the solar photosphere values of 86.83.8 by Scott et al. (2006), 91.41.3 by Ayres et al. (2013), and 93.50.7 by Lyons et al. (2018). Possible causes for the small apparent discrepancy between the terrestrial and solar ratios are discussed by Lyons et al. (2018).
Recently, the 12C/13C ratio has been employed by Adibekyan et al. (2018) as one of the criteria defining solar siblings, meaning stars that formed in the same birth cluster as the Sun, being thus stars with ages, chemical compositions and kinematics as the Sun (Ramírez et al., 2014b). We recommend that the variation in the 12C/13C ratio around the solar value should be within 4.5 unities: 84.9 12C/13C 93.9 (i.e. with a 3 agreement around the solar value proposed by Asplund et al. (2009) and Coplen et al. (2002), assuming an average error from the four values previously listed).
We have found 28 stars in our sample of 55 thin disc solar twins that could be solar sibling candidates based on the C isotopic ratio only. However, considering that solar siblings must have similar ages to the Sun, only 10 stars are left (HIP 025670, HIP 040133, HIP 049756, HIP 064673, HIP 07585, HIP 079672, HIP 089650, HIP 095962, HIP 104045 and HIP 117367). We propose that the age interval for the convergence to the solar age should vary from 3.36 Gyr up to 5.76 Gyr, i.e. 3 around the solar value assuming the typical error in the isochrone age of our solar twins sample. Furthermore, nevertheless, the stars must have similar kinematics to the Sun, and further applying this condition, none solar sibling candidate remains as solar sibling.
Concerning the comparisons against predictions of the state-of-the-art GCE models to track the CNO isotopes in the local ISM by Romano et al. (2017), our results for solar twins, spanning ages between 0.5 up to 8.6 Gyr (around 8 Gyr in time), agree with the predictions of one of their models, because the 12C/13C ratio appears actually decreasing since 8.6 Gyr up to now (i.e. since 5 Gyr ago until nowadays) and this model simultaneously reproduce both the solar and ISM 12C/13C ratios. This model does not include C yields from super-AGB stars and does not take the effects of stellar rotation on the yields of massive stars into account (Model 1 in Romano et al. (2017) renamed as MWG-02 in Romano et al. (2019)). Similarly to the Romano et al. (2019)’s GCE models, it is a multi-zone model with two infall episodes, star formation rate proportional to both star and total surface mass density, the Kroupa IMF under a slope = 1.7 for the range of massive stars, and a set of stellar yields for low-mass/intermediate-mass stars, super-AGB stars and massive stars (read details in Romano et al. (2017)).
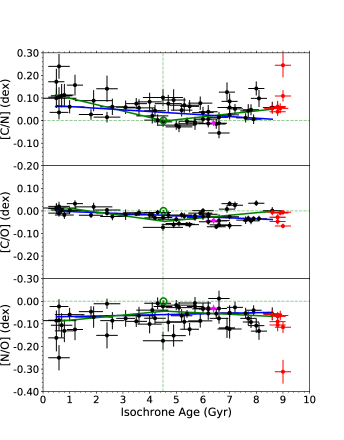
4.3 [C/N], [C/O] and [N/O] versus [Fe/H], [O/H] and age
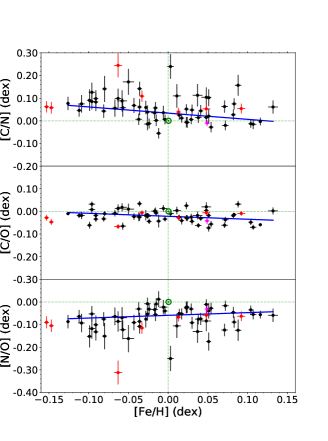
We have used our measurements of carbon and nitrogen together with the oxygen abundances homogeneously derived by Bedell et al. (2018) for the same solar twins sample, for computing their [C/N], [C/O] and [N/O] ratios. Regarding the relations of these abundance ratios as a linear function of [Fe/H] (shown in Fig. 8), we have found that: (i) [C/N] is anti-correlated with [Fe/H] (the relative error of the negative slope is 22 per cent, i.e. 4.6 of significance level); (ii) [C/O] is anti-correlated with [Fe/H] (relative error of the negative slope of about 18 per cent); and (iii) there is a tentative correlation between [N/O] and [Fe/H] (roughly 2 significance level). The Sun, when compared against the fits versus [Fe/H] of the solar twins, seems to be about normal (within about 1-sigma) in the C/N, C/O and N/O ratios. In Meléndez et al. (2009), the [C,N,O/Fe] ratios are about the same within the error bars, which is expected considering that the three elements have low condensation temperatures. In this sense, the C/N, C/O and N/O ratios in Meléndez et al. (2009) are roughly about the same (within the errors) in the Sun and solar twins, as also found in the present work.
Due to an existence of a few electronic transitions of oxygen in the optical range and many Fe I and Fe II lines in the case of FGK stars, iron is usually used to trace the stellar metallicity. On the other hand, oxygen is the most abundant metal in stars, being in fact considered the best indicator of the metallicity of any star or stellar system. Therefore, it becomes interesting to compare [C/N], [C/O] and [N/O] directly with [O/H], also because these abundance ratios measured in the gas phase for other galaxies are often given as a function of O and, secondly, oxygen has a simpler nucleosynthetic origin (basically made by massive stars that die as SN-II) in comparison with iron (both SN-II and SN-Ia).
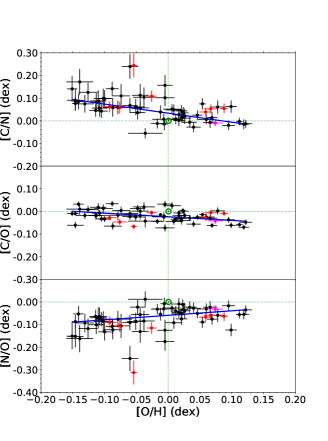
[C/N], [C/O] and [N/O] as a function of [O/H] for the 55 thin disc solar twins are also shown in Fig. 8. Regarding the correspondent linear fits, we have found that: (i) [C/N] is anti-correlated with [O/H] (the negative slope has 7.9 of significance level); (ii) [C/O] is anti-correlated with [O/H] (negative slope with 8.1 significance level); and (iii) [N/O] is correlated with [O/H] (positive slope with 3.9 significance level).
[C/N] and [C/O] present the same behaviour as a function of both [Fe/H] and [O/H], but while [N/O] is well correlated with [O/H], it only shows a tentative correlation against [Fe/H]. The Sun seems normal (within about 1-sigma) in the C/N, C/O and N/O ratios.
Making an analogy between the -elements oxygen and magnesium (products of the evolution of massive stars), we can make a qualitative comparison between our relation [C/O]-[O/H] derived for local thin disc solar twins and the global relation [C/Mg]-[Mg/H] observed by the GALAH222GALactic Archaeology with HERMES optical spectroscopic survey for two distinct Galactic’s disc stellar populations that embraces 12,381 out of 70,924 GALAH stars (Griffith et al., 2019). Their two stellar groups are denominated by high-/low-Ia and low-/high-Ia (where Ia means SN-Ia) based on cuts in [Mg/Fe] in the diagram [Mg/Fe] vs. [Fe/H] (see their Figure 2), corresponding, respectively, to thick and thin disc stars as chemically identified by others works (e.g. Franchini et al. (2020)). Griffith et al. (2019) found that [C/Mg] is anti-correlated with [Mg/H] for low- (thin disc members), although no fit is provided. [C/Mg] versus [Mg/H] qualitatively shows the same behaviour of our fit [C/O]-[O/H], albeit their relation seems steeper.
By “cross-correlating” our observed relations [C/O] and [N/O] versus [O/H] with the predictions of the GCE models by Romano et al. (2019), we have found there is no agreement in the case of the [C/O]-[O/H] relation, observed by us as an anti-correlation, differently from a positive correlation predicted by some Romano et al. (2019)’s models covering the chemical composition of solar twins ([C/O] = [O/H] = 0.0( 0.15) dex). On the other hand, there is a qualitative agreement of the observed relation [N/O]-[O/H] for our solar twins sample against some Romano et al. (2019)’s models, showing that [N/O] is positively correlated with [O/H] around [N/O] = [O/H] = 0.0( 0.13) dex. The Romano et al. (2019)’s MWG-07 model, which roughly and simultaneously reproduces both observed relations [C,N/Fe]-[Fe/H] (Subsection 4.1), is not among these models that show qualitative agreements against the [N/O]-[O/H] observed relation. However, one of them is coincidently the same model that reproduces our observed relation 12C/13C-age, which is named as MWG-02 by Romano et al. (2019) and is equivalent to the Model 1 in Romano et al. (2017).
| [Fe/H] | stellar age | |||||
| slope | intercept | slope | intercept | |||
| (dex) | (dex) | (dex.Gyr-1) | (dex) | (dex) | ||
| [C/Fe] | -0.0560.012 | -0.0390.001 | 0.033 | 0.0130.001 | -0.1070.003 | 0.037 |
| 0.0070.004 | -0.0930.014 | 0.038 | ||||
| 0.0220.006 | -0.1600.036 | 0.040 | ||||
| [N/Fe] | 0.1620.057 | -0.0640.003 | 0.080 | 0.0130.002 | -0.1350.010 | 0.070 |
| 0.0410.008 | -0.2070.031 | 0.075 | ||||
| -0.0150.007 | 0.0450.059 | 0.059 | ||||
| [C/N] | -0.2740.059 | 0.0340.004 | 0.056 | -0.0070.002 | 0.0690.011 | 0.054 |
| -0.0280.006 | 0.1270.023 | 0.052 | ||||
| 0.0130.006 | -0.0610.045 | 0.046 | ||||
| [C/O] | -0.1300.023 | -0.0220.002 | 0.026 | -0.0050.001 | 0.0020.004 | 0.025 |
| -0.0160.003 | 0.0270.012 | 0.018 | ||||
| 0.0110.004 | -0.0970.025 | 0.027 | ||||
| [N/O] | 0.1200.061 | -0.0590.004 | 0.050 | 0.0020.002 | -0.0700.011 | 0.050 |
| 0.0110.005 | -0.0950.020 | 0.057 | ||||
| -0.0060.005 | -0.0170.039 | 0.040 | ||||
| (dex-1) | (Gyr-1) | |||||
| 12C/13C | 56.57.2 | 85.30.5 | 4.7 | 0.6140.250 | 81.31.4 | 6.3 |
| -0.2180.893 | 83.93.4 | 6.2 | ||||
| 1.2480.709 | 77.26.2 | 6.3 | ||||
| [O/H] | |||
| slope | intercept | ||
| (dex) | (dex) | ||
| [C/N] | -0.4000.051 | 0.0340.004 | 0.046 |
| [C/O] | -0.1610.020 | -0.0240.002 | 0.025 |
| [N/O] | 0.2010.053 | -0.0590.004 | 0.045 |
After inspecting the global linear relations of [C/N], [C/O] and [N/O] as a function of the isochrone stellar age in the wide range of ages of the 55 thin disc solar twins (Fig. 9), we have found that: (i) [C/N] is somehow anti-correlated with age (the relative error of the negative slope is about 29 per cent, i.e. 3.5 of significance level); (ii) [C/O] is anti-correlated with age (a relative error of the negative slope of about 20 per cent); and (iii) there is no correlation between [N/O] and age (the relative error of the slope reaches 100 per cent).
Alternatively, we have also derived composed linear fits of [C/N], [C/O] and [N/O] by splitting the sample into solar twins younger and older than the Sun (see the parameters of the broken linear fits in Tab. 10 and the plots in Fig. 9). The [C/N] and [C/O] ratios are found to be anti-correlated with the stellar age for the solar twins younger than the Sun (slightly more anti-correlated than in the global single fits), but both ratios show a positive trend with age for the older solar twins. Curiously, the break point of the [C/N]-age broken fit matches the solar ratio. [N/O], as shown by the broken fit for “young” and “old” solar twins, follows the same overall behaviour of the global single linear fit (i.e. it is likely constant in time, in fact). The overall dispersion of every broken fit is comparable to the dispersion of the correspondent global single fit. Notice that dependence of the [C/N] and [C/O] ratios on age (or temporal evolution of the thin disc) is enhanced for the “young” solar twins in comparison with the overall behaviour derived from the single linear fit (the slopes are different in 2-sigma). The result for [C/O] corroborates the rise of [C/Mg] for thin disc young stars as observed by Franchini et al. (2020), suggesting two competing scenarios: (i) a delayed contribution from low-mass stars to explain the carbon abundance in the Galactic thin disc along the recent times (Marigo et al., 2020), and (ii) an enhanced mass loss through stellar winds from metal-rich massive stars that produces an increased C yield at solar and super-solar metallicities.
On one hand, the Sun, when compared against the fits versus age of the solar twins, seems about normal (within about 1-sigma) in the C/N, C/O and N/O ratios. On the other hand, the C/N ratio in the Sun is placed close to the bottom end of the solar twins distribution in all [C/N]-[Fe/H], [C/N]-[O/H] and [C/N]-age planes. The solar C/O ratio is specifically found near to the distribution high end for the mid-age solar twins only (all [C/O]-[Fe/H], [C/O]-[O/H] and [C/O]-age distributions), that qualitatively agrees well with Bedell et al. (2018), who analysed the same solar twins sample, as well as with Nissen et al. (2020) for a solar analogs sample. Particularly, the N/O ratio in the Sun is found to be placed at the high end of the overall solar twins distribution (1.2 in average above the relations [N/O]-[Fe/H], [N/O]-[O/H] and [N/O]-age of the solar twins).
Our derived relation [C/O]-age for thin disc solar twins can be finally and directly compared with the relations [C/Mg] vs. age and C/O number ratio vs. age by Nissen & Gustafsson (2018), which compiled data from a set of different samples of solar twins: Nissen (2015), Nissen et al. (2017) and Bedell et al. (2018) (the former work handled the same sample of the current work, but performed their own C measurements as explained before). While the Nissen & Gustafsson (2018)’s [C/Mg]-age relation has a large data dispersion making hard to assess a temporal analysis, the C/O ratio appears to decrease toward solar twins younger than the Sun, differently from what we have observed. However, the variation of the C/O ratio at a fixed age is comparable with the abundance dispersion measured by us.
Taking into account the global behaviour of these abundance ratios over the whole age scale, in fact the variations of [C/N] and [C/O] are both really small along the evolution of the Galactic thin disc in the solar neighbourhood (only 10-17 per cent), and there is no variation at all for [N/O]. [C/N] in the ISM would have increased from around the solar value 8.6 Gyr ago up to +0.07 dex now, whilst [C/O] would have increased from -0.04 dex 8.6 Gyr ago up to the solar ratio now.
The absence of evolution of the N/O ratio in both time and [Fe/H] in solar twins suggests uniformity in the nitrogen-oxygen budget for potential giant planet formation around these stars (note that C/O has or would have small variations versus age and [Fe/H] respectively, as also derived by Bedell et al. (2018) and Nissen (2015)).
We are now able to state that along the evolution of the Galactic local disc, C seems to have been stochastically more accumulated in the ISM relatively compared with N and O, since the abundance ratios C/N and C/O increase with time, although they decrease with both metallicity indicators (Fe and O abundances) in the limited metallicity coverage of solar twins. As expected, C and N are produced and ejected by low-mass/intermediate-mass (AGB phase) plus massive stars (SN-II), and O basically by massive stars only. Even though the N/O ratio is kept constant along the time, N does not necessarily follow O specially because [N/O] is found to be correlated with [O/H]. Therefore, the N production seems to have a more relative contribution from massive stars than carbon, or, in other words, carbon would be relatively more synthesized by low-mass/intermediate-mass stars than nitrogen (as suggested by Franchini et al. (2020) and Marigo et al. (2020)). However, alternatively, an enhanced mass loss from metal-rich massive stars could produce an increased C yield at solar and super-solar metallicities.
5 Summary and Conclusions
We have measured C, 12C/13C and N in 63 solar twins through a self-consistent and homogenous procedure based on a high-precision spectral synthesis of molecular lines/features in the blue region (specifically 4170-4400 Å), being 7 of them old alpha-enhanced solar twins and 1 having an excess of -process elements, which were excluded from further analysis, remaining 55 solar twins for studying correlations with age and metallicity in the solar neighbourhood. All 55 stars have thin disc kinematics (Ramírez et al., 2012). The carbon abundance has been derived from 12CH A-X lines and the 12C/13C ratio from 13CH-12CH features of the same electronic system. The nitrogen abundance has been extracted from 12C14N B-X lines (CN Violet System), taking into account the measured carbon abundance and its main isotopic ratio. We provide comprehensive lists of these molecular lines and features: twelve CH A-X lines, six 13CH-12CH A-X features and five CN B-X lines. The average errors in the C and N abundances are around 0.006 and 0.03 dex respectively (very similar in both [X/Fe] and [X/H] scales). Specifically, the error in 12C/13C changes from 1.9 up to 10.5 (about 4.3 as a mean value).
We could obviously conclude, as expected, that the measured abundances of C and N as well as the isotopic ratio 12C/13C represent in fact the pristine chemical composition of every solar twin of our sample, because we have not found an overall connection among the photospheric 12C/13C, [C/Fe], [N/Fe] and [C/N] that could be an indicative of some internal mixing process associated with the CNO cycles (for instance, 12C/13C is not correlated with [12C/14N], being anti-correlated indeed).
We confirm that the Sun is slightly enhanced in the volatiles C and N relatively to Fe in comparison with solar twins, like Bedell et al. (2018), Nissen (2015), and Meléndez et al. (2009) have already found for volatiles in general. On the one hand, the Sun seems to be normal in the 12C/13C, C/O, C/N and N/O ratios within the errors (about 1-sigma) in comparison with solar twins. Notice that Meléndez et al. (2009) found comparable (within the errors) C/Fe, N/Fe and O/Fe ratios in the Sun relative to the solar twins, probably because the highly volatile elements C, N and O have similar low condensation temperatures among them. On the other hand, we have particularly found that the N/O ratio in the Sun is placed at the high end of the overall solar twins distribution, the solar C/N ratio just close to the distribution bottom, and the solar C/O ratio near to the high end for the distribution of the mid-age solar twins only.
The linear fits of [C/Fe] and [N/Fe], as a function of [Fe/H] and isochrone stellar age for the analysed solar twins sample, lay under solar for the whole scale of both [Fe/H] and age. Whilst [C/Fe] decreases with [Fe/H] in the restrict metallicity interval of solar twins, we have found a positive trend between [N/Fe] and [Fe/H]. On the other hand, both [C/Fe] and [N/Fe] increase with age (or, in other words, both [C/Fe] and [N/Fe] decrease with time from around the solar ratio value 8.6 Gyr ago down to nearly -0.1 dex now). Furthermore, the Sun is placed around 1 in average above the linear fits [X/Fe]-[Fe/H] and [X/Fe]-age. This indicates that the Sun is slightly enhanced in both C and N relative to Fe in comparison with solar twins. For the relations [C/Fe]-[Fe/H] and [N/Fe]-[Fe/H], our results agree with Da Silva et al. (2015); Suárez-Andrés et al. (2016, 2017) that investigated solar-type dwarfs. For the [C/Fe]-[Fe/H] relation, our results also agree with Nissen (2015), who analysed solar twins like the ones studied in this work. Our under-solar anti-correlation of [C/Fe] vs. [Fe/H] qualitatively agrees with the Franchini et al. (2020)’s relation obtained for thin disc dwarfs (specially in the cases of their kinematical and orbital classifications). Regarding the [C/Fe]-age relation, our results agree with Da Silva et al. (2015); Bedell et al. (2018) (only this work done for solar twins). Coincidently, Nissen et al. (2020) found that [C/Fe] tends to decrease from about +0.1 dex 10 Gyr ago down to around -0.1 dex now, such that the carbon-to-iron ratio would be very close to the solar value nearly to 8.6 Gyr ago, like we observe through both kinds of linear fits (single and broken). The overall increase of [C/Fe] as a function of age found by us is compatible with the Franchini et al. (2020)’s results that cover ages from 2 up to 12 Gyr. However, for the [N/Fe]-age relation, our results do not agree with neither Da Silva et al. (2015) nor Suárez-Andrés et al. (2016), perhaps because these studies were not restricted to solar twins.
Our solar twins sample has the advantage, relative to solar type dwarfs, that a better precision can be obtained in the solar twins, because systematic errors largely are canceled out in a differential analysis, resulting in improved stellar parameters and chemical abundances, and also in more precise stellar ages relative to the Sun, which is at near the middle of the age distribution of solar twins.
Comparisons against predictions of inhomogeneous chemical evolution models for the solar neighbourhood by Sahijpal (2013) show that our results agree, qualitatively, for the relations [C/Fe]-[Fe/H] and [N/Fe]-[Fe/H] around [Fe/H]=0 for all models, because they predict [C/Fe]-[Fe/H] with negative slope and [N/Fe]-[Fe/H] with positive slope around the solar metallicity. These results suggest that possibly C and N have different stochastic nucleosynthetic productions during the evolution of the Galaxy’s thin disc.
We have measured the 12C/13C isotopic ratio for solar twins for the first time, also focusing on the evolutive analysis on those 55 thin disc solar twins. Our measurements are certainly useful as important constraints for chemical evolution models of the solar neighbourhood, as Romano et al. (2017) had pointed out. We predict 81.3 (1.4) for the current C isotopic ratio in the ISM of the solar neighbourhood, which is in agreement within 1 with the observed value of 6815 by Milam et al. (2005).
No solar sibling is found in our sample following the criteria of similar ages, chemical compositions (12C/13C included) and kinematics to the Sun (Ramírez et al., 2014b; Adibekyan et al., 2018).
We have found that 12C/13C is positively well correlated with [Fe/H] in the small metallicity range of solar twins. This result should be tested against predictions of robust GCE models for the solar vicinity. Regarding specifically the 12C/13C-age relation, this isotopic ratio seems to have decreased a little bit in time along the evolution of the nearby Galaxy’s thin disc. A possible positive trend between 12C/13C and stellar age has been found by us. This is actually in qualitative agreement with the predictions of a couple of GCE models (Romano et al., 2017, 2019).
We have obtained linear anti-correlations for [C/N] and [C/O] as a function of [Fe/H] and [O/H]. For specifically [N/O], we have found no correlation with [Fe/H], but a positive correlation with [O/H]. We have derived linear anti-correlations for [C/N] and [C/O] as a function of age (i.e. both abundance ratios increase with time), and again there is no correlation for [N/O]. [C/O] seems to be more anti-correlated with [Fe/H] and age than [C/N]. In fact, the variations of [C/N] and [C/O] are both really small along the evolution of the Galactic thin disc in the solar neighbourhood. However, we have found greater increase rates in time of both [C/N] and [C/O] ratios for the solar twins younger than the Sun in comparison with the overall single fit.
We have found one common GCE model by Romano et al. (2017) and Romano et al. (2019) (under different denominations), which roughly, qualitatively and simultaneously predict the relations [C/Fe]-[Fe/H], [N/Fe]-[Fe/H], 12C/13C-age and [N/O]-[O/H] derived in the present work for a sample of thin disc solar twins. Surprisingly, the GCE models follow an opposite trend between 12C/13C and [Fe/H] (we have obtained a direct correlation), something that is worth exploring in further GCE models. Moreover, GCE models must also prove or not the observational trend between 12C/13C and stellar age derived by us for solar twins.
We can conclude that C does not exactly follow neither N nor O as a function of [Fe/H] and [O/H] and the time too. We can also state that carbon and nitrogen likely have had different nucleosynthetic origins along the Galaxy thin’s disc evolution. The N production seems to have a more relative contribution from massive stars than carbon, or, in other words, carbon would be relatively more synthesized by low-mass/intermediate-mass stars than nitrogen (as suggested by Franchini et al. (2020) and Marigo et al. (2020)). Particularly, we have found an increase in time of both [C/N] and [C/O] ratios for the solar twins younger than the Sun. However, an alternative explanation could come from an enhanced mass loss through stellar winds from metal-rich massive stars that would increase the C yield at solar and super-solar metallicities.
The absence of evolution of [N/O] in both [Fe/H] and time in solar twins suggests uniformity in the nitrogen-oxygen budget for potential giant planet formation around these stars, although [N/O] is seen to be correlated with [O/H]. Our results can contribute to the ‘CNO composition – planet formation’ connection (mainly linked to the formation of icy planetesimals, watery super-earths and/or giant planets, Marboeuf et al. (2014)).
Our results for C, 12C/13C and N in a sample of nearby solar twins, with well-determined parameters and spanning a wide range in age, are certainly excellent constraints to understand the chemical evolution of thin disc in the solar vicinity, as well as to study the nucleosynthetic origins of C, N, O and Fe along the Galaxy’s evolution.
Acknowledgements
This study was financed in part by the Coordenação de Aperfeiçoamento de Pessoal de Nível Superior - Brasil (CAPES) - Finance Code 001 (RBB and ADCM acknowledge this support). ADCM also thanks Conselho Nacional de Desenvolvimento Científico e Tecnológico (CNPq) for the research productivity grant (309562/2015-5). JM thanks FAPESP (2018/04055-8) and CNPq for the research productivity grant (306730/2019-7). LS acknowledges financial support from the Australian Research Council (Discovery Project 170100521). We are also grateful for the anonymous referee by his/her critical revision to improve this work.
Data availability
The data underlying this article are available in the article and in its online supplementary material.
References
- Adibekyan et al. (2011) Adibekyan V. Z., Santos N. C., Sousa S. G., Israelian G., 2011, A&A, 535, L11
- Adibekyan et al. (2018) Adibekyan V., et al., 2018, A&A, 619, A130
- Alves-Brito et al. (2010) Alves-Brito A., Meléndez J., Asplund M., Ramírez I., Yong D., 2010, A&A, 513, A35
- Asplund et al. (2009) Asplund M., Grevesse N., Sauval A. J., Scott P., 2009, ARA&A, 47, 481
- Ayres et al. (2013) Ayres T. R., Lyons J. R., Ludwig H. G., Caffau E., Wedemeyer-Böhm S., 2013, ApJ, 765, 46
- Barklem & Collet (2016) Barklem P. S., Collet R., 2016, A&A, 588, A96
- Bedell et al. (2018) Bedell M., et al., 2018, ApJ, 865, 68
- Bensby et al. (2003) Bensby T., Feltzing S., Lundström I., 2003, A&A, 410, 527
- Booth & Owen (2020) Booth R. A., Owen J. E., 2020, MNRAS, 493, 5079
- Botelho et al. (2019) Botelho R. B., et al., 2019, MNRAS, 482, 1690
- Brooke et al. (2014) Brooke J. S. A., Ram R. S., Western C. M., Li G., Schwenke D. W., Bernath P. F., 2014, ApJS, 210, 23
- Castelli & Kurucz (2004) Castelli F., Kurucz R. L., 2004, New Grids of ATLAS9 Model Atmospheres (arXiv:astro-ph/0405087)
- Charbonnel (1994) Charbonnel C., 1994, A&A, 282, 811
- Chiappini et al. (2003) Chiappini C., Matteucci F., Meynet G., 2003, A&A, 410, 257
- Coplen et al. (2002) Coplen T., et al., 2002, Pure Appl. Chem., 74, 1987
- Cox & Pilachowski (2000) Cox A. N., Pilachowski C. A., 2000, Physics Today, 53, 77
- Da Silva et al. (2015) Da Silva R., Milone A. d. C., Rocha-Pinto H. J., 2015, A&A, 580, A24
- Dos Santos et al. (2016) Dos Santos L. A., et al., 2016, A&A, 592, A156
- Ecuvillon et al. (2004) Ecuvillon A., Israelian G., Santos N. C., Mayor M., García López R. J., Randich S., 2004, A&A, 418, 703
- Feltzing et al. (2003) Feltzing S., Bensby T., Lundström I., 2003, A&A, 397, L1
- Fischer & Valenti (2005) Fischer D. A., Valenti J., 2005, ApJ, 622, 1102
- Franchini et al. (2020) Franchini M., et al., 2020, ApJ, 888, 55
- Ghezzi et al. (2018) Ghezzi L., Montet B. T., Johnson J. A., 2018, ApJ, 860, 109
- Gratton et al. (2000) Gratton R. G., Sneden C., Carretta E., Bragaglia A., 2000, A&A, 354, 169
- Griffith et al. (2019) Griffith E., Johnson J. A., Weinberg D. H., 2019, ApJ, 886, 84
- Haghighipour (2013) Haghighipour N., 2013, Annual Review of Earth and Planetary Sciences, 41, 469
- Haywood et al. (2013) Haywood M., Di Matteo P., Lehnert M. D., Katz D., Gómez A., 2013, A&A, 560, A109
- Jorgensen et al. (1996) Jorgensen U. G., Larsson M., Iwamae A., Yu B., 1996, A&A, 315, 204
- José & Hernanz (2007) José J., Hernanz M., 2007, Journal of Physics G Nuclear Physics, 34, R431
- Karakas (2010) Karakas A. I., 2010, MNRAS, 403, 1413
- Karakas & Lugaro (2016) Karakas A. I., Lugaro M., 2016, ApJ, 825, 26
- Kobayashi et al. (2011) Kobayashi C., Karakas A. I., Umeda H., 2011, MNRAS, 414, 3231
- Kurucz (2017) Kurucz R. L., 2017, Canadian Journal of Physics, 95, 825
- Kurucz (2018) Kurucz R. L., 2018, Kurucz, http://kurucz.harvard.edu/
- Lambert et al. (2013) Lambert J., Josselin E., Ryde N., Faure A., 2013, in Kervella P., Le Bertre T., Perrin G., eds, EAS Publications Series Vol. 60, EAS Publications Series. pp 111–119 (arXiv:1304.4111), doi:10.1051/eas/1360012
- Limongi & Chieffi (2018) Limongi M., Chieffi A., 2018, ApJS, 237, 13
- Lodders (2003) Lodders K., 2003, ApJ, 591, 1220
- Lyons et al. (2018) Lyons J. R., Gharib-Nezhad E., Ayres T. R., 2018, Nature Communications, 9, 908
- Maas et al. (2019) Maas Z. G., Gerber J. M., Deibel A., Pilachowski C. A., 2019, ApJ, 878, 43
- Marboeuf et al. (2014) Marboeuf U., Thiabaud A., Alibert Y., Cabral N., Benz W., 2014, A&A, 570, A35
- Marigo (2001) Marigo P., 2001, A&A, 370, 194
- Marigo et al. (2020) Marigo P., et al., 2020, Nature Astronomy, p. 143
- Matteucci (2012) Matteucci F., 2012, Chemical Evolution of Galaxies. Springer, doi:10.1007/978-3-642-22491-1
- Mayor et al. (2003) Mayor M., et al., 2003, The Messenger, 114, 20
- Meléndez et al. (2008) Meléndez J., et al., 2008, A&A, 484, L21
- Meléndez et al. (2009) Meléndez J., Asplund M., Gustafsson B., Yong D., 2009, ApJ, 704, L66
- Meynet & Maeder (2002a) Meynet G., Maeder A., 2002a, A&A, 381, L25
- Meynet & Maeder (2002b) Meynet G., Maeder A., 2002b, A&A, 390, 561
- Milam et al. (2005) Milam S. N., Savage C., Brewster M. A., Ziurys L. M., Wyckoff S., 2005, ApJ, 634, 1126
- Nissen (2015) Nissen P. E., 2015, A&A, 579, A52
- Nissen & Gustafsson (2018) Nissen P. E., Gustafsson B., 2018, A&ARv, 26, 6
- Nissen et al. (2017) Nissen P. E., Silva Aguirre V., Christensen-Dalsgaard J., Collet R., Grundahl F., Slumstrup D., 2017, A&A, 608, A112
- Nissen et al. (2020) Nissen P. E., Christensen-Dalsgaard J., Mosumgaard J. R., Silva Aguirre V., Spitoni E., Verma. K., 2020, arXiv e-prints, p. arXiv:2006.06013
- Nomoto et al. (2013) Nomoto K., Kobayashi C., Tominaga N., 2013, ARA&A, 51, 457
- Pagel (2009) Pagel B. E. J., 2009, Nucleosynthesis and Chemical Evolution of Galaxies. Cambridge University Press
- Petigura et al. (2018) Petigura E. A., et al., 2018, AJ, 155, 89
- Pettini et al. (2002) Pettini M., Ellison S. L., Bergeron J., Petitjean P., 2002, A&A, 391, 21
- Ramírez et al. (2009) Ramírez I., Meléndez J., Asplund M., 2009, A&A, 508, L17
- Ramírez et al. (2010) Ramírez I., Asplund M., Baumann P., Meléndez J., Bensby T., 2010, A&A, 521, A33
- Ramírez et al. (2011) Ramírez I., Meléndez J., Cornejo D., Roederer I. U., Fish J. R., 2011, ApJ, 740, 76
- Ramírez et al. (2012) Ramírez I., Fish J. R., Lambert D. L., Allende Prieto C., 2012, ApJ, 756, 46
- Ramírez et al. (2014a) Ramírez I., et al., 2014a, A&A, 572, A48
- Ramírez et al. (2014b) Ramírez I., et al., 2014b, ApJ, 787, 154
- Recio-Blanco et al. (2014) Recio-Blanco A., et al., 2014, A&A, 567, A5
- Romano et al. (2017) Romano D., Matteucci F., Zhang Z. Y., Papadopoulos P. P., Ivison R. J., 2017, MNRAS, 470, 401
- Romano et al. (2019) Romano D., Matteucci F., Zhang Z.-Y., Ivison R. J., Ventura P., 2019, MNRAS, 490, 2838
- Ryabchikova et al. (2015) Ryabchikova T., Piskunov N., Kurucz R. L., Stempels H. C., Heiter U., Pakhomov Y., Barklem P. S., 2015, Phys. Scr., 90, 054005
- Sahijpal (2013) Sahijpal S., 2013, Journal of Astrophysics and Astronomy, 34, 297
- Santos et al. (2001) Santos N. C., Israelian G., Mayor M., 2001, A&A, 373, 1019
- Santos et al. (2004) Santos N. C., Israelian G., Mayor M., 2004, A&A, 415, 1153
- Scott et al. (2006) Scott P. C., Asplund M., Grevesse N., Sauval A. J., 2006, A&A, 456, 675
- Sneden (2014) Sneden C., 2014, MOOG, http://www.as.utexas.edu/~chris/moog.html
- Spina et al. (2018) Spina L., et al., 2018, MNRAS, 474, 2580
- Suárez-Andrés et al. (2016) Suárez-Andrés L., Israelian G., González Hernández J. I., Adibekyan V. Z., Delgado Mena E., Santos N. C., Sousa S. G., 2016, A&A, 591, A69
- Suárez-Andrés et al. (2017) Suárez-Andrés L., Israelian G., González Hernández J. I., Adibekyan V. Z., Delgado Mena E., Santos N. C., Sousa S. G., 2017, A&A, 599, A96
- Teske et al. (2019) Teske J. K., Thorngren D., Fortney J. J., Hinkel N., Brewer J. M., 2019, AJ, 158, 239
- Tinsley (1980) Tinsley B. M., 1980, Fundamentals Cosmic Phys., 5, 287
- Tucci Maia et al. (2016) Tucci Maia M., Ramírez I., Meléndez J., Bedell M., Bean J. L., Asplund M., 2016, A&A, 590, A32
- Ventura et al. (2013) Ventura P., Di Criscienzo M., Carini R., D’Antona F., 2013, MNRAS, 431, 3642
- Wallace et al. (2011) Wallace L., Hinkle K. H., Livingston W. C., Davis S. P., 2011, ApJS, 195, 6
- Wang & Fischer (2015) Wang J., Fischer D. A., 2015, AJ, 149, 14
- Weinberg et al. (2019) Weinberg D. H., et al., 2019, ApJ, 874, 102