AI-Driven Interface Design for Intelligent Tutoring System Improves Student Engagement
Abstract.
An Intelligent Tutoring System (ITS) has been shown to improve students’ learning outcomes by providing a personalized curriculum that addresses individual needs of every student. However, despite the effectiveness and efficiency that ITS brings to students’ learning process, most of the studies in ITS research have conducted less effort to design the interface of ITS that promotes students’ interest in learning, motivation and engagement by making better use of AI features. In this paper, we explore AI-driven design for the interface of ITS describing diagnostic feedback for students’ problem-solving process and investigate its impacts on their engagement. We propose several interface designs powered by different AI components and empirically evaluate their impacts on student engagement through Santa, an active mobile ITS. Controlled A/B tests conducted on more than 20K students in the wild show that AI-driven interface design improves the factors of engagement by up to 25.13%.
1. Introduction
The recent COVID-19 pandemic has caused unprecedented impact all across the globe. With social distancing measures in place, many organizations have implemented virtual and remote services to prevent widespread infection of the disease and support the social needs of the public. Educational systems are no exception and have changed dramatically with the distinctive rise of online learning. Also, the demands for evaluation methods of learning outcomes that are safe, reliable and acceptable have led the educational environment to take a paradigm shift to formative assessment.
An Intelligent Tutoring System (ITS), which provides pedagogical services in an automated manner, is a promising technique to overcome the challenges post COVID-19 educational environment has brought to us. However, despite the development and growing popularity of ITS, most of the studies in ITS research have mainly focused on diagnosing students’ knowledge state and suggesting proper learning items, and less effort has been conducted to design the interface of ITS that promotes students’ interest in learning, motivation and engagement by making better use of AI features. For example, Knowledge Tracing (KT), a task of modeling students’ knowledge through their learning activities over time, is a long-standing problem in the field of Artificial Intelligence in Education (AIEd). From Bayesian Knowledge Tracing (Corbett and Anderson, 1994; Yudelson et al., 2013) to Collaborative Filtering (Thai-Nghe et al., 2010; Lee et al., 2016) and Deep Learning (Piech et al., 2015; Zhang et al., 2017; Choi et al., 2020a; Ghosh et al., 2020), various approaches have been proposed and KT is still being actively studied. Learning path construction is also an essential task that ITS performs, where learning items are suggested to maximize students’ learning objectives. This task is commonly formulated as a reinforcement learning framework (Liu et al., 2019; Huang et al., 2019a; Bassen et al., 2020; Zhou et al., 2020) and is also an active research area in AIEd. On the other hand, little works have been done in the context of the user interface for ITS including intelligent authoring shell (Granic et al., 2000), affective interface (Lin et al., 2014a, b) and usability testing (Chughtai et al., 2015; Koscianski et al., 2014; Roscoe et al., 2014). Although they cover important aspects of ITS, the methods are outdated and their effectiveness is not reliable since the experiments were conducted on a small scale.
Interface of ITS not fully supportive of making AI’s analysis transparent to students adversely affects their engagement. Accordingly, improving the interface of ITS is also closely related to explainable AI. Explaining what exactly makes AI models arrive at their predictions and making them transparent to users is an important issue (Gunning, 2017; Gunning and Aha, 2019; Dove and Fayard, 2020), and have been actively studied in both human-computer interaction (Abdul et al., 2018; Kizilcec, 2016; Stumpf et al., 2009; Wang et al., 2019b) and machine learning (Samek et al., 2017) communities. There are lots of works about the issue of explainability in many subfields of AI including computer vision (Norcliffe-Brown et al., 2018; Fong and Vedaldi, 2017; Kim and Reiter, 2017; Zhang et al., 2018), natural language processing (Lei et al., 2017; Fyshe et al., 2015; Jiang et al., 2018; Panigrahi et al., 2019) and speech processing (Ravanelli and Bengio, 2018; Korzekwa et al., 2019; Sun et al., 2020; Tan et al., 2015). Explainability in AIEd is mainly studied in the direction of giving feedback that helps students identify their strengths and weaknesses. A method of combining item response theory with deep learning has been proposed, from which students’ proficiency levels on specific knowledge concepts can be found (Cheng et al., 2019; Wang et al., 2019a; Yeung, 2019). Also, (Barria-Pineda and Brusilovsky, 2019; Choi et al., 2020c) attempted to give students insight why the system recommends a specific learning material.
In this paper, we explore AI-driven design for the interface of ITS describing diagnostic feedback for students’ problem-solving process and investigate its impacts on their engagement. We propose several interface designs composed of different AI-powered components. Each page design couples the interface with AI features in different levels, providing different levels of information and explainability. We empirically evaluate the impacts of each design on student engagement through Santa, an active mobile ITS. We consider conversion rate, Average Revenue Per User (ARPU), total profit, and the average number of free questions a student consumed as factors measuring the degree of engagement. Controlled A/B tests conducted on more than 20K students in the wild show that AI-driven interface design improves the factors of engagement by up to 25.13%.
2. Santa: A Self-Study Solution Equipped with an AI Tutor
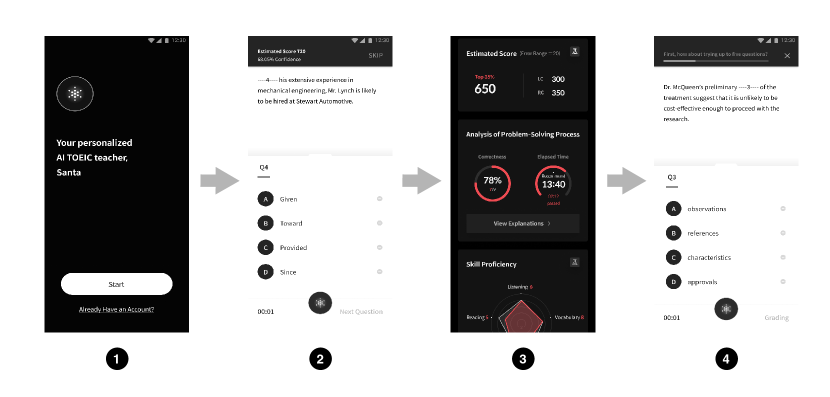
Santa111https://aitutorsanta.com is a multi-platform AI tutoring service with more than a million users in South Korea available through Android, iOS and Web that exclusively focuses on the Test of English for International Communication (TOEIC) standardized examination. The test consists of two timed sections named Listening Comprehension (LC) and Reading Comprehension (RC) with a total of 100 questions, and 4 or 3 parts respectively. The final test score ranges from 10 to 990 in steps of 5 points. Santa helps users prepare the test by diagnosing their current state and dynamically suggesting learning items appropriate for their condition. Once a user solves each question, Santa provides educational feedback to their responses including explanation, lecture or another question. The flow of a user entering and using the service is described in Figure 1. When a new user first opens Santa, they are greeted by a diagnostic test (1). The diagnostic test consists of seven to eleven questions resembling the questions that appear on the TOEIC exam (2). As the user progresses through the diagnostic test, Santa records the user’s activity and feeds it to a back-end AI engine that models the individual user. At the end of the diagnostic test, the user is presented with a diagnostic page detailing the analytics of the user’s problem-solving process in the diagnostic test (3). After that, the user may choose to continue their study by solving practice questions (4).
3. Improving User Engagement Through an AI-driven Design for Diagnostic Interface
As the user decides whether to continue their study through Santa after viewing the diagnostic page, we consider the page design that encourages user engagement and motivates them to study further. Throughout this section, we explore the design of the diagnostic page that can most effectively express the AI features brought by back-end AI models and better explains the user’s problem-solving process in the diagnostic test. We propose two page designs summarizing the user’s diagnostic test result: page design A (Figure 2(a)) and page design B (Figure 2(b)). Each page design provides analytics of the diagnostic test result at different levels of information and explainability, and is powered by different AI models running behind Santa. The effectiveness of each page design and its impact on user engagement is investigated through controlled A/B tests in Section 4.
3.1. Page Design A
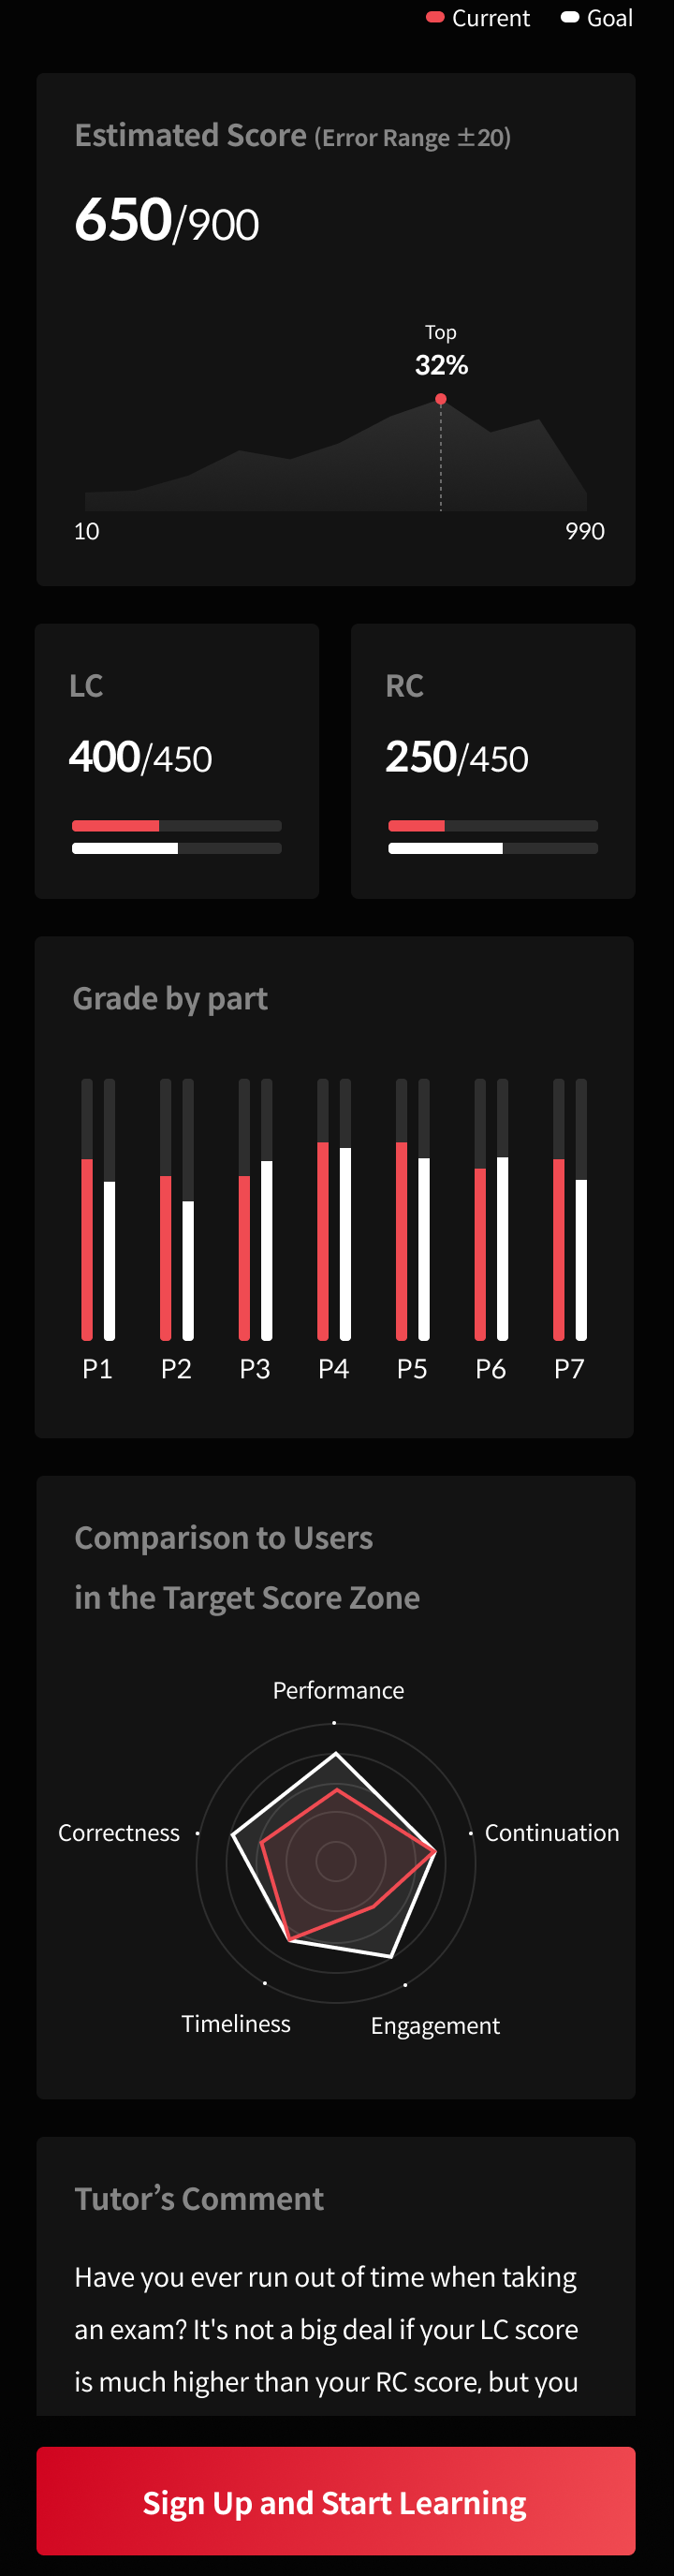
Page design A presents the following four components: Estimated Score, Grade by Part, Comparison to Users in the Target Score Zone and Tutor’s Comment.

3.1.1. Estimated Score
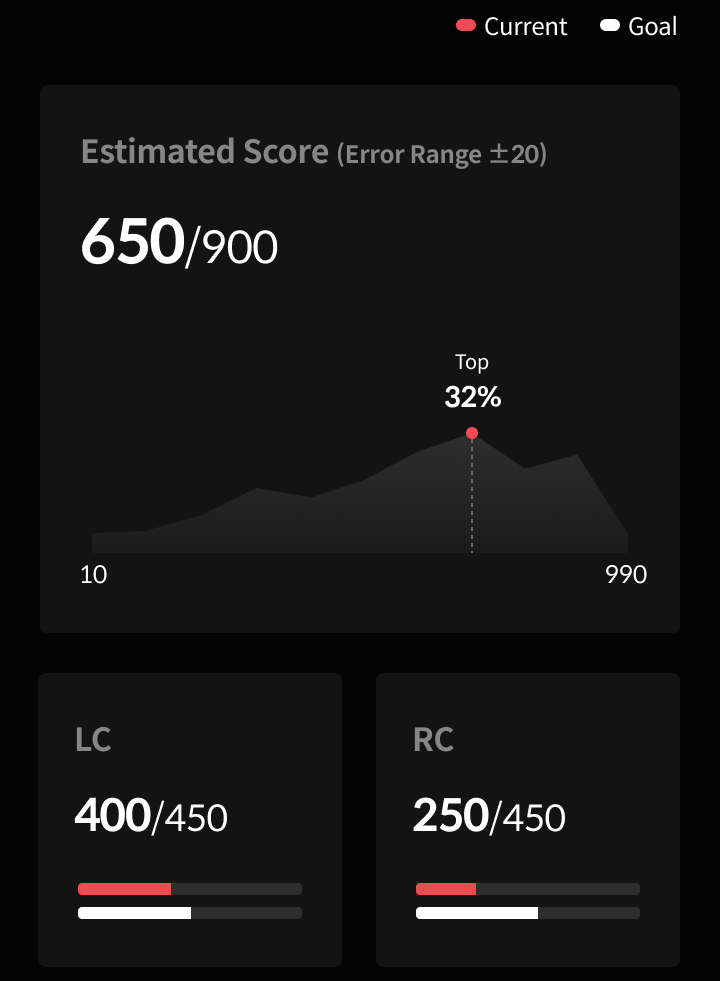
This component shows the user’s overall expected performance on the actual TOEIC exam and presents the following features: estimated scores, target scores and percentile rank (Figure 3(a)). The estimated scores are computed from the back-end score estimation model and the target scores are values the user entered before the diagnostic test. The estimated scores and the target scores are presented together so that the user easily compares them. The percentile rank is obtained by comparing the estimated score with scores of more than a million users recorded in the database of Santa.
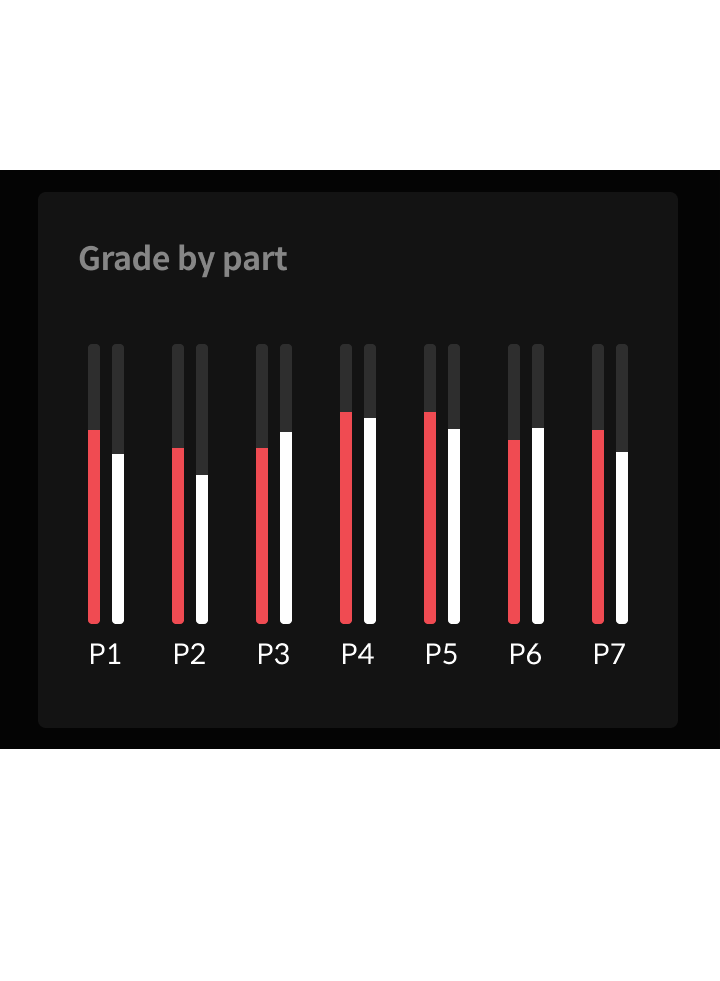
3.1.2. Grade by Part
This component provides detailed feedback for the user’s ability on each question type to help them identify their strengths and weaknesses (Figure 3(b)). For each part in TOEIC exam, the red and white bar graphs show the user’s current proficiency level and the required proficiency level to achieve the target score, respectively. The red bar graphs are obtained by averaging the estimated probabilities of the user correctly answering the potential questions for each part. Similarly, the white bar graphs are obtained by computing the averaged correctness probabilities for each part of users in the target score zone.
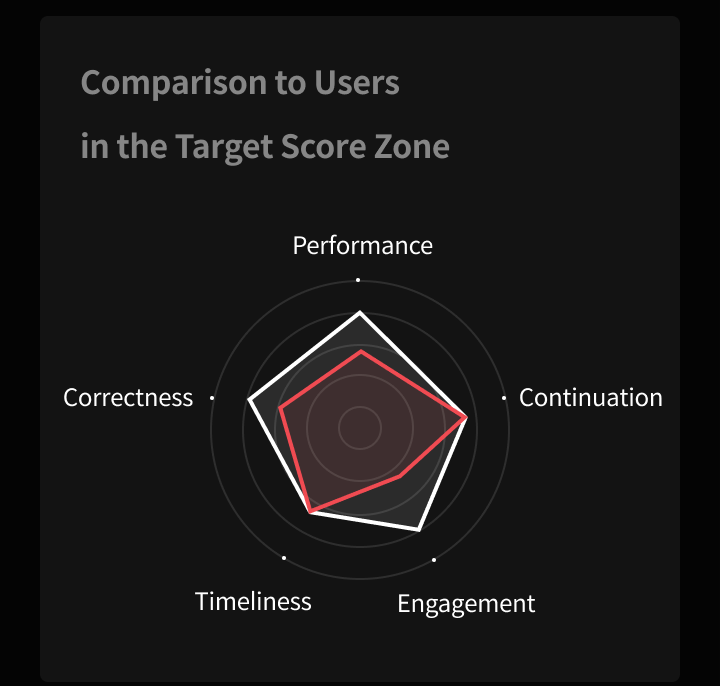
3.1.3. Comparison to Users in the Target Score Zone
This component shows a radar chart of five features representing the user’s particular aspects of ability (Figure 4). The five features give explanations of how AI models analyze the user’s problem-solving process, making Santa looks more like an AI teacher. The five features are the followings:
-
•
Performance: The user’s expected performance on the actual TOEIC exam.
-
•
Correctness: The probability that the user will correctly answer each given question.
-
•
Timeliness: The probability that the user will solve each given question under time limit.
-
•
Engagement: The probability that the user will continue studying with Santa.
-
•
Continuation: The probability that the user will continue the current learning session.
The red and white pentagons present the five features with values of the current user and averaged values of users in the target score zone, respectively. This component is particularly important as shown in Section 4 that users’ engagement factors vary greatly depending on the presence or absence of the radar char.
3.1.4. Tutor’s Comment
This component presents natural language text describing the user’s current ability and suggestions for achieving the target score (Figure 3(c)). This feature is intended to provide a learning experience of being taught by a human teacher through a more human-friendly interaction. Based on the user’s diagnostic test result, the natural language text is selected among a set of pre-defined templates.
3.2. Page Design B
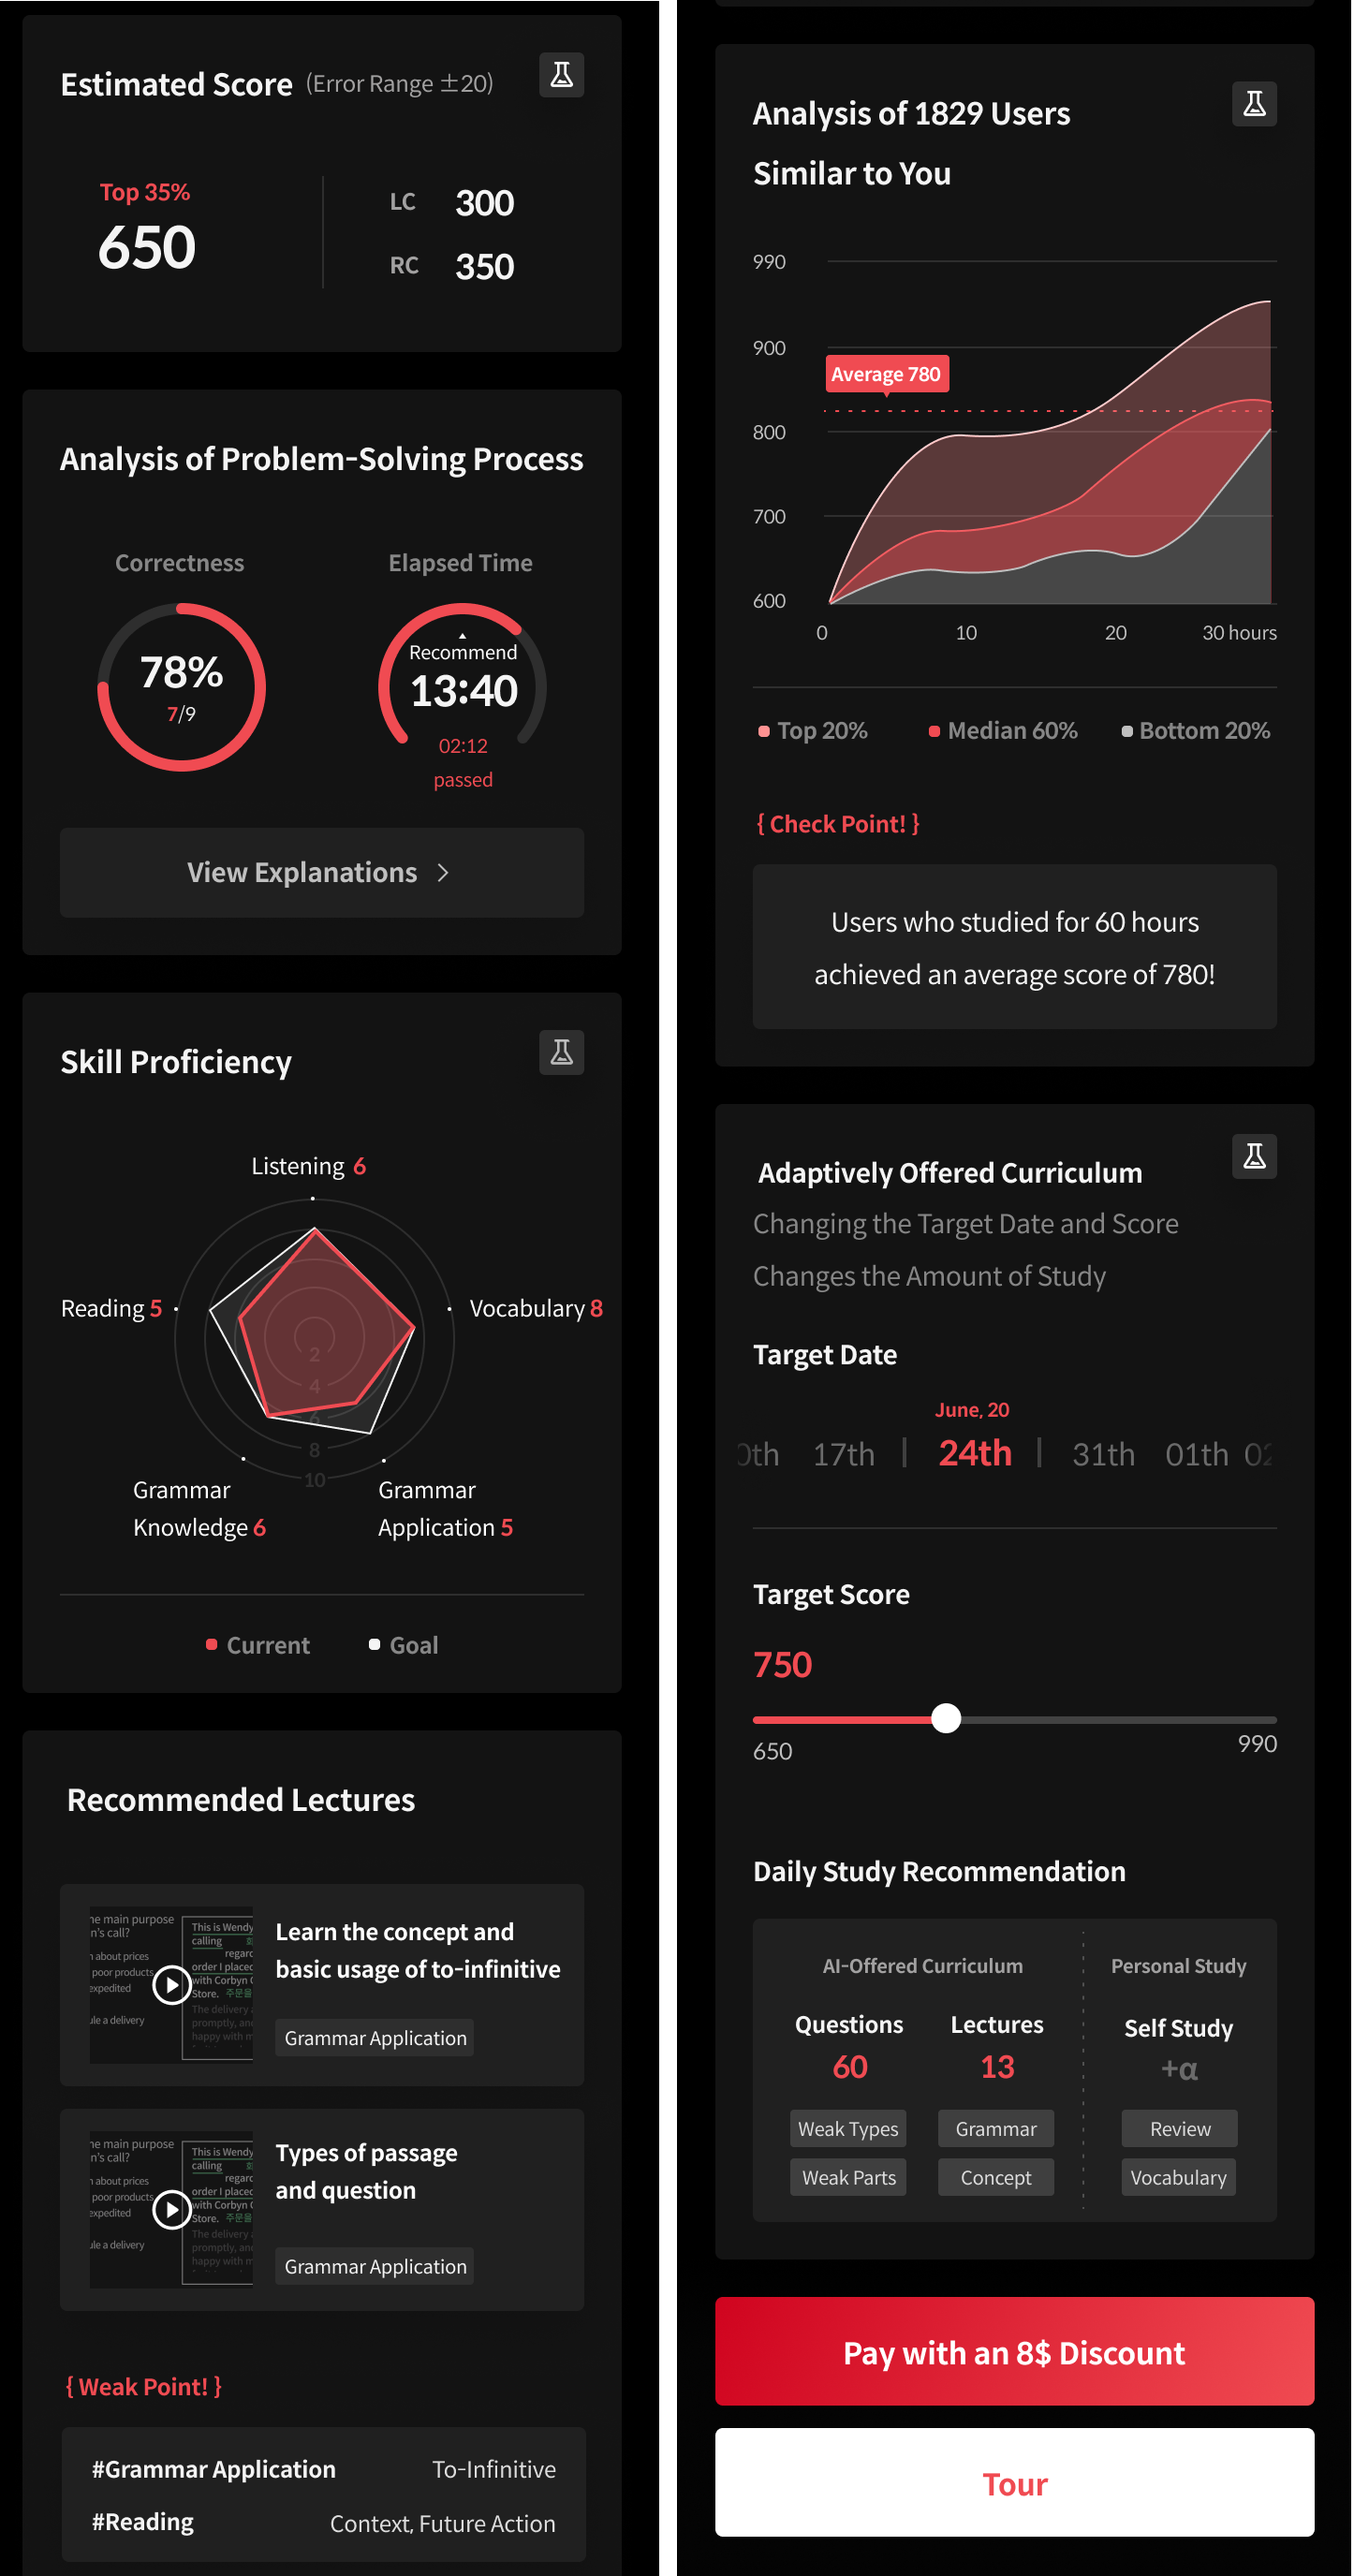
Although the page design A is proposed to provide AI-powered feedback for the user’s diagnostic test result, it has limitations in that the composition is difficult to deliver detailed information and insufficient to contain all the features computed by AI models. To this end, the page design A is changed in the direction of making better use of AI features, leading to the page design B which is more informative and explainable to the user’s problem-solving process in the diagnostic test. The page design B consists of the following seven components: Estimated Score, Analysis of Problem-Solving Process, Skill Proficiency, Recommended Lectures, Analysis of Users Similar to You, Adaptively Offered Curriculum and Santa Labs.
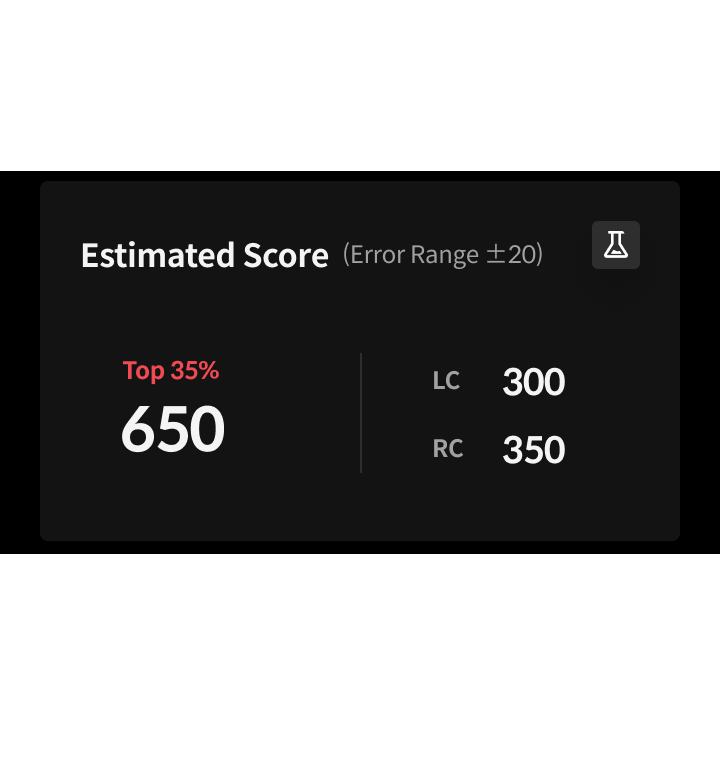
3.2.1. Estimated Score
The target scores and the mountain shaped graphic illustrating the percentile rank in the Estimated Score component of the page design A are excluded in that of the page design B (Figure 5(a)). The Estimated score component of the page design B only shows the estimated scores and the number indicating the percentile rank, making this component more concise and intuitive.
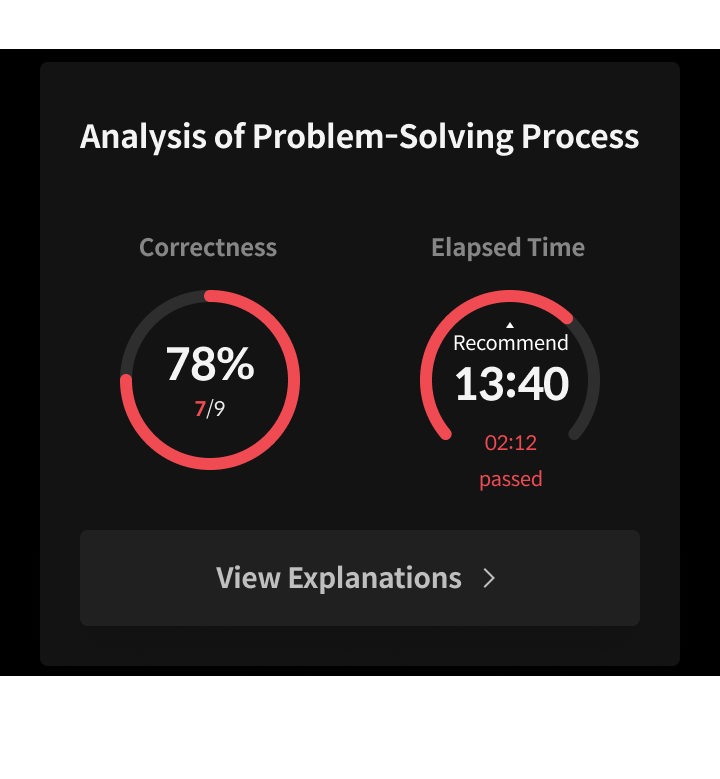
3.2.2. Analysis of Problem-Solving Process
This component provides an overall review session for the diagnostic test (Figure 5(b)). It presents the percentage of correct answers, the time taken to complete the diagnostic test and how much time has passed than the recommended time. Also, through the View Explanations button, the user can review the questions in the diagnostic test and their explanations.
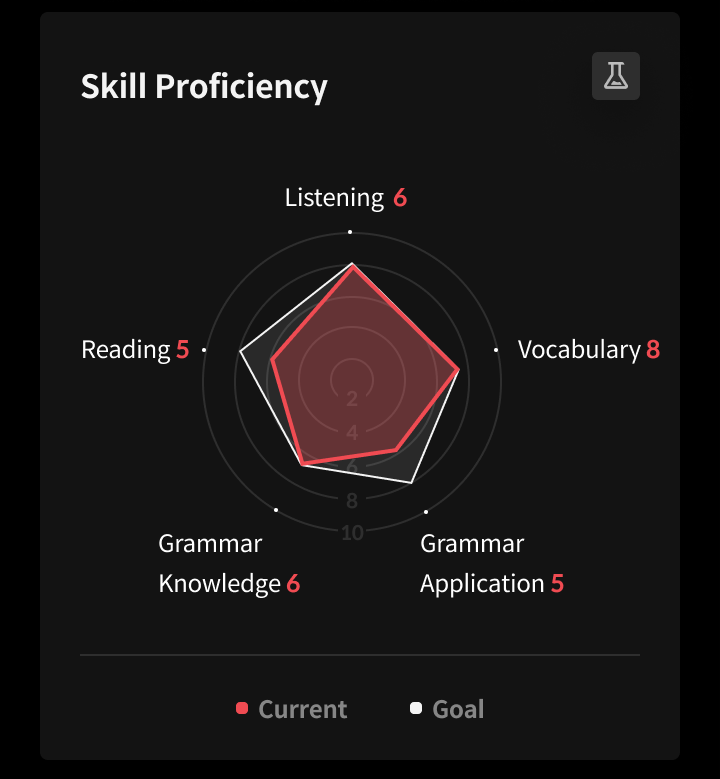
3.2.3. Skill Proficiency
This component shows the user’s current proficiency level on each skill for TOEIC exam, making AI’s analysis of diagnostic test result more transparent and explainable (Figure 5(c)). The radar chart represents proficiency levels on a scale of 1 to 10 for the following five skills: listening, reading, grammar knowledge, grammar application and vocabulary. Each proficiency level is obtained by normalizing the average estimated correctness probabilities of potential questions for each skill. The red and white pentagons present the values for the five skills of the current user and averaged values of users in the target score zone, respectively.
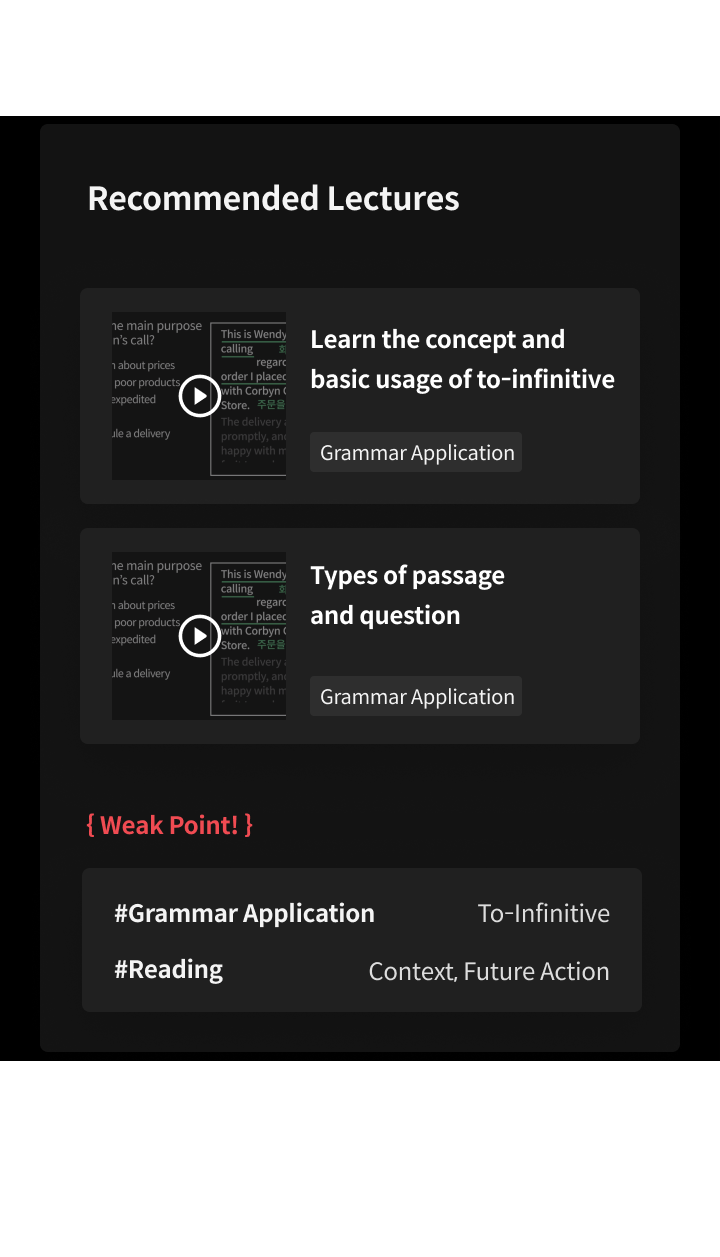
3.2.4. Recommended Lectures
This component helps the user identify their weaknesses and suggests lectures to complement (Figure 6(a)). Among the five skills in the Skill Proficiency component, two skills with the lowest proficiency and their sub-skills are presented and two lectures on these skills are recommended.
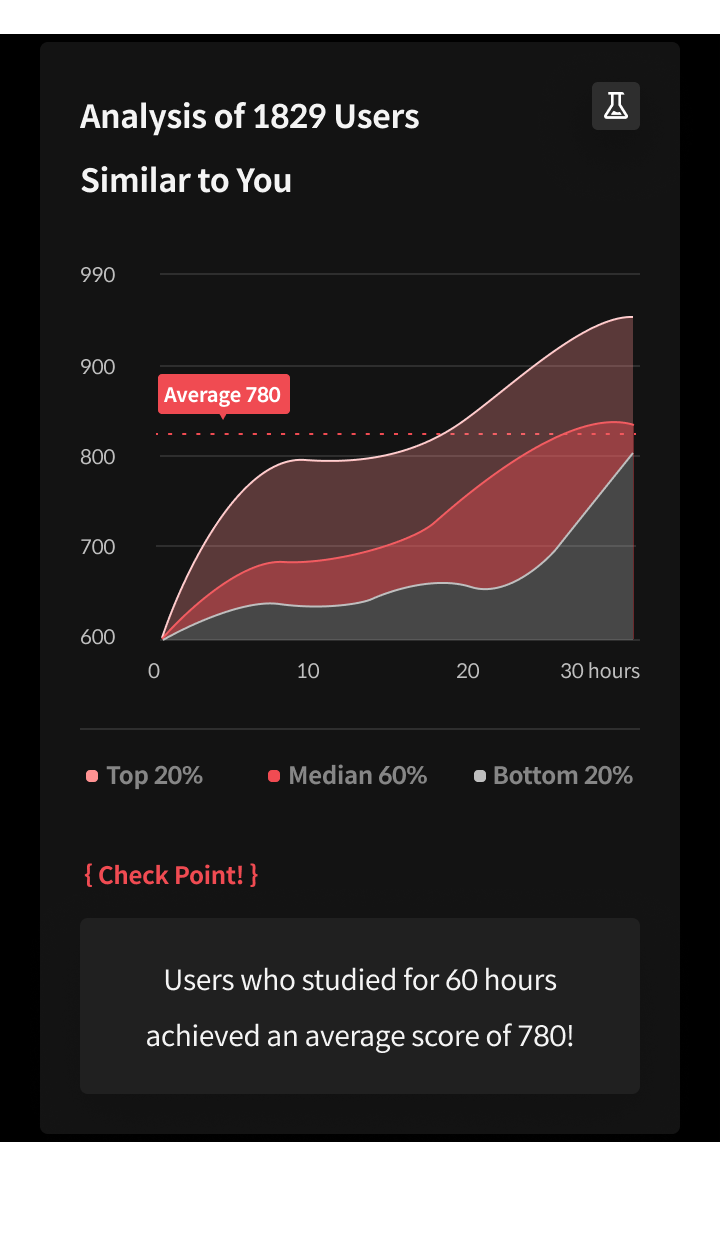
3.2.5. Analysis of Users Similar to You
This component provides information of the change in average scores of Santa users at the similar level to the current user, conveying the feeling that the specific score can be attained by using Santa (Figure 6(b)). It shows how the scores of the Santa users change by dividing them into top 20%, median 60% and bottom 20%, and presents the estimated average score attained after studying with Santa for 60 hours. This feature is obtained by finding Santa users with the same estimated score as the current user and computing the estimated score every time they consume a learning item.
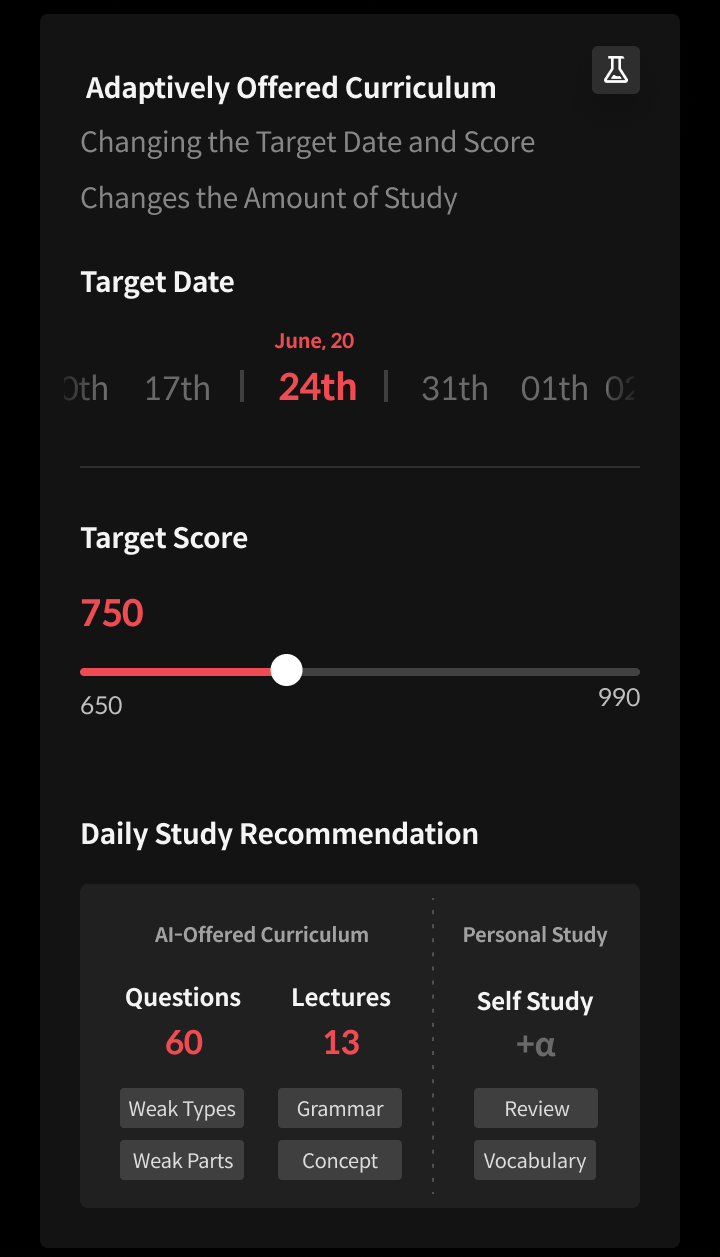
3.2.6. Adaptively Offered Curriculum
This component presents the learning path personalized to the user to achieve their learning objective (Figure 6(c)). When the user changes the target date and target score by swiping, Santa dynamically suggests the number of questions and lectures the user must study per day based on their current position. The amount of study the user needs to consume every day is computed by finding Santa users whose initial state is similar to the current user and tracking how their learning progresses so that the user can achieve the target score on the target date.
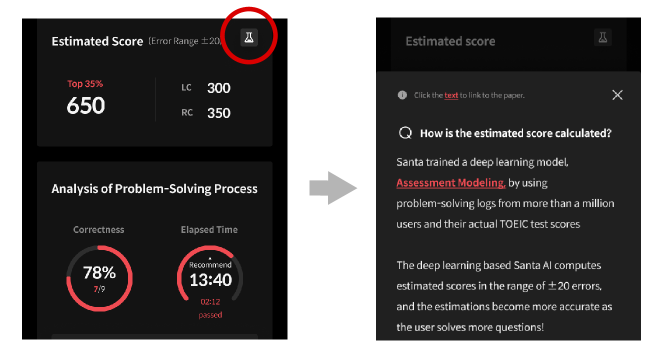
3.2.7. Santa Labs
When the user presses the flask button next to each component, a window pops up and provides an explanation of AI models used to compute the features of the component (Figure 7). For instance, when the user presses the flask button next to the Estimated Score component, a window appears with an explanation about the Assessment Modeling (Choi et al., 2020b), the Santa’s score estimation modeling method. This component conveys information about the AI technology provided by Santa to the user, giving them a feeling that the AI is actually analyzing them, increasing the credibility of the system.
3.3. Back-end AI Engine
The features in the components of each page design are computed by processing the output of Santa’s AI engine, which takes the user’s past learning activities and models individual users. Whenever the user consumes a learning item suggested by Santa, the AI engine updates models of individual users and makes predictions on specific aspects of their ability. The predictions that the AI engine makes include the followings: response correctness, response timeliness, score, learning session dropout and engagement.
The response correctness prediction is made by following the approaches introduced in (Lee et al., 2016) and (Choi et al., 2020a). (Lee et al., 2016) is the Collaborative Filtering (CF) based method which models users and questions as low-rank matrices. Each vector in the user matrix and question matrix represents latent traits of each user and latent concepts for each question, respectively. SAINT (Choi et al., 2020a) is a deep learning based model that follows the Transformer (Vaswani et al., 2017) architecture. The deep self-attentive computations in SAINT allows to capture complex relations among exercises and responses. Since the CF-based model can quickly compute the probabilities of response correctness for the entire questions of all users and SAINT predicts the response correctness probability for each user with high accuracy, the two models are complementary to each other in real world applications where both accuracy and efficiency are important.
Assessment Modeling (AM) (Choi et al., 2020b) is a pre-train/fine-tune approach to address the label-scarce educational problems, such as score estimation and review correctness prediction. Following the pre-train/fine-tune method proposed in AM, a deep bidirectional Transformer encoder (Devlin et al., 2018) based score estimation model is first pre-trained to predict response correctnesses and timelinesses of users conditioned on their past and future interactions, and then fine-tuned to predict scores of each user. The response timeliness and score are predicted from the pre-trained model and the fine-tuned model, respectively.
The learning session dropout prediction is based on the method proposed in DAS (Lee et al., 2020). DAS is a deep learning based dropout prediction model that follows the Transformer architecture. With the definition of session dropout in a mobile learning environment as an inactivity for 1 hour, DAS computes the probability that the user drops out from the current learning session whenever they consume each learning item.
The engagement prediction is made by the Transformer encoder based model. The model is trained by taking the user’s learning activity record as an input and matching the payment status based on the assumption that the user who makes the payment is engaged a lot with the system.
4. Experimental Studies
In this section, we provide supporting evidence that AI-driven interface design for ITS promotes student engagement by empirically verifying the followings through the real world application: 1) the impact of the radar chart in the page design A on user engagement, and 2) comparison of the page design A and B on user engagement. We conduct A/B tests on new incoming users of Santa, with the users randomly assigned either group A or B. Both groups of users take the diagnostic test, and at the end, users in different groups are shown different diagnostic test analytics pages. Throughout the experiments, we consider the following four factors of engagement: conversion rate, Average Revenue Per User (ARPU), total profit and the average number of free questions a user consumed. Monetary profits are an essential factor for evaluating the users’ engagement since paying for a service means that the users are highly satisfied with the service and requires a strong determination of actively using the service. For users without the determination to make payment, the average number of free questions a user consumed after the diagnostic test is a significant measure of engagement since it represents their motivation to continue the current learning session.
4.1. Impact of Radar Chart in Page Design A on Student Engagement
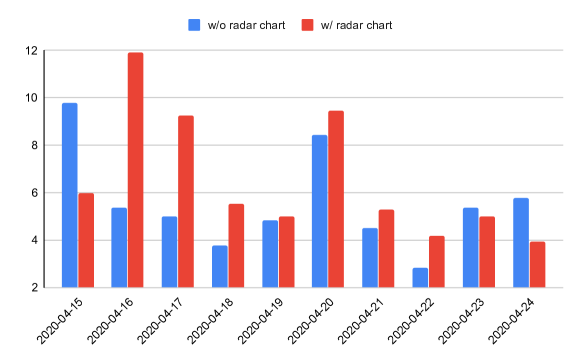
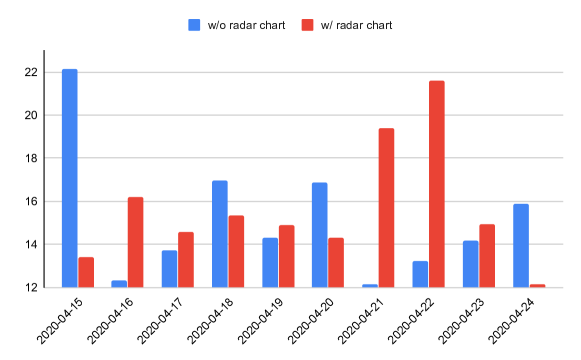
From April 15th to 24th, we conducted an A/B test by randomly assigning two different diagnostic test analytics pages to the users: one without the radar chart in the page design A (1,391 users) and another one the page design A (1,486 users). Table 1 shows the overall results. We see that the page design A with the radar chart improves all factors of user engagement. With the radar chart, the conversion rate, ARPU, total profit and the average number of free questions a user consumed are increased by 22.68%, 17.23%, 25.13% and 11.78% respectively, concluding that a more AI-like interface design for ITS encourages student engagement. Figure 8 and Figure 9 show the comparison of the conversion rate and the average number of free questions a user consumed per day between the users of the A/B test, respectively. We observe that the users of the page design A with the radar chart made more payments and solved more free questions throughout the A/B test time period.
| w/o radar chart | w/ radar chart | |
|---|---|---|
| Conversion rate (%) | 5.25 | 6.26 |
| ARPU ($) | 5.92 | 6.94 |
| Total profit ($) | 8,236.01 | 10,305.58 |
| # of free questions consumed | 14.77 | 16.51 |
4.2. Comparison of Page Design A and B on user engagement
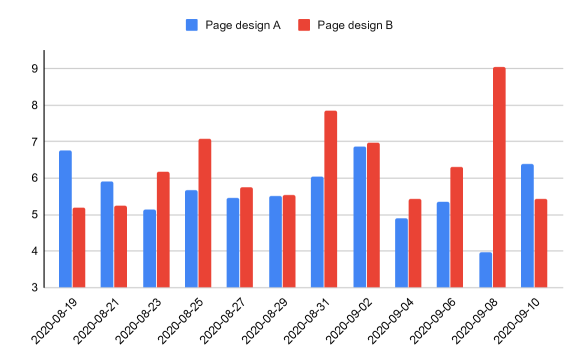
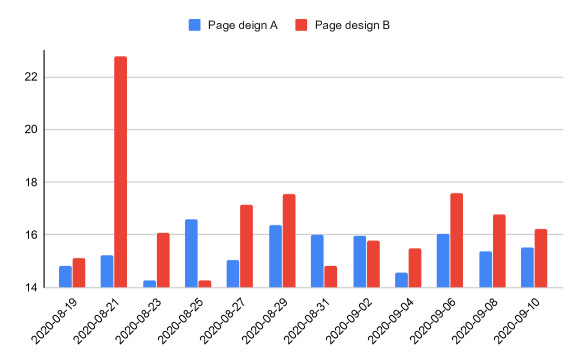
The A/B test of the page design A and B was conducted from August 19th to September 11th by randomly allocating them to the users. 9,442 users were allocated to the page design A and 9,722 users were provided the page design B. The overall results are shown in Table 2. Compared to the page design A, the page design B is better at promoting all factors of user engagement by increasing 11.07%, 10.29%, 12.57% and 7.19% of the conversion rate, ARPU, total profit and the average number of free questions a user consumed, respectively. Note that although the page design with the radar chart in the previous subsection and the page design A are the same, there is a difference between the values of the engagement factors of page design with the radar chart in Table 1, and those of the page design A in Table 2. The absolute value of each number can be changed by external factors, such as timing and the company’s public relations strategy, and these external factors are not a problem as they apply to both A and B groups in the A/B test. The comparisons of the conversion rate and the average number of free questions a user consumed on every two days between the users assigned to the page design A and B are presented in Figure 10 and Figure 11, respectively. We can observe in the figures that users experiencing the page design B made more payments and solved more free questions during the A/B test time period. Throughout the experiment, the results show that a more informative and explainable design of interface for ITS by making better use of AI features improves student engagement.
| Page design A | Page design B | |
|---|---|---|
| Conversion rate (%) | 5.60 | 6.22 |
| ARPU ($) | 5.54 | 6.11 |
| Total profit ($) | 83,335.76 | 93,807.27 |
| # of free questions consumed | 15.15 | 16.24 |
5. Conclusions and Future Work
We have investigated the effects of AI-driven interface design for ITS. In particular, we hypothesized that diagnostic page design summarizing analytics for students’ problem-solving process that makes better use of AI features would encourage student engagement. For this, we proposed several page designs that couple the interface with AI features in different levels and empirically verified their impacts on student engagement. We have conducted A/B tests on new students using an active mobile ITS Santa. We considered conversion rate, Average Revenue Per User (ARPU), total profit and the average number of free questions a user consumed as factors measuring the degree of engagement. The A/B test results showed that the page designs that effectively expresses the AI features brought by back-end AI engine and thus better explain analysis of the user’s diagnostic test result promote all factors of engagement, concluding that AI-driven interface design improves student engagement. Avenues of future work include 1) updating a page summarizing the AI’s analysis on the user in the learning session after the diagnostic test. 2) finding more interface designs that can further enhance student engagement by making good use of, expressing and utilizing AI features.
6. Related Works
6.1. Design of UI for ITS
Although the development of ITS has become an active area of research in recent years, most of the studies have mainly focused on learning science, cognitive psychology and artificial intelligence, resulting in little works done in the context of UI. (Granic et al., 2000) describes the UI issue of an intelligent authoring shell, which is an ITS generator. Through experiences in the usage of TEx-Sys, an authoring shell proposed in the paper, the authors discusses the importance of a well designed UI that brings system functionality to users. (Glavinic and GraniC, 2001) considers applying multiple views to UI for ITSs. The paper substantiates the usage of multiple perspectives on the domain knowledge structure of an ITS by the implementation of MUVIES, a multiple views UI for ITS. Understanding students’ emotional states has become increasingly important for motivating their learning. Several works (Lin et al., 2014b, a) incorporate affective interface in ITS to monitor and correct the students’ states of emotion during learning. (Lin et al., 2014b) studies the usage affective ITS in Accounting remedial instruction. Virtual agents in the system analyze, behave and give feedback appropriately to students’ emotions to motivate their learning. (Lin et al., 2014a) proposes ATSDAs, an affective ITS for digital arts. ATSDAs analyzes textual input of a student to identify emotion and learning status of them. A visual agent in the system adapts to the student, provides text feedback based on the inferred results and thereby increases their learning interest and motivation. The performance of a software can be measured by its usability, a quality that quantifies ease of use. Whether applying usability testing and usability principles to the design of UI can improve the performance of ITS is an open question (Chughtai et al., 2015). (Koscianski et al., 2014) discusses the importance of UI design, usability and software requirements and suggests employing heuristics from software engineering and learning science domains in the development process of ITS. An example of applying basic usability techniques to the development and testing of ITS is presented in (Roscoe et al., 2014). The paper introduces Writing Pal, an ITS for helping to improve students’ writing proficiency. The design of Writing Pal includes many usability engineering methods, such as internal usability testing, focus groups and usability experiments.
6.2. Explainability in AIEd
Providing an explainable feedback which can identify strengths and weaknesses of a student is a fundamental task in many educational applications (Conati et al., 2018). DIRT (Cheng et al., 2019) and NeuralCDM (Wang et al., 2019a) propose methods to enhance explainability of educational systems through a cognitive diagnosis modeling, which aims to discover student’s proficiency levels on specific knowledge concepts. DIRT incorporates neural networks to compute parameters of Item Response Theory (IRT) model. With the great feature representation learning power of neural networks, DIRT could learn complex relations between students and exercises, and give explainable diagnosis results. A similar approach is taken in NeuralCDM. However, the diagnosis model of NeuralCDM is an extended version of IRT with monotonicity assumption imposed on consecutive fully-connected neural network layers before the final output. Deep-IRT (Yeung, 2019) is a synthesis of IRT and DKVMN (Zhang et al., 2017), a memory-augmented neural networks based knowledge tracing model. Deep-IRT leverages intermediate computations of DKVMN to estimate the item difficulty level and the student ability parameters of IRT model. EKT, proposed in (Huang et al., 2019b), is a bidirectional LSTM based knowledge tracing model. EKT explains the change of knowledge mastery levels of a student by modeling evolution of their knowledge state on multiple concepts over time. Also, equipped with the attention mechanism, EKT quantifies the relative importance of each exercise for the mastery of the student’s multiple knowledge concepts.
As pointed in (Manouselis et al., 2012), explainability also poses challenges to educational recommender systems. (Barria-Pineda and Brusilovsky, 2019) addresses this issue by providing a visual explanation interface composed of concepts’ mastery bar chart, recommendation gauge and textual explanation. When a certain learning item is recommended, the concepts’ mastery bar chart shows concept-level knowledge of a student, the recommendation gauge represents suitability of the item and the textual explanation describes the recommendation rule why the item is suggested. Rocket, a tinder-like UI introduced in (Choi et al., 2020c), also provides explainability in learning contents recommendation. When an ITS proposes a learning material to a user, Rocket shows a polygonal visual summary of AI-extracted features, such as the probability of the user correctly answering the question being presented and expected score gain when the user correctly answers the question, which gives the user insight into why the system recommends the learning material. Based on the AI-extracted features, the user can decide whether to consume the suggested learning material or not through swiping or tapping action.
References
- (1)
- Abdul et al. (2018) Ashraf Abdul, Jo Vermeulen, Danding Wang, Brian Y Lim, and Mohan Kankanhalli. 2018. Trends and trajectories for explainable, accountable and intelligible systems: An hci research agenda. In Proceedings of the 2018 CHI conference on human factors in computing systems. 1–18.
- Barria-Pineda and Brusilovsky (2019) Jordan Barria-Pineda and Peter Brusilovsky. 2019. Explaining educational recommendations through a concept-level knowledge visualization. In Proceedings of the 24th International Conference on Intelligent User Interfaces: Companion. 103–104.
- Bassen et al. (2020) Jonathan Bassen, Bharathan Balaji, Michael Schaarschmidt, Candace Thille, Jay Painter, Dawn Zimmaro, Alex Games, Ethan Fast, and John C Mitchell. 2020. Reinforcement Learning for the Adaptive Scheduling of Educational Activities. In Proceedings of the 2020 CHI Conference on Human Factors in Computing Systems. 1–12.
- Cheng et al. (2019) Song Cheng, Qi Liu, Enhong Chen, Zai Huang, Zhenya Huang, Yiying Chen, Haiping Ma, and Guoping Hu. 2019. DIRT: Deep Learning Enhanced Item Response Theory for Cognitive Diagnosis. In Proceedings of the 28th ACM International Conference on Information and Knowledge Management. 2397–2400.
- Choi et al. (2020a) Youngduck Choi, Youngnam Lee, Junghyun Cho, Jineon Baek, Byungsoo Kim, Yeongmin Cha, Dongmin Shin, Chan Bae, and Jaewe Heo. 2020a. Towards an Appropriate Query, Key, and Value Computation for Knowledge Tracing. arXiv preprint arXiv:2002.07033 (2020).
- Choi et al. (2020b) Youngduck Choi, Youngnam Lee, Junghyun Cho, Jineon Baek, Dongmin Shin, Seewoo Lee, Youngmin Cha, Byungsoo Kim, and Jaewe Heo. 2020b. Assessment Modeling: Fundamental Pre-training Tasks for Interactive Educational Systems. arXiv preprint arXiv:2002.05505 (2020).
- Choi et al. (2020c) Youngduck Choi, Yoonho Na, Youngjik Yoon, Jonghun Shin, Chan Bae, Hongseok Suh, Byungsoo Kim, and Jaewe Heo. 2020c. Choose Your Own Question: Encouraging Self-Personalization in Learning Path Construction. arXiv preprint arXiv:2005.03818 (2020).
- Chughtai et al. (2015) Rehman Chughtai, Shasha Zhang, and Scotty D Craig. 2015. Usability evaluation of intelligent tutoring system: ITS from a usability perspective. In Proceedings of the Human Factors and Ergonomics Society Annual Meeting, Vol. 59. SAGE Publications Sage CA: Los Angeles, CA, 367–371.
- Conati et al. (2018) Cristina Conati, Kaska Porayska-Pomsta, and Manolis Mavrikis. 2018. AI in Education needs interpretable machine learning: Lessons from Open Learner Modelling. arXiv preprint arXiv:1807.00154 (2018).
- Corbett and Anderson (1994) Albert T Corbett and John R Anderson. 1994. Knowledge tracing: Modeling the acquisition of procedural knowledge. User modeling and user-adapted interaction 4, 4 (1994), 253–278.
- Devlin et al. (2018) Jacob Devlin, Ming-Wei Chang, Kenton Lee, and Kristina Toutanova. 2018. Bert: Pre-training of deep bidirectional transformers for language understanding. arXiv preprint arXiv:1810.04805 (2018).
- Dove and Fayard (2020) Graham Dove and Anne-Laure Fayard. 2020. Monsters, Metaphors, and Machine Learning. In Proceedings of the 2020 CHI Conference on Human Factors in Computing Systems. 1–17.
- Fong and Vedaldi (2017) Ruth C Fong and Andrea Vedaldi. 2017. Interpretable explanations of black boxes by meaningful perturbation. In Proceedings of the IEEE International Conference on Computer Vision. 3429–3437.
- Fyshe et al. (2015) Alona Fyshe, Leila Wehbe, Partha Talukdar, Brian Murphy, and Tom Mitchell. 2015. A compositional and interpretable semantic space. In Proceedings of the 2015 conference of the north american chapter of the association for computational linguistics: Human language technologies. 32–41.
- Ghosh et al. (2020) Aritra Ghosh, Neil Heffernan, and Andrew S Lan. 2020. Context-aware attentive knowledge tracing. In Proceedings of the 26th ACM SIGKDD International Conference on Knowledge Discovery & Data Mining. 2330–2339.
- Glavinic and GraniC (2001) Vlado Glavinic and Andrina GraniC. 2001. Interacting with educational systems using multiple views. In Proceedings of the 23rd International Conference on Information Technology Interfaces, 2001. ITI 2001. IEEE, 125–131.
- Granic et al. (2000) Andrina Granic, Slavomir Stankov, and Vlado Glavinic. 2000. User interface aspects of an intelligent tutoring system. In ITI 2000. Proceedings of the 22nd International Conference on Information Technology Interfaces (Cat. No. 00EX411). IEEE, 157–164.
- Gunning (2017) David Gunning. 2017. Explainable artificial intelligence (xai). Defense Advanced Research Projects Agency (DARPA), nd Web 2 (2017), 2.
- Gunning and Aha (2019) David Gunning and David W Aha. 2019. DARPA’s explainable artificial intelligence program. AI Magazine 40, 2 (2019), 44–58.
- Huang et al. (2019a) Zhenya Huang, Qi Liu, Chengxiang Zhai, Yu Yin, Enhong Chen, Weibo Gao, and Guoping Hu. 2019a. Exploring multi-objective exercise recommendations in online education systems. In Proceedings of the 28th ACM International Conference on Information and Knowledge Management. 1261–1270.
- Huang et al. (2019b) Zhenya Huang, Yu Yin, Enhong Chen, Hui Xiong, Yu Su, Guoping Hu, et al. 2019b. Ekt: Exercise-aware knowledge tracing for student performance prediction. IEEE Transactions on Knowledge and Data Engineering (2019).
- Jiang et al. (2018) Xin Jiang, Hai Ye, Zhunchen Luo, WenHan Chao, and Wenjia Ma. 2018. Interpretable rationale augmented charge prediction system. In Proceedings of the 27th International Conference on Computational Linguistics: System Demonstrations. 146–151.
- Kim and Reiter (2017) Tae Soo Kim and Austin Reiter. 2017. Interpretable 3d human action analysis with temporal convolutional networks. In 2017 IEEE conference on computer vision and pattern recognition workshops (CVPRW). IEEE, 1623–1631.
- Kizilcec (2016) René F Kizilcec. 2016. How much information? Effects of transparency on trust in an algorithmic interface. In Proceedings of the 2016 CHI Conference on Human Factors in Computing Systems. 2390–2395.
- Korzekwa et al. (2019) Daniel Korzekwa, Roberto Barra-Chicote, Bozena Kostek, Thomas Drugman, and Mateusz Lajszczak. 2019. Interpretable deep learning model for the detection and reconstruction of dysarthric speech. arXiv preprint arXiv:1907.04743 (2019).
- Koscianski et al. (2014) André Koscianski, Denise do Carmo Farago Zanotto, et al. 2014. A Design Model for Educational Multimedia Software. Creative Education 5, 23 (2014), 2003.
- Lee et al. (2016) Kangwook Lee, Jichan Chung, Yeongmin Cha, and Changho Suh. 2016. Machine Learning Approaches for Learning Analytics: Collaborative Filtering Or Regression With Experts?. In NIPS Workshop, Dec. 1–11.
- Lee et al. (2020) Youngnam Lee, Dongmin Shin, HyunBin Loh, Jaemin Lee, Piljae Chae, Junghyun Cho, Seoyon Park, Jinhwan Lee, Jineon Baek, Byungsoo Kim, et al. 2020. Deep Attentive Study Session Dropout Prediction in Mobile Learning Environment. arXiv preprint arXiv:2002.11624 (2020).
- Lei et al. (2017) Tao Lei et al. 2017. Interpretable neural models for natural language processing. Ph.D. Dissertation. Massachusetts Institute of Technology.
- Lin et al. (2014a) Hao-Chiang Koong Lin, Nian-Shing Chen, Rui-Ting Sun, and I-Hen Tsai. 2014a. Usability of affective interfaces for a digital arts tutoring system. Behaviour & information technology 33, 2 (2014), 105–116.
- Lin et al. (2014b) Hao-Chiang Koong Lin, Chih-Hung Wu, and Ya-Ping Hsueh. 2014b. The influence of using affective tutoring system in accounting remedial instruction on learning performance and usability. Computers in Human Behavior 41 (2014), 514–522.
- Liu et al. (2019) Qi Liu, Shiwei Tong, Chuanren Liu, Hongke Zhao, Enhong Chen, Haiping Ma, and Shijin Wang. 2019. Exploiting cognitive structure for adaptive learning. In Proceedings of the 25th ACM SIGKDD International Conference on Knowledge Discovery & Data Mining. 627–635.
- Manouselis et al. (2012) Nikos Manouselis, Hendrik Drachsler, Katrien Verbert, and Erik Duval. 2012. Recommender systems for learning. Springer Science & Business Media.
- Norcliffe-Brown et al. (2018) Will Norcliffe-Brown, Stathis Vafeias, and Sarah Parisot. 2018. Learning conditioned graph structures for interpretable visual question answering. In Advances in neural information processing systems. 8334–8343.
- Panigrahi et al. (2019) Abhishek Panigrahi, Harsha Vardhan Simhadri, and Chiranjib Bhattacharyya. 2019. Word2Sense: sparse interpretable word embeddings. In Proceedings of the 57th Annual Meeting of the Association for Computational Linguistics. 5692–5705.
- Piech et al. (2015) Chris Piech, Jonathan Bassen, Jonathan Huang, Surya Ganguli, Mehran Sahami, Leonidas J Guibas, and Jascha Sohl-Dickstein. 2015. Deep knowledge tracing. In Advances in neural information processing systems. 505–513.
- Ravanelli and Bengio (2018) Mirco Ravanelli and Yoshua Bengio. 2018. Interpretable convolutional filters with sincnet. arXiv preprint arXiv:1811.09725 (2018).
- Roscoe et al. (2014) Rod D Roscoe, Laura K Allen, Jennifer L Weston, Scott A Crossley, and Danielle S McNamara. 2014. The Writing Pal intelligent tutoring system: Usability testing and development. Computers and Composition 34 (2014), 39–59.
- Samek et al. (2017) Wojciech Samek, Thomas Wiegand, and Klaus-Robert Müller. 2017. Explainable artificial intelligence: Understanding, visualizing and interpreting deep learning models. arXiv preprint arXiv:1708.08296 (2017).
- Stumpf et al. (2009) Simone Stumpf, Vidya Rajaram, Lida Li, Weng-Keen Wong, Margaret Burnett, Thomas Dietterich, Erin Sullivan, and Jonathan Herlocker. 2009. Interacting meaningfully with machine learning systems: Three experiments. International Journal of Human-Computer Studies 67, 8 (2009), 639–662.
- Sun et al. (2020) Guangzhi Sun, Yu Zhang, Ron J Weiss, Yuan Cao, Heiga Zen, and Yonghui Wu. 2020. Fully-hierarchical fine-grained prosody modeling for interpretable speech synthesis. In ICASSP 2020-2020 IEEE International Conference on Acoustics, Speech and Signal Processing (ICASSP). IEEE, 6264–6268.
- Tan et al. (2015) Shawn Tan, Khe Chai Sim, and Mark Gales. 2015. Improving the interpretability of deep neural networks with stimulated learning. In 2015 IEEE Workshop on Automatic Speech Recognition and Understanding (ASRU). IEEE, 617–623.
- Thai-Nghe et al. (2010) Nguyen Thai-Nghe, Lucas Drumond, Artus Krohn-Grimberghe, and Lars Schmidt-Thieme. 2010. Recommender system for predicting student performance. Procedia Computer Science 1, 2 (2010), 2811–2819.
- Vaswani et al. (2017) Ashish Vaswani, Noam Shazeer, Niki Parmar, Jakob Uszkoreit, Llion Jones, Aidan N Gomez, Łukasz Kaiser, and Illia Polosukhin. 2017. Attention is all you need. In Advances in neural information processing systems. 5998–6008.
- Wang et al. (2019b) Danding Wang, Qian Yang, Ashraf Abdul, and Brian Y Lim. 2019b. Designing theory-driven user-centric explainable AI. In Proceedings of the 2019 CHI conference on human factors in computing systems. 1–15.
- Wang et al. (2019a) Fei Wang, Qi Liu, Enhong Chen, Zhenya Huang, Yuying Chen, Yu Yin, Zai Huang, and Shijin Wang. 2019a. Neural Cognitive Diagnosis for Intelligent Education Systems. arXiv preprint arXiv:1908.08733 (2019).
- Yeung (2019) Chun-Kit Yeung. 2019. Deep-irt: Make deep learning based knowledge tracing explainable using item response theory. arXiv preprint arXiv:1904.11738 (2019).
- Yudelson et al. (2013) Michael V Yudelson, Kenneth R Koedinger, and Geoffrey J Gordon. 2013. Individualized bayesian knowledge tracing models. In International conference on artificial intelligence in education. Springer, 171–180.
- Zhang et al. (2017) Jiani Zhang, Xingjian Shi, Irwin King, and Dit-Yan Yeung. 2017. Dynamic key-value memory networks for knowledge tracing. In Proceedings of the 26th international conference on World Wide Web. 765–774.
- Zhang et al. (2018) Quanshi Zhang, Ying Nian Wu, and Song-Chun Zhu. 2018. Interpretable convolutional neural networks. In Proceedings of the IEEE Conference on Computer Vision and Pattern Recognition. 8827–8836.
- Zhou et al. (2020) Guojing Zhou, Xi Yang, Hamoon Azizsoltani, Tiffany Barnes, and Min Chi. 2020. Improving Student-System Interaction Through Data-driven Explanations of Hierarchical Reinforcement Learning Induced Pedagogical Policies. In Proceedings of the 28th ACM Conference on User Modeling, Adaptation and Personalization. 284–292.