Decoupling the effects of shear and extensional flows on the alignment of colloidal rods
Abstract
Cellulose nanocrystals (CNC) can be considered as model colloidal rods and have practical applications in the formation of soft materials with tailored anisotropy. Here, we employ two contrasting microfluidic devices to quantitatively elucidate the role of shearing and extensional flows on the alignment of a dilute CNC dispersion. Characterization of the flow field by micro-particle image velocimetry is coupled to flow-induced birefringence analysis to quantify the deformation rate–alignment relationship. The deformation rate required for CNC alignment is 4 smaller in extension than in shear. Alignment in extension is independent of the deformation rate magnitude, but is either 0∘ or 90∘ to the flow, depending on its sign. In shear flow the colloidal rods orientate progressively towards 0∘ as the deformation rate magnitude increases. Our results decouple the effects of shearing and extensional kinematics at aligning colloidal rods, establishing coherent guidelines for the manufacture of structured soft materials.
Unknown University] Okinawa Institute of Science and Technology, Onna-son, Okinawa 904-0495, Japan
1 INTRODUCTION
Colloidal rods have received long-lasting attention as building-blocks for complex materials because of their effective gelling properties and their ability to orient upon hydrodynamic forces, allowing the manufacture of materials with tailored anisotropy.1, 2, 3 Soft materials with anisotropic orientation have shown a large number of advantages, such as their mechanical strength,4, 5 structural color,6 electrical and thermal conductivity,7, 8 and directional control of cell growth.9
To achieve directionality in soft materials, microfluidic platforms have been extensively used to control hydrodynamic forces, mainly through shearing and extensional-dominated flows, to aid particle alignment while keeping negligible inertia effects. The relative strength between diffusion and hydrodynamic forces is typically described by the Péclet number , where is the characteristic deformation rate, and the rotational diffusion coefficient for non-interacting rods, , is described as10
| (1) |
where is the Boltzmann constant, the temperature, the solvent shear viscosity, is the length and the effective diameter of the rod which accounts for the thickness of the electric double layer. For the particles are dominated by Brownian fluctuations, whilst for , the particles are perturbed by the flow field. It has been shown, experimentally and theoretically, that shearing flows enable a gradual alignment of anisotropic particles towards the flow direction, where particles align with a preferential angle of 45∘ at and achieve orientation parallel to the flow direction, 0∘, at .11, 12, 13, 14 Although shear-dominated flows are relatively simple to study via conventional rheo-optics techniques, “pure” extensional flows in conditions where shear-forces are negligible are experimentally difficult to assess.15, 16 Consequently, much less is known on how extensional rates affect the orientation of particles in shear-free conditions. Nonetheless, it has been shown that extensional rates enable an additional control on particle orientations, inducing, for instance, particle alignment perpendicular to the flow direction, which is not possible in shearing flows.17, 7, 18, 19 Of considerable importance, is the work of Corona et al., who investigated the effects of shearing and extension-dominated flows on the alignment of a concentrated suspension of colloidal rods using a fluidic four-roll mill device.20 However, no significant differences could be discerned between shearing and extensional-dominated flows as excluded volume effects were likely dominant at the high concentration tested. Recent work from Rosén et al.21 elucidated that for extension-dominated flows, generated in flow-focusing and converging channels, a reduced rotational diffusion coefficient was obtained when compared to shearing flows. Nonetheless, difficulties rising from interparticle interactions, particle flexibility, and a non uniform extensional rate within the microfluidic channel, hindered a comprehensive quantitative examination to decouple the effects of shearing and extensional dominated flows. To date, a quantitative comparison between shear and extensional rate–driven alignment of rod-like particles, in conditions where interparticle interactions are negligible, is still missing.
In this article we couple quantitative flow field measurements with state-of-the-art flow-induced birefringence analysis to elucidate the role of shear and extensional rates at aligning rod-like particles. A dilute cellulose nanocrystal (CNC) suspension consisting of negatively charged rigid rod-like nanoparticles is used as a model system.22
2 MATERIALS AND METHODS
2.1 Test fluid
The CNC was purchased from CelluForce (Montreal, Canada) as an aqueous 5.6 wt% stock dispersion at pH 6.3. A 0.1wt% CNC dispersion was prepared by dilution of the stock dispersion with deionised water and used without further treatment. Extensive characterization of CNC from the same industrial producer is described by Bertsch et al.23, 24 and Reid et al.25
2.2 Shear Rheometry
Steady shear rheology of the 0.1 wt% CNC dispersion was measured using a strain-controlled ARES-G2 rotational shear rheometer (TA Instruments Inc.) equipped with a double gap geometry (with an inner and outer gap of 0.81 and 1.00 mm, respectively) composed of a stainless steel bob and a hard-anodized aluminum cup. The dispersion was covered with a solvent trap and measurements were performed at 25∘C (controlled by an advanced Peltier system with temperature accuracy of 0.1∘C). A microfluidic slit rheometer (m-VROC RheoSense Inc.), equipped with an A10 pressure cell, 3 mm wide and high, was used to access the rheological response of the test fluid at high values of shear rate (up to s-1). The experiment was carried out at C (controlled via an external circulating water bath with temperature accuracy of 0.1∘C).
2.3 Atomic force microscopy (AFM)
A 0.01 wt% CNC dispersion was drop-casted on a mica substrate and imaged using an atomic force microscope (Dimension ICON3, Bruker) in tapping mode. The distribution of the particle contour length, , and diameter, , was extrapolated by tracking 976 isolated particles using an open-source code, FiberApp.26 The value of was obtained from the AFM height profile.
2.4 Microfluidic platforms
A shearing flow-dominated channel (SFC) and an optimized shape cross-slot extensional rheometer (OSCER)27, 15 were used to generate two-dimensional (2D) flows that, in discrete areas of the geometries, provide good approximations to purely shearing and purely extensional flows, respectively (Figure 1). The SFC consists of a straight channel of fused silica glass with a rectangular cross section (length mm along the -axis, height mm along the -axis, and width mm along the -axis, resulting in an aspect ratio ), fabricated with a selective laser-induced etching (SLE) technique28, 29 (Figure 1a). The OSCER is based on a planar cross-slot geometry with two incoming and outgoing flows placed orthogonal to each other, as described by Haward et al.27, 15 and depicted in Figure 1b. The device has a height of mm along the -axis and a channel width of mm at the inlets and outlets, yielding , generating a good approximation of a 2D flow field which is extensional-dominated in a large region around the stagnation point, at (see coordinate system in Figure 1b). The fluid elements are compressed along the -axis and extended along the -axis (referred to as the compression and elongation axes, respectively, Figure 1b).
The flow inside the channels is driven by Nemesys low-pressure syringe pumps (Cetoni, GmbH) and Hamilton Gastight syringes, which infuse the liquid at the inlet and withdraw it at an equal and opposite volumetric rate, (m3 s-1), from the outlet. To ensure steady flows, the highest flow rates were set at Reynolds numbers, , of 15.4 and 6.4, for the SFC and OSCER, respectively, considering a fluid density, kg m-3, an average flow velocity as (m s-1) and a fluid viscosity mPa s as determined by rheological measurements (detailed in the following section). The flows were equilibrated for at least 5 s before all measurements and confirmed as being steady by inspection of the micro-particle image velocimetry (-PIV, see next section) flow fields prior to their time-averaging. All the experiments were carried out at the ambient laboratory temperature (C).

2.5 Micro-particle image Velocimetry (-PIV)
The flow fields in the SFC and OSCER devices were obtained using time averaged -PIV of the test fluid seeded with fluorescent particles (Fluoro-MaxTM, Thermo Fisher), to a concentration of wt%. The -PIV measurements were conducted using a volume illumination system (TSI Inc., MN) installed on an inverted microscope (Nikon Eclipse Ti). Nikon PlanFluor objective lenses of 4 and 10 with numerical apertures of NA=0.13 and 0.30 were used for the OSCER and SFC device, respectively. Each geometry was placed with -axis parallel to the light source and for all the flow rates tested, a sequence of at least 100 image pairs were acquired at the midplane of the geometries ( mm). For the SFC, images were acquired at a distance of from the inlets to ensure fully developed velocity profiles. The average displacement of the seeded particles between the two images in each pair was kept constant at 4 pixels. The measurement depths, , corresponding to the depth over which the seeded particles contribute to the determination of the velocity field was and , for the OSCER and SFC, respectively.30 Cross-correlation between image pairs provided velocity vectors on a square grid with a spatial resolution of 2.0 and 0.8 /pixel for the OSCER and SFC, respectively. Data analysis was performed using a custom-made Matlab routine.
2.6 Flow-induced birefringence (FIB)
Flow-induced birefringence (FIB) measurements were performed using an Exicor MicroImager (Hinds Instruments, Inc., OR). Monochromatic light of wavelength nm was shone through a linear polarizer at 0∘, a photoelastic modulator (PEM) at 45∘, the SFC or the OSCER containing the testing fluid, a PEM at 0∘ and a linear polarizer at 45∘, in the order given. The geometries were imaged using a 5 objective in the same position as described for -PIV. The instrument performs Mueller matrix decomposition, determining the elements of 44 Mueller matrices using a stroboscopic light source. The retardance , describing the total phase shift occurring between the two orthogonally polarized light beams, and the orientation of the slow optical axis (extraordinary ray), , were obtained from a total of 7 images acquired at 1 frame/s. The retardance, (measured in nm), was then converted to birefringence as . The background value of was determined for the test fluid at rest and subtracted for all the analysis presented. The background value determined in both geometries was and comparable to the instrument resolution of . The spatial resolution of the measurement was /pixel and data analysis was performed using a custom-made Matlab routine.
3 RESULTS AND DISCUSSION
3.1 Characterization of the test fluid
We begin by estimating the volume density, , of the 0.1 wt% CNC dispersion, where is the number of rods and is the sample volume. In suspensions of monodisperse rod-like particles, the volume density, , is commonly used to distinguish between the dilute, semi-dilute and concentrated regimes.1 For monodisperse rods, the calculation of is straightforward as a single particle length () and diameter () are sufficient to describe the whole particle population. Contrarily, for a polydisperse distribution of rods such as CNC, the large span of lengths must be considered for a more accurate estimation of . Thus, the size distribution of the CNC was extrapolated from atomic force microscopy (AFM) images (Figure 2a,b). The average contour length was nm and the average diameter nm. The effective volume density, , was thereafter estimated as
| (2) |
where is the effective number of rods, is the longest detected contour length (700 nm), is the volume of the CNC in the sample (which can be estimated using a density of 1500 kg m-3),31 is the volume fraction of the rods with length and is the volume occupied by a single rod with length , for which a cylindrical morphology can be approximated. It is noted that the distribution of the CNC diameters, , is not accounted for in eqn. 2 since it has only a minimal effect on the estimation of of slender objects and is used to obtain . For the 0.1 wt% CNC, the , indicating that at this concentration, the CNC dispersion is at the onset of the semi-dilute regime, where the particles rarely interact (although more frequently than in the dilute regime).10, 32 The absence of pronounced interparticle interactions was reported by Bertsch et al. for concentrations below 0.5 wt%, as shown by small angle X-ray scattering studies of CNC from the same source as that used in the present work.24 In addition, from the AFM images, a persistence length, was extrapolated using the method of the mean-squared midpoint displacement (MSMD) within the FiberApp routine and detailed by Usov and Mezzenga,26 indicating that CNC can be well described as rigid rods. A value of was also obtained when was calculated as33
| (3) |
using the reported values of the CNC elastic modulus, , between 5 and 150 GPa.31
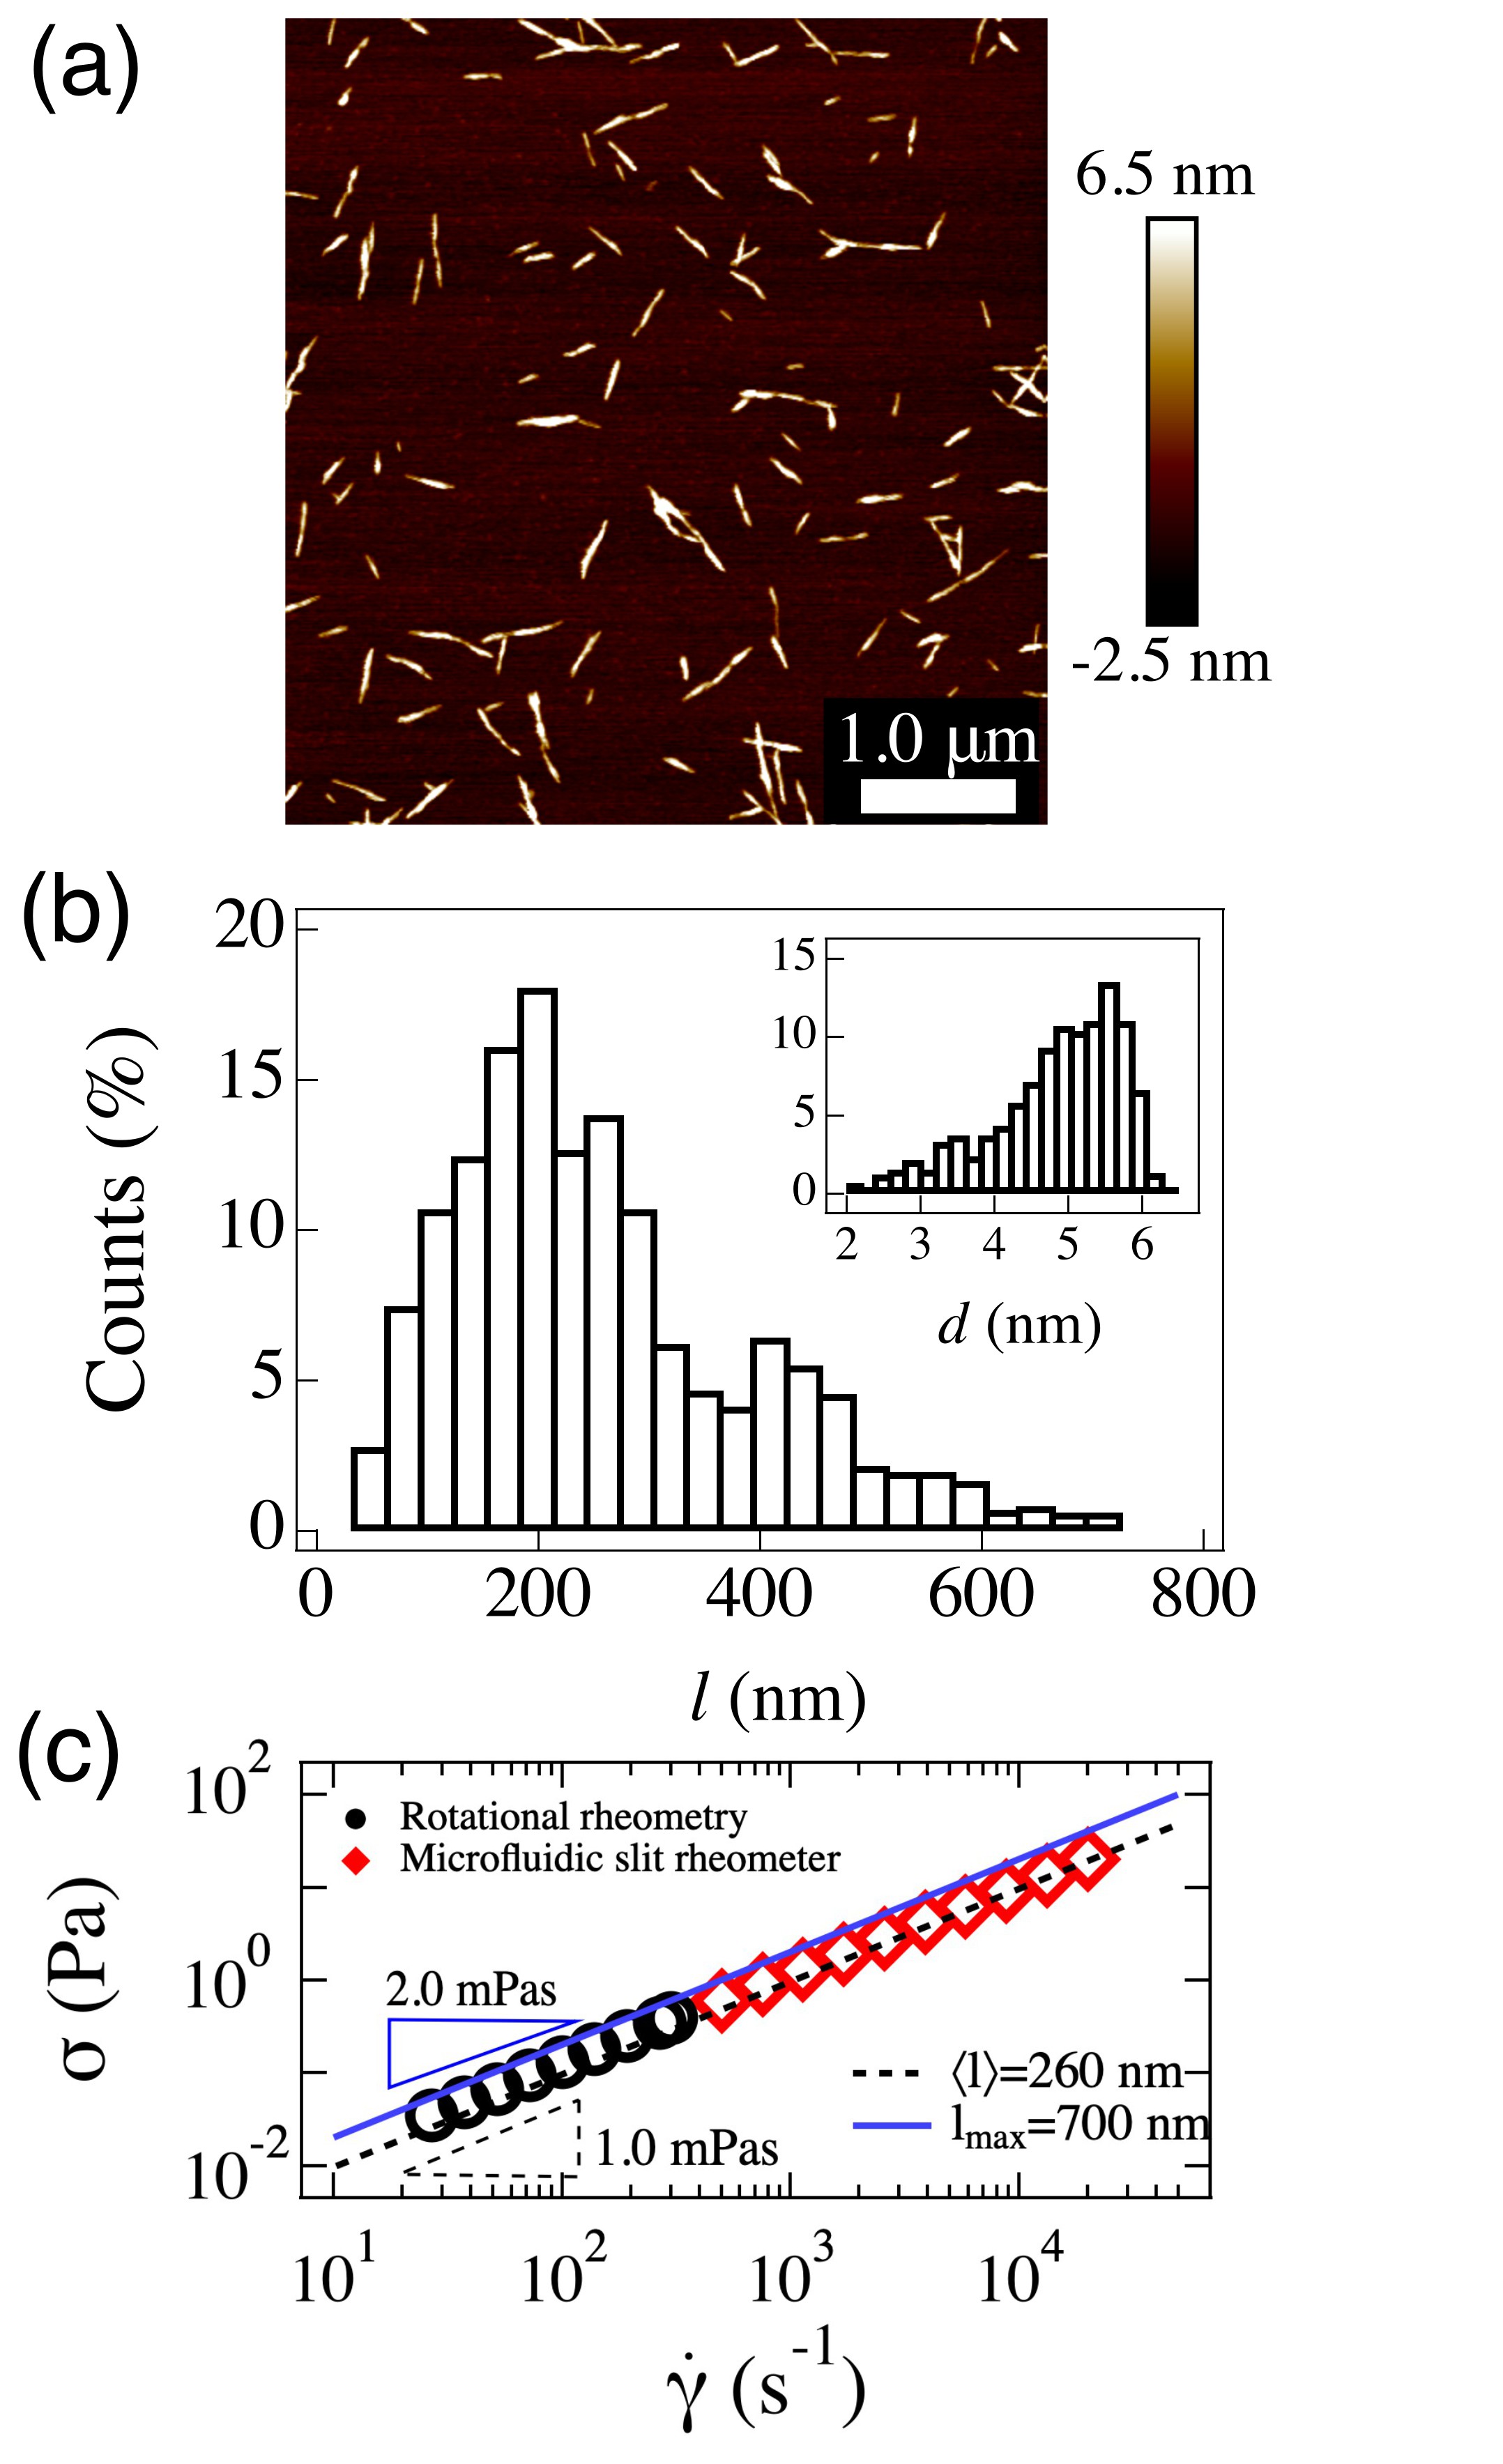
The steady shear rheology of the 0.1 wt% CNC dispersion is shown in Figure 2c. The shear stress, , of the 0.1 wt% CNC suspension followed a linear relationship with the shear rate, , as for a Newtonian fluid with shear viscosity mPa s. Anisotropic particles are expected to exhibit a viscosity plateau at low shear rate, namely the zero shear viscosity, , followed by a shear thinning behavior up to a second viscosity plateau at higher shear rates, .32, 34, 35, 36, 37 From eqn. 1 it is clear that longer rods will align at lower shear rates than shorter rods since . As such, in polydisperse suspensions of non-interacting colloidal rods, the onset of shear thinning is dictated by the longest population of rods. Substituting with and accounting for the contribution of the electric double layer ( nm)24 to the effective diameter () in eqn. 1, we estimated the expected onset of the shear thinning at s-1 (). However, at this CNC concentration, the value of viscosity of the test fluid is close to that of the solvent shear viscosity, , making practically impossible to capture the shear thinning region expected for anisotropic particles. For a dilute dispersion of monodisperse rods, can be estimated as10
| (4) |
When the value of in eqn. 1 is substituted with either or , the predicted values of zero shear viscosity well encompass the experimental data (Figure 2c). The lack of any further contribution needed to account interparticle interactions in eqn. 4 suggests that the 0.1 wt% CNC dispersion can be considered in the dilute regime.
3.2 Flow profiles
The bulk rheometry gives a good indication that the diluted CNC dispersion behaves as a Newtonian fluid. Consequently, no information regarding the onset of alignment, as usually associated with the onset of shear thinning, can be discerned from the flow curve. To define a deformation rate–alignment relationship of the dilute CNC dispersion we focus on the control of the shear rate, , and extensional rate, in two separate microchannels.
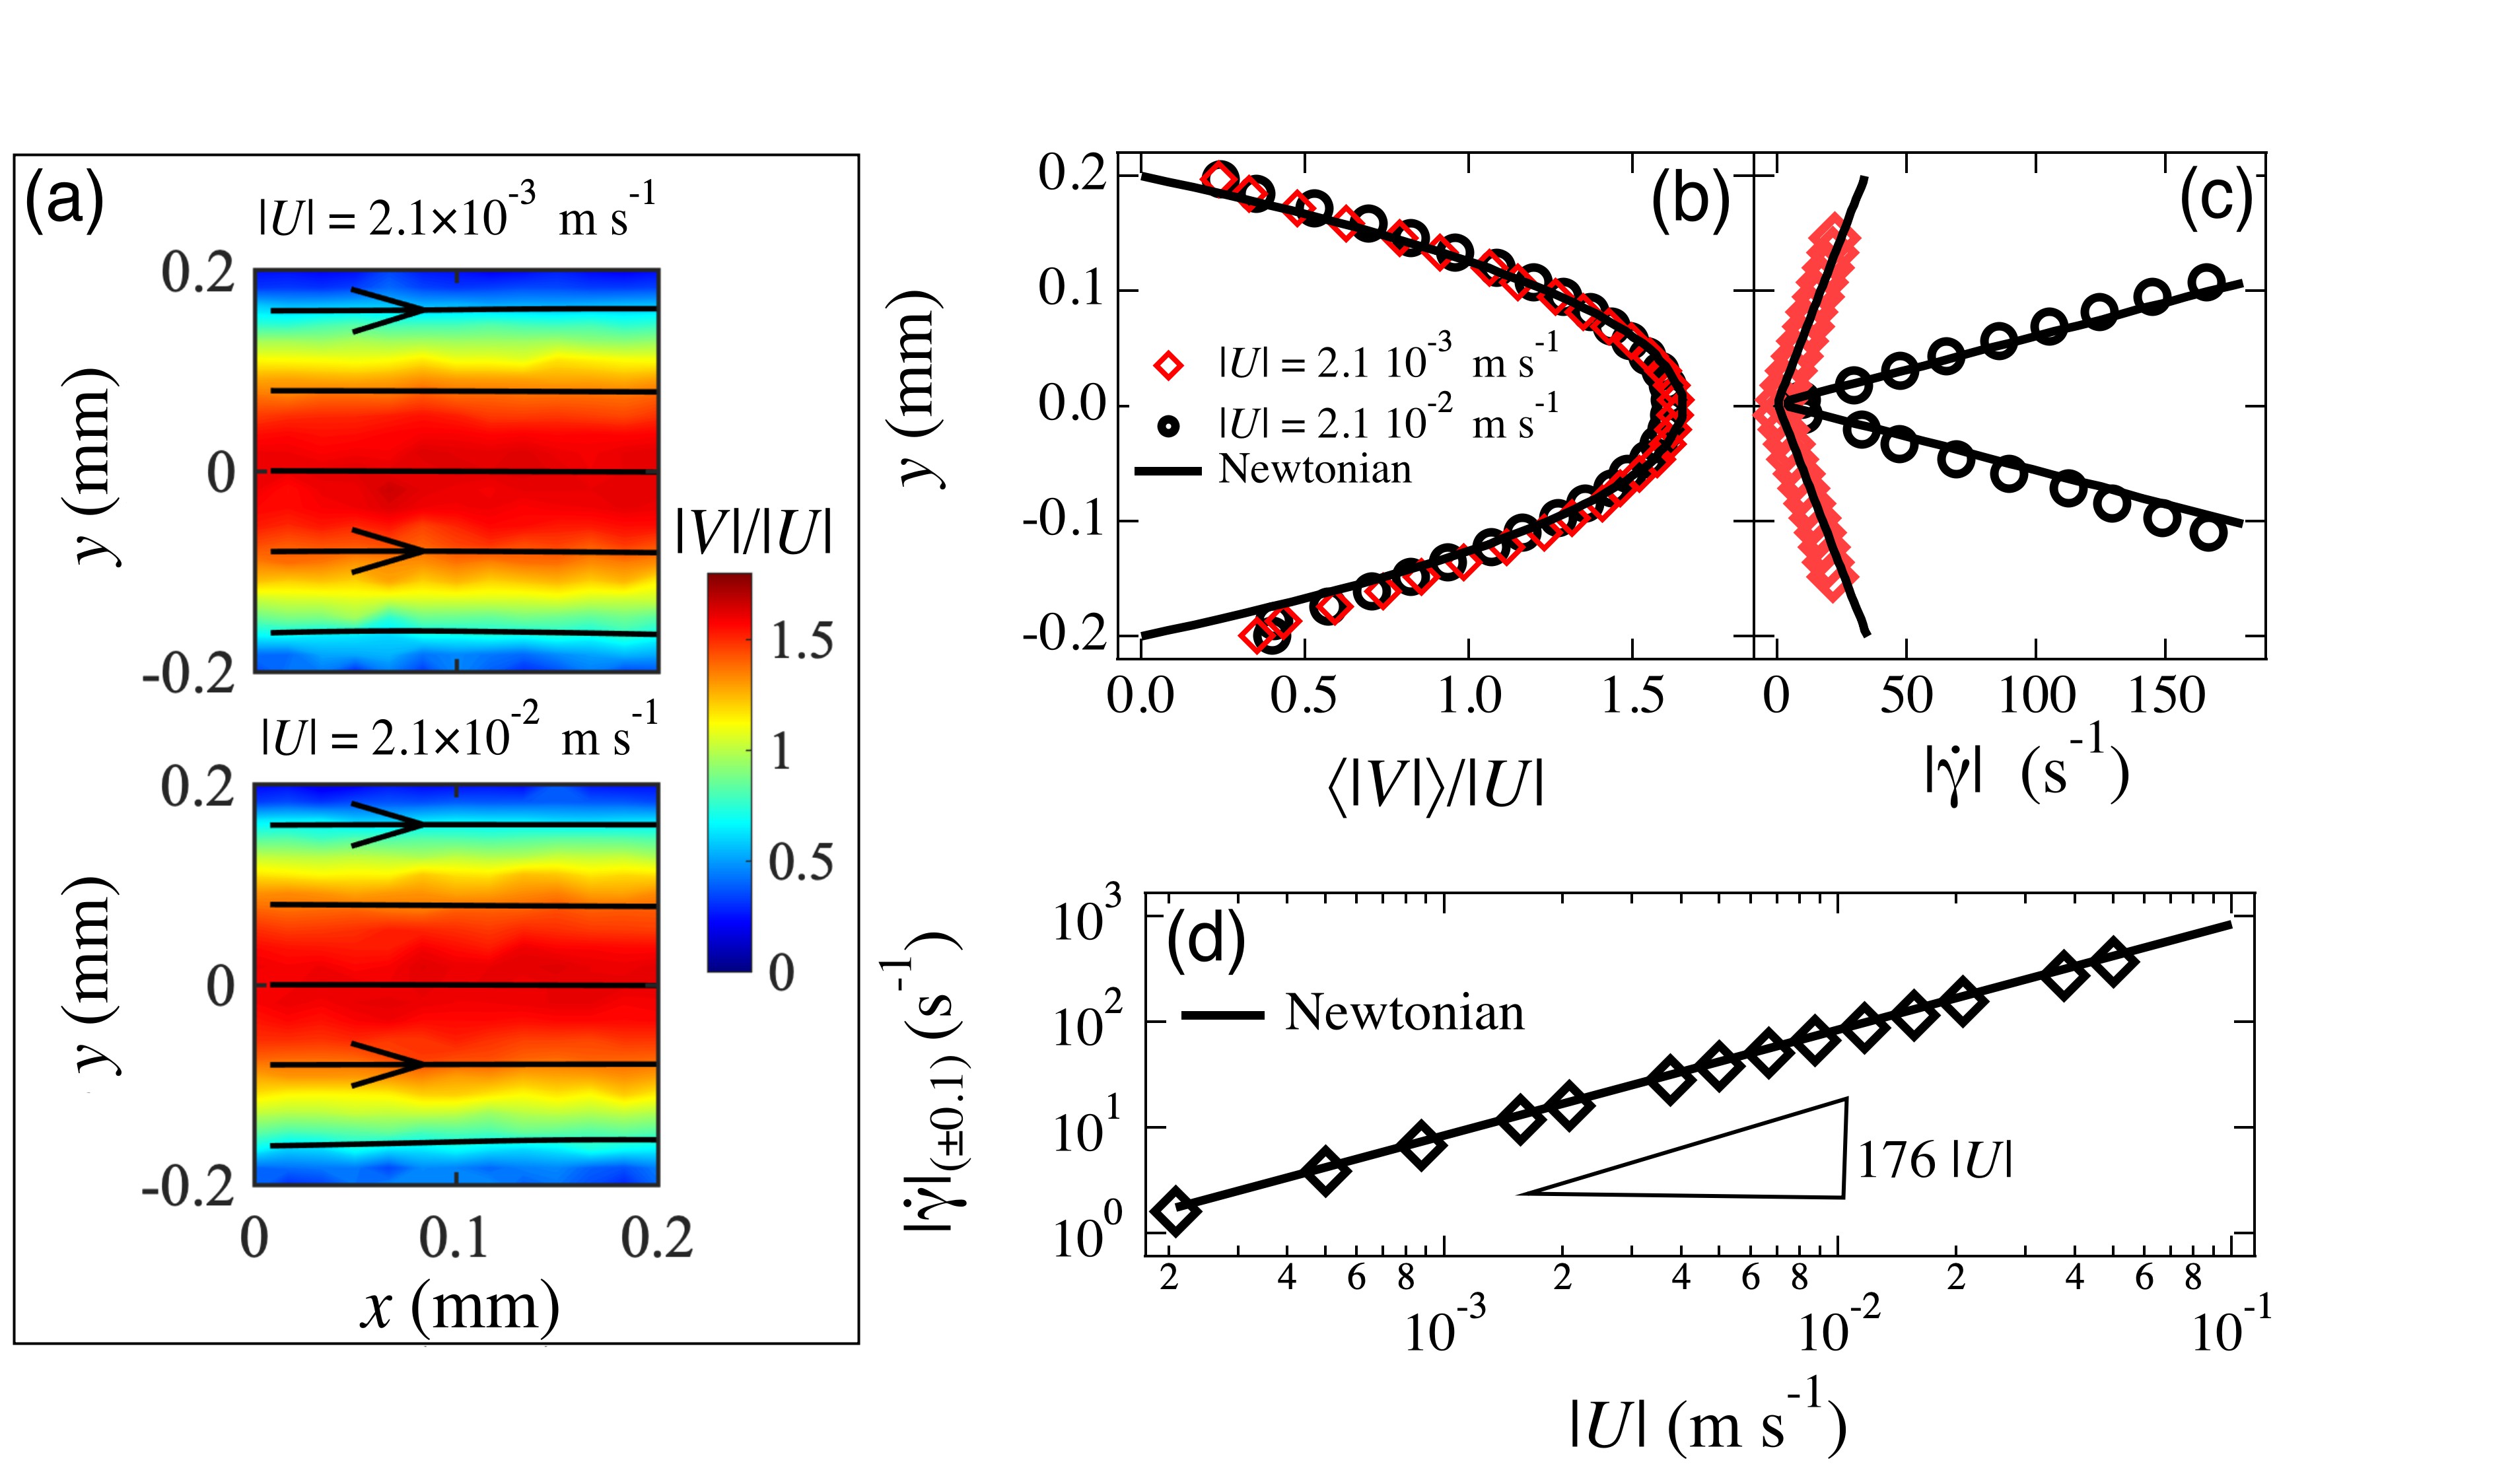
The SFC was used to provide a well approximated 2D shearing flow. Figure 3a shows two representative time averaged flow fields obtained by -PIV at the midplane ( mm) of the SFC. The velocity magnitude , as measured by -PIV, is scaled by the average flow velocity . The flow field displays a velocity gradient across the channel width (-axis) with the greater velocity along the centerline. This is evident when plotting the spatially averaged velocity, namely (determined by averaging along 0.2 mm of the -axis) as vs the channel width (-axis), where a parabolic (Poiseuille) flow profile is displayed (Figure 3b). The measured flow profile is in quantitative agreement with an infinite series analytical solution for creeping Newtonian flow38 as depicted by the solid line in Figure 3, consistent with the Newtonian-like behavior described by the rheological measurement in Figure 2. From the velocity profile displayed in Figure 3b, we compute the shear rate profile as , where is the -component of velocity (Figure 3c). The magnitude of the shear rate is also in good agreement with the expectation for a Newtonian fluid (black lines). Since the shear rate varies substantially along the channel -axis, we select the value of the shear rate at the location mm, namely (computed as the average of the at mm and mm), which is the mid-point in between the minimum and the maximum value of . The location mm is also far from the channel side walls, where the -PIV limitations become evident, while still providing relatively high values of shear rate.
The relation between and the average velocity can therefore be established as shown in Figure 3d, leading to , which satisfies the expectation for a Newtonian fluid (solid line).
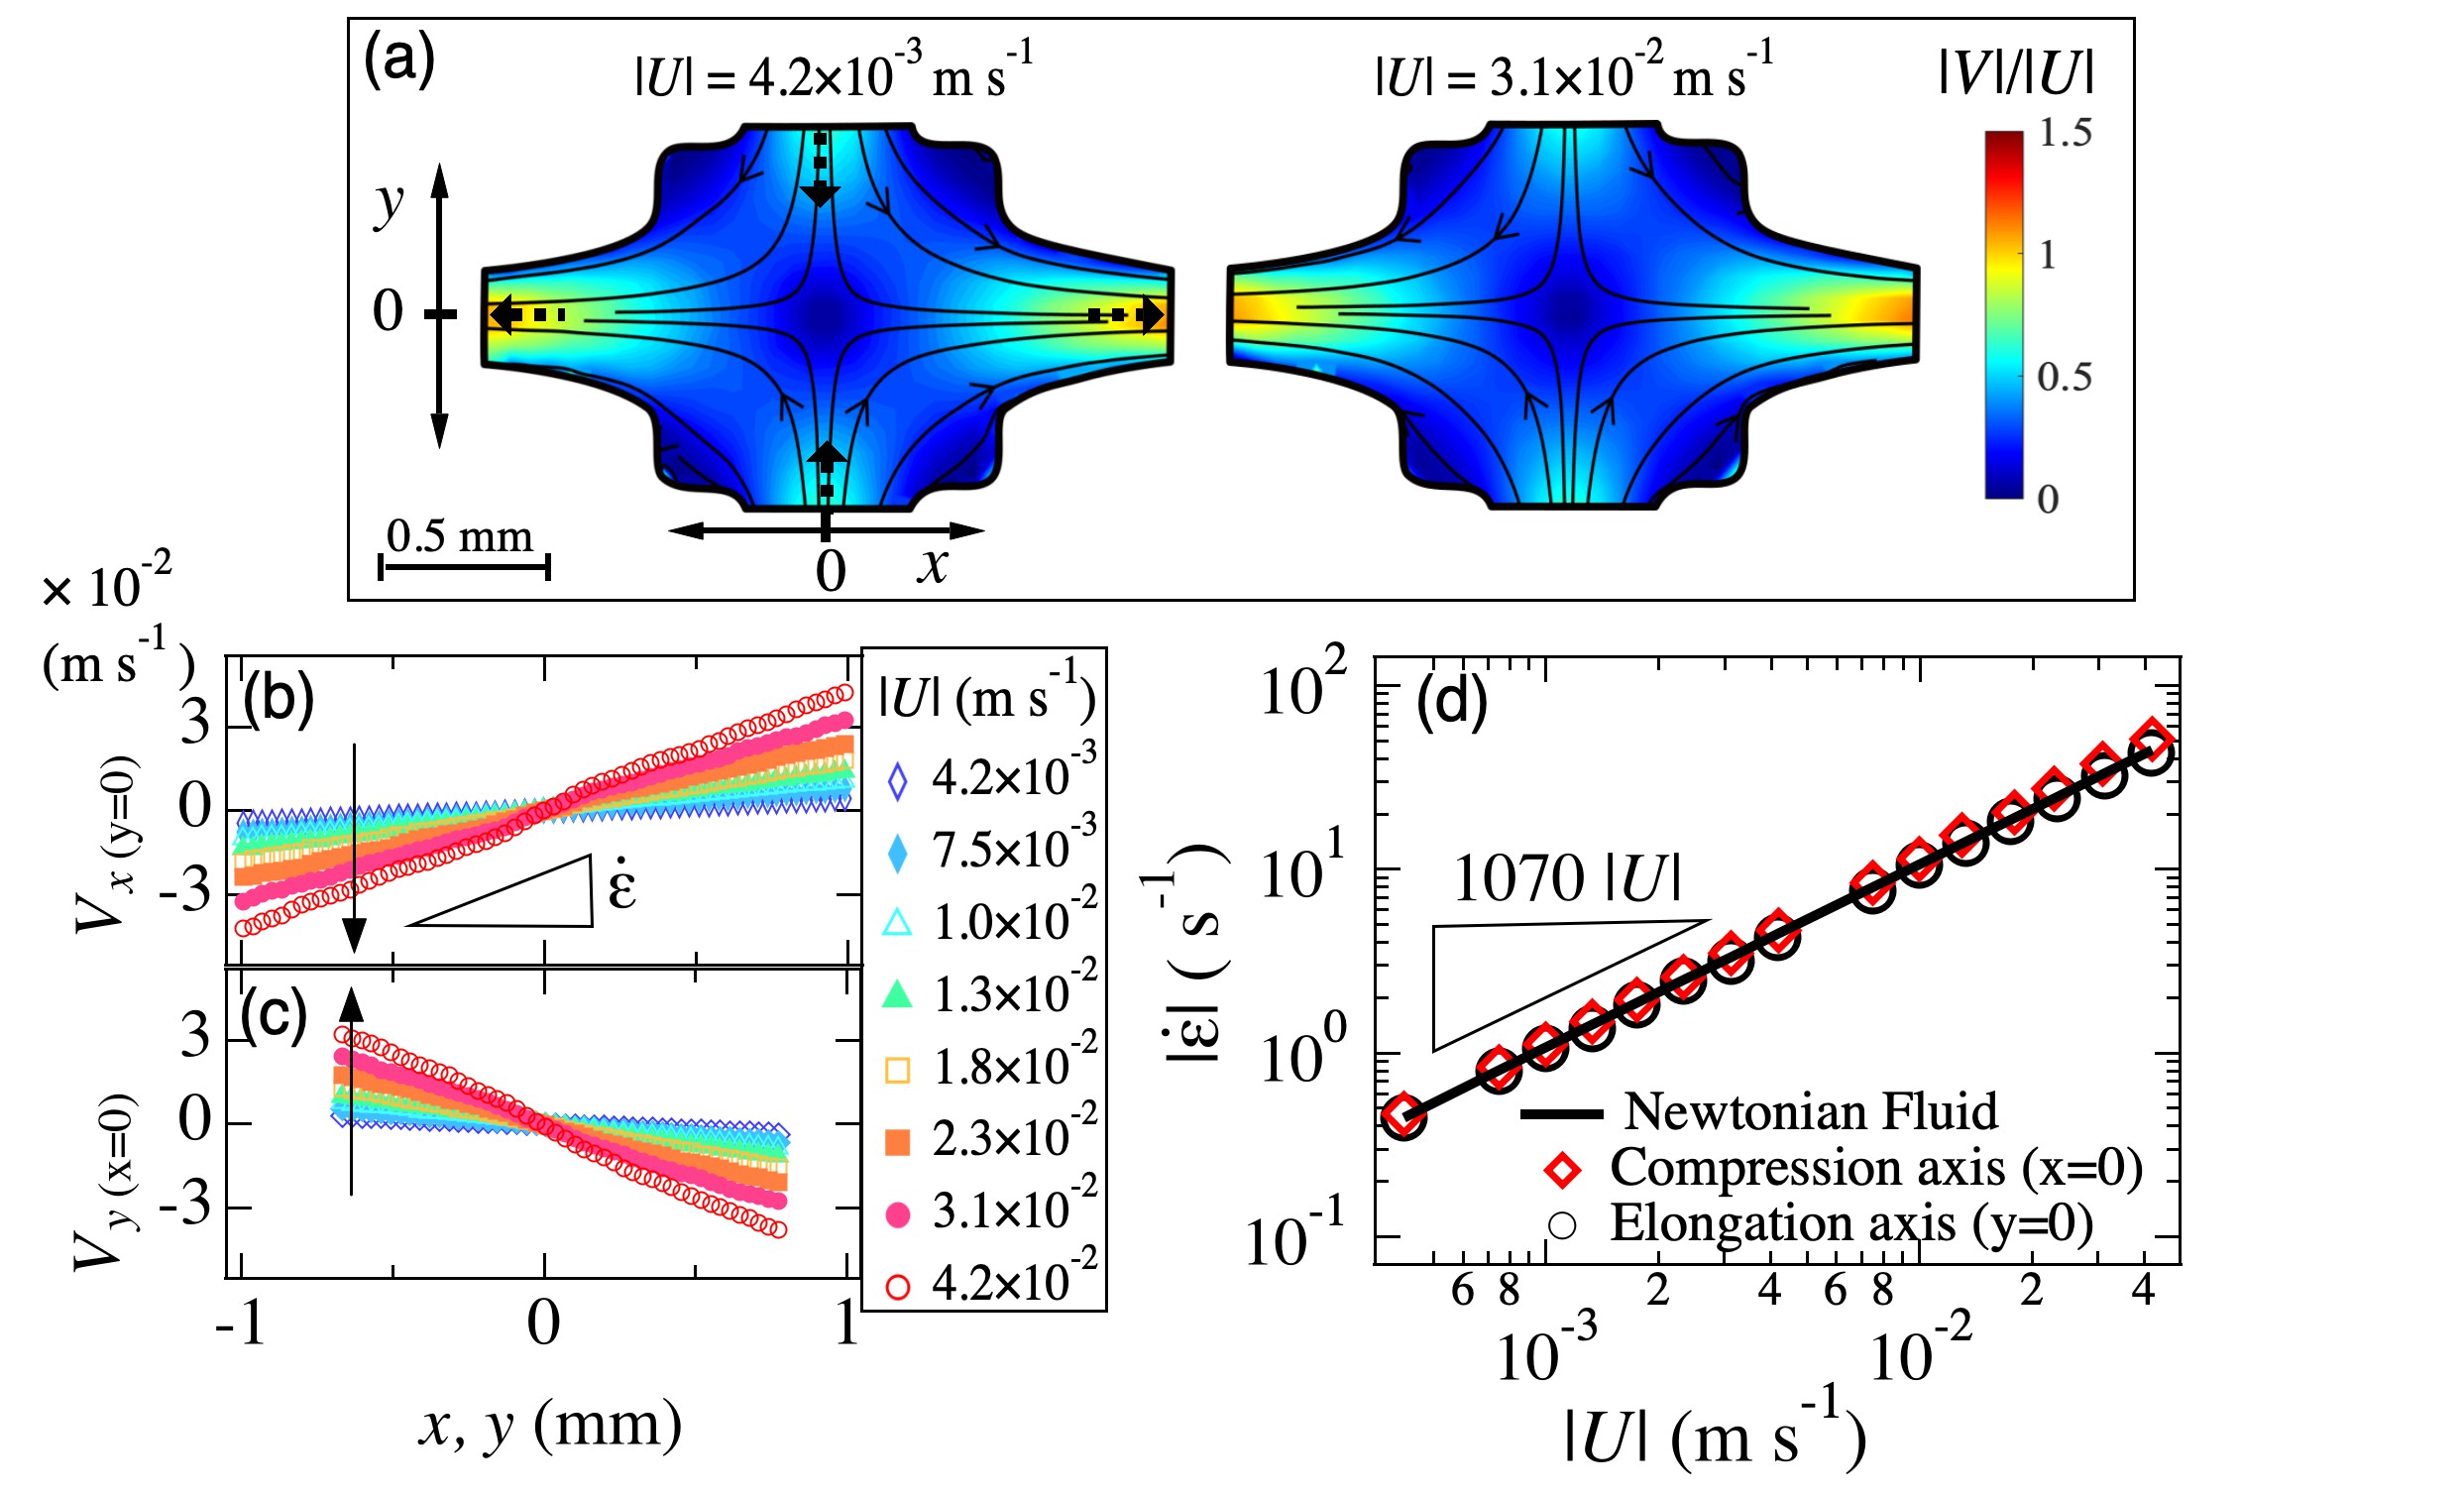
The OSCER is used to generate a 2D flow field with an extensional-dominated flow in a large region around the stagnation point (the point of zero velocity at , Figure 1b).27, 15, 39 The two incoming and outgoing flows are orthogonal to each other and indicated by the dashed arrows in Figure 4a. The -PIV profiles for two characteristic average velocities, , display a symmetric and Newtonian-like behavior (Figure 4a). The -component of velocity, , obtained along the elongation axis (at ) increases linearly with (Figure 4b) and, analogously, the -component of velocity, (at ) along the compression axis, decreases linearly with (Figure 4c). This indicates uniform extensional rates along both the compression and elongation axes. As such, the values of compression and elongation rates can be directly obtained from the slope of the plots in Figure 4b,c. In Figure 4d, the magnitude of the compression and elongation rate as a function of the average flow velocity collapsed on a single curve, indicating that the extensional rates, , along the compression and extension axes are equal and opposite, as for an ideal planar extension.27 The followed a linear relationship with as (indicated by the solid line), in good agreement with previously reported Newtonian fluids.27, 15 This behavior suggests that the diluted CNC dispersion behaves as a Newtonian fluid also in extension, giving an extensional viscosity where is the shear viscosity obtained from rheometry measurements displayed in Figure 2c and the proportionality factor of 4 is the Trouton ratio for Newtonian fluids in planar elongation flow.39
3.3 Flow-induced alignment
Since the spatially resolved deformation rates, and , have been established, we shift our attention to the impact that the two different deformation rates have on the structural orientation of the dilute CNC dispersion. The contourplot in Figure 5a displays the FIB fields in the SFC at two different values of . The birefringence intensity, , is displayed by the contourplot and describes the extent of anisotropy in the system and the orientation of the slow optical axis, , is displayed by the superimposed solid segments, which directly probes the CNC orientation angle.11, 40 As a metric of comparison, it has been recently shown that both and yield excellent agreement with parameters describing the extent of alignment and favourable orientation extrapolated from small angle X-ray scattering (SAXS) of anisotropic particles, enabling a trustworthy comparison of the FIB with the rheo-small angle scattering (SAS) literature.41 The FIB fields in the SFC display the minimum at (where s-1) and increases towards the channel walls (Figure 5a). Note that we attribute the narrow region of low FIB signal very close to the walls to “shadowing” by the wall, i.e. due to a slight imprecision of the orthogonal alignment of the microfluidic device on the imaging system (see Figure S1 for profiles across the channel width). Since scales with the volume fraction of aligned particles (), it is clear that a greater number of CNC become aligned as the shear rate is increased. The CNC orientation, displayed by the solid segments in Figure 5a, shows an overall alignment of the particles in the flow direction. However, for the lowest value of , the CNC orientation is not perfectly mirrored between the portion of the channel at mm and mm, and a degree of heterogeneity in the CNC orientation angle is observed.
In the OSCER device, a large region around the stagnation point displays a strong signal, as clearly visible for the larger value of in Figure 5b (displayed by the light blue color in the contourplot). The direction of the CNC alignment in the compression axis is perpendicular to the flow direction (-axis) due to the deceleration of the fluid element upon approaching the stagnation point and the consequent negative extensional rate along the -axis. Contrarily, the CNC aligns parallel to the flow (-axis) along the elongation axis due to the positive extension rate. Similar orientation trends have been reported for suspensions of anisotropic particles in extensional-dominated flows (in cross slots and fluidic four-roll mill devices), although in conditions where interparticle interactions play a crucial role on particle alignment.19, 18
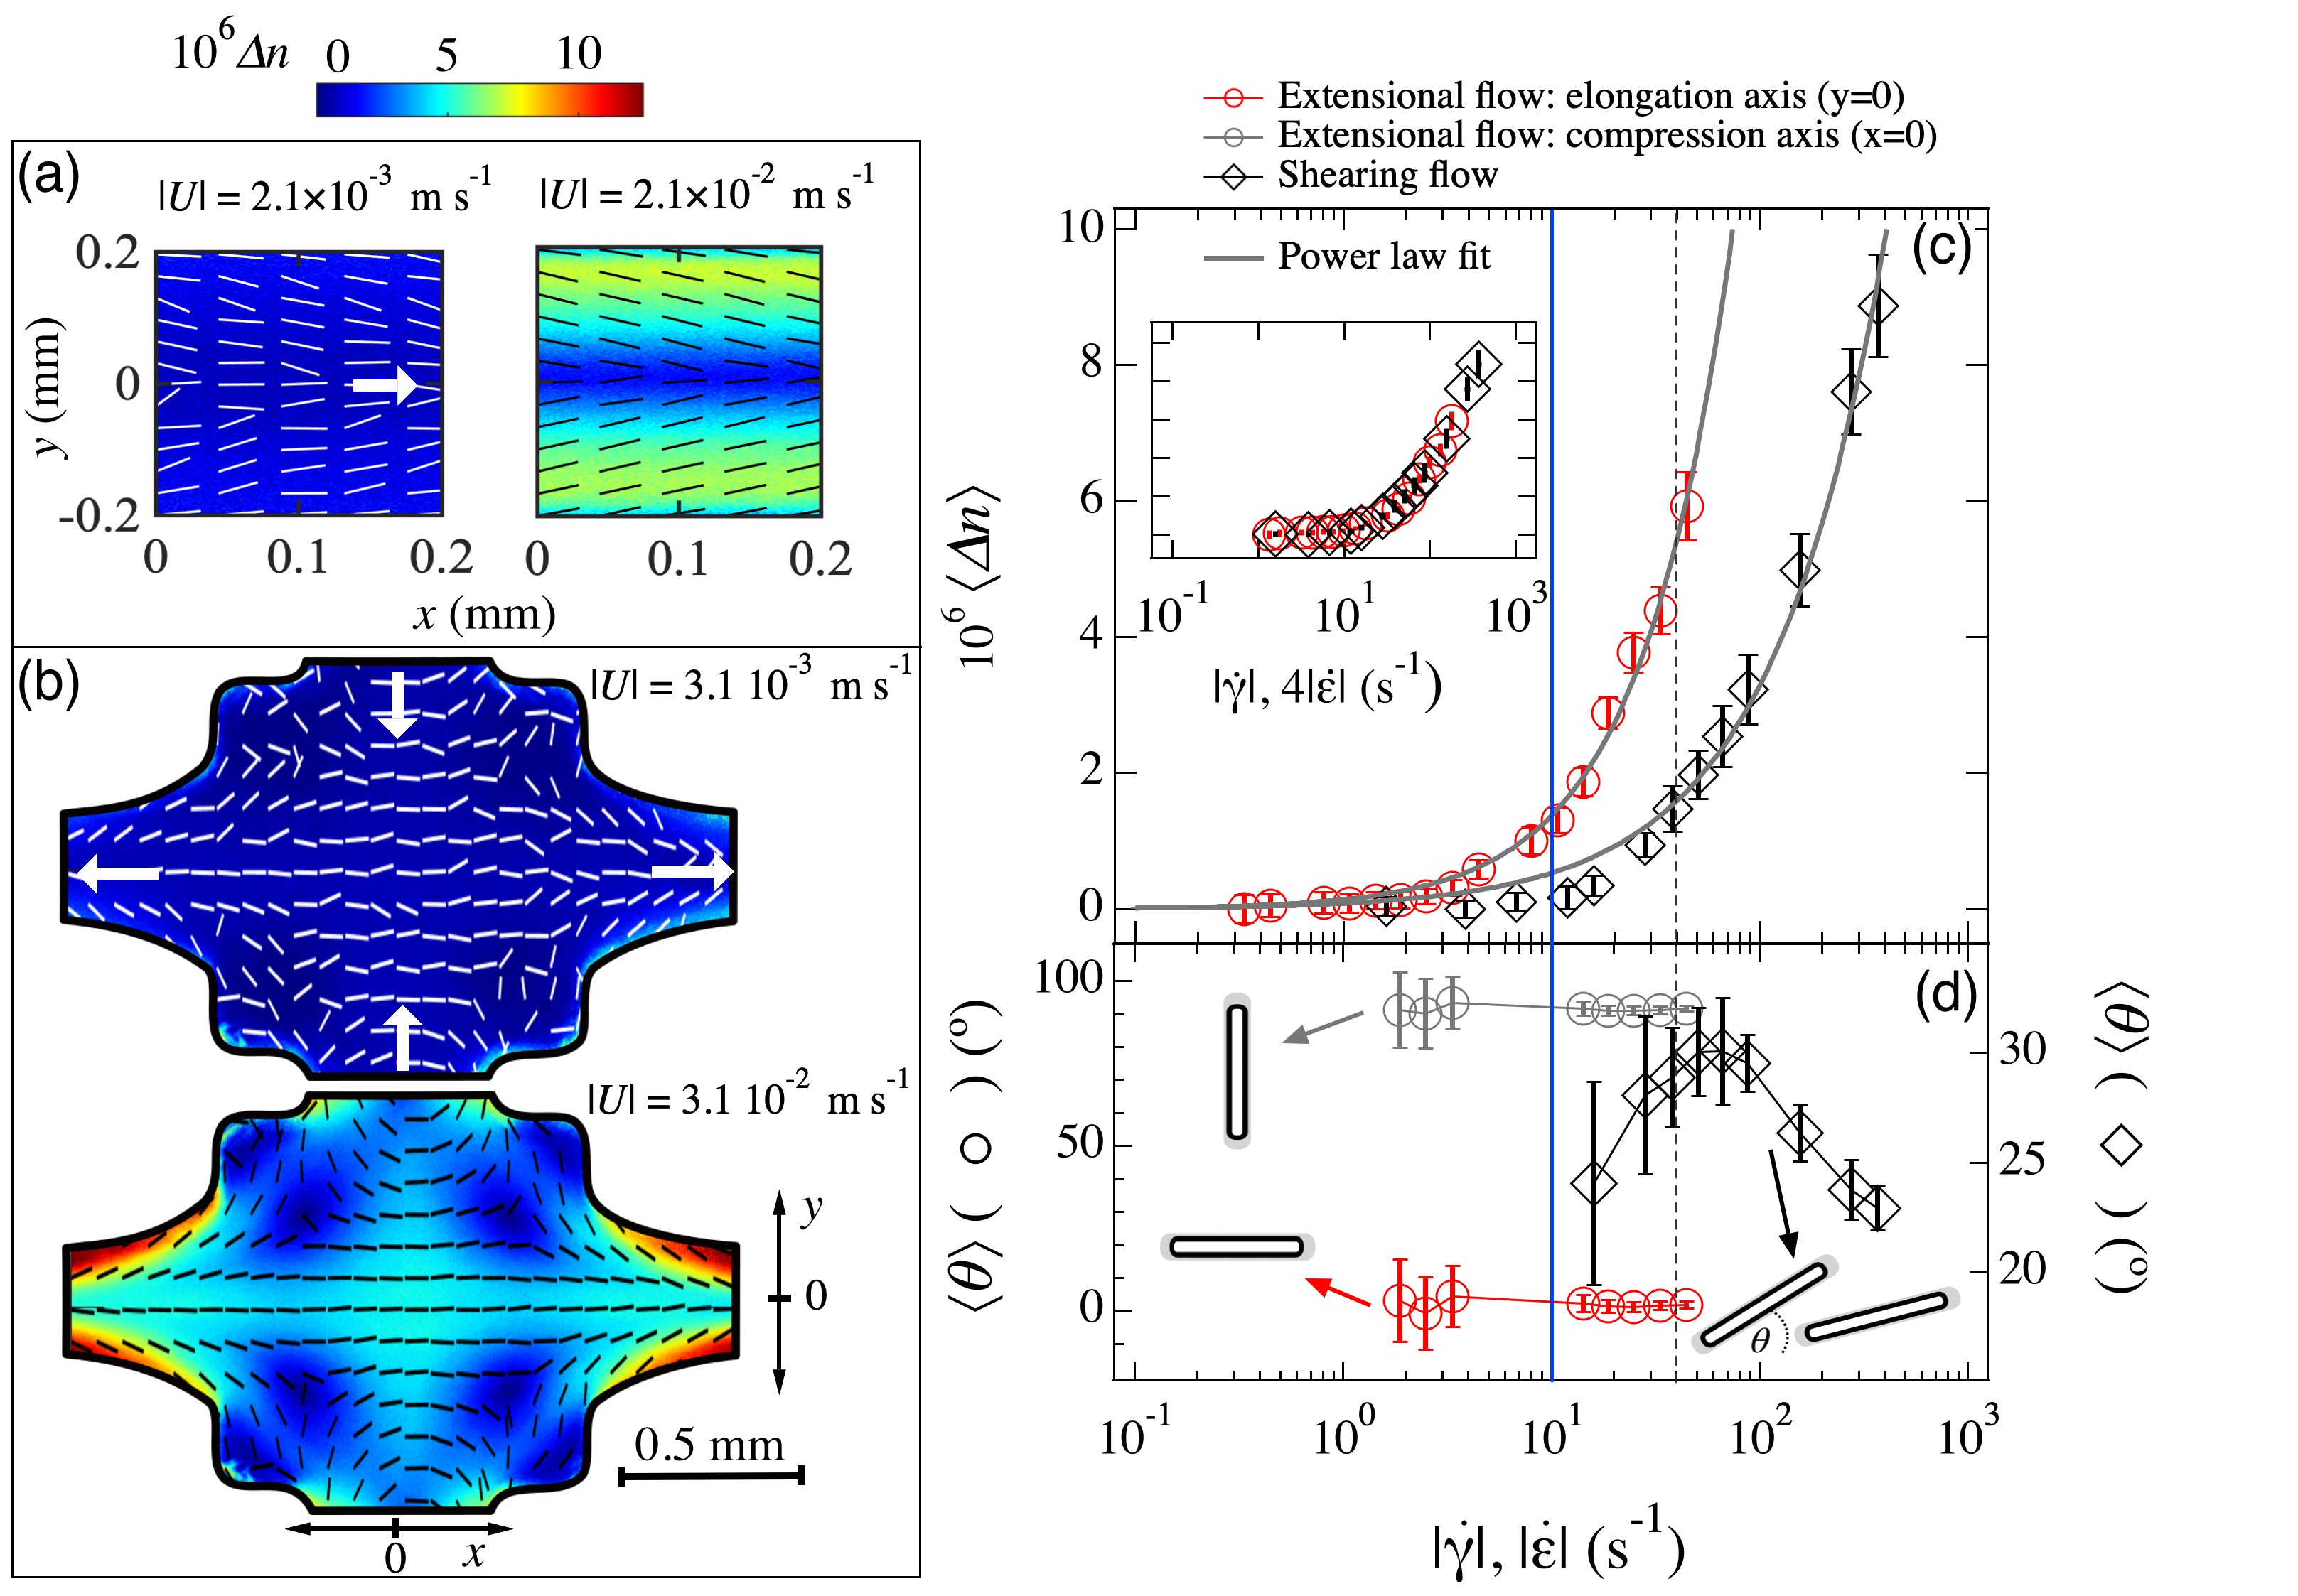
To have a good quantitative description of the deformation rate–alignment relationship, we plot the spatially resolved values of as a function of the relevant deformation rate previously determined in the specific locations of the SFC and OSCER geometries (Figure 5c). For the SFC, the spatially averaged birefringence signal, , is obtained at mm averaging along 1 mm in the -direction, whilst for the OSCER device, is obtained by averaging along 1 mm of the elongation axis (at over mm, see Figure S1, S2 for the spatially-resolved profiles). The curves showed in Figure 5c for the SFC and the OSCER device display a similar increase in with the deformation rate, , which is well captured by a power law trend as , where is a proportionality factor and is the power law exponent. For the SFC, s and , whilst for OSCER, s and . Importantly, the FIB technique enabled to capture the CNC alignment with the deformation rate, otherwise unexpected by interpretation of the rheological measurements alone (see Figure 2c). It is noted that for a given applied (hence profile, Figure 3c), this empirical power law is able to capture the profile across most of the SFC width with reasonable accuracy (see Figure S1 for spatially-resolved profiles with the predictions of the empirical power law fitting). Interestingly, from Figure 5c, it is apparent that lower extensional rates are required to induce rod alignment in the OSCER device, than the shear rates required to induce alignment in the SFC. This appears to indicate that extensional forces are more effective at inducing CNC alignment. The profiles obtained for the extensional and shearing flow collapsed on a single master curve when scaling the extensional rate as (inset in Figure 5c). This indicates that extensional and shear forces have a similar relationship with and that the extensional forces are 4 times more effective for the alignment of anisotropic particles when compared to shear forces. Therefore for a Newtonian fluid containing non-interacting rods, the following proportionality can be proposed . It is noted that the proportionality factor of 4 corresponds exactly to the Trouton ratio for Newtonian fluids in a planar elongation flow, which set the relationship between the solvent shear viscosity, , and the solvent extensional viscosity, .39 The strong dependence of the solvent viscosity on the onset of flow alignment is reflected by the in eqn.1. Assuming a dominant extensional viscosity along the extensional axis, it is plausible to substitute with in eqn. 1, yielding a in extension () 4 times smaller compared to the . Although not validated, the consideration of or for a rotational diffusion coefficient that accounts for shearing and extensional-dominated flows, respectively, has been previously proposed by Qazi et al.18 A decreased rotational diffusion coefficient in extensional-dominated flows has also been demonstrated by Rosén et al.21 for interacting cellulose nanofibrils. However, the absence of interparticle interactions and the uniform, shear-less, elongational flow presented in this work enables the first quantitative elucidation of differences between the rotational dynamics of colloidal rods in shear and extensional flows.
Considering that the longest CNC population () aligns at lower deformation rates, the predicted onset of alignment based on (dashed, black, lines in Figure 5c,d) and (solid, blue, lines in Figure 5c,d) do not exactly match the onset of birefringence. However, the scaling factor between the curves in Figure 5c strongly suggests that the larger value of compared to is the cause of the earlier onset of alignment.
To better evaluate the onset of alignment in shear and extensional flow, we further evaluate quantitatively the CNC orientation as captured by the angle of orientation, , with respect to the flow direction (Figure 5d). For the SFC, the spatially averaged angle of the slow optical axis, , was determined in the same location as for the , i.e. averaging along 1 mm in the -direction at mm, whilst for the OSCER device, the was obtained from averaging along 1 mm of the elongation axis at (averaging over mm) and compression axis at (averaging over mm, see Figure S2 for profiles along the extensional axes). In shear, for s-1, within experimental error (note error bars), the CNC alignment is almost constant at with respect to the flow direction. For s-1, progressively decreases to values of around at the highest shear rates, in good agreement with SAXS and birefringence studies of a diluted CNC suspension.41 Along the elongation axis of the OSCER, the CNC aligns parallel to the flow, with an orientation of to the flow direction. Contrarily, along the compression axis, the CNC align perpendicular to the flow with . Such perpendicular alignment of elongated particles has been previously reported for shear thinning fluids in extensional-dominated flows.7, 17 However, it is clear from our results that shear thinning is not a requirement for such orientation to occur.
As previously anticipated, the expected value for the onset of CNC alignment is s-1 (depicted by , dashed (black) lines in Figure 5c,d) when considering the longest CNC population. Although the onset of birefringence, , occurs at values of s-1, the predicted onset of alignment at s-1 is in close agreement with the origin of the significant decrease in in the SFC (Figure 5d). The coexistence of and the steady value of with a relatively large error at s-1, suggests the presence of an intermediate shear rate region where Brownian diffusion and deformation rate are of comparable magnitude, leading to a time-dependent and collective particle rotation in the velocity-gradient plane.12, 42 Contrarily, a Brownian dominated region occurs for s-1, where the system is isotropic and , whilst, at s-1, the hydrodynamic forces orient the particles towards a , causing a pronounced increase in . A similar intermediate shear rate regime has been described for a concentrated CNC suspension43 as well as wormlike micelles44 and polymeric liquid crystals.42
For the elongational flow, is constant over the whole range of , in agreement with the reported analytical solutions for diluted Brownian suspensions of rod-like particles.12
Therefore, the onset of a convection-dominated particle alignment in a shear-dominated flow is more adequately described by the orientation angle , whilst, for the extensional-dominated flow, the onset of birefringence is a better parameter to consider since is independent of the rate of deformation. When this is considered, the onset of alignment is satisfactorily captured by a diffusion coefficient that accounts for the longest particle population and the appropriate viscosity that the fluid experiences in the specific location of the channel, i.e. or .
4 CONCLUSION
Combining flow visualization and flow induced birefringence, we are able to decouple the effects of shear and extensional forces on a dilute dispersion of cellulose nanocrystals, consisting of negatively charged polydisperse and rod-like rigid particles. Simultaneous analysis of the birefringence with the orientation of the slow optical axis elucidate that extensional forces are ca. 4 times more effective at inducing particle alignment compared to shear forces. This difference is explained by the different viscosity that the fluid experiences between a shear and extensional-dominated region, namely the shear and extensional viscosity, respectively. In addition, shear and extension rates have displayed a remarkably different effect on particle orientation. In a shear-dominated flow, the particles exhibit a gradual decrease in the orientation angle with increasing shear rate. Contrarily, in the extensional-dominated flow the particle orientation is deformation-rate independent and a parallel or perpendicular orientation of the particles to the flow direction is observed along the elongation and compression axes of the geometry, respectively. To the best of our knowledge, this is the first experimental report where the effects of shear and pure extensional flows on the alignment of rigid anisotropic particles are quantitatively compared. This understanding will provide the basis to decouple the orientation dynamics in industrially relevant flows, where a combination of shear and extensional rates are usually present and in fluids where interparticle interactions play a crucial role. We envisage that the knowledge provided in this work will help to optimize engineering processes involved with controlled anisotropy. Having demonstrated the influence of the solvent shear and extensional viscosity at controlling the alignment of non-interacting rods for a Newtonian solvent, we aim in future work to broaden this understanding for the more complex non-Newtonian case, by using solvent fluids with larger and deformation rate–dependent Trouton ratios.
The authors gratefully acknowledge the support of Okinawa Institute of Science and Technology Graduate University with subsidy funding from the Cabinet Office, Government of Japan. S.J.H. and A.Q.S. also acknowledge financial support from the Japanese Society for the Promotion of Science (JSPS, Grant Nos. 18K03958 and 18H01135) and the Joint Research Projects (JRPs) supported by the JSPS and the Swiss National Science Foundation (SNSF). The authors thank Dr. Riccardo Funari from the Micro/Bio/Nanofluidics unit at OIST for his assistance with AFM measurements and Dr. Vikram Rathee from the Micro/Bio/Nanofluidics unit at OIST for comments on the manuscript.
References
- Solomon and Spicer 2010 Solomon, M. J.; Spicer, P. T. Microstructural regimes of colloidal rod suspensions, gels, and glasses. Soft Matter 2010, 6, 1391–1400
- Rosén et al. 2020 Rosén, T.; Hsiao, B. S.; Söderberg, L. D. Elucidating the opportunities and challenges for nanocellulose spinning. Advanced Materials 2020, 2001238
- Calabrese et al. 2020 Calabrese, V.; da Silva, M. A.; Porcar, L.; Bryant, S. J.; Hossain, K. M. Z.; Scott, J. L.; Edler, K. J. Filler size effect in an attractive fibrillated network: a structural and rheological perspective. Soft Matter 2020, 16, 3303–3310
- Håkansson et al. 2014 Håkansson, K. M. O.; Fall, A. B.; Lundell, F.; Yu, S.; Krywka, C.; Roth, S. V.; Santoro, G.; Kvick, M.; Prahl Wittberg, L.; Wågberg, L.; Söderberg, L. D. Hydrodynamic alignment and assembly of nanofibrils resulting in strong cellulose filaments. Nature Communications 2014, 5, 4018
- Nechyporchuk et al. 2018 Nechyporchuk, O.; Håkansson, K. M. O.; Gowda.V, K.; Lundell, F.; Hagström, B.; Köhnke, T. Continuous assembly of cellulose nanofibrils and nanocrystals into strong macrofibers through microfluidic spinning. Advanced Materials Technologies 2018, 4, 1800557
- Liu et al. 2014 Liu, D.; Wang, S.; Ma, Z.; Tian, D.; Gu, M.; Lin, F. Structure-color mechanism of iridescent cellulose nanocrystal films. RSC Advances 2014, 4, 39322–39331
- Kiriya et al. 2012 Kiriya, D.; Kawano, R.; Onoe, H.; Takeuchi, S. Microfluidic control of the internal morphology in nanofiber-based macroscopic cables. Angewandte Chemie - International Edition 2012, 51, 7942–7947
- Xin et al. 2019 Xin, G.; Zhu, W.; Deng, Y.; Cheng, J.; Zhang, L. T.; Chung, A. J.; De, S.; Lian, J. Microfluidics-enabled orientation and microstructure control of macroscopic graphene fibres. Nature Nanotechnology 2019, 14, 168–175
- De France et al. 2017 De France, K. J.; Yager, K. G.; Chan, K. J. W.; Corbett, B.; Cranston, E. D.; Hoare, T. Injectable anisotropic nanocomposite hydrogels direct in situ growth and alignment of myotubes. Nano Letters 2017, 17, 6487–6495
- Doi and Edwards 1978 Doi, M.; Edwards, S. F. Dynamics of rod-like macromolecules in concentrated solution. Part 1—Brownian motion in the equilibrium state . Journal of the Chemical Society, Faraday Transactions 2: Molecular and Chemical Physics 1978, 74, 560–570
- Vermant et al. 2001 Vermant, J.; Yang, H.; Fuller, G. G. Rheo-optical determination of aspect ratio and polydispersity of nonspherical particles. AIChE Journal 2001, 47, 790–798
- Dhont and Briels 2007 Dhont, J. K. G.; Briels, W. J. Soft Matter Vol. 2; Wiley-VCH: Weinheim, Germany, 2007; Vol. 2; pp 216–283
- Reddy et al. 2018 Reddy, N. K.; Natale, G.; Prud’homme, R. K.; Vermant, J. Rheo-optical analysis of functionalized graphene suspensions. Langmuir 2018, 34, 7844–7851
- Winkler et al. 2004 Winkler, R. G.; Mussawisade, K.; Ripoll, M.; Gompper, G. Rod-like colloids and polymers in shear flow: a multi-particle-collision dynamics study. Journal of Physics: Condensed Matter 2004, 16, 3941–3954
- Haward et al. 2016 Haward, S. J.; McKinley, G. H.; Shen, A. Q. Elastic instabilities in planar elongational flow of monodisperse polymer solutions. Scientific Reports 2016, 6, 33029
- Lang et al. 2019 Lang, C.; Hendricks, J.; Zhang, Z.; Reddy, N. K.; Rothstein, J. P.; Lettinga, M. P.; Vermant, J.; Clasen, C. Effects of particle stiffness on the extensional rheology of model rod-like nanoparticle suspensions. Soft Matter 2019, 15, 833–841
- Trebbin et al. 2013 Trebbin, M.; Steinhauser, D.; Perlich, J.; Buffet, A.; Roth, S. V.; Zimmermann, W.; Thiele, J.; Förster, S. Anisotropic particles align perpendicular to the flow direction in narrow microchannels. Proceedings of the National Academy of Sciences of the United States of America 2013, 110, 6706–6711
- Qazi et al. 2011 Qazi, S. J. S.; Rennie, A. R.; Tucker, I.; Penfold, J.; Grillo, I. Alignment of dispersions of plate-like colloidal particles of Ni(OH)2 induced by elongational flow. Journal of Physical Chemistry B 2011, 115, 3271–3280
- Pignon et al. 2003 Pignon, F.; Magnin, A.; Piau, J.-M.; Fuller, G. G. The orientation dynamics of rigid rod suspensions under extensional flow. Journal of Rheology 2003, 47, 371–388
- Corona et al. 2018 Corona, P. T.; Ruocco, N.; Weigandt, K. M.; Leal, L. G.; Helgeson, M. E. Probing flow-induced nanostructure of complex fluids in arbitrary 2D flows using a fluidic four-roll mill (FFoRM). Scientific Reports 2018, 8, 15559
- Rosén et al. 2020 Rosén, T.; Mittal, N.; Roth, S. V.; Zhang, P.; Lundell, F.; Söderberg, L. D. Flow fields control nanostructural organization in semiflexible networks. Soft Matter 2020, 16, 5439–5449
- Hasegawa et al. 2020 Hasegawa, H.; Horikawa, Y.; Shikata, T. Cellulose nanocrystals as a model substance for rigid rod particle suspension rheology. Macromolecules 2020, 53, 2677–2685
- Bertsch et al. 2017 Bertsch, P.; Isabettini, S.; Fischer, P. Ion-induced hydrogel formation and nematic ordering of nanocrystalline cellulose suspensions. Biomacromolecules 2017, 18, 4060–4066
- Bertsch et al. 2019 Bertsch, P.; Sánchez-Ferrer, A.; Bagnani, M.; Isabettini, S.; Kohlbrecher, J.; Mezzenga, R.; Fischer, P. Ion-induced formation of nanocrystalline cellulose colloidal glasses containing nematic domains. Langmuir 2019, 35, 4117–4124
- Reid et al. 2017 Reid, M. S.; Villalobos, M.; Cranston, E. D. Benchmarking cellulose nanocrystals: From the laboratory to industrial production. Langmuir 2017, 33, 1583–1598
- Usov and Mezzenga 2015 Usov, I.; Mezzenga, R. FiberApp: An open-source software for tracking and analyzing polymers, filaments, biomacromolecules, and fibrous objects. Macromolecules 2015, 48, 1269–1280
- Haward et al. 2012 Haward, S. J.; Oliveira, M. S. N.; Alves, M. A.; McKinley, G. H. Optimized cross-slot flow geometry for microfluidic extensional rheometry. Physical Review Letters 2012, 109, 128301
- Burshtein et al. 2019 Burshtein, N.; Chan, S. T.; Toda-Peters, K.; Shen, A. Q.; Haward, S. J. 3D-printed glass microfluidics for fluid dynamics and rheology. Current Opinion in Colloid and Interface Science 2019, 43, 1–14
- Haward et al. 2019 Haward, S. J.; Kitajima, N.; Toda-Peters, K.; Takahashi, T.; Shen, A. Q. Flow of wormlike micellar solutions around microfluidic cylinders with high aspect ratio and low blockage ratio. Soft Matter 2019, 15, 1927–1941
- Meinhart et al. 2000 Meinhart, C. D.; Wereley, S.; Gray, M. Volume illumination for two-dimensional particle image velocimetry. Measurement Science and Technology 2000, 11, 809–814
- Wagner et al. 2010 Wagner, R.; Raman, A.; Moon, R. J. 10th International Conference on Wood & Biofiber Plastic Composites; 2010; pp 309–316
- Lang et al. 2019 Lang, C.; Kohlbrecher, J.; Porcar, L.; Radulescu, A.; Sellinghoff, K.; Dhont, J. K. G.; Lettinga, M. P. Microstructural understanding of the length- and stiffness-dependent shear thinning in semidilute colloidal rods. Macromolecules 2019, 52, 9604–9612
- Usov et al. 2015 Usov, I.; Nyström, G.; Adamcik, J.; Handschin, S.; Schütz, C.; Fall, A.; Bergström, L.; Mezzenga, R. Understanding nanocellulose chirality and structure–properties relationship at the single fibril level. Nature Communications 2015, 6, 7564
- Lang and Lettinga 2020 Lang, C.; Lettinga, M. P. Shear flow behavior of bidisperse rodlike colloids. Macromolecules 2020, 53, 2662–2668
- Tanaka et al. 2014 Tanaka, R.; Saito, T.; Ishii, D.; Isogai, A. Determination of nanocellulose fibril length by shear viscosity measurement. Cellulose 2014, 21, 1581–1589
- Kobayashi and Yamamoto 2011 Kobayashi, H.; Yamamoto, R. Reentrant transition in the shear viscosity of dilute rigid-rod dispersions. Physical Review E 2011, 84, 051404
- Lang et al. 2016 Lang, C.; Kohlbrecher, J.; Porcar, L.; Lettinga, M. The connection between biaxial orientation and shear thinning for quasi-ideal rods. Polymers 2016, 8, 291
- Shah and London 1978 Shah, R.; London, A. In Laminar Flow Forced Convection in Ducts: a Source Book for Compact Heat Exchanger Analytical Data, Academic Press, New York, 1978.; Hartnett, T. I. J. P., Ed.; Academic Press, 1978
- Haward 2016 Haward, S. J. Microfluidic extensional rheometry using stagnation point flow. Biomicrofluidics 2016, 10, 043401
- Sun and Huang 2016 Sun, C.-L.; Huang, H.-Y. Measurements of flow-induced birefringence in microfluidics. Biomicrofluidics 2016, 10, 011903
- Rosén et al. 2020 Rosén, T.; Wang, R.; Zhan, C.; He, H.; Chodankar, S.; Hsiao, B. S. Cellulose nanofibrils and nanocrystals in confined flow: Single-particle dynamics to collective alignment revealed through scanning small-angle X-ray scattering and numerical simulations. Physical Review E 2020, 101, 032610
- Mewis et al. 1997 Mewis, J.; Mortier, M.; Vermant, J.; Moldenaers, P. Experimental evidence for the existence of a wagging regime in polymeric liquid crystals. Macromolecules 1997, 30, 1323–1328
- Ebeling et al. 1999 Ebeling, T.; Paillet, M.; Borsali, R.; Diat, O.; Dufresne, A.; Cavaillé, J. Y.; Chanzy, H. Shear-induced orientation phenomena in suspensions of cellulose microcrystals, revealed by small angle X-ray scattering. Langmuir 1999, 15, 6123–6126
- Lerouge and Berret 2009 Lerouge, S.; Berret, J.-F. In Polymer Characterization: Rheology, Laser Interferometry, Electrooptics; Dusek, K., Joanny, J.-F., Eds.; Advances in Polymer Science 12; Springer Berlin Heidelberg: Berlin, Heidelberg, 2009; Vol. 58; pp 1–71