SN 2019yvq Does Not Conform to SN Ia Explosion Models
Abstract
We present new photometric and spectroscopic observations of SN 2019yvq, a Type Ia supernova (SN Ia) exhibiting several peculiar properties including an excess of UV/optical flux within days of explosion, a high Si II velocity, and a low peak luminosity. Photometry near the time of first light places new constraints on the rapid rise of the UV/optical flux excess. A near-infrared spectrum at days after maximum light places strict limits on the presence of H or He emission, effectively excluding the presence of a nearby non-degenerate star at the time of explosion. New optical spectra, acquired at +128 and +150 days after maximum light, confirm the presence of [Ca II] and persistent Ca II NIR triplet emission as SN 2019yvq transitions into the nebular phase. The lack of [O I] emission disfavors the violent merger of two C/O white dwarfs (WDs) but the merger of a C/O WD with a He WD cannot be excluded. We compare our findings with several models in the literature postulated to explain the early flux excess including double-detonation explosions, 56Ni mixing into the outer ejecta during ignition, and interaction with H- and He-deficient circumstellar material. Each model may be able to explain both the early flux excess and the nebular [Ca II] emission, but none of the models can reconcile the high photospheric velocities with the low peak luminosity without introducing new discrepancies.
1 Introduction
Type Ia supernovae (SNe Ia) are crucial probes of cosmological parameters (e.g., Riess et al., 1998; Perlmutter et al., 1999) and produce the majority of iron-group elements in the universe (e.g., Iwamoto et al., 1999). They originate from a white dwarf (WD) star (Hoyle & Fowler, 1960) but the details of how the WD explodes are widely debated (see Jha et al., 2019 and Maoz et al., 2014 for recent reviews). There are two main progenitor theories: the single-degenerate (SD) and double-degenerate (DD) scenarios, depending on whether the companion is a non-degenerate star or a second WD.
The SD channel requires a non-degenerate star to deposit mass onto the surface of the WD (Hoyle & Fowler, 1960). The WD gains mass until it destabilises and explodes, although the destabilization mechanism is still unclear. The presence of a nearby non-degenerate star at the time of explosion naturally leads to several observational signatures (e.g., Wheeler et al., 1975). The fast-moving ejecta will impact the star causing shock emission and irregularities in the rising light curve (Kasen, 2010), strip/ablate material from the stellar surface (e.g., Marietta et al., 2000; Boehner et al., 2017), and interact with material carried by the stellar winds to produce radio emission (Chevalier, 1982a, b; Panagia et al., 2006). Over the past decade, searches for these signatures have mostly returned non-detections such as a lack of bumps in the rising light curves (e.g., Bianco et al., 2011; Fausnaugh et al., 2019), limits on nebular H emission from stripped companion material (e.g., Leonard, 2007; Shappee et al., 2013; Tucker et al., 2020), and strict constraints on prompt radio (e.g., Chomiuk et al., 2012, 2016) and X-ray (e.g., Margutti et al., 2012, 2014) emission. Although the SD scenario has difficulty explaining normal SNe Ia, it can readily account for some peculiar SNe Ia such as those exhibiting interaction with dense circumstellar material (SNe Ia-CSM, Silverman et al., 2013).
In the DD channel, a second WD destabilizes the more massive WD and induces the explosion. The lack of a non-degenerate star removes many of the predicted observational signatures of the SD scenario, but confirming binary WDs is exceptionally difficult (e.g., Rebassa-Mansergas et al., 2019). There are subtler predictions for DD systems, such as double-peaked emission lines of radioactive decay products (Dong et al., 2015; Vallely et al., 2020) and high continuum polarization (Bulla et al., 2016). However, these predictions also depend on the explosion mechanism, a topic related to, but distinct from, the progenitor system.
The explosion mechanism refers to the process of actually destabilizing and igniting the WD. Two common models are the double-detonation (Livne, 1990) and delayed-detonation (Khokhlov et al., 1993; Hoeflich et al., 2017) theories. Double detonation refers to the ignition of a surface shell of He which drives a shock wave inwards to detonate the C/O core (Livne, 1990; Livne & Glasner, 1991). The near-surface He layer is acquired from either a companion He star (i.e., the SD channel, Bildsten et al., 2007) or from a lower-mass WD (i.e., the DD channel, Fink et al., 2007).
The delayed-detonation model can also be applied to either progenitor system, requiring only that the primary WD approaches the Chandrasekhar mass () via accretion and the explosion is triggered by compressional heating at the center of the WD (Hoeflich & Khokhlov, 1996). There are other explosion mechanisms in the literature, such as gravitationally-confined detonations (GCDs; Plewa et al., 2004) or pulsational-delayed detonations (PDD; e.g., Dessart et al., 2014). However, these models are less frequently invoked and we only briefly discuss them in relation to SN 2019yvq. Observational signatures of delayed- and double-detonation scenarios are usually subtle and are best probed by the rising light curve (e.g., Jiang et al., 2017; Stritzinger et al., 2018; Jiang et al., 2018; Polin et al., 2019a; Bulla et al., 2020) or with the structure of the Fe and electron-capture emission lines in nebular-phase spectra (e.g., Botyánszki & Kasen, 2017; Mazzali et al., 2018; Polin et al., 2019b; Wilk et al., 2020).
Finally, two explosion mechanisms unique to the DD channel are violent mergers (e.g., Pakmor et al., 2010) and the direct collision of two WDs (e.g., Rosswog et al., 2009). The direct collision can be driven by orbital perturbations of a third (e.g., Thompson, 2011; Katz & Dong, 2012; Shappee & Thompson, 2013; Antognini et al., 2014) or fourth (Pejcha et al., 2013; Fang et al., 2018) body. Additional bodies can similarly enhance the violent merger rate but multi-body systems are not necessary. Population synthesis studies suggest violent mergers can account for the majority of SNe Ia (e.g., Ruiter et al., 2009) and the Milky Way WD merger rate is consistent with the observed SNe Ia rate (e.g., Maoz et al., 2018). Conversely, the rate of direct collisions is likely too low to explain the normal SN Ia rate (e.g., Liu et al., 2016; Antognini & Thompson, 2016; Toonen et al., 2018; Hamers, 2018) but this scenario is considered a viable channel for producing a diverse set of SN Ia-like transients (e.g., Rosswog et al., 2009; van Rossum et al., 2016).
SN 2019yvq, discovered by Itagaki (2019), exhibits peculiar photometric and spectroscopic signatures for a normal SN Ia. Miller et al. (2020) provided an in-depth analysis of the early photometric and spectroscopic evolution, revealing peculiarities such as an excess of UV/optical flux before maximum light, high-velocity Si II absorption lines, and a low peak luminosity. They discuss several potential progenitor systems and explosion mechanisms but could not reach a definitive interpretation. Miller et al. (2020) state that these ambiguities could potentially be resolved once the innermost regions of the ejecta become visible (e.g., Maeda et al., 2010; Diamond et al., 2015).
Siebert et al. (2020) presented optical spectra at days after maximum as SN 2019yvq transitioned into the nebular phase. In these late-phase spectra, SN 2019yvq exhibits many spectral features common to SNe Ia such as broad emission lines of 56Ni decay products (i.e., Co and Fe). However, it also exhibited prominent [Ca II] and Ca II NIR triplet emission which is atypical for SNe Ia. This led to the conclusion that SN 2019yvq stemmed from a double-detonation explosion, with the caveat that the best-fit model has difficulty reproducing the early light curve.
In this paper we provide new data for SN 2019yvq and reassess the viability of various progenitor+explosion theories. §2 outlines our data acquisition and reduction procedures followed by analyses of the photometry and spectra in §3 and §4, respectively. §5 discusses various progenitor and explosions scenarios. Finally, in §6, we summarize our results. Throughout this work, we adopt the same host-galaxy parameters as Miller et al. (2020): , , , , and (Milky Way + host).
2 New Optical and Near-Infrared Observations
| Instrument | Telescope | MJD | Phase [d] | Exp. time [s] | Range | Airmass | |
|---|---|---|---|---|---|---|---|
| GMOS-N | Gemini-North | 58991.382 | +128 | 3600 | 1.60 | ||
| GMOS-N | Gemini-North | 59013.279 | +150 | 4800 | 1.48 | ||
| NIRES | Keck II | 59038.263 | +173 | 2400 | 1.63 |
Our new photometry includes pre-discovery non-detections and early -band photometry from the All-Sky Automated Survey for SuperNovae (ASAS-SN; Shappee et al., 2014; Kochanek et al., 2017) and post-maximum observations from the Transiting Exoplanet Survey Satellite (TESS; Ricker et al., 2015). New spectroscopic observations were acquired with the Gemini Multi-Object Spectrograph (GMOS; Hook et al., 2004) on the Gemini-North telescope and the Near-Infrared Echelle Spectrograph (NIRES, Adkins et al., 2014) on the Keck II telescope, a variation of the TripleSpec near-infrared (NIR) spectrograph (Wilson et al., 2004; Herter et al., 2008). Basic information for the spectroscopic observations are provided in Table 1 and the new photometry of SN 2019yvq is provided in Table 2.
2.1 ASAS-SN Photometry
| Source | MJD | Flux [mJy] |
| ASAS-SN | 58812.47524 | |
| ASAS-SN | 58823.48662 | |
| ASAS-SN | 58824.46758 | |
| ASAS-SN | 58842.39607 | |
New ASAS-SN -band observations were reduced using a fully-automated pipeline (Shappee et al., 2014; Kochanek et al., 2017) based on the ISIS image subtraction package (Alard & Lupton, 1998; Alard, 2000). Each photometric epoch combines three dithered 90-second image exposures subtracted from a reference image. In addition to the standard pipeline we rebuilt the reference image excluding any images with to prevent any flux contamination from the SN.
We then used the IRAF package apphot to perform aperture photometry with a 2-pixel, or approximately , radius aperture on each subtracted image, generating a differential light curve. The photometry was calibrated using the AAVSO Photometric All-Sky Survey (Henden et al., 2015). All subtractions were inspected manually and images with clouds or other systematic issues are excluded from the final light curve.
2.2 TESS Photometry
SN 2019yvq was observed by TESS (Ricker et al., 2015) during the mission’s Sector 21 and 22 operations, from Jan. 21.94 to March 17.96, 2020 UTC. These observations narrowly miss the peak of the light curve, but provide excellent high-cadence monitoring of its subsequent decline. TESS observes in a single broad-band filter with an effective wavelength of that is comparable to that of the Johnson-Cousins -band.
We reduced the TESS data using the image subtraction procedure of Vallely et al. (2019), which implements a version of the ASAS-SN pipeline optimized for use with the TESS Full-Frame Images (FFIs). As in Vallely et al. (2019) and Holoien et al. (2019), due to the large pixel scale of the TESS CCDs we chose to construct independent reference images for each sector rather than try to rotate a single reference image for use across multiple sectors. For each sector, reference images were built using the first 100 FFIs of good quality, excluding those with sky background levels or PSF widths above average for the sector as well as those associated with mission-provided data quality flags. The measured fluxes were converted into physical TESS-band fluxes using an instrumental zero point of 20.44 electrons per second in the FFIs, based on the values provided in the TESS Instrument Handbook (Vanderspek et al., 2018). The flux offset between the two sector light curves was determined by using a linear extrapolation of the last 1.5 days of Sector 21 and the first 1.5 days of Sector 22. Because the supernova had already attained maximum light prior to the first TESS observations, the reference images necessarily include flux from the transient. Precise calibration of the absolute flux is unimportant for our analysis, and for display purposes we simply normalize the TESS photometry to the Zwicky Transient Facility (ZTF; Bellm et al., 2019) -band photometry presented in Miller et al. (2020).
2.3 GMOS Observations
The data reduction process for the optical spectra, observed with GMOS on the Gemini-North telescope, generally follows the Gemini Data Reduction Cookbook111http://ast.noao.edu/sites/default/files/GMOS_Cookbook/. Each night has observations at two separate grating angles to remove gaps from the final spectra. Raw frames are bias- and overscan-subtracted, flat-fielded, and mosiaced to reconstruct the monolithic detector. lacosmic (van Dokkum, 2001) is used to detect and reject cosmic rays. Wavelength solutions are derived from arc-lamp exposures and the spectral response curves are generated from spectrophotometric standard stars for each grating tilt. After extracting each spectrum, the individual spectra from each night are combined into a single spectrum and the standard deviation of the individual spectra is used to estimate the uncertainty in the combined spectrum.
We acquired -band imaging on both nights to reliably flux-calibrate the GMOS spectra. These images are reduced using the same basic process as the spectroscopic observations including bias- and overscan-subtraction, flat-fielding, and cosmic-ray rejection. The World Coordinate System (WCS) solution provided by the Gemini iraf package is optimized with astrometry.net (Lang et al., 2010). After the astrometric calibration procedure, we use -band photometry from the Pan-STARRS survey (Chambers et al., 2016; Flewelling et al., 2016) to calibrate each image. The first epoch of our GMOS observations overlaps with the end of the ZTF light curve (Miller et al., 2020), confirming our spectrophotometry with a measured offset of mag.
2.4 NIRES Observations
In addition to the optical GMOS observations, we observed SN 2019yvq with NIRES on the Keck II telescope, which covers with a resolution of . The NIRES observations are normalized by the flat-field and A-B observation pairs are used to remove the sky background. SN 2019yvq is too faint to trace across all the echelle orders so the standard star observation is used as a trace template. Arc lamp exposures are used to derive the initial wavelength solution which is then improved with sky emission lines. The standard star observation is used to correct the spectrum for instrumental response and broadband atmospheric absorption. However, NIR photometry of SN 2019yvq could not be obtained before it set for the season, so the NIRES spectrum is presented on a relative flux scale.
3 Photometric Comparisons
3.1 Verifying the Distance to NGC 4441
Miller et al. (2020) adopted a distance of Mpc to NGC 4441 derived from the 2M++ peculiar velocity model (Carrick et al., 2015) which is inconsistent with the surface brightness fluctuation (SBF) distance of Mpc from Tonry et al. (2001). NGC 4441 is likely the merger of a spiral and an elliptical galaxy (Manthey et al., 2008) but SBF distance measurements are best for single-age stellar populations and can be skewed by spatial variations caused by dust or recent star-formation (Bothun, 1998) which may explain the difference between the kinematic and SBF distances. The SBF distance also implies a high peculiar velocity of for NGC 4441 so we attempt to verify the validity of the kinematic distance by comparing the 2M++ results to the peculiar velocity field derived by Graziani et al. (2019). Their approach involves taking measured velocities and distances from Cosmicflows-3 (Tully et al., 2016) and applying a hierarchical Bayesian model to derive the peculiar velocity field out to 222http://edd.ifa.hawaii.edu/CF3calculator/ (Kourkchi et al., 2020). For NGC 4441, the model provides an expected distance of Mpc, consistent within of the 2M++ result of Carrick et al. (2015).
In addition to constraints from peculiar velocity reconstructions, we also check if NGC 4441 belongs to a nearby galaxy group. Based on the original SBF distance from Tonry et al. (2001), Kourkchi & Tully (2017) label NGC 4441 as a field galaxy with no other group members. Nearby in position and velocity, only one galaxy (NGC 4545) has a redshift-independent distance available in Cosmicflows-3, with a measured Tully-Fisher (Tully & Fisher, 1977) distance of Mpc and a preliminary Cosmicflows-4 measurement (Tully et al., in preparation) of Mpc. New galaxy distances from Cosmicflows-4 also show several additional galaxies in the vicinity of NGC 4441 with Tully-Fisher distances ranging between 35 and 42 Mpc. The most likely scenario is that NGC 4441 is a member of a group with the nearby NGC 4521 as the brightest member. This reinforces the likelihood that the original SBF distance to NGC 4441 by Tonry et al. (2001) is erroneous. Thus, we adopt the same distance to NGC 4441 as Miller et al. (2020) for consistency, namely Mpc and mag.
3.2 Confirming the Time of First Light
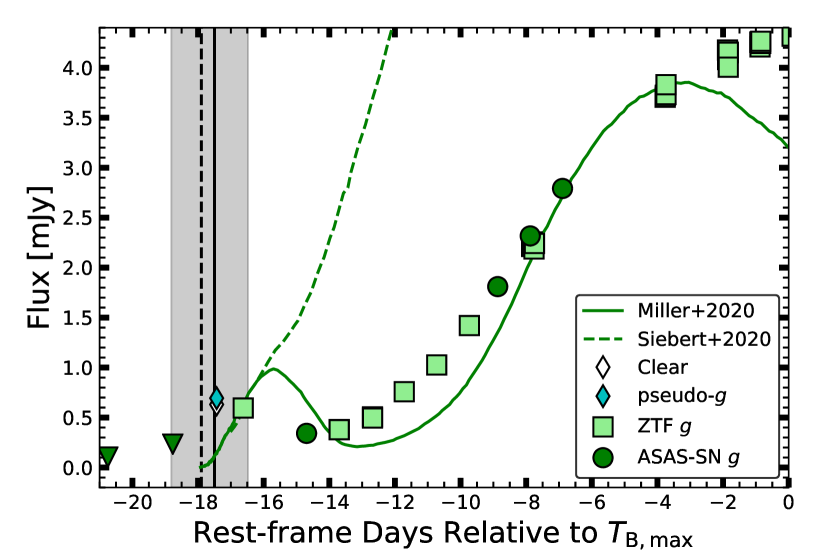
Fig. 1 shows the early -band light curve including our new photometry, the ZTF -band observations from Miller et al. (2020), and the discovery magnitude from Itagaki (2019) compared to the double-detonation light curve models from Miller et al. (2020) and Siebert et al. (2020). The photometry from Itagaki (2019) was obtained with a Clear filter which we convert to an approximate -band magnitude for easier comparison. This conversion assumes the Clear filter can be approximated as a combination of and filters, that the color evolution is negligible between the discovery observation and the first ZTF observations (i.e., a constant color of mag), and a conversion between AB and Vega systems of mag similar to comparable optical filters. As the early spectra rapidly evolve from a strong blue continuum (Miller et al., 2020), this likely slightly underestimates the true -band flux. The pseudo- magnitude is included only for instructive purposes and we caution that the associated uncertainties are likely of order .
The time-of-discovery from Itagaki (2019) coupled with the ASAS-SN non-detection days prior to discovery constrain the likely first-light time to MJD (18.8 to 17.4 days before ). This is mostly consistent with the photometric estimate from Miller et al. (2020) and confirms their decision to exclude the two early ZTF observations when fitting , although their is likely too late (i.e., too close to the Itagaki, 2019 discovery) to be physically reasonable. The last ASAS-SN non-detection requires a minimum rise of Jy/hour whereas the photometric from Miller et al. (2020) implies a rise of Jy/hour. Even if the Itagaki (2019) measurement is erroneous by over a magnitude, using mag still implies a rise of Jy/hour for the photometric from Miller et al. (2020). Thus, the spectroscopic rise time of days from Miller et al. (2020) is likely closer to the true rise time and is consistent with our new non-detections and early photometry.
3.3 Near-Peak Comparisons
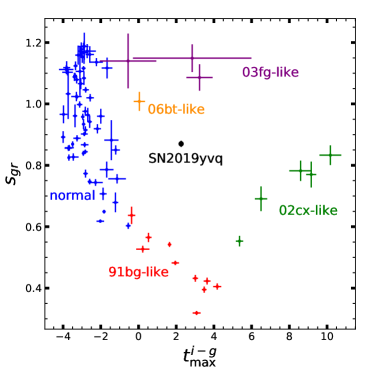
We compare SN 2019yvq to the photometric properties of other SNe Ia near maximum light in Fig. 2. SN 2019yvq is not well-fit by standard SN Ia light curve models (Miller et al., 2020) so we fit polynomials to measure the light curve parameters and employ bootstrap-resampling to estimate the associated uncertainties. Fitting quadratic polynomials to the ZTF - and -band light curves near peak we find an offset of and mag for SN 2019yvq.
Another metric for SNe Ia light curves is the stretch (Burns et al., 2014) measured from two filters and which utilizes the color evolution instead of the decline rate to standardize light curves (e.g., and ; Ashall et al., 2020). We use spline fits to resample the ZTF -band light curve (Miller et al., 2020) and associated uncertainties to the epochs of the -band light curve. Then, we fit a quadratic polynomial to the light curve and derive . These light curve parameters place SN 2019yvq in an unoccupied region of parameter space in the left panel of Fig. 2, reinforcing both the uniqueness and rarity of SN 2019yvq-like events.
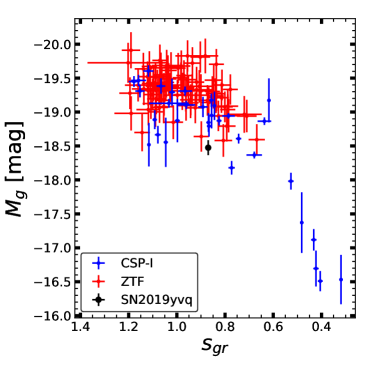
The right panel of Fig. 2 compares the -band absolute magnitude and stretch of SN 2019yvq to SNe Ia from the Carnegie Supernova Project I (CSP-I; Krisciunas et al., 2017) and the ZTF 2018 sample (Yao et al., 2019). is measured directly from the - and -band light curves for the CSP SNe Ia. The - and -band light curves for the ZTF sample (Yao et al., 2019) often do not extend to days after maximum so we fit these SNe Ia with templates in SNooPy (Burns et al., 2011) which computes a template-derived . We then convert to using the relation from Ashall et al. (2020). Due to having observations in only two filters, the ZTF objects have a significant uncertainty due to the limited constraints on the host-galaxy reddening. CSP and ZTF observe in slightly different -band filters with an offset of mag for normal SNe Ia at peak-light up to and we correct for this offset in our comparison. SN 2019yvq is fainter than all SNe Ia within and fainter than all normal SNe Ia in the ZTF 2018 sample (cf. Fig 6 from Miller et al., 2020).
3.4 Post-Maximum Comparisons
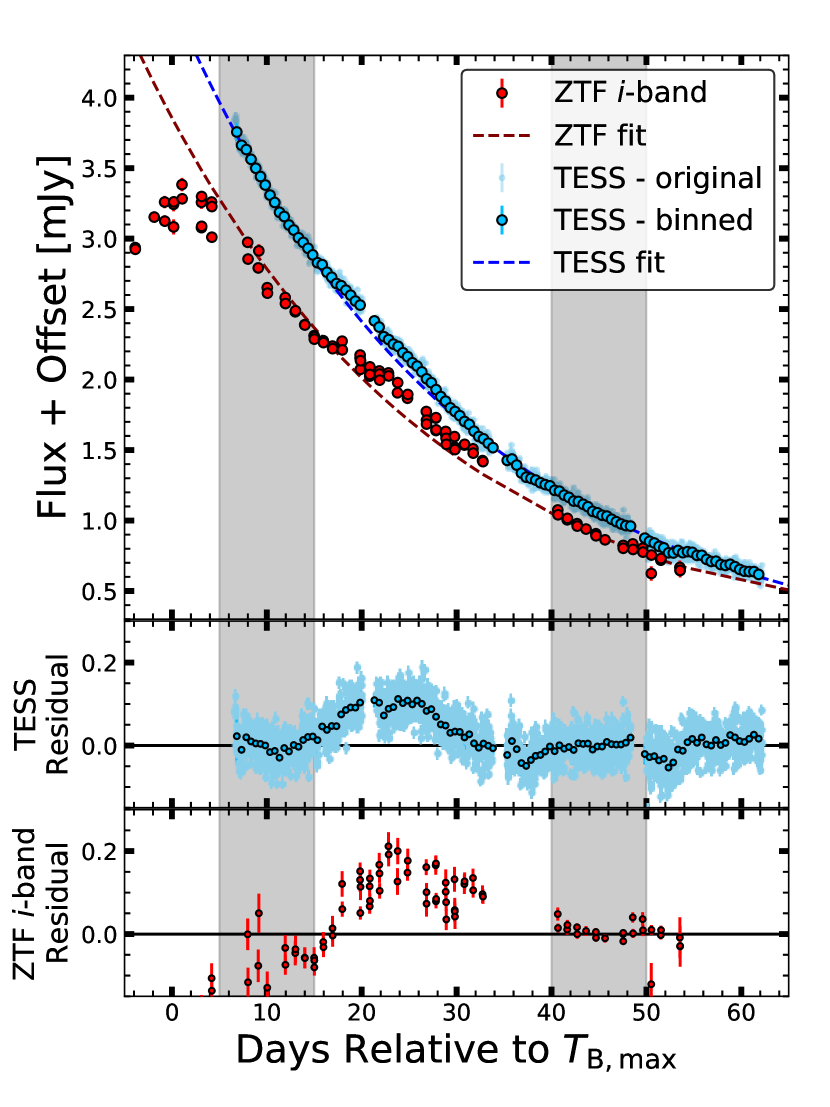
SN 2019yvq also exhibits unique properties after maximum light, in particular the lack of a prominent NIR secondary maximum (Miller et al., 2020). Fig 3 shows the post-maximum TESS and ZTF -band (Miller et al., 2020) light curves. The TESS light curve shows a slight inflection at a time that roughly coincides with the NIR secondary maximum of normal SNe Ia (e.g., Kasen, 2006; Ashall et al., 2020). Only 91bg-like, 02cx-like and “super-Ch”-mass (03fg-like) SNe Ia lack prominent secondary maxima (e.g., González-Gaitán et al., 2014; Ashall et al., 2020) but SN 2019yvq is spectroscopically inconsistent with these sub-types of SNe Ia (Miller et al., 2020). The timing and presence of the NIR secondary maxima are thought to be caused by the recombination of Fe-group elements in the ejecta (Höflich et al., 2002; Kasen, 2006; Jack et al., 2015). This can be seen in brighter SNe Ia which have stronger and later NIR secondary maxima whereas dimmer SNe Ia have no NIR secondary maximum (e.g., Taubenberger, 2017). Similar SNe Ia having intermediate luminosities but a weak/absent NIR secondary maximum include SN 2006bt (Foley et al., 2010), SN 2002es (Ganeshalingam et al., 2012), and SN 2006ot (Krisciunas et al., 2017). However, these SNe Ia have low photospheric velocities which is at odds with the high photospheric velocities observed in SN 2019yvq (Miller et al., 2020).
4 Nebular Spectroscopy
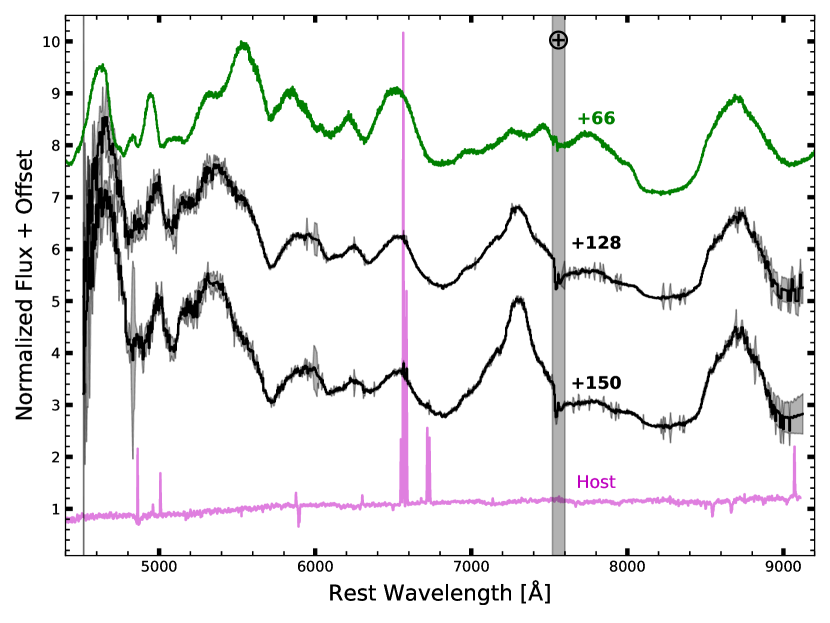
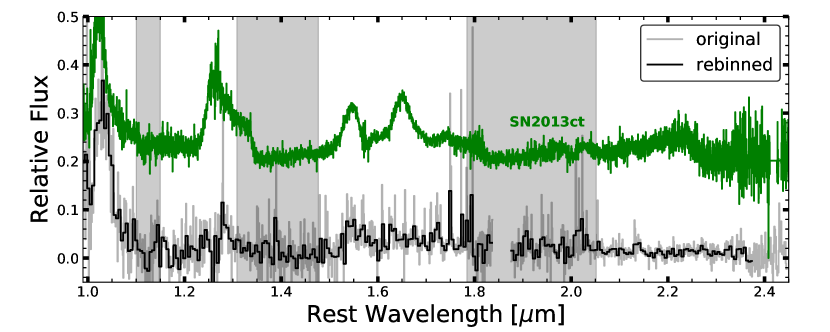
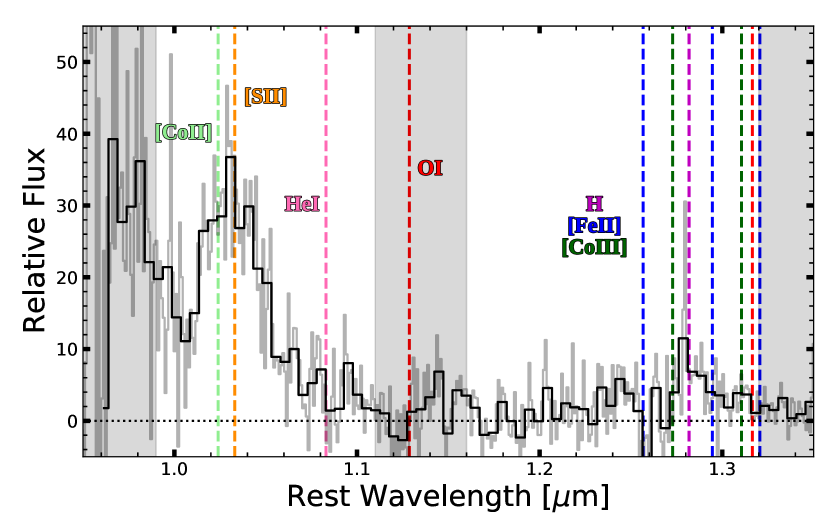
The late-phase optical spectra are shown in Fig. 4 and the nebular NIR spectrum is provided in Fig. 5. Fig. 6 shows expanded and labeled regions of the NIR spectrum uncontaminated by night sky lines. The optical spectra have many similarities to normal SNe Ia such as strong emission lines of Ni, Co, and Fe. However, there are important differences which provide unique constraints on the progenitor system and explosion mechanism of SN 2019yvq.
4.1 Non-Detections of Stripped Companion and Merger Remnant Material
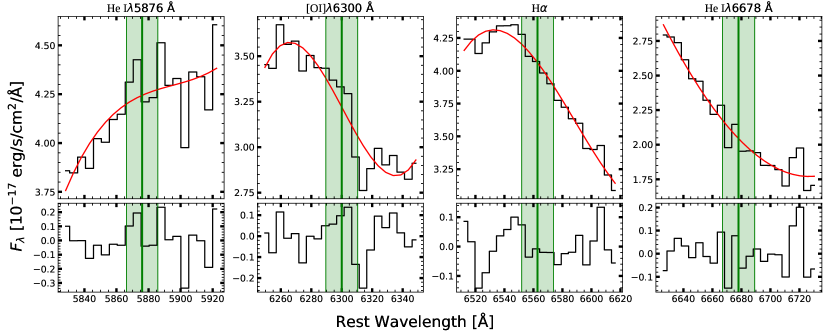
We do not detect any H or He emission lines in our optical and NIR spectra, including H, Pa, Pa, He I, and He I. Several previous studies place limits on non-detections on H/He in nebular spectra (e.g., Sand et al., 2019; Tucker et al., 2020) relying on radiative-transfer models to predict the observed emission (e.g., Mattila et al., 2005; Botyánszki et al., 2018). However, Dessart et al. (2020) model the effect of changing optical depth on the visibility of the H and He emission and find a non-negligible time-dependent impact from line-blanketing, especially on the higher-order Balmer lines. Thus, we place upper limits on the equivalent width following the procedure of Leonard (2007) (also see Leonard & Filippenko, 2001). For both epochs of optical spectra, the equivalent width limit on H emission of excludes any reasonable non-degenerate companion (Dessart et al., 2020). This precludes the need for scaling the spectra to later epochs and assuming a non-variable spectral shape to match the nebular spectra models of Botyánszki et al. (2018) as done by Siebert et al. (2020).
We also do not detect permitted or forbidden O I in the NIR (Fig. 6) or optical spectra (Fig. 7). Oxygen emission is expected for violent mergers of two C/O WDs as the secondary (lower-mass) WD is only partially burnt (Pakmor et al., 2012). SN 2010lp (Taubenberger et al., 2013) exhibited strong [O I] emission in its nebular spectra and a violent merger is the preferred explanation for this feature (Taubenberger et al., 2013; Kromer et al., 2013). We note that O emission is only expected for merging C/O WDs and may not be present in the merger of a C/O WD and a He WD which we discuss further in §5.3.
4.2 The [Ca II] Feature
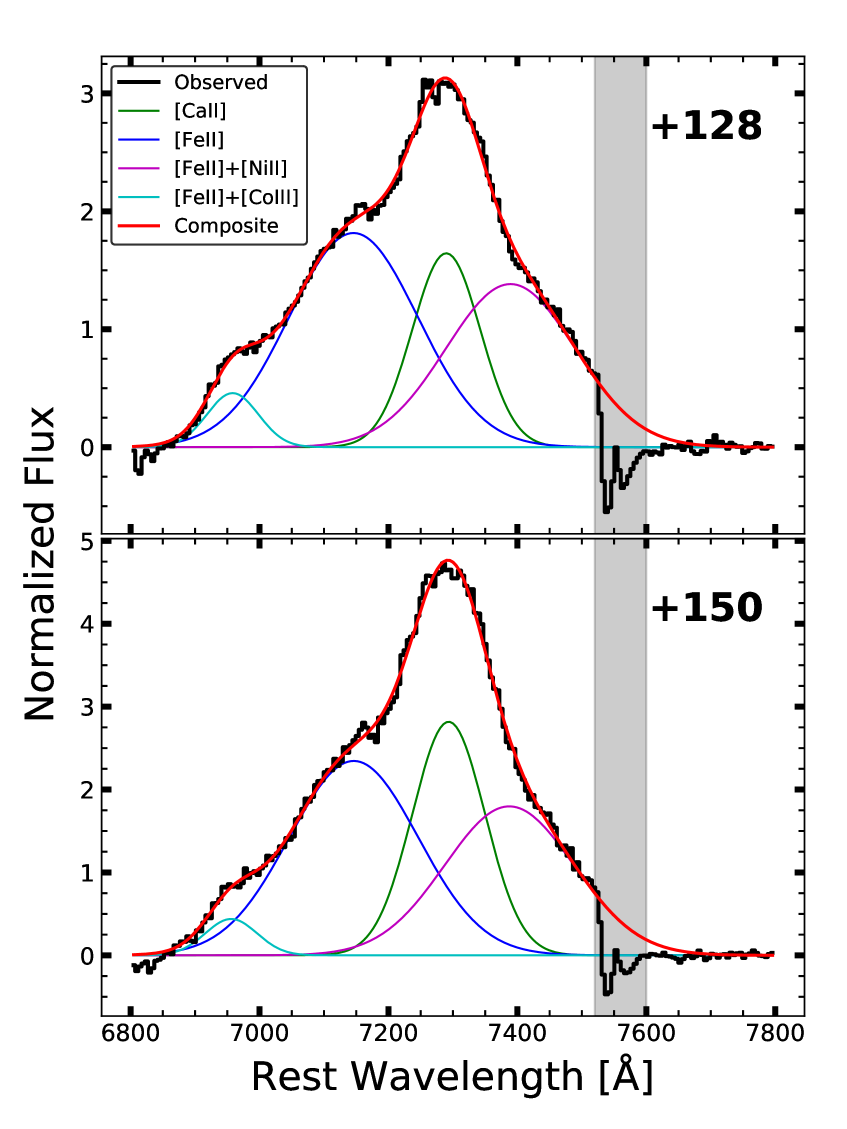
The sharp spectral feature at is almost certainly [Ca II] emission (Siebert et al., 2020) although [Co II], [Fe II], and [Ni II] contribute to its wings. We lack the spectral resolution for a full decomposition of this region as done by Siebert et al. (2020) and instead focus on the temporal evolution of the [Ca II] emission between our two spectra since this has not been examined previously. We assume the [Ca II] emission and its wings can be approximated by Gaussian profiles even though they are blends of multiple lines (e.g., Mazzali et al., 2015). We require the velocity shifts and widths to be roughly consistent between the two epochs, allowing for a slight red-shifting and widening of the profiles in the later spectrum to account for the decreasing opacity of the ejecta (e.g., Black et al., 2016).
The results are shown in Fig. 8. The absolute [Ca II] flux decreases between the two epochs but increases relative to the nearby [Ni II] and [Fe II] emission lines. Interestingly, the [Ca II] feature evolves differently than the surrounding [Fe II] + [Ni II] features and the strong emission line at , but similarly to the [Fe III] emission line at with a near-constant [Ca II]/[Fe III] flux ratio of .
4.3 Origin of the 8700 Å Emission Line
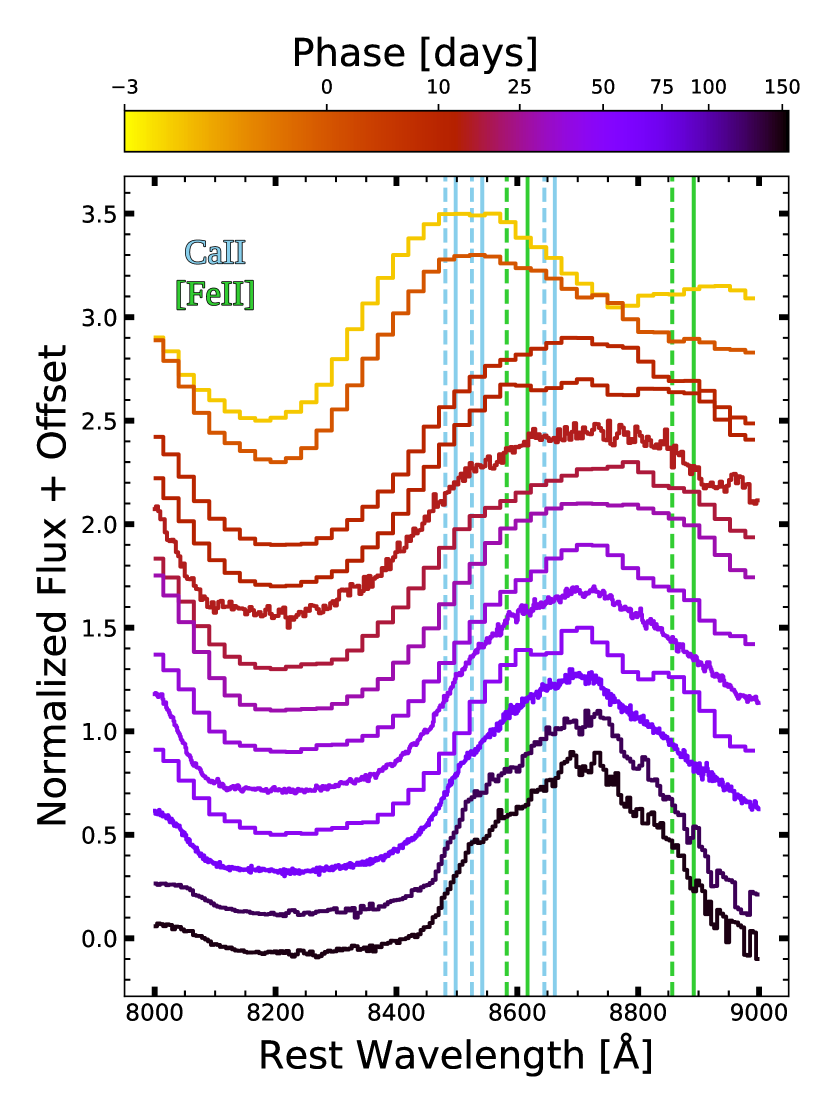
The strong emission feature at is uncommon in nebular spectra of normal SNe Ia but is usually seen in near-maximum spectra and attributed to absorption and emission of the permitted Ca II triplet (e.g., Branch et al., 2006, 2008). However, this feature usually disappears by days after maximum light (e.g., days for SN 2011fe, Pereira et al., 2013; days for SN 1991bg, Turatto et al., 1996; days for SN 1991T, Silverman et al., 2012; also see Branch et al., 2008) yet the feature is essentially unchanged between near-maximum spectra and our two spectral epochs at +128 and +150 days (Fig. 9). Siebert et al. (2020) attribute this feature to Ca II and the smooth evolution of this feature from maximum light through our observation reinforces this conclusion.
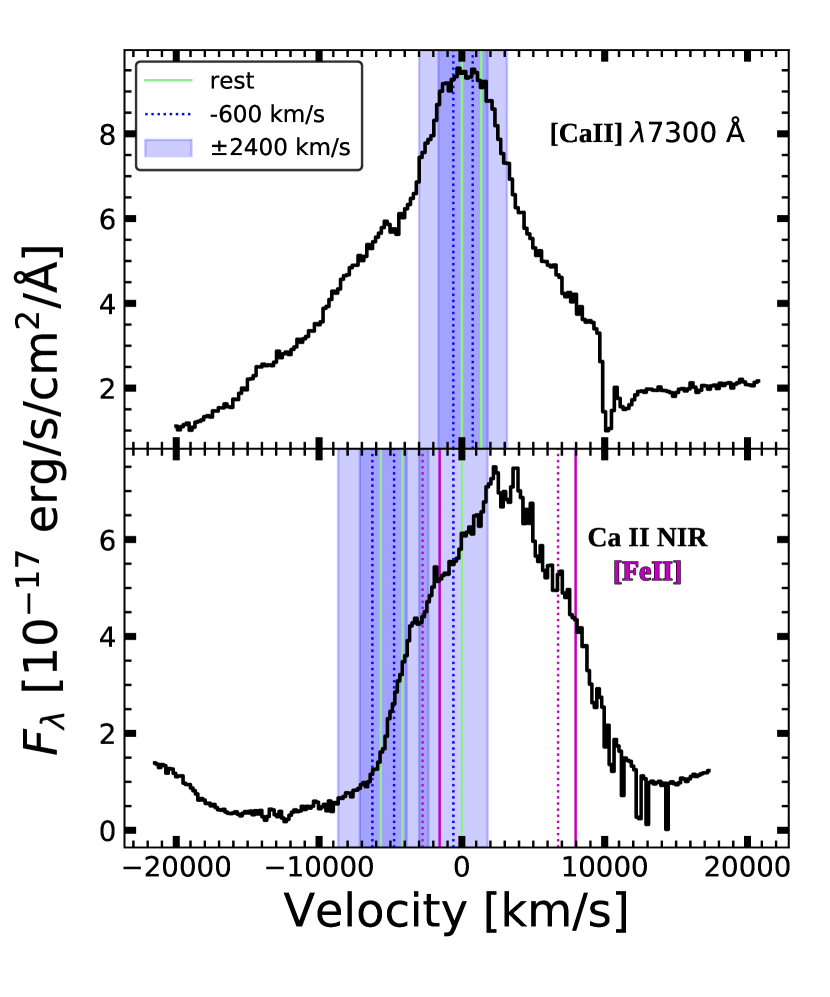
The [Ca II] and the Ca II NIR emission profiles are juxtaposed in Fig. 10. The irregularities in the Ca II NIR emission profile at the velocity shifts for [Ca II] and [Fe II] derived by Siebert et al. (2019) suggest that the Ca-emitting material producing the [Ca II] feature does contribute to the Ca II NIR feature but cannot explain the entire emission profile. There is a clear absorption trough centered at (Figs. 4 and 9), so this profile is likely a complex blend of absorption and emission. Additionally, there are other lines present at this location typical of nebular SNe Ia such as [Fe II] . However, the Fe transitions in the are roughly consistent with normal SNe Ia (Siebert et al., 2020) so this explanation for the entire feature is unlikely. Thus, it is likely that this emission is dominated by the Ca II NIR triplet but that it does not originate in the same region of the ejecta as the [Ca II] emission.
The absorption component of the Ca II NIR triplet is a common feature of SNe Ia near maximum light which transitions into a complex blend of absorption and emission features in the weeks after maximum light (e.g., Maguire et al., 2014; Silverman et al., 2015; Siebert et al., 2019). The absorption component commonly has different polarization angles and strengths than the surrounding continua (e.g., Wang et al., 2003; Leonard et al., 2005; Wang et al., 2006) suggesting an asymmetric distribution of absorbing material outside the photosphere (e.g., Cikota et al., 2019). Additionally, there is a subset of SNe Ia with high-velocity absorption features (e.g., Mazzali et al., 2005) where the high-velocity component of the Ca II NIR triplet is kinematically distinct from the photospheric component and thus likely originates in a different portion of the ejecta (e.g., Wang et al., 2003; Leonard et al., 2005; Wang et al., 2009). Considering the high Si II velocities of SN 2019yvq (Miller et al., 2020), it is possible that this persistent Ca II emission is related to high-velocity SNe Ia and would naturally explain why the kinematic parameters of the [Ca II] and Ca II NIR triplet are dissimilar. However, other SNe Ia with high-velocity absorption features lack a prominent Ca II NIR emission component at days after maximum (e.g., SN 2002dj, Pignata et al., 2008; SN 2009ig, Foley et al., 2012). Thus, it is unclear if these similarities are coincidental or if the differences are due to intrinsic variations of a common source such as line-of-sight variations, different CSM configurations, or some other aspect of the progenitor system and/or explosion mechanism.
4.4 NIR Spectrum
The nebular-phase NIRES spectrum is shown in Fig. 5 and possible emission lines are marked in Fig. 6. Consistent with our optical spectra, we do not detect the expected emission lines from any potential stripped companion material such as Pa or He I. Stripped material models predict the NIR H and He emission lines to be the strongest features in the spectrum (Maeda et al., 2014; Botyánszki et al., 2018; Dessart et al., 2020) and our non-detections severely restrict any potential stripped mass or nearby CSM.
The only major detected feature occurs at which we attribute to a blend of [Co III] and [S II]. Siebert et al. (2020) derived velocity shifts for the 56Ni decay products on order of , so this feature is likely dominated by [S II] since a [Co II] would need to be red-shifted. We lack the signal-to-noise to decompose the individual contributions. This feature is stronger than any other feature in the NIR spectrum by a factor of .
The region exhibits little flux with the exception of a feature at . This coincides with the location of Pa, but it is unlikely to stem from stripped companion material for several reasons. The host spectrum from SDSS (Fig. 4, York et al., 2000; Abolfathi et al., 2018) has strong H emission indicating star-formation which is generally accompanied by Paschen emission in NIR spectra (e.g., Hill et al., 1996). Additionally, the emission profile is narrower than expected for stripped companion material (e.g., Boehner et al., 2017; Botyánszki et al., 2018) but has a velocity width consistent with the optical host-galaxy emission lines (e.g., Cid Fernandes et al., 2005). The broader component is likely a blend of [Co III] and [Fe II], as our epoch (+173 days after maximum light) is when the NIR spectrum is transitioning from Co-dominated to Fe-dominated (e.g., Sand et al., 2016; Diamond et al., 2018).
5 Discussion
There are several possible explanations for the early UV/optical flux excess seen in SN 2019yvq, such as interaction with a nearby companion star (Kasen, 2010), mixing of 56Ni to the outer layers of the ejecta (Piro, 2012), a double-detonation driven by an accreted surface He layer (Khokhlov et al., 1993), or a violent merger of two WDs (Pakmor et al., 2010, 2012). Each scenario has predicted consequences for both near-peak and nebular-phase observables and we compare our new data to these expectations.
SN 2019yvq is unique in its near-peak photometric properties but exhibits an absolute luminosity mostly consistent with SNe Ia (Fig. 2). The nebular spectra of SN 2019yvq exhibit many of the features seen in normal SNe Ia such as broad emission lines of Co and Fe (Figs. 4 and 6). The optical and NIR spectra have no indication of H/He emission lines (Figs. 6 and 7) expected for material stripped/ablated from a nearby companion star (e.g., Botyánszki et al., 2018; Dessart et al., 2020) nor [O I] emission expected from a violent merger of two C/O WDs (e.g., Taubenberger et al., 2013; Kromer et al., 2013). However, there are two features of interest not typically seen in late-phase SNe Ia: [Ca II] emission and the persistence of the Ca II NIR triplet (Siebert et al., 2020).
The [Ca II] feature increases in strength between the nebular-phase optical spectra at +128 and +150 days after . This increase is not seen in the nearby Co or Ni emission lines but is reflected in the [Fe III] emission line with a near constant [Ca II]/[Fe III] ratio of . This could be due to the decreasing optical depth of the ejecta, which plays an important role in the strength and visibility of emission lines at these epochs (e.g., Dessart et al., 2020) and is consistent with Ca-emitting material residing near the center of the explosion.
The Ca II NIR triplet requires more modeling to completely understand. The Ca II emission has irregularities in the emission profile coinciding with the blue-shift of the [Ca II] feature measured by Siebert et al. (2020), indicating that some of this emission is powered by the same source. However, most of the Ca II triplet is inconsistent with the [Ca II] velocity profile and the discrepancy cannot be explained by the presence of [Fe II] emission lines (Fig. 10). Additionally, there seems to be no temporal evolution of the Ca II NIR triplet between our two optical epochs in either the relative emission line strengths or the overall profile shape (Fig. 9). This suggests that the Ca-rich material responsible for the higher-velocity Ca II NIR triplet is not residing at the center of the explosion and instead is associated with the fast-moving outer ejecta. This interpretation is supported by the smooth evolution of this feature over time from near-peak to our late-phase spectra. For normal SNe Ia, this feature has faded by after maximum and is not usually observed in nebular-phase SN Ia spectra (e.g., Maguire et al., 2016; Tucker et al., 2020).
With these new observations, we expand on the analysis by Miller et al. (2020) and attempt to build a self-consistent explosion model for SN 2019yvq. The violent merger of two C/O WDs and interaction with a nearby non-degenerate companion are unlikely explanations for the early UV/optical flux excess, as our spectra place high-confidence non-detections on the expected emission from such events. Below, we discuss the remaining theories: a He-driven double-detonation (§5.1), mixing of 56Ni into the outer layers of the ejecta (§5.2), and the presence of a H- and He-deficient CSM from a C/O+He WD merger (§5.3).
5.1 Double-Detonation Models
Double-detonation explosions occur when a surface shell of He ignites, driving a shock wave into the WD interior and igniting the C/O core (Livne, 1990; Livne & Glasner, 1991; Livne & Arnett, 1995). The He shell can be acquired through accretion from a nearby He star (i.e., the SD scenario; Bildsten et al., 2007) or accretion of a tidally-disrupted lower-mass WD (i.e., the DD scenario; Fink et al., 2007). The SD channel is unlikely due to our non-detection of H or He from the stripped material (§4.1) but the DD channel is still a possibility, especially since it can produce an early excess flux when the surface He ignites and creates 56Ni in the outer ejecta (Livne & Arnett, 1995). Miller et al. (2020) fit the early light curve with double-detonations models from Polin et al. (2019a) resulting in a best-fit and with the caveat that the associated model spectra predict lower photospheric velocities and more line-blanketing than are observed in the early spectra of SN 2019yvq.
Siebert et al. (2020) derive a higher total mass of with a shell mass of by comparing the observed nebular spectrum to the nebular spectra models of Polin et al. (2019b). However, this result is driven by the [Ca II]/[Fe III] ratio (see Figs. 4 and 7 from Polin et al., 2019b) and this model both severely over-predicts the peak luminosity and fails to reproduce the UV/optical “bump” in the early light curve (i.e., Fig. 1). Siebert et al. (2020) attribute the discrepancy between the photometric and spectroscopic modeling results to viewing-angle effects, as double-detonation explosions are expected to be asymmetric and have observed properties that depend on viewing angle (e.g., Fink et al., 2010; Kromer et al., 2010; Sim et al., 2012; Gronow et al., 2020).
Observing a thick He shell double-detonation directly along the pole as suggested by Siebert et al. (2020) can reconcile the lower peak luminosity with the high Si II velocity, as the He burning creates high-velocity He ashes above the expanding SN Ia ejecta, which in turn suppresses the escape of photons from the inner ejecta (Kromer et al., 2010). However, this then produces the largest effects on the early photometric and spectroscopic evolution (e.g., Kromer et al., 2010; Gronow et al., 2020) as the lower peak luminosity is driven by large amounts of line-blanketing from the He ashes (Kromer et al., 2010; Polin et al., 2019a). Additionally, the extra absorption from the He ashes leads to other observable consequences such as extending the rise time to maximum and decreasing (e.g., Fig. 8 from Kromer et al., 2010) with the effects increasing for higher He shell masses. Since SN 2019yvq has a rise time to maximum consistent with normal SNe Ia (cf. Fig. 1), a rapid decline rate (Miller et al., 2020; Siebert et al., 2020), and a lack of strong line-blanketing in the early optical spectra (Miller et al., 2020), a pole-on viewing angle seems unlikely to reconcile the discrepant double-detonation modeling results from Miller et al. (2020) and Siebert et al. (2020).
For completeness, we also briefly consider thin He shell double-detonation models. Recent simulations have shown that very low amounts of surface He can induce a detonation (e.g., Shen & Moore, 2014) although the minimum He-shell mass needed for core detonation is still unclear (Glasner et al., 2018). If very low mass He-shells can induce a core detonation, the effects on observed near-peak properties may be minor (e.g., Townsley et al., 2019) although this conclusion has not been extensively tested in the nebular phase. The main issue with a thin He shell double-detonation producing SN 2019yvq is the lack of a prominent early flux excess in these models, and thin He shell double-detonations are generally considered a potential explosion mechanism for normal SNe Ia (e.g., Shen & Moore, 2014; Townsley et al., 2019) instead of peculiar events like SN 2019yvq. Additionally, these models exhibit a strong correlation between peak magnitude (a proxy for the WD mass) and Si II velocity at maximum light (Shen et al., 2018; Polin et al., 2019a). SN 2019yvq does not conform to this relation, exhibiting very high Si II velocities (Miller et al., 2020) but having a peak magnitude fainter than predicted (i.e., observed mag versus the predicted mag from Polin et al., 2019a for ). Thus, both thin and thick He shell double-detonation models are unable to qualitatively reproduce the observed characteristics of SN 2019yvq.
An interesting avenue of speculation for double-detonation models, especially the thick He shell model preferred by Siebert et al. (2020), is the presence or absence of He I. Unless the He-shell is entirely consumed during the initial surface ignition, residual He material will remain in the system and could produce observable signatures. For example, Boyle et al. (2017) predict He I absorption near maximum light whereas Dessart & Hillier (2015) predict strong optical and NIR He I emission at after maximum. These studies employ very different treatments of the He mass distribution so comparisons are limited, but this highlights the uncertainty of both 1) the amount of He material remaining after surface ignition and 2) the effect of any surviving He on the optical and NIR spectral evolution. Helium is a notoriously difficult element to model as it requires a full non-LTE treatment (e.g., Lucy, 1991; Hachinger et al., 2012) so we consider this a promising avenue of further study. Any double-detonation model for SN 2019yvq not consuming all available surface He must account for its absence in near-maximum spectra (Miller et al., 2020), late-phase optical (this work, Siebert et al., 2020), and nebular NIR (this work) spectra.
Finally, the presence of strong [Ca II] is not a direct consequence of a double-detonation as suggested by Miller et al. (2020) (and subsequently by Siebert et al., 2020), but instead an indicator that the Ca-rich material is located in the same region of the ejecta as the 56Ni decay products (e.g., Wilk et al., 2020). [Ca II] is an extremely effective coolant due to its large oscillator strength, and therefore [Ca II] emission can be generated by any explosion model producing Ca+ in the ejecta regardless of the explosion mechanism itself. Several models in the literature produce strong [Ca II] emission in the nebular phase without requiring a double-detonation explosion (e.g., Mazzali & Hachinger, 2012; Blondin et al., 2017; Botyánszki & Kasen, 2017; Galbany et al., 2019; Wilk et al., 2020). These conditions can be created by a double-detonation explosion (e.g., Polin et al., 2019b), as the He burning naturally intersperses 56Ni with intermediate-mass elements such as Ca, but this effect is not exclusive to double-detonation explosions. Instead, the detection of Ca provides insight into the chemical distribution and bulk ionization state of the ejecta.
5.2 Ni Mixing Models
Next, we consider 56Ni mixing as a potential explanation for both the early flux excess and the presence of [Ca II] in the nebular spectra. The source of the early flux excess is the same for both 56Ni-mixing and double-detonation models: the presence of 56Ni in the outer ejecta provides excess heating and thus excess flux (Piro, 2012; Piro & Morozova, 2016). However, the outer Ni in double-detonation models is produced by the He burning process whereas 56Ni-mixing requires a transport mechanism to move the inner 56Ni material to the outer ejecta. Previously-invoked mechanisms include irregular/asymmetric deflagrations (Khokhlov et al., 1993; Hoeflich & Khokhlov, 1996), gravitationally-confined detonations (GCDs, Plewa et al., 2004; Piro, 2012), or the direct collision of two WDs (Rosswog et al., 2009; Raskin et al., 2009). Each theory has observational inconsistencies with normal SNe Ia but these problems may not apply to peculiar SNe Ia such as SN 2019yvq.
It is plausible for SN 2019yvq that the outer 56Ni clumps responsible for the early flux excess can also account for the detection of [Ca II] in the nebular phase. Outward mixing of 56Ni may boost the [Ca II] emission due to the energy from local positron deposition in the Ca-rich region and ensuing radiative cooling. However, there are no published models that address this scenario and how 56Ni mixing affects the nebular spectra. The presence of [Ca II] emission in the nebular spectra models of Wilk et al. (2020) is highly dependent on the amount of clumping in the ejecta, providing a potential avenue for 56Ni mixing to address both the early early flux excess and the nebular [Ca II] emission. Furthermore, the 56Ni mixing models of Kasen (2006) predict no secondary -band maximum for a fully-mixed composition, a low 56Ni yield, or a combination of these two. This could explain the extremely weak NIR secondary maximum in SN 2019yvq seen in Fig. 3. Miller et al. (2020) estimate a low 56Ni mass of which is lower than for normal SNe Ia (, Scalzo et al., 2014). Thus, 56Ni mixing is a promising avenue for reproducing some of the major aspects of SN 2019yvq and studies of normal SNe Ia have produced promising results for the existence of shallow 56Ni (e.g., Piro & Nakar, 2014).
However, there is a complex interplay between the necessary synthesized 56Ni to power the optical light curve (e.g., Arnett, 1982), the amount of mixing needed to reproduce the early flux excess (e.g., Piro & Morozova, 2016; Magee & Maguire, 2020), the amount of mixing needed to suppress the secondary NIR maximum (e.g., Kasen, 2006), and limitations on outer 56Ni from the lack of unusual spectroscopic features (i.e., line-blanketing effects) in the early spectroscopic evolution (Miller et al., 2020). These features are not self-consistently addressed by any model in the literature nor are there predictions for the effect on nebular spectra. New models are needed to determine if the right combination of 56Ni mixing can produce all aspects of SN 2019yvq. Additionally, 56Ni mixing is a result of the WD explosion, not a cause, and an explosion mechanism must still be invoked to actually destabilize the WD. All explosion models struggle to reconcile the low luminosity of SN 2019yvq with the high Si II velocity, a hindrance for any model invoking 56Ni to explain the peculiarities of SN 2019yvq.
5.3 H- and He-Deficient CSM
A third possibility for excess flux soon after explosion is the presence of a dense CSM surrounding the exploding WD. The near-peak spectra from Miller et al. (2020) and our nebular spectra exclude any H or He emission at high confidence, so any CSM must be H and He depleted. This can be created by a WD merger where the more massive WD tidally disrupts and accretes the lower-mass WD (Fink et al., 2007; Pakmor et al., 2010). This process is not completely efficient and some material will escape into the surrounding ISM instead of being consumed by the explosion (e.g., Shen et al., 2013). H- and He-rich rich surface layers comprise only a small fraction of the total C/O WD mass ( and ; e.g., Romero et al., 2012) so inefficient accretion/mass transfer can readily produce a H- and He-deficient CSM.
Miller et al. (2020) showed that the merger model from Kromer et al. (2016) can qualitatively reproduce the photometric evolution of SN 2019yvq, although the early flux excess itself was not modeled due to the numerous possible CSM configurations. The ejecta-CSM interaction models from Piro & Morozova (2016) can produce an early flux excess with duration days, blue colors, and peak -band luminosity of mag for a CSM radius of , similar to the early flux excess observed in SN 2019yvq. However, the primary issue with a violent merger of two C/O WDs producing SN 2019yvq is the lack of prominent O emission lines in our optical and NIR spectra. While ignition of the primary WD produces 56Ni and iron-group elements, the secondary lower-mass WD is only partially burnt (Pakmor et al., 2011). For a C/O secondary WD, this results in unburnt oxygen near the center of the ejecta which produces strong O emission lines in the nebular spectra as seen in SN 2010lp (Taubenberger et al., 2013; Kromer et al., 2013).
Interestingly, Kromer et al. (2013) and Taubenberger et al. (2013) state that [O I] is not expected for a merger between a C/O WD and a He WD, as there is no unburnt oxygen material to produce the nebular emission lines. There are no models directly assessing the result of a C/O WD merging with a He WD, but we consider two simplistic outcomes: the He WD is partially burnt or the He WD experiences no burning. If the He WD is partially burnt, by-products such as O, Ca, and Ti should be produced and reside near the center of the ejecta. This matches the detection of [Ca II], but the burning process must be highly efficient otherwise residual O or He remains in the ejecta and should produce nebular emission lines. If the He WD experiences little or zero burning, a large amount of unburnt He material remains near the center of ejecta. This is reminiscent of material stripped from a He donor star and should produce strong NIR He emission lines (e.g., Botyánszki et al., 2018) which we exclude at high confidence.
Thus, a H- and He-deficient CSM produced in the merger of two WDs is an unlikely progenitor system to explain SN 2019yvq. A merger of two C/O WDs should produce O emission which we do not detect, and a merger of a C/O WD with a He WD would likely produce strong emission lines of O and/or He. The exception is if the He WD experiences significant burning and converts all He to elements heavier than O which would produce nebular [Ca II] emission but no O or He emission lines. We consider this scenario unlikely but numerical simulations should confirms these qualitative considerations.
Finally, there is the direct collision of two WDs (e.g., Rosswog et al., 2009; Raskin et al., 2009). This scenario is thought to produce double-peaked emission lines of 56Ni decay products (e.g., Dong et al., 2015) as the ensuing velocity distribution is inherently bimodal. However, double-peaked or asymmetric emission lines can also be produced by off-center explosions (e.g., Gall et al., 2018; Vallely et al., 2020). We do not find any evidence for double-peaked or flat-topped emission profiles in our optical spectra of SN 2019yvq, but our optical spectra are not late enough in the nebular phase for a definitive conclusion. Direct collision models in the literature are scarce and important questions, such as the presence of unburnt material near the center of the ejecta, are currently unanswered. If unburnt material survives the collision and subsequent explosion, we would expect similar spectral signatures as the merger scenario (i.e., He or O emission lines). We encourage further modeling of this scenario to understand the chemical composition of the surviving material and its effect on the nebular spectra.
6 Conclusion
We have presented and analyzed new photometric and spectroscopic observations of the unusual SN Ia 2019yvq which exhibited a early blue flux excess, low peak luminosity, high Si II velocities, and the presence of [Ca II] and Ca II NIR triplet emission in the nebular spectra. Our near-explosion -band photometry places new constraints on the duration of the early flux excess and the time of first light. The TESS light curve reveals a weak secondary maximum, atypical for intermediate-luminosity SNe Ia. The NIR spectrum excludes any stripped material from a nearby non-degenerate companion due to the lack of H and He emission lines. The optical spectra confirm these non-detections and reveal prominent [Ca II] and Ca II NIR triplet emission. The [Ca II] line declines in absolute flux between our two epochs but strengthens relative to the surrounding [Ni II] and [Fe II] lines whereas the Ca II NIR triplet shows little change between the two epochs.
No explosion model in the literature addresses all of the aspects of SN 2019yvq. One commonality between the models is the difficulty reconciling the high photospheric velocities with the low peak luminosity. The early flux excess can be explained with several physical scenarios (see Miller et al., 2020 for an in-depth discussion) with our new observations strongly disfavoring interaction with a non-degenerate companion or a violent merger of two C/O WDs. However, the other potential sources for the flux excess (a double-detonation explosion, 56Ni-mixing into the outer ejecta, and a H-/He-deficient CSM) also have shortcomings or contradictions (§5).
SN 2019yvq highlights the uncertainties plaguing SN Ia explosion models. Even with the exquisite photometric and spectroscopic observations from Miller et al. (2020), Siebert et al. (2020), and this work, SN 2019yvq remains an enigma. However, these high-quality observations provide an excellent foundation for future modeling attempts as SN 2019yvq enters the growing taxonomy of WD explosions.
Acknowledgements
We thank Connor Auge and Jason Hinkle for providing useful comments on the manuscript.
M.A.T. acknowledges support from the DOE CSGF through grant DE-SC0019323. G.S.A. acknowledges support from an award from the Space Telescope Science Institute in support of program SNAP-15922. C.A. and B.J.S. are supported by NASA grant 80NSSC19K1717 and NSF grants AST-1920392 and AST-1911074. B.J.S., and C.S.K. are supported by NSF grant AST-1907570. C.S.K. is supported by NSF grant AST-181440.
We thank the Las Cumbres Observatory and its staff for its continuing support of the ASAS-SN project. ASAS-SN is supported by the Gordon and Betty Moore Foundation through grant GBMF5490 to the Ohio State University, and NSF grants AST-1515927 and AST-1908570. Development of ASAS-SN has been supported by NSF grant AST-0908816, the Mt. Cuba Astronomical Foundation, the Center for Cosmology and AstroParticle Physics at the Ohio State University, the Chinese Academy of Sciences South America Center for Astronomy (CAS- SACA), and the Villum Foundation.
This work was enabled by observations made from the Gemini North telescope, located within the Maunakea Science Reserve and adjacent to the summit of Maunakea. We are grateful for the privilege of observing the Universe from a place that is unique in both its astronomical quality and its cultural significance.
Based on observations obtained at the international Gemini Observatory, a program of NSF’s NOIRLab, which is managed by the Association of Universities for Research in Astronomy (AURA) under a cooperative agreement with the National Science Foundation. on behalf of the Gemini Observatory partnership: the National Science Foundation (United States), National Research Council (Canada), Agencia Nacional de Investigación y Desarrollo (Chile), Ministerio de Ciencia, Tecnología e Innovación (Argentina), Ministério da Ciência, Tecnologia, Inovações e Comunicações (Brazil), and Korea Astronomy and Space Science Institute (Republic of Korea).
Some of he data presented herein were obtained at the W. M. Keck Observatory, which is operated as a scientific partnership among the California Institute of Technology, the University of California and the National Aeronautics and Space Administration. The Observatory was made possible by the generous financial support of the W. M. Keck Foundation.
References
- Abolfathi et al. (2018) Abolfathi, B., Aguado, D. S., Aguilar, G., et al. 2018, ApJS, 235, 42, doi: 10.3847/1538-4365/aa9e8a
- Adkins et al. (2014) Adkins, S. M., Armandroff, T. E., Fitzgerald, M. P., et al. 2014, in Society of Photo-Optical Instrumentation Engineers (SPIE) Conference Series, Vol. 9147, Ground-based and Airborne Instrumentation for Astronomy V, 914703, doi: 10.1117/12.2056971
- Alard (2000) Alard, C. 2000, A&AS, 144, 363, doi: 10.1051/aas:2000214
- Alard & Lupton (1998) Alard, C., & Lupton, R. H. 1998, ApJ, 503, 325, doi: 10.1086/305984
- Antognini et al. (2014) Antognini, J. M., Shappee, B. J., Thompson, T. A., & Amaro-Seoane, P. 2014, MNRAS, 439, 1079, doi: 10.1093/mnras/stu039
- Antognini & Thompson (2016) Antognini, J. M. O., & Thompson, T. A. 2016, MNRAS, 456, 4219, doi: 10.1093/mnras/stv2938
- Arnett (1982) Arnett, W. D. 1982, ApJ, 253, 785, doi: 10.1086/159681
- Ashall et al. (2020) Ashall, C., Lu, J., Burns, C., et al. 2020, ApJ, 895, L3, doi: 10.3847/2041-8213/ab8e37
- Bellm et al. (2019) Bellm, E. C., Kulkarni, S. R., Graham, M. J., et al. 2019, PASP, 131, 018002, doi: 10.1088/1538-3873/aaecbe
- Bianco et al. (2011) Bianco, F. B., Howell, D. A., Sullivan, M., et al. 2011, ApJ, 741, 20, doi: 10.1088/0004-637X/741/1/20
- Bildsten et al. (2007) Bildsten, L., Shen, K. J., Weinberg, N. N., & Nelemans, G. 2007, ApJ, 662, L95, doi: 10.1086/519489
- Black et al. (2016) Black, C. S., Fesen, R. A., & Parrent, J. T. 2016, MNRAS, 462, 649, doi: 10.1093/mnras/stw1680
- Blondin et al. (2017) Blondin, S., Dessart, L., Hillier, D. J., & Khokhlov, A. M. 2017, MNRAS, 470, 157, doi: 10.1093/mnras/stw2492
- Boehner et al. (2017) Boehner, P., Plewa, T., & Langer, N. 2017, MNRAS, 465, 2060, doi: 10.1093/mnras/stw2737
- Bothun (1998) Bothun, G. 1998, in Modern cosmological observations and problems / by Greg Bothun. London; Bristol
- Botyánszki & Kasen (2017) Botyánszki, J., & Kasen, D. 2017, ApJ, 845, 176, doi: 10.3847/1538-4357/aa81d8
- Botyánszki et al. (2018) Botyánszki, J., Kasen, D., & Plewa, T. 2018, ApJ, 852, L6, doi: 10.3847/2041-8213/aaa07b
- Boyle et al. (2017) Boyle, A., Sim, S. A., Hachinger, S., & Kerzendorf, W. 2017, A&A, 599, A46, doi: 10.1051/0004-6361/201629712
- Branch et al. (2006) Branch, D., Dang, L. C., Hall, N., et al. 2006, PASP, 118, 560, doi: 10.1086/502778
- Branch et al. (2008) Branch, D., Jeffery, D. J., Parrent, J., et al. 2008, PASP, 120, 135, doi: 10.1086/527572
- Bulla et al. (2016) Bulla, M., Sim, S. A., Kromer, M., et al. 2016, MNRAS, 462, 1039, doi: 10.1093/mnras/stw1733
- Bulla et al. (2020) Bulla, M., Miller, A. A., Yao, Y., et al. 2020, arXiv e-prints, arXiv:2001.00587. https://arxiv.org/abs/2001.00587
- Burns et al. (2011) Burns, C. R., Stritzinger, M., Phillips, M. M., et al. 2011, AJ, 141, 19, doi: 10.1088/0004-6256/141/1/19
- Burns et al. (2014) —. 2014, ApJ, 789, 32, doi: 10.1088/0004-637X/789/1/32
- Carrick et al. (2015) Carrick, J., Turnbull, S. J., Lavaux, G., & Hudson, M. J. 2015, MNRAS, 450, 317, doi: 10.1093/mnras/stv547
- Chambers et al. (2016) Chambers, K. C., Magnier, E. A., Metcalfe, N., et al. 2016, arXiv e-prints, arXiv:1612.05560. https://arxiv.org/abs/1612.05560
- Chevalier (1982a) Chevalier, R. A. 1982a, ApJ, 258, 790, doi: 10.1086/160126
- Chevalier (1982b) —. 1982b, ApJ, 259, 302, doi: 10.1086/160167
- Chomiuk et al. (2012) Chomiuk, L., Soderberg, A. M., Moe, M., et al. 2012, ApJ, 750, 164, doi: 10.1088/0004-637X/750/2/164
- Chomiuk et al. (2016) Chomiuk, L., Soderberg, A. M., Chevalier, R. A., et al. 2016, ApJ, 821, 119, doi: 10.3847/0004-637X/821/2/119
- Cid Fernandes et al. (2005) Cid Fernandes, R., Mateus, A., Sodré, L., Stasińska, G., & Gomes, J. M. 2005, MNRAS, 358, 363, doi: 10.1111/j.1365-2966.2005.08752.x
- Cikota et al. (2019) Cikota, A., Patat, F., Wang, L., et al. 2019, MNRAS, 490, 578, doi: 10.1093/mnras/stz2322
- Dessart et al. (2014) Dessart, L., Blondin, S., Hillier, D. J., & Khokhlov, A. 2014, MNRAS, 441, 532, doi: 10.1093/mnras/stu598
- Dessart & Hillier (2015) Dessart, L., & Hillier, D. J. 2015, MNRAS, 447, 1370, doi: 10.1093/mnras/stu2520
- Dessart et al. (2020) Dessart, L., Leonard, D. C., & Prieto, J. L. 2020, A&A, 638, A80, doi: 10.1051/0004-6361/202037854
- Diamond et al. (2015) Diamond, T. R., Hoeflich, P., & Gerardy, C. L. 2015, ApJ, 806, 107, doi: 10.1088/0004-637X/806/1/107
- Diamond et al. (2018) Diamond, T. R., Hoeflich, P., Hsiao, E. Y., et al. 2018, ApJ, 861, 119, doi: 10.3847/1538-4357/aac434
- Dong et al. (2015) Dong, S., Katz, B., Kushnir, D., & Prieto, J. L. 2015, MNRAS, 454, L61, doi: 10.1093/mnrasl/slv129
- Fang et al. (2018) Fang, X., Thompson, T. A., & Hirata, C. M. 2018, MNRAS, 476, 4234, doi: 10.1093/mnras/sty472
- Fausnaugh et al. (2019) Fausnaugh, M. M., Vallely, P. J., Kochanek, C. S., et al. 2019, arXiv e-prints, arXiv:1904.02171. https://arxiv.org/abs/1904.02171
- Fink et al. (2007) Fink, M., Hillebrandt, W., & Röpke, F. K. 2007, A&A, 476, 1133, doi: 10.1051/0004-6361:20078438
- Fink et al. (2010) Fink, M., Röpke, F. K., Hillebrandt, W., et al. 2010, A&A, 514, A53, doi: 10.1051/0004-6361/200913892
- Flewelling et al. (2016) Flewelling, H. A., Magnier, E. A., Chambers, K. C., et al. 2016, arXiv e-prints, arXiv:1612.05243. https://arxiv.org/abs/1612.05243
- Foley et al. (2010) Foley, R. J., Narayan, G., Challis, P. J., et al. 2010, ApJ, 708, 1748, doi: 10.1088/0004-637X/708/2/1748
- Foley et al. (2012) Foley, R. J., Challis, P. J., Filippenko, A. V., et al. 2012, ApJ, 744, 38, doi: 10.1088/0004-637X/744/1/38
- Galbany et al. (2019) Galbany, L., Ashall, C., Höflich, P., et al. 2019, A&A, 630, A76, doi: 10.1051/0004-6361/201935537
- Gall et al. (2018) Gall, C., Stritzinger, M. D., Ashall, C., et al. 2018, A&A, 611, A58, doi: 10.1051/0004-6361/201730886
- Ganeshalingam et al. (2012) Ganeshalingam, M., Li, W., Filippenko, A. V., et al. 2012, ApJ, 751, 142, doi: 10.1088/0004-637X/751/2/142
- Glasner et al. (2018) Glasner, S. A., Livne, E., Steinberg, E., Yalinewich, A., & Truran, J. W. 2018, MNRAS, 476, 2238, doi: 10.1093/mnras/sty421
- González-Gaitán et al. (2014) González-Gaitán, S., Hsiao, E. Y., Pignata, G., et al. 2014, ApJ, 795, 142, doi: 10.1088/0004-637X/795/2/142
- Graziani et al. (2019) Graziani, R., Courtois, H. M., Lavaux, G., et al. 2019, MNRAS, 488, 5438, doi: 10.1093/mnras/stz078
- Gronow et al. (2020) Gronow, S., Collins, C., Ohlmann, S. T., et al. 2020, A&A, 635, A169, doi: 10.1051/0004-6361/201936494
- Hachinger et al. (2012) Hachinger, S., Mazzali, P. A., Taubenberger, S., et al. 2012, MNRAS, 422, 70, doi: 10.1111/j.1365-2966.2012.20464.x
- Hamers (2018) Hamers, A. S. 2018, MNRAS, 478, 620, doi: 10.1093/mnras/sty985
- Henden et al. (2015) Henden, A. A., Levine, S., Terrell, D., & Welch, D. L. 2015, in American Astronomical Society Meeting Abstracts, Vol. 225, American Astronomical Society Meeting Abstracts #225, 336.16
- Herter et al. (2008) Herter, T. L., Henderson, C. P., Wilson, J. C., et al. 2008, in Society of Photo-Optical Instrumentation Engineers (SPIE) Conference Series, Vol. 7014, Ground-based and Airborne Instrumentation for Astronomy II, 70140X, doi: 10.1117/12.789660
- Hill et al. (1996) Hill, G. J., Goodrich, R. W., & Depoy, D. L. 1996, ApJ, 462, 163, doi: 10.1086/177139
- Hoeflich & Khokhlov (1996) Hoeflich, P., & Khokhlov, A. 1996, ApJ, 457, 500, doi: 10.1086/176748
- Hoeflich et al. (2017) Hoeflich, P., Hsiao, E. Y., Ashall, C., et al. 2017, ApJ, 846, 58, doi: 10.3847/1538-4357/aa84b2
- Höflich et al. (2002) Höflich, P., Gerardy, C. L., Fesen, R. A., & Sakai, S. 2002, ApJ, 568, 791, doi: 10.1086/339063
- Holoien et al. (2019) Holoien, T. W. S., Vallely, P. J., Auchettl, K., et al. 2019, ApJ, 883, 111, doi: 10.3847/1538-4357/ab3c66
- Hook et al. (2004) Hook, I. M., Jørgensen, I., Allington-Smith, J. R., et al. 2004, PASP, 116, 425, doi: 10.1086/383624
- Hoyle & Fowler (1960) Hoyle, F., & Fowler, W. A. 1960, ApJ, 132, 565, doi: 10.1086/146963
- Itagaki (2019) Itagaki, K. 2019, Transient Name Server Discovery Report, 2019-2720, 1
- Iwamoto et al. (1999) Iwamoto, K., Brachwitz, F., Nomoto, K., et al. 1999, ApJS, 125, 439, doi: 10.1086/313278
- Jack et al. (2015) Jack, D., Baron, E., & Hauschildt, P. H. 2015, MNRAS, 449, 3581, doi: 10.1093/mnras/stv474
- Jha et al. (2019) Jha, S. W., Maguire, K., & Sullivan, M. 2019, Nature Astronomy, 3, 706, doi: 10.1038/s41550-019-0858-0
- Jiang et al. (2018) Jiang, J.-a., Doi, M., Maeda, K., & Shigeyama, T. 2018, ApJ, 865, 149, doi: 10.3847/1538-4357/aadb9a
- Jiang et al. (2017) Jiang, J.-A., Doi, M., Maeda, K., et al. 2017, Nature, 550, 80, doi: 10.1038/nature23908
- Kasen (2006) Kasen, D. 2006, ApJ, 649, 939, doi: 10.1086/506588
- Kasen (2010) —. 2010, ApJ, 708, 1025, doi: 10.1088/0004-637X/708/2/1025
- Katz & Dong (2012) Katz, B., & Dong, S. 2012, arXiv:astro-ph/1211.4584. https://arxiv.org/abs/1211.4584
- Khokhlov et al. (1993) Khokhlov, A., Mueller, E., & Hoeflich, P. 1993, A&A, 270, 223
- Kochanek et al. (2017) Kochanek, C. S., Shappee, B. J., Stanek, K. Z., et al. 2017, PASP, 129, 104502, doi: 10.1088/1538-3873/aa80d9
- Kourkchi et al. (2020) Kourkchi, E., Courtois, H. M., Graziani, R., et al. 2020, AJ, 159, 67, doi: 10.3847/1538-3881/ab620e
- Kourkchi & Tully (2017) Kourkchi, E., & Tully, R. B. 2017, ApJ, 843, 16, doi: 10.3847/1538-4357/aa76db
- Krisciunas et al. (2017) Krisciunas, K., Contreras, C., Burns, C. R., et al. 2017, AJ, 154, 211, doi: 10.3847/1538-3881/aa8df0
- Kromer et al. (2010) Kromer, M., Sim, S. A., Fink, M., et al. 2010, ApJ, 719, 1067, doi: 10.1088/0004-637X/719/2/1067
- Kromer et al. (2013) Kromer, M., Pakmor, R., Taubenberger, S., et al. 2013, ApJ, 778, L18, doi: 10.1088/2041-8205/778/1/L18
- Kromer et al. (2016) Kromer, M., Fremling, C., Pakmor, R., et al. 2016, MNRAS, 459, 4428, doi: 10.1093/mnras/stw962
- Lang et al. (2010) Lang, D., Hogg, D. W., Mierle, K., Blanton, M., & Roweis, S. 2010, AJ, 139, 1782, doi: 10.1088/0004-6256/139/5/1782
- Leonard (2007) Leonard, D. C. 2007, ApJ, 670, 1275, doi: 10.1086/522367
- Leonard & Filippenko (2001) Leonard, D. C., & Filippenko, A. V. 2001, PASP, 113, 920, doi: 10.1086/322151
- Leonard et al. (2005) Leonard, D. C., Li, W., Filippenko, A. V., Foley, R. J., & Chornock, R. 2005, ApJ, 632, 450, doi: 10.1086/432866
- Liu et al. (2016) Liu, D. D., Wang, B., Podsiadlowski, P., & Han, Z. 2016, MNRAS, 461, 3653, doi: 10.1093/mnras/stw1575
- Livne (1990) Livne, E. 1990, ApJ, 354, L53, doi: 10.1086/185721
- Livne & Arnett (1995) Livne, E., & Arnett, D. 1995, ApJ, 452, 62, doi: 10.1086/176279
- Livne & Glasner (1991) Livne, E., & Glasner, A. S. 1991, ApJ, 370, 272, doi: 10.1086/169813
- Lucy (1991) Lucy, L. B. 1991, ApJ, 383, 308, doi: 10.1086/170787
- Maeda et al. (2014) Maeda, K., Kutsuna, M., & Shigeyama, T. 2014, ApJ, 794, 37, doi: 10.1088/0004-637X/794/1/37
- Maeda et al. (2010) Maeda, K., Taubenberger, S., Sollerman, J., et al. 2010, ApJ, 708, 1703, doi: 10.1088/0004-637X/708/2/1703
- Magee & Maguire (2020) Magee, M. R., & Maguire, K. 2020, arXiv e-prints, arXiv:2007.02101. https://arxiv.org/abs/2007.02101
- Maguire et al. (2016) Maguire, K., Taubenberger, S., Sullivan, M., & Mazzali, P. A. 2016, MNRAS, 457, 3254, doi: 10.1093/mnras/stv2991
- Maguire et al. (2014) Maguire, K., Sullivan, M., Pan, Y. C., et al. 2014, MNRAS, 444, 3258, doi: 10.1093/mnras/stu1607
- Manthey et al. (2008) Manthey, E., Aalto, S., Hüttemeister, S., & Oosterloo, T. A. 2008, A&A, 484, 693, doi: 10.1051/0004-6361:20077584
- Maoz et al. (2018) Maoz, D., Hallakoun, N., & Badenes, C. 2018, MNRAS, 476, 2584, doi: 10.1093/mnras/sty339
- Maoz et al. (2014) Maoz, D., Mannucci, F., & Nelemans, G. 2014, ARA&A, 52, 107, doi: 10.1146/annurev-astro-082812-141031
- Margutti et al. (2014) Margutti, R., Parrent, J., Kamble, A., et al. 2014, ApJ, 790, 52, doi: 10.1088/0004-637X/790/1/52
- Margutti et al. (2012) Margutti, R., Soderberg, A. M., Chomiuk, L., et al. 2012, ApJ, 751, 134, doi: 10.1088/0004-637X/751/2/134
- Marietta et al. (2000) Marietta, E., Burrows, A., & Fryxell, B. 2000, ApJS, 128, 615, doi: 10.1086/313392
- Mattila et al. (2005) Mattila, S., Lundqvist, P., Sollerman, J., et al. 2005, A&A, 443, 649, doi: 10.1051/0004-6361:20052731
- Mazzali et al. (2018) Mazzali, P. A., Ashall, C., Pian, E., et al. 2018, MNRAS, 476, 2905, doi: 10.1093/mnras/sty434
- Mazzali & Hachinger (2012) Mazzali, P. A., & Hachinger, S. 2012, MNRAS, 424, 2926, doi: 10.1111/j.1365-2966.2012.21433.x
- Mazzali et al. (2005) Mazzali, P. A., Benetti, S., Altavilla, G., et al. 2005, ApJ, 623, L37, doi: 10.1086/429874
- Mazzali et al. (2015) Mazzali, P. A., Sullivan, M., Filippenko, A. V., et al. 2015, MNRAS, 450, 2631, doi: 10.1093/mnras/stv761
- Miller et al. (2020) Miller, A. A., Magee, M. R., Polin, A., et al. 2020, ApJ, 898, 56, doi: 10.3847/1538-4357/ab9e05
- Pakmor et al. (2011) Pakmor, R., Hachinger, S., Röpke, F. K., & Hillebrand t, W. 2011, A&A, 528, A117, doi: 10.1051/0004-6361/201015653
- Pakmor et al. (2010) Pakmor, R., Kromer, M., Röpke, F. K., et al. 2010, Nature, 463, 61, doi: 10.1038/nature08642
- Pakmor et al. (2012) Pakmor, R., Kromer, M., Taubenberger, S., et al. 2012, ApJ, 747, L10, doi: 10.1088/2041-8205/747/1/L10
- Panagia et al. (2006) Panagia, N., Van Dyk, S. D., Weiler, K. W., et al. 2006, ApJ, 646, 369, doi: 10.1086/504710
- Pejcha et al. (2013) Pejcha, O., Antognini, J. M., Shappee, B. J., & Thompson, T. A. 2013, MNRAS, 435, 943, doi: 10.1093/mnras/stt1281
- Pereira et al. (2013) Pereira, R., Thomas, R. C., Aldering, G., et al. 2013, A&A, 554, A27, doi: 10.1051/0004-6361/201221008
- Perlmutter et al. (1999) Perlmutter, S., Aldering, G., Goldhaber, G., et al. 1999, ApJ, 517, 565, doi: 10.1086/307221
- Pignata et al. (2008) Pignata, G., Benetti, S., Mazzali, P. A., et al. 2008, MNRAS, 388, 971, doi: 10.1111/j.1365-2966.2008.13434.x
- Piro (2012) Piro, A. L. 2012, ApJ, 759, 83, doi: 10.1088/0004-637X/759/2/83
- Piro & Morozova (2016) Piro, A. L., & Morozova, V. S. 2016, ApJ, 826, 96, doi: 10.3847/0004-637X/826/1/96
- Piro & Nakar (2014) Piro, A. L., & Nakar, E. 2014, ApJ, 784, 85, doi: 10.1088/0004-637X/784/1/85
- Plewa et al. (2004) Plewa, T., Calder, A. C., & Lamb, D. Q. 2004, ApJ, 612, L37, doi: 10.1086/424036
- Polin et al. (2019a) Polin, A., Nugent, P., & Kasen, D. 2019a, ApJ, 873, 84, doi: 10.3847/1538-4357/aafb6a
- Polin et al. (2019b) —. 2019b, arXiv e-prints, arXiv:1910.12434. https://arxiv.org/abs/1910.12434
- Raskin et al. (2009) Raskin, C., Timmes, F. X., Scannapieco, E., Diehl, S., & Fryer, C. 2009, MNRAS, 399, L156, doi: 10.1111/j.1745-3933.2009.00743.x
- Rebassa-Mansergas et al. (2019) Rebassa-Mansergas, A., Toonen, S., Korol, V., & Torres, S. 2019, MNRAS, 482, 3656, doi: 10.1093/mnras/sty2965
- Ricker et al. (2015) Ricker, G. R., Winn, J. N., Vanderspek, R., et al. 2015, Journal of Astronomical Telescopes, Instruments, and Systems, 1, 014003, doi: 10.1117/1.JATIS.1.1.014003
- Riess et al. (1998) Riess, A. G., Filippenko, A. V., Challis, P., et al. 1998, AJ, 116, 1009, doi: 10.1086/300499
- Romero et al. (2012) Romero, A. D., Córsico, A. H., Althaus, L. G., et al. 2012, MNRAS, 420, 1462, doi: 10.1111/j.1365-2966.2011.20134.x
- Rosswog et al. (2009) Rosswog, S., Kasen, D., Guillochon, J., & Ramirez-Ruiz, E. 2009, ApJ, 705, L128, doi: 10.1088/0004-637X/705/2/L128
- Ruiter et al. (2009) Ruiter, A. J., Belczynski, K., & Fryer, C. 2009, ApJ, 699, 2026, doi: 10.1088/0004-637X/699/2/2026
- Sand et al. (2016) Sand, D. J., Hsiao, E. Y., Banerjee, D. P. K., et al. 2016, ApJ, 822, L16, doi: 10.3847/2041-8205/822/1/L16
- Sand et al. (2019) Sand, D. J., Amaro, R. C., Moe, M., et al. 2019, ApJ, 877, L4, doi: 10.3847/2041-8213/ab1eaf
- Scalzo et al. (2014) Scalzo, R., Aldering, G., Antilogus, P., et al. 2014, MNRAS, 440, 1498, doi: 10.1093/mnras/stu350
- Shappee et al. (2013) Shappee, B. J., Stanek, K. Z., Pogge, R. W., & Garnavich, P. M. 2013, ApJ, 762, L5, doi: 10.1088/2041-8205/762/1/L5
- Shappee & Thompson (2013) Shappee, B. J., & Thompson, T. A. 2013, ApJ, 766, 64, doi: 10.1088/0004-637X/766/1/64
- Shappee et al. (2014) Shappee, B. J., Prieto, J. L., Grupe, D., et al. 2014, ApJ, 788, 48, doi: 10.1088/0004-637X/788/1/48
- Shen et al. (2013) Shen, K. J., Guillochon, J., & Foley, R. J. 2013, ApJ, 770, L35, doi: 10.1088/2041-8205/770/2/L35
- Shen et al. (2018) Shen, K. J., Kasen, D., Miles, B. J., & Townsley, D. M. 2018, ApJ, 854, 52, doi: 10.3847/1538-4357/aaa8de
- Shen & Moore (2014) Shen, K. J., & Moore, K. 2014, ApJ, 797, 46, doi: 10.1088/0004-637X/797/1/46
- Siebert et al. (2020) Siebert, M. R., Dimitriadis, G., Polin, A., & Foley, R. J. 2020, arXiv e-prints, arXiv:2007.13793. https://arxiv.org/abs/2007.13793
- Siebert et al. (2019) Siebert, M. R., Foley, R. J., Jones, D. O., et al. 2019, MNRAS, 486, 5785, doi: 10.1093/mnras/stz1209
- Silverman et al. (2015) Silverman, J. M., Vinkó, J., Marion, G. H., et al. 2015, MNRAS, 451, 1973, doi: 10.1093/mnras/stv1011
- Silverman et al. (2012) Silverman, J. M., Foley, R. J., Filippenko, A. V., et al. 2012, MNRAS, 425, 1789, doi: 10.1111/j.1365-2966.2012.21270.x
- Silverman et al. (2013) Silverman, J. M., Nugent, P. E., Gal-Yam, A., et al. 2013, ApJS, 207, 3, doi: 10.1088/0067-0049/207/1/3
- Sim et al. (2012) Sim, S. A., Fink, M., Kromer, M., et al. 2012, MNRAS, 420, 3003, doi: 10.1111/j.1365-2966.2011.20162.x
- Stritzinger et al. (2018) Stritzinger, M. D., Shappee, B. J., Piro, A. L., et al. 2018, ApJ, 864, L35, doi: 10.3847/2041-8213/aadd46
- Taubenberger (2017) Taubenberger, S. 2017, The Extremes of Thermonuclear Supernovae, ed. A. W. Alsabti & P. Murdin, 317, doi: 10.1007/978-3-319-21846-5_37
- Taubenberger et al. (2013) Taubenberger, S., Kromer, M., Pakmor, R., et al. 2013, ApJ, 775, L43, doi: 10.1088/2041-8205/775/2/L43
- Thompson (2011) Thompson, T. A. 2011, ApJ, 741, 82, doi: 10.1088/0004-637X/741/2/82
- Tonry et al. (2001) Tonry, J. L., Dressler, A., Blakeslee, J. P., et al. 2001, ApJ, 546, 681, doi: 10.1086/318301
- Toonen et al. (2018) Toonen, S., Perets, H. B., & Hamers, A. S. 2018, A&A, 610, A22, doi: 10.1051/0004-6361/201731874
- Townsley et al. (2019) Townsley, D. M., Miles, B. J., Shen, K. J., & Kasen, D. 2019, ApJ, 878, L38, doi: 10.3847/2041-8213/ab27cd
- Tucker et al. (2020) Tucker, M. A., Shappee, B. J., Vallely, P. J., et al. 2020, MNRAS, 493, 1044, doi: 10.1093/mnras/stz3390
- Tully et al. (2016) Tully, R. B., Courtois, H. M., & Sorce, J. G. 2016, AJ, 152, 50, doi: 10.3847/0004-6256/152/2/50
- Tully & Fisher (1977) Tully, R. B., & Fisher, J. R. 1977, A&A, 500, 105
- Turatto et al. (1996) Turatto, M., Benetti, S., Cappellaro, E., et al. 1996, MNRAS, 283, 1, doi: 10.1093/mnras/283.1.1
- Vallely et al. (2020) Vallely, P. J., Tucker, M. A., Shappee, B. J., et al. 2020, MNRAS, 492, 3553, doi: 10.1093/mnras/staa003
- Vallely et al. (2019) Vallely, P. J., Fausnaugh, M., Jha, S. W., et al. 2019, MNRAS, 487, 2372, doi: 10.1093/mnras/stz1445
- van Dokkum (2001) van Dokkum, P. G. 2001, PASP, 113, 1420, doi: 10.1086/323894
- van Rossum et al. (2016) van Rossum, D. R., Kashyap, R., Fisher, R., et al. 2016, ApJ, 827, 128, doi: 10.3847/0004-637X/827/2/128
- Vanderspek et al. (2018) Vanderspek, R., Doty, J., Fausnaugh, M., et al. 2018, TESS Instrument Handbook, Tech. rep., Kavli Institute for Astrophysics and Space Science, Massachusetts Institute of Technology
- Wang et al. (2006) Wang, L., Baade, D., Höflich, P., et al. 2006, ApJ, 653, 490, doi: 10.1086/508250
- Wang et al. (2003) —. 2003, ApJ, 591, 1110, doi: 10.1086/375444
- Wang et al. (2009) Wang, X., Li, W., Filippenko, A. V., et al. 2009, ApJ, 697, 380, doi: 10.1088/0004-637X/697/1/380
- Wheeler et al. (1975) Wheeler, J. C., Lecar, M., & McKee, C. F. 1975, ApJ, 200, 145, doi: 10.1086/153771
- Wilk et al. (2020) Wilk, K. D., Hillier, D. J., & Dessart, L. 2020, MNRAS, 494, 2221, doi: 10.1093/mnras/staa640
- Wilson et al. (2004) Wilson, J. C., Henderson, C. P., Herter, T. L., et al. 2004, in Society of Photo-Optical Instrumentation Engineers (SPIE) Conference Series, Vol. 5492, Ground-based Instrumentation for Astronomy, ed. A. F. M. Moorwood & M. Iye, 1295–1305, doi: 10.1117/12.550925
- Yao et al. (2019) Yao, Y., Miller, A. A., Kulkarni, S. R., et al. 2019, ApJ, 886, 152, doi: 10.3847/1538-4357/ab4cf5
- York et al. (2000) York, D. G., Adelman, J., Anderson, John E., J., et al. 2000, AJ, 120, 1579, doi: 10.1086/301513