Dynamics of heuristics selection for cooperative behavior
Abstract
Situations involving cooperative behaviour are widespread among animals and humans alike. Game theory and evolutionary dynamics have provided the theoretical and computational grounds to understand what are the mechanisms that allow for such cooperation. Studies in this area usually take into consideration different behavioural strategies and investigate how they can be fixed in the population under evolving rules. However, how those strategies emerged from basic evolutionary mechanisms continues to be not fully understood. To address this issue, here we study the emergence of cooperative strategies through a model of heuristics selection based on evolutionary algorithms. In the proposed model, agents interact with other players according to a heuristic specified by their genetic code and reproduce – at a longer time scale – proportionally to their fitness. We show that the system can evolve to cooperative regimes for low mutation rates through heuristics selection while increasing the mutation decreases the level of cooperation. Our analysis of possible strategies shows that reciprocity and punishment are the main ingredients for cooperation to emerge, being conditional cooperation the more frequent strategy. Additionally, we show that if in addition to behavioural rules, genetic relatedness is included, then kinship plays a relevant role. Our results illustrate that our evolutionary heuristics model is a generic and powerful tool to study the evolution of cooperative behaviour.
I Introduction
Game theory constitutes a powerful framework for the mathematical study of social dilemmas VonNeumann1944 ; Myerson1997 . Within this framework, the most representative and widely used game to model cooperation, the Prisoner’s Dilemma, has become a paradigm for modelling the evolution of cooperative behaviour Rapoport1965 . The Prisoner’s Dilemma mimics the worst possible scenario for cooperation in which selfishness always provides a higher individual benefit than cooperative behaviour. Initial predictions indicated the social optimum would not be reachable by rational selfish individuals if the temptation for defecting () exceeded the reward for cooperating . Nonetheless, cooperation is pervasive in human and animal societies Dugatkin1997 ; Bourke2011 ; Bowles2011 , and a vast literature has demonstrated how cooperation can thrive in the presence of an appropriate evolutionary process Nowak1992 ; Nowak1992TfT ; Nowak2006 ; Axelrod1987 ; Lindgren1991 ; SANTOS2006 ; Roca2009 ; Colman2012 ; Sigmund2010 . The possible situations where cooperation might flourish are endless, and we are just beginning to uncover the ingredients behind the complexity observed in real systems Henrich2005 ; Foster2005 . Consequently, theoretical studies usually focus on simplifications, such as individuals behaving according to fixed pure strategies Nowak1992 ; SANTOS2006 or some arbitrary set of them Traulsen2009 ; Su2016 . Yet, the reasoning and motivations of humans are more sophisticated and complex than pure strategies and decisions are usually taken factoring in many ingredients, weighting them differently Tversky1974 . In other words, generally speaking, the selection of strategies takes place in complex systems wherein imprecise behaviour and the environment are inputs of each other in a perpetual feedback loop Gintis2011 .
In this line, behavioural economics has shown that humans respond in unexpected ways Aumann2019a ; Thaler2018 and often seem to possess hardwired heuristics while acting in experimental situations Knafo2008 ; Bateson2006 . Experiments have also shown that humans automatic responses are modelled by experiences from daily-life, building heuristics or intuitions which tend to favour cooperation Rand2012 ; Rand2014a . Therefore, it is plausible that cooperative societies are sustained by existent heuristics, maintained by norms Boyd2018 ; Richerson2016 or biological factors Hamilton1964 ; Foster2005 ; Knafo2008 , that have resulted from a selection dynamics. It is thus imperative to understand how such possible heuristics have evolved, which will allow explaining the ingrained mechanisms behind the behaviour observed in living beings.
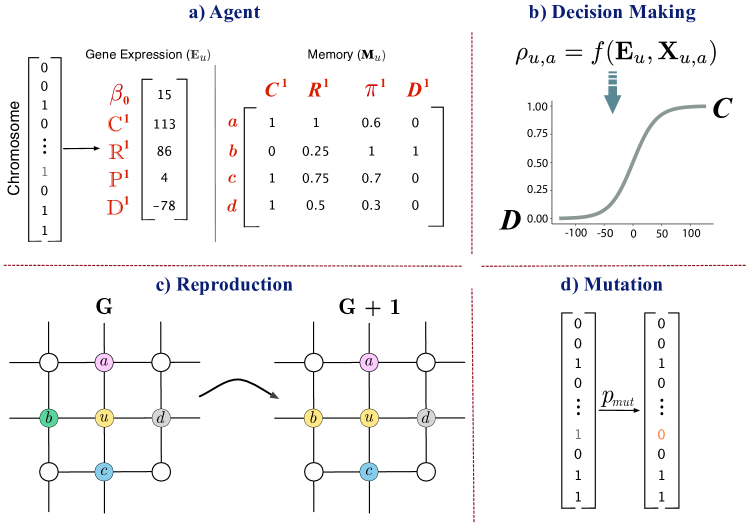
In this paper, we investigate the evolution of cooperative strategies through an agent-based model of heuristics selection inspired by evolutionary algorithms Eiben2003 . The ultimate goal is to obtain a description of the evolutionary process that could lead to different strategies. Explicitly, we consider agents composed of a chromosome and memory to store information of other players’ previous actions (Fig. 1a). Their actions are responses, according to what is coded in their genes, to other players’ history. The strategy space is given, thus, by all the possible genes’ combinations. This does not mean that we model behaviours defined by real genomes: decision making, especially in humans, has entangled layers of complexity, and such an approach would be misguided. Rather, we use chromosomes as a tool to model heuristics formed through cultural or biological evolution Richerson2005 ; Gintis2011 .
In our framework, the fitness of agents corresponds to the payoff obtained in iterated games, and it determines the agent’s reproduction rates. Offspring will inherit its parents’ chromosomes while being susceptible to mutation. Note that our approach differs from elementary evolutionary algorithms: they optimize functions in a constant fitness landscape, but in evolutionary games changes in the population imply changes in the fitness landscape Nowak2004b , which can be easily seen in any form of the rock-paper-scissors game Sigmund2010 .
The use of evolutionary algorithms to explore the adaptation of agents is not new Lindgren1991 ; Axelrod1987 ; Miller1996 , and previous works have studied the evolution of automata-like strategies, though aiming at answering specific situations VanVeelen2012 ; Binmore1992 . In these studies, the equivalent of a chromosome is a tool to encode an extensive set of memory-based strategies used to understand when cooperation may thrive. Unfortunately, these types of strategies are hardly realistic and do not correspond to the optimal model for understanding the mechanisms behind human or animal responses. A model of heuristics should resemble more closely automatic responses based on intuition and past experiences Tversky1974 , namely, by considering that intuitive responses are no more than stochastic processes which take as inputs the variables observed by the individual.
Here, we develop a modelling approach in which agents can evaluate different variables at the same time, thus resembling real situations wherein different factors interact and affect actions. Agents decisions are determined by an activation function taking as input their chromosome and the information to which they have access. Given their theoretical and practical importance, we focus on the evolution of cooperation in social dilemmas. For this case, therefore, we selected a set of variables based on the history of the players with whom they are playing. Nonetheless, our modelling framework is generic, and any arbitrary set of variables can be added or removed according to the question of interest. Our results show that the specified heuristics can evolve to cooperative equilibria for low mutation rates. An analysis of agents chromosome reveals that cooperation endures by reciprocity, indicating that the evolution drives heuristics to reproduce a fundamental mechanism underlying cooperation in nature, especially in humans West2007a ; Clutton-Brock2009a . In this case, emerging strategies of conditional cooperators dominate, permitting cooperation to prosper. Finally, we provide an extension wherein agents can evaluate their genetic relatedness with others. The population in this scenario evolves to similar equilibria. However, the agents’ chromosomes differ significantly from the first model. Kin identification becomes the main mechanism of cooperative heuristics. Nonetheless, agents still need to have a memory of their past actions for cooperation to endure.
Undoubtedly, varied environmental or perception variables affect the resulting behaviour in humans and other animals. Unfortunately, it is not straightforward to capture which variables guided evolution to the emerged behaviour in each particular scenario. In this line, our proposal provides one generic approach for the modelling of such processes. In particular, the model here presented also contribute some insightful results with the current specifications. Namely, we observe that cooperation can spread spontaneously when memory is available, and that mutation is essential to ensure this outcome. Moreover, although the same behaviour might be observed in distinct populations, the underlying causes might be significantly different, as we observe with our kin and non-kin models. These insights suggest that our method can be a useful tool to uncover the ultimate causes behind the evolution of pro-social behaviour.
II The model
II.1 Population Dynamics
We consider a virtual environment inhabited by haploid agents in a zero population growth condition, each one of them () containing a chromosome defining the heuristic which will guide its decision. Each agent interacts with each other through links defined by a static contact structure, in which is the set of edges connecting the two pairs of agents. In real systems, a generation embodies repeated interactions between individuals, and it is known that fast selection fluctuations can suppress cooperation even in the cases in which it is the only rational choice Roca2009 . In our model, in each generation, there is a finite number of time steps and, therefore, dyadic interactions take place, i.e., one for each edge at each time step. Thus, at each time step , connected agents and interact in a game and obtain the payoffs and , respectively.
The generation reaches its end after the time steps, and each agent will have accumulated a total payoff of , corresponding to its fitness in a strong selection pressure process Traulsen2007 ; Roca2009 . Agents reproduce by a localized death-birth process Lindgren1994 : at the end of each generation, each node will be replaced by a node in the set , which is composed by the neighbourhood of () and itself (Fig. 1c). Node is chosen probabilistically according to the fitness of nodes in . Thus, on one hand, the nodes which accumulate more payoff are more likely to be chosen, on the other hand, most adapted agents can reproduce up to sites of distance one. Finally, some fluctuations might affect offspring. Specifically, there is a probability of a newborn having a bit flipped in their chromosome (Fig. 1d).
II.2 Game
We are interested in the evolution of cooperation in a population of agents facing a social dilemma. Strictly speaking, we want to check if cooperative heuristics are the most adapted in conditions wherein pure strategies equilibria would be of full defection. We consider that at each interaction, agents play a round of a Prisoners’ Dilemma (PD) with their neighbours. The PD game is a 2x2 game in which only two actions are available to the players, either cooperate or defect. If two players cooperate, they both get a reward , if one cooperates and the other defects, the cooperator earns and the defector gets a payoff (the temptation to defect). Finally, if both defect, both of them obtain . The PD occurs when the elements of the payoff matrix are such that , which implies that a rational player should defect because, whatever your opponent does, the best (in terms of having larger payoff) is to defect. Henceforth, we consider that the values of each entry are a normalized version of Axelrod’s tournament Axelrod1981 values. Namely: . As mentioned before, for these values, the prediction is that under a replicator dynamics, the system ends up in full defection Roca2009 . We also note that small changes in this parametrization would not affect our results, as they are robust for a broad range of the temptation () parameter (see Section I of the Supplementary Material).
II.3 Agents
Agents are hardwired, and their heuristics do not change in the course of one generation, which corresponds to their lifetime. Their heuristics are determined by their chromosomes and constitute a stochastic way to evaluate the variables stored in their memory and make a decision on whether to cooperate or not. Agents’ memory stores the variables from previous interactions, and we assume their working memory is limited Milinski1998 . Hence, agents can only store a finite set of variables from the previous rounds. Specifically, an agent with the set of neighbours , has stored in its memory variables for all and for all . Therefore, is a matrix wherein each row contains the values stored for one neighbour, as shown in Fig. 1a.
| Variable | Gene | Description |
|---|---|---|
| Constant response. | ||
| Direct Reciprocity: 1 if cooperated with in round , 0 otherwise. | ||
| Indirect Reciprocity: Fraction of times agent cooperates in round with players other than . 111Typically indirect reciprocity is defined by individuals playing a one-shot game in a large well-mixed population Nowak2005 . Nonetheless, here does not consider the actions of with respect to , which should correspond to an analogous effect. | ||
| Payoff obtained by agent in round . | ||
| Punishment: 0 if cooperated with in round , 1 otherwise. |
.
The heuristics evaluate each stored variable according to a specific gene in the chromosome. Therefore, the expression of each gene is a weight given to a variable containing some information influencing agents’ decision making. The vector carries the responses of an agent , i.e., its expressed genes values. They are given by a two complement representation of the gene bits, therefore, they are integers from -128 to 127222Hence, when a mutation occurs in a gene, from its expressed value it can be added/subtracted a random power of 2, or have its sign and value changed.. The vector contains the responses to the variables plus a constant response (). Table 1 shows the set of variables stored and their corresponding genes. They are a basic set of external characteristics that an elementary agent can observe. Thus, they constitute a reasonable set of variables to be taken into account by a somewhat minimal heuristic. Finally, whether or not an agent will cooperate is determined by the sigmoid function specified by
| (1) |
where corresponds to the probability of agent cooperating with agent . corresponds to a vector composed by the number 1 in the first position, followed by the memory variables as specified in Table 1. (henceforth set to 0.05) provides the steepness of the curve, and it is chosen in such a way that if the dot product of both vectors is greater (resp. lesser) than 100, the probability should be approximately 1 (resp. 0), as illustrated by Fig. 1b.
III Results
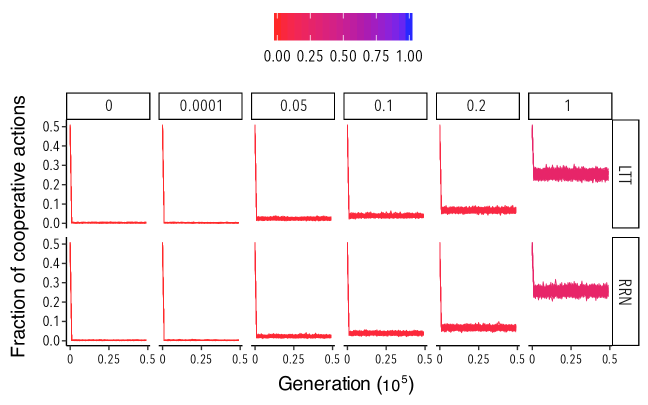
We ran simulations for populations of 1024 agents connected on a lattice (LTT) with a von Neumann neighbourhood and on Random Regular Networks (RRN) with the same nodes’ degree (). We evolved the model for generations, each with 100 rounds, for different values of the parameter. Results for memory between 0 and 5 are shown in Fig. 2. When , the agents’ chromosome is composed of only the constant response () and strategies are reducible to mixed strategies. In this case, when no mutation is available the system quickly goes to full defection (see Supplementary Fig. S5), as expected, and mutation increases the possibility of adding cooperative strategies by drift. Conversely, when agents have access to memory, cooperation is predominant in the regime of low mutation. Furthermore, cooperation is larger and more resilient to higher mutation when agents have access to a bigger memory. With more memory, agents should be able to construct more complex heuristics which seem to favour cooperation.
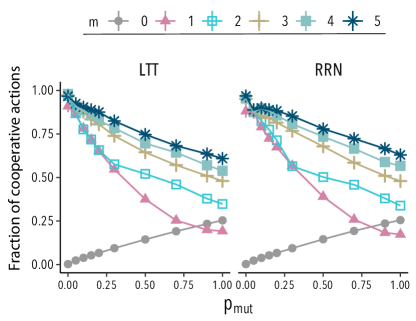
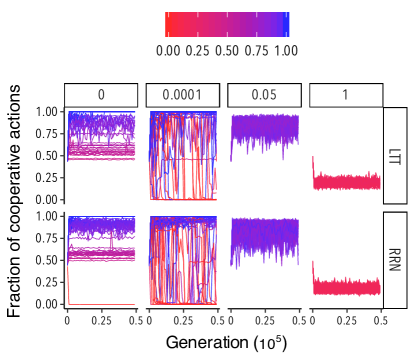
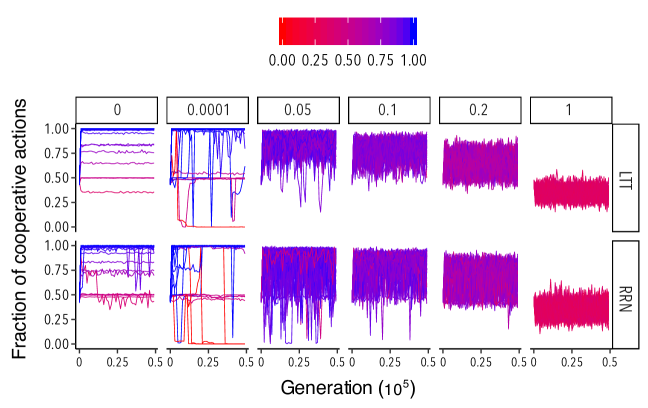
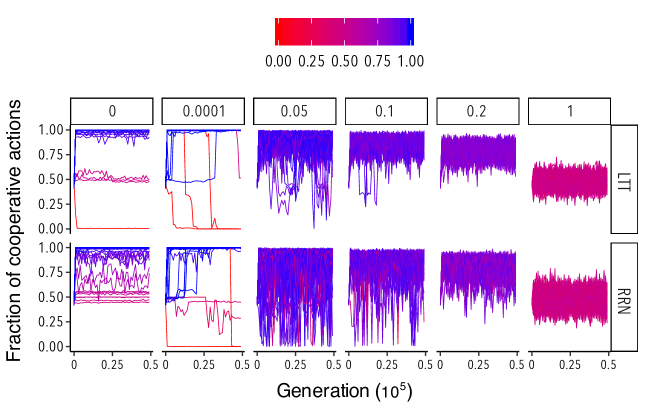
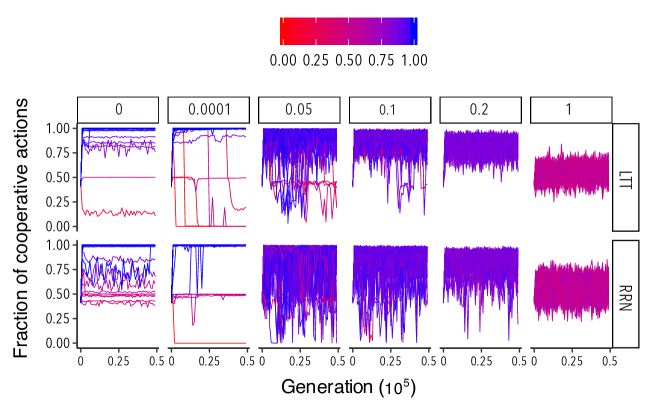
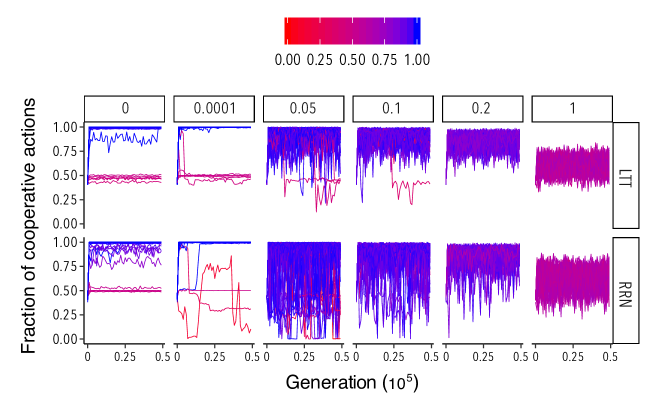
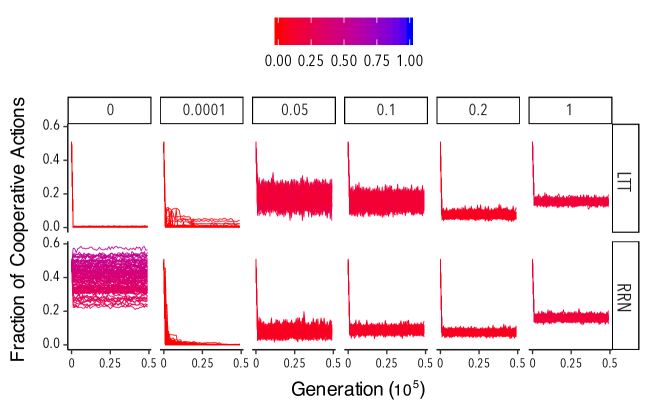
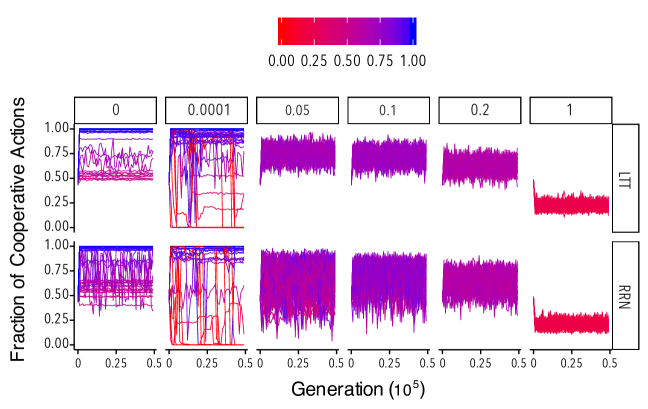
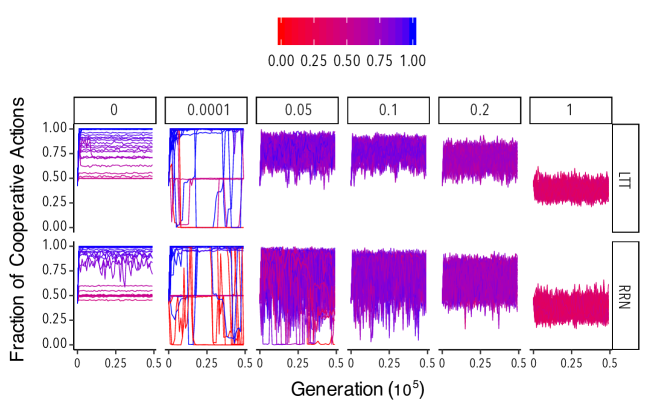
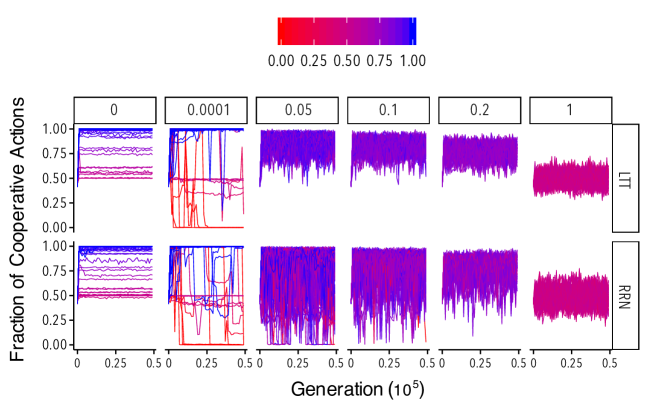
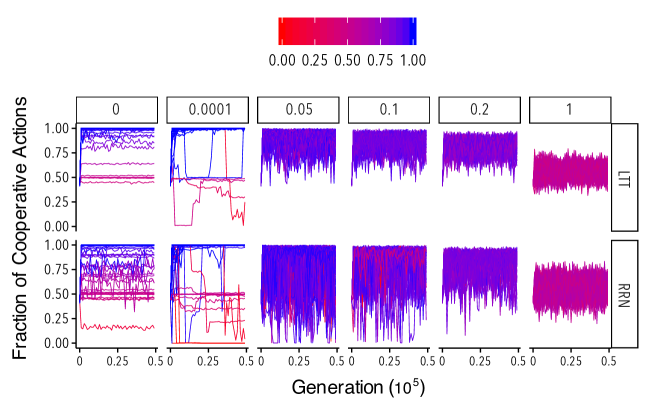
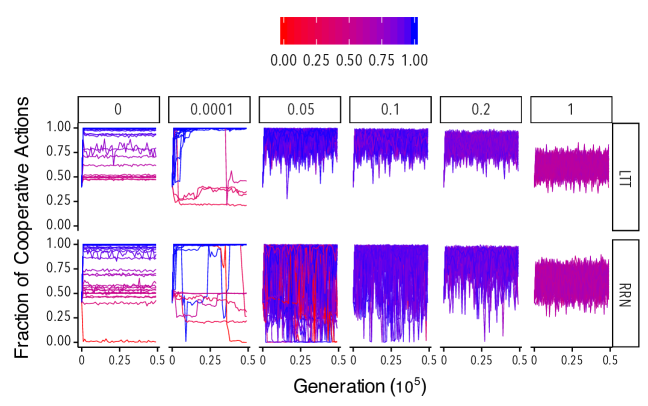
Figure 3 shows time evolution curves of individual realizations for (results for other values of the memory are reported in Section IV of the Supplementary Material). When , the final fraction of cooperative fraction is highly dependent on the initial conditions, reaching a multitude of equilibria, some being fully cooperative and others showing a rather small level of cooperation, specially in the RRN network. In the regime of small mutation rates, fluctuations increase significantly. However, for some small values of the mutation rate, all realizations converge to highly cooperative equilibria, as can be seen when . Note, additionally, that as the probability of mutation increases, the fraction of cooperative actions decreases. For the limiting value , every new player is born with a mutation and the system evolves into a negligible average level of cooperation. Interestingly, this is a demonstration that a small noise can foster cooperation in the process of evolution. With more mutation, it gets harder for cooperative strategies to prevail and defection tends to increase, however, a sufficiently small mutation probability will guarantee that the system evolves to a cooperative equilibrium.
III.1 Heuristics and Strategies
In this section, we focus on the composition of the populations in the different regimes. It is not straightforward to evaluate how genes and variables interact, hence, it is hard to determine if agents are going to cooperate or not in a specific situation. A first step is to investigate what are the gene values in cooperative and non-cooperative equilibria. Fig. 4 show the distributions of genes for two mutation values: and , wherein evolution leads to mostly cooperation and to mostly defection, respectively. Simulations in both LTT and RRN networks yielded similar distributions, indicating the presence of a common evolutionary pattern.
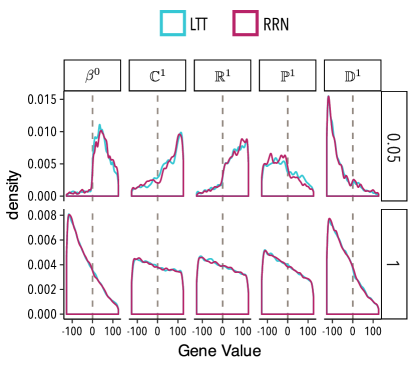
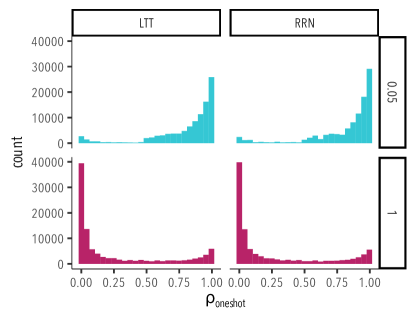
When the majority of the population cooperates (), , , and have a clear right-modality with most of these values being higher than 0. Conversely, is left-modal with a clear peak at extreme negative values, while shows a softer trend towards negative values. This implies that when cooperation thrives, agents have a baseline cooperative response and tend to reciprocate cooperation both directly and indirectly. On the other hand, the agents punish defectors rigorously and have a mild negative response to other agents’ payoff, probably as a means to punish defectors, as only defectors can attain the highest payoffs. Interestingly, the distributions of indicate that the emerging strategies are willing to cooperate even in a one-shot game (see Supplementary Fig. S16) with an unknown player, albeit this is not the expected behaviour for . In the other extreme, for , defection prevails, and genes values indicate the underpinnings of this trend. All distributions are right-skewed, with and having a noticeable peak at the lowest possible values. Thus, when mutations are too frequent agents are much more likely to exploit and punish, leading defection to be the default strategy. Too much drift will make it impossible for cooperative heuristics to be selected, and they will vanish in the population.
These last results provide a picture of the genotype space. However, there is still the need to identify which strategies have emerged. When studying evolutionary games, it is always challenging to bridge the gap between the genotype and phenotype spaces Nowak2004b . In our model, the profile of agents’ actions would correspond to observable phenotypes, yet it is not straightforward to specify a method for heuristics classification. An unsupervised procedure would fall into the problem of how to identify the groups encountered, i.e., how to determine to which known strategies they correspond. Therefore, here we adopted an approach that consisted of classifying agents by looking at what would be their responses to the most basic strategies: a pure defector and a pure cooperator. Namely, we looked at whether agents were likely to cooperate or defect with agents having a history corresponding to each of the two pure strategies. For instance, a full defector would always have defected with (, ), with its other neighbours (), and would have an expected payoff () corresponding to these actions.
| Pure Cooperator | Pure Defector | |
|---|---|---|
| FC | ||
| FD | ||
| CC | ||
| GCC | - | |
| CD | - | |
| Bully | ||
| Random | - | - |
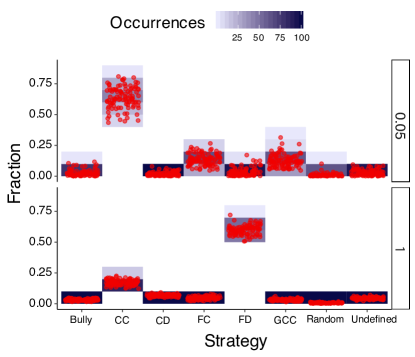
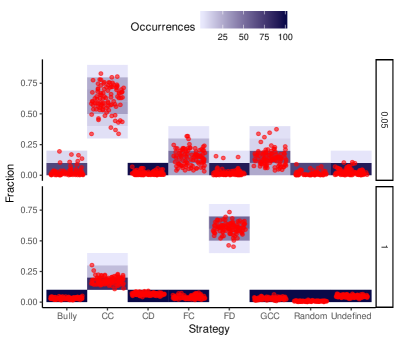
The proposed classification is shown in Table 2 (see the details in Section II of the SI). We considered strategies analogous to known ones, namely: Full Cooperator (FC), cooperates with both pure cooperators and pure defectors; Full Defector (FC), defects with both; Conditional Cooperator(CC), reciprocates cooperation and defects otherwise; Generous Conditional Cooperator(GCC), reciprocates cooperation and can cooperate randomly with defectors; Conditional Defector(CD), cooperates randomly with cooperators and always defects with defectors; Bully, defects with cooperators, but cooperates with defectors; Random, behave randomly with both pure strategies. We labelled agents that could not be classified by this process as Undefined.
In Fig. 5, we show the frequencies of each strategy from simulations of the heuristics selection dynamics on a lattice (a similar pattern is obtained for RRN networks, see the SI, Fig. S3). When the mutation is low (), most of the agents tend to be cooperators or conditional cooperators (mean fraction is 0.9 with a standard deviation of 0.07): CC constitutes most of the strategies, followed by a small fraction of GCC and FC players. In contrast, when mutation is high (), FD and CD constitute the majority (mean=0.66, sd=0.038) of agents. However, a minority of CC players can persist (mean=0.17, sd=0.022), which explains the existence of a small fraction of cooperative actions even in this regime.
IV Exploring kin discrimination: a first extension.
It is known that cooperative behaviour can emerge and be sustained by factors that do not depend on players history of decisions. Namely, genetic relatedness or kinship plays a key role in the evolution of cooperation in nature Hamilton1964 ; Queller1992 ; West2007a ; Clutton-Brock2009a . Kin selection is pervasive Dugatkin1997 ; Bourke2011 , despite controversies over its role in particular phenomena Nowak2010a ; Nowak2017 ; Abbot2011 ; Birch2017 ; Birch2019 ; VanVeelen2018 . Indeed, these disagreements indicate the need to investigate the role played by genetic relatedness in each specific scenario Birch2017 . Therefore, to address this question, we take such mechanisms into account in the evolutionary dynamics of heuristics selection. Namely, we have extended the previous analysis and considered that agents could evaluate an additional variable that accounts whom they are interacting with, specifically, genetic proximity, which is one main mechanism ensuring interactions occur among related individuals Grafen1990 .
We added to the agents’ chromosome a gene to account for genetic relatedness with the interacting agent. Operationally, we consider that this kinship relation is given by the Jaccard index of pairs of agents’ chromosomes. Note that we are not specifying a method for kin selection, but allowing the heuristics to take into consideration agents similarity when deciding to cooperate or not. Enabling, thus, an estimation of the relevance of genetic relatedness by evaluating the weight organically given to the heuristics’ new gene.
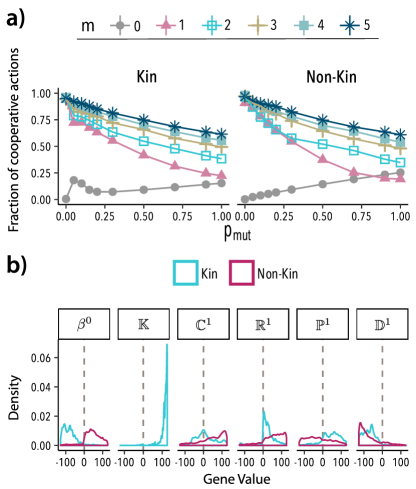
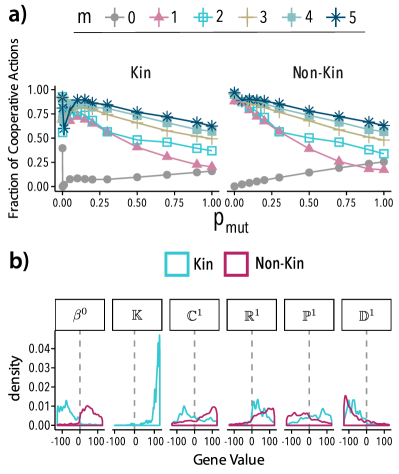
Results of simulations on a lattice are presented in Figure 6. Figure 6A shows the fraction of cooperation at the steady-state both for our previous model (Non-Kin) and for the extended model (Kin). The evolution leads to similar scenarios in both cases, indicating that the presence of the () gene did not enhance nor undermine cooperation significantly, though there is one modest exception. For heuristics without memory () and low mutation, there is a modest increase in the level of cooperation.
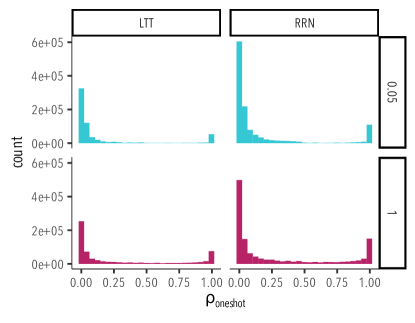
Despite the negligible differences in outcomes, there is a substantial effect on agents’ chromosomes. Fig. 6B shows that including the possibility to weigh gene similarity changes the values of all other genes significantly. For , cooperation is strongly determined by the () gene, and genes for direct reciprocity and constant response becomes negative or neutral. The latter implies that most agents will not cooperate in one-shot interactions with unrelated individuals, as shown in Supplementary Fig. S17, demonstrating a significant difference from the agents without the gene. There still is a mostly positive response for indirect reciprocity and a negative for punishment, while the weight given to participants payoff inverts. This result points to a compelling message: when heuristics can evaluate genetic relatedness, the ones that do that will have a higher reproduction, therefore resulting in more adapted heuristics. Nonetheless, information from past interactions is still required, with punishment and reciprocity playing a role.
V Conclusions
Natural selection has shaped the evolution of all sort of life forms. Advantageous strategies endure while others dwindle in a never-ending process of adaptation. Fundamental questions regarding the emergence of cooperative behaviour in social dilemmas have to be studied in the light of evolutionary mechanisms. Undoubtedly, emerging behaviour is intrinsically dependant on the individuals under study, e.g., humans commonly cooperate in large societies composed of unrelated individuals, while groups of animals are hardly greater than a few hundred Moffett2013 . In particular, variance in humans is especially relevant, as behaviour is deeply affected by the specifics of the interactions and the culture of the individuals Camerer2003 ; Henrich2005 . Moreover, given that it is an emergent phenomenon, behaviour can be deeply affected by the complex topology of interactions Szabo2007b . In an attempt to provide a framework for such scenarios, here we explore a model that allows unravelling what could be the drivers of cooperation by a heuristics selection process.
By exploring heuristics that make use of agents behavioural information to stochastically determine their decisions in iterated prisoners’ dilemma games across generations, we have shown that, in a feasible environment, evolution will drive heuristics towards cooperation even when defection is expected for pure strategies. In these scenarios, reciprocity and punishment are the main ingredients of cooperators’ decision-making, and most strategies will follow conditional cooperation. The fraction of cooperative decisions decreases with an increase in the mutation rate, nonetheless, for small mutation rates the system reaches a cooperative equilibrium. Without mutation, the configuration of the initial state is critical and the system can get trapped in equilibria of meagre cooperation. Increasing the memory of individuals also increases the fraction of cooperation, suggesting that heuristics with more resources are more cooperative. These aggregate results are indistinguishable from a version of the model wherein agents have, in addition to behavioural information, access to their similarity with others (which mimics genetic relatedness). For this latter scenario, the level of cooperation at the macroscopic level remains roughly the same. Important enough, however, at the level of individuals, chromosomes change significantly and cooperation is given through a kin identification process.
Therefore, when agents discriminate their kin, reciprocity loses much of its importance, which is especially insightful given the behaviour observed in nature. Kin selection is arguably the most important mechanism behind cooperation in non-human animals, while reciprocity is uncommon West2007a ; Clutton-Brock2009a . Our result suggests that in order for reciprocity to be dominant, perfect kin discrimination cannot exist, which suggest that figuring out the interplay between both mechanisms is crucial for understanding human evolution. Moreover, agents evolved in each condition presented a different expected response in one-shot games with unrelated individuals: cooperation is likely without the kin discrimination gene, while the majority of agent will defect when they can discriminate their genetic similarity.
To round off, we note that heuristics will adapt according to the information that they have access to, and they can change significantly according to the variables available. Surprisingly, despite changes in methods, cooperation is more likely than exploitation, due to reciprocity Trivers1971 ; Alexander1987 or to kin selection Hamilton1964 . This suggests that even if individuals have limited cognitive capacities (a small memory weighed by a rather inexpensive function), cooperative heuristics can have higher reproduction rates and be pervasive. However, extrapolations have to be made with caution. As it is often the case of works in evolutionary game theory, our model sidesteps important details from biology and cognitive sciences VanCleve2020 . Future work should explore the intersection between moral and material values and how it influences heuristics Bowles2011 , and how selection works in more complex scenarios, for instance, when higher cognition has higher associated costs Seoane2018 . Moreover, our approach could be used to understand how cultural characteristics Henrich2005 ; Boyd2018 drive cooperation in different directions by modelling proper environmental variables, and whether costly punishment could sustain large scale cooperation Fehr2002a . We plan to explore this and similar questions next.
Acknowledgements.
We acknowledge partial support from Project No. UZ-I-2015/022/PIP, the Government of Aragón, Spain, FEDER Funds, through Grant No. E36-17R to FENOL, and from MINECO and FEDER funds (Grant No. FIS2017-87519-P). YM acknowledges support from Intesa Sanpaolo Innovation Center. The funders had no role in study design, data collection, and analysis, decision to publish, or preparation of the manuscript.References
- (1) von Neumann J, Morgenstern O, Kuhn HW, Rubinstein A. Theory of Games and Economic Behavior. Princeton University, Princeton. 1944;p. 776. Available from: http://www.citeulike.org/group/1984/article/1062512http://library.wur.nl/WebQuery/clc/482840.
- (2) Myerson RB. Game Theory: Analysis of Conflict. 1st ed. Harvard University Press; 1997. Available from: https://www.hup.harvard.edu/catalog.php?isbn=9780674341166{&}content=reviews.
- (3) Rapoport A, Chammah AM. Prisoner’s dilemma : a study in conflict and cooperation. Ann Arbor: University of Michigan Press; 1965.
- (4) Dugatkin LA. Cooperation among animals: an evolutionary perspective. Oxford University Press; 1997.
- (5) Bourke AFG. Principles of Social Evolution. Oxford University Press; 2011.
- (6) Bowles S, Gintis H. A cooperative species: Human reciprocity and its evolution. Princeton University Press; 2011. Available from: https://press.princeton.edu/titles/9474.html.
- (7) Nowak MA, May RM. Evolutionary games and spatial chaos. Nature. 1992 oct;359(6398):826–829. Available from: http://www.nature.com/articles/359826a0.
- (8) Nowak MA, Sigmund K. Tit for tat in heterogeneous populations. Nature. 1992 jan;355(6357):250–253. Available from: http://www.nature.com/articles/355250a0.
- (9) Nowak MA. Five Rules for the Evolution of Cooperation. Science. 2006 dec;314(5805):1560–1563. Available from: http://www.sciencemag.org/cgi/doi/10.1126/science.1133755.
- (10) Axelrod R. The Evolution of Strategies in the Iterated Prisoner’s Dilemma. In: Davis L, editor. Genetic Algorithms and Simulated Annealing. Morgan Kaufman, Los Altos, CA; 1987. p. 32–41.
- (11) Lindgren. Evolutionary Phenomena in Simple Dynamics. Artificial Life II. 1991;X:295–312. Available from: https://research.chalmers.se/en/publication/140676.
- (12) Santos FC, Pacheco JM. A new route to the evolution of cooperation. Journal of Evolutionary Biology. 2006 may;19(3):726–733. Available from: http://doi.wiley.com/10.1111/j.1420-9101.2005.01063.x.
- (13) Roca CP, Cuesta JA, Sánchez A. Evolutionary game theory: Temporal and spatial effects beyond replicator dynamics. Physics of Life Reviews. 2009 dec;6(4):208–249. Available from: https://linkinghub.elsevier.com/retrieve/pii/S1571064509000256.
- (14) Colman AM, Browning L, Pulford BD. Spontaneous similarity discrimination in the evolution of cooperation. Journal of Theoretical Biology. 2012 apr;299:162–171. Available from: https://linkinghub.elsevier.com/retrieve/pii/S0022519311002645.
- (15) Sigmund K. The Calculus of selfishness. Princeton, New Jersey: Princeton University Press; 2010.
- (16) Henrich J, Boyd R, Bowles S, Camerer C, Fehr E, Gintis H, et al. “Economic man” in cross-cultural perspective: Behavioral experiments in 15 small-scale societies. Behavioral and Brain Sciences. 2005 dec;28(6):795–815. Available from: https://www.cambridge.org/core/product/identifier/S0140525X05000142/type/journal{_}article.
- (17) Foster KR, Ratnieks FLW. A new eusocial vertebrate? Trends in Ecology and Evolution. 2005 jul;20(7):363–364. Available from: https://linkinghub.elsevier.com/retrieve/pii/S0169534705001527.
- (18) Traulsen A, Hauert C, De Silva H, Nowak MA, Sigmund K. Exploration dynamics in evolutionary games. Proceedings of the National Academy of Sciences. 2009 jan;106(3):709–712. Available from: http://www.pnas.org/lookup/doi/10.1073/pnas.0808450106.
- (19) Su Q, Li A, Zhou L, Wang L. Interactive diversity promotes the evolution of cooperation in structured populations. New Journal of Physics. 2016 oct;18(10):103007. Available from: http://stacks.iop.org/1367-2630/18/i=10/a=103007?key=crossref.5fceb446cee075bd260bccd9f4d0f844.
- (20) Tversky A, Kahneman D. Judgment under Uncertainty: Heuristics and Biases. Science. 1974 sep;185(4157):1124–1131. Available from: https://www.sciencemag.org/lookup/doi/10.1126/science.185.4157.1124.
- (21) Gintis H. Gene–culture coevolution and the nature of human sociality. Philosophical Transactions of the Royal Society B: Biological Sciences. 2011 mar;366(1566):878–888. Available from: https://royalsocietypublishing.org/doi/10.1098/rstb.2010.0310.
- (22) Aumann RJ. A synthesis of behavioural and mainstream economics. Nature Human Behaviour. 2019 may;p. 1. Available from: http://www.nature.com/articles/s41562-019-0617-3.
- (23) Thaler RH. Behavioral Economics: Past, Present and Future. SSRN Electronic Journal. 2016;20(38):9. Available from: https://ssrn.com/abstract=2790606.
- (24) Knafo A, Israel S, Darvasi A, Bachner-Melman R, Uzefovsky F, Cohen L, et al. Individual differences in allocation of funds in the dictator game associated with length of the arginine vasopressin 1a receptor RS3 promoter region and correlation between RS3 length and hippocampal mRNA. Genes, Brain and Behavior. 2008 apr;7(3):266–275. Available from: https://onlinelibrary.wiley.com/doi/abs/10.1111/j.1601-183X.2007.00341.x.
- (25) Bateson M, Nettle D, Roberts G. Cues of being watched enhance cooperation in a real-world setting. Biology Letters. 2006 sep;2(3):412–414. Available from: http://www.royalsocietypublishing.org/doi/10.1098/rsbl.2006.0509.
- (26) Rand DG, Greene JD, Nowak MA. Spontaneous giving and calculated greed. Nature. 2012 sep;489(7416):427–430. Available from: http://www.nature.com/doifinder/10.1038/nature11467.
- (27) Rand DG, Peysakhovich A, Kraft-Todd GT, Newman GE, Wurzbacher O, Nowak MA, et al. Social heuristics shape intuitive cooperation. Nature Communications. 2014 may;5(1):3677. Available from: http://www.nature.com/articles/ncomms4677.
- (28) Boyd R. A different kind of animal: how culture transformed our species. Princeton, New Jersey: Princeton University Press; 2018.
- (29) Richerson P, Baldini R, Bell AV, Demps K, Frost K, Hillis V, et al. Cultural group selection plays an essential role in explaining human cooperation: A sketch of the evidence. Behavioral and Brain Sciences. 2016 oct;39:e30. Available from: https://www.cambridge.org/core/product/identifier/S0140525X1400106X/type/journal{_}article.
- (30) Hamilton WD. The genetical evolution of social behaviour. I & II. Journal of Theoretical Biology. 1964 jul;7(1):1–16. Available from: https://www.sciencedirect.com/science/article/pii/0022519364900384.
- (31) Eiben AE, Smith J. Introduction to Evolutionary Computing. Berlin, Heidelberg: Springer-Verlag; 2003.
- (32) Richerson PJ, Boyd R. Not by genes alone: How culture transformed human evolution. Chigado University Press; 2005. Available from: https://press.uchicago.edu/ucp/books/book/chicago/N/bo3615170.html.
- (33) Nowak MA. Evolutionary Dynamics of Biological Games. Science. 2004 feb;303(5659):793–799. Available from: http://www.sciencemag.org/cgi/doi/10.1126/science.1093411.
- (34) Miller JH. The coevolution of automata in the repeated prisoner’s dilemma. Journal of Economic Behavior and Organization. 1996 jan;29(1):87–112. Available from: https://www.sciencedirect.com/science/article/pii/0167268195000526.
- (35) Van Veelen M, García J, Rand DG, Nowak MA. Direct reciprocity in structured populations. Proceedings of the National Academy of Sciences of the United States of America. 2012 jun;109(25):9929–9934. Available from: http://www.pnas.org/cgi/doi/10.1073/pnas.1206694109.
- (36) Binmore KG, Samuelson L. Evolutionary stability in repeated games played by finite automata. Journal of Economic Theory. 1992 aug;57(2):278–305. Available from: https://linkinghub.elsevier.com/retrieve/pii/002205319290037I.
- (37) West SA, Griffin AS, Gardner A. Evolutionary Explanations for Cooperation. Current Biology. 2007 aug;17(16):R661–R672. Available from: https://linkinghub.elsevier.com/retrieve/pii/S0960982207014996.
- (38) Clutton-Brock T. Cooperation between non-kin in animal societies. Nature. 2009 nov;462(7269):51–57. Available from: http://www.nature.com/articles/nature08366.
- (39) Traulsen A, Pacheco JM, Nowak MA. Pairwise comparison and selection temperature in evolutionary game dynamics. Journal of Theoretical Biology. 2007 jun;246(3):522–529. Available from: https://linkinghub.elsevier.com/retrieve/pii/S0022519307000069.
- (40) Lindgren K, Nordahl MG. Evolutionary dynamics of spatial games. Physica D: Nonlinear Phenomena. 1994 aug;75(1-3):292–309. Available from: https://www.sciencedirect.com/science/article/pii/0167278994902895.
- (41) Axelrod R, Hamilton W. The evolution of cooperation. Science. 1981 mar;211(4489):1390–1396. Available from: https://www.sciencemag.org/lookup/doi/10.1126/science.7466396.
- (42) Milinski M, Wedekind C. Working memory constrains human cooperation in the Prisoner’s Dilemma. Proceedings of the National Academy of Sciences. 1998 nov;95(23):13755–13758. Available from: http://www.pnas.org/cgi/doi/10.1073/pnas.95.23.13755.
- (43) Nowak MA, Sigmund K. Evolution of indirect reciprocity. Nature. 2005 oct;437(7063):1291–1298. Available from: http://www.nature.com/articles/nature04131.
- (44) Queller DC. A general model for kin selection. Evolution. 1992 apr;46(2):376–380. Available from: http://doi.wiley.com/10.1111/j.1558-5646.1992.tb02045.x.
- (45) Nowak MA, Tarnita CE, Wilson EO. The evolution of eusociality. Nature. 2010 aug;466(7310):1057–1062. Available from: http://www.nature.com/articles/nature09205.
- (46) Nowak MA, McAvoy A, Allen B, Wilson EO. The general form of Hamilton’s rule makes no predictions and cannot be tested empirically. Proceedings of the National Academy of Sciences. 2017 may;114(22):5665–5670. Available from: http://www.pnas.org/lookup/doi/10.1073/pnas.1701805114.
- (47) Abbot P, et al. Inclusive fitness theory and eusociality. Nature. 2011 mar;471(7339):E1–E4. Available from: http://www.nature.com/articles/nature09831.
- (48) Birch J. The inclusive fitness controversy: finding a way forward. Royal Society Open Science. 2017 jul;4(7):170335. Available from: https://royalsocietypublishing.org/doi/10.1098/rsos.170335.
- (49) Birch J. Are kin and group selection rivals or friends? Current Biology. 2019 jun;29(11):R433–R438. Available from: https://linkinghub.elsevier.com/retrieve/pii/S0960982219300946.
- (50) van Veelen M. Can Hamilton’s rule be violated? eLife. 2018 oct;7. Available from: https://elifesciences.org/articles/41901.
- (51) Grafen A. Do animals really recognize kin? Animal Behaviour. 1990 jan;39(1):42–54. Available from: https://linkinghub.elsevier.com/retrieve/pii/S0003347205807249.
- (52) Moffett MW. Human Identity and the Evolution of Societies. Human Nature. 2013 sep;24(3):219–267. Available from: https://link.springer.com/article/10.1007/s12110-013-9170-3.
- (53) Camerer CF. Behavioral Game Theory: Experiments in Strategic Interaction. Princeton, New Jersey: Princeton University Press; 2003. Available from: https://press.princeton.edu/books/hardcover/9780691090399/behavioral-game-theory.
- (54) Szabó G, Fáth G. Evolutionary games on graphs. Physics Reports. 2007 jul;446(4-6):97–216. Available from: http://www.sciencedirect.com/science/article/pii/S0370157307001810.
- (55) Trivers RL. The Evolution of Reciprocal Altruism. The Quarterly Review of Biology. 1971 mar;46(1):35–57. Available from: https://www.journals.uchicago.edu/doi/10.1086/406755.
- (56) Alexander RD. The Biology of Moral Systems. Routledge; 1987. Available from: https://www.taylorfrancis.com/books/9781351329309.
- (57) Van Cleve J. Building a synthetic basis for kin selection and evolutionary game theory using population genetics. Theoretical Population Biology. 2020 mar;Available from: https://linkinghub.elsevier.com/retrieve/pii/S0040580920300150.
- (58) Seoane LF, Solé RV. Information theory, predictability and the emergence of complex life. Royal Society Open Science. 2018 feb;5(2):172221. Available from: https://royalsocietypublishing.org/doi/10.1098/rsos.172221.
- (59) Fehr E, Gächter S. Altruistic punishment in humans. Nature. 2002 jan;415(6868):137–140. Available from: http://www.nature.com/articles/415137a.
Supplemental Materials: Dynamics of heuristics selection for cooperative behavior
I Other payoff values
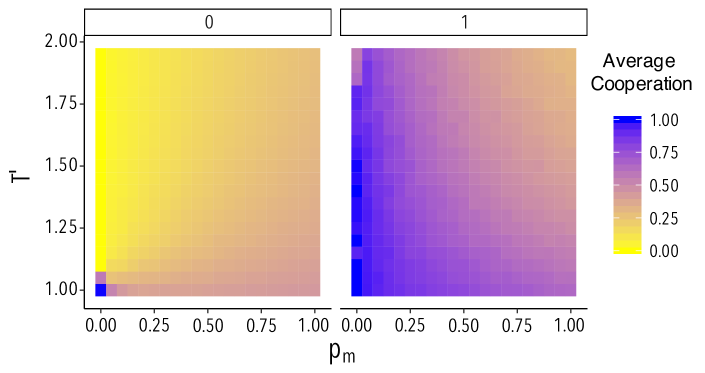
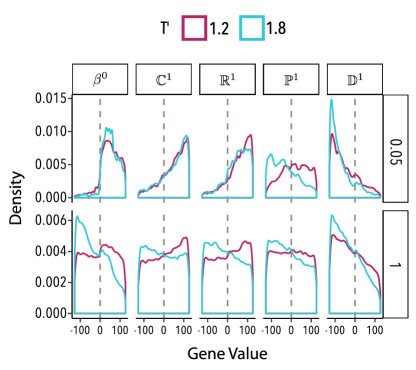
To ensure that our results are robust with respect to differences in the payoff values, we ran simulations for different values of the temptation parameter . To make our results comparable to previous work, we used the one-dimensional parametrization of payoffs used by Nowak et. al Nowak1992 . In this version, , , , and varies from 1 to 2, with being a value close to zero. As we consider normalized versions, the payoff here is defined by , with varying from 1 to 2. Results for memory 0 and 1 are shown in Fig. S1. The results show that without memory, cooperation is only attainable when and low mutation. However, when agents have memory of their last interaction, cooperation endures even when the temptation to defect is around 2. As an illustration, the distributions of gene values for values of 1.2 and 1.8 are shown in Fig S2. They follow a close pattern to the ones shown in Fig. 4 in the main text, indicating the equivalence of both results. This shows that our results are robust across a broad range of parameter values.
II Heuristics Classification
Heuristics are classified according to two basic strategies: Pure Cooperation and Pure Defection. These two strategies always cooperate and always defect, respectively. Table S1 illustrates the variables contained in the memory of agent with respect to a player , corresponding to the two pure strategies for . All the values are given straightforwardly, expect for . Payoffs values are more complicated, as they depend on the players with whom they are playing with, which we cannot define a priori. We decided to use the average payoff of individuals which cooperated and defected with all their neighbours for the pure cooperator and pure defector, respectively. Therefore, and , wherein (resp. ) corresponds to the set of agents which cooperated with all (resp. none) of their neighbours in the last time step.
The activation function (Eq. 1 in the main text) of an agent results in the probability to cooperate with the Pure Cooperator () and the Pure Defector (). We then, use the threshold to divide the plane . Namely, we designate as cooperation when , defection as , and random when . This process results in the set of strategies given in Table 2 of the main text. Therefore, a precise version of this table would correspond to the one shown in Table S2.
| Pure Cooperator | Pure Defector | |
|---|---|---|
| 1 | 0 | |
| 1 | 0 | |
| 0 | 1 |
- Pure Cooperator Pure Defector FC FD CC GCC CD Bully Random
III Extended model in Random Regular Networks
In this section, we present the results of the extended model with the Kinship parameter ran on RRN graphs. At variance with the model in a lattice, when there is no mutation, the fraction of cooperative actions can be different from zero, as it is also shown in the time evolution figures. This demonstrates how important the kin identification mechanism can be in an adequate environment. With mutation, the macroscopic results are equivalent to the results in a lattice and in an RRN without the extension. Furthermore, when agents have had access to memory the results are equivalent to the ones obtained in a lattice, including the distribution of gene values for .
IV Time Evolution
Time evolution curves of the main model executions for memory values of 0,2,3,4, and 5 are shown in Figures S5, S6, S7, S8, and S9, respectively. Figures S10, S11, S12, S13, S14, and S15 show the time evolution curves of realizations of the model with the addition of the kin identification gene for memory values of 0,1,2,3,4, and 5, respectively.
V One-shot responses
Distributions of the probability of cooperating with an unknown agent in a one-shot game, are shown in Fig. S16 and Fig. S17 for the non-kin and kin models, respectively.