Discovery of HC4NC in TMC-1: A study of the isomers of HC3N, HC5N, and HC7N ††thanks: Based on observations carried out with the Yebes 40m telescope (projects 19A003, 19A010, 20A014). The 40m radiotelescope at Yebes Observatory is operated by the Spanish Geographic Institute (IGN, Ministerio de Transportes, Movilidad y Agenda Urbana).
We present a study of the isocyano isomers of the cyanopolyynes HC3N, HC5N, and HC7N in TMC-1 and IRC+10216 carried out with the Yebes 40m radio telescope. This study has enabled us to report the detection, for the first time in space, of HCCCCNC in TMC-1 and to give upper limits for HC6NC in the same source. In addition, the deuterated isotopologues of HCCNC and HNCCC were detected, along with all 13C substitutions of HCCNC, also for the first time in space. The abundance ratios of HC3N and HC5N, with their isomers, are very different in TMC-1 and IRC+10216, namely, N(HC5N)/N(HC4NC) is 300 and 2100, respectively. We discuss the chemistry of the metastable isomers of cyanopolyynes in terms of the most likely formation pathways and by comparing observational abundance ratios between different sources.
Key Words.:
molecular data — line: identification — ISM: molecules — ISM: individual (TMC-1) — stars: individual (IRC +10216) — astrochemistry1 Introduction
Millimeter-wave observations of lines from isomers of abundant molecular species provide key information for studying the chemical paths leading to their formation in interstellar and circumstellar clouds, an important piece of the astrochemical puzzle. The best known example is that of HCN and HNC, which are formed in interstellar clouds by the dissociative recombination of a common species, the HCNH+ cation, in a branching ratio of 1:1. Once these species are formed, they undergo various reactions that can lead to changes in the initial abundances, in particular, reactions of HNC with atoms and radicals (see, e.g. Hacar et al. 2020 and references therein). In circumstellar clouds, HCN and HNC are produced very close to the photosphere of the central star under thermodynamical chemical equilibrium with a branching ratio of 1000:1 (Cernicharo et al. 2013). While HCN maintains its abundance across the envelope, HNC disappears very quickly when moving away from the star. It reappears again in the zone where galactic UV photons are able to penetrate the envelope, initiating a very rich photochemistry (Cernicharo et al. 2013).
Some isomers may not necessarily be formed from a common precursor but as an effect of radiation as it is thought to occur for the conformer of HCOOH in the Orion Bar photodissociation region (Cuadrado et al. 2016). This is an interesting case, in which the absorption of a UV photon by the conformer leads, through radiative decay, to the conformer. This photochemical switch can only work in regions with enough UV illumination. In fact, HCOOH has been detected in the cold dark clouds B5 and L483 (Taquet et al. 2017; Agúndez et al. 2019). The lack of UV photons in these environments together with their derived lower -to- abundance ratios, as compared to the Orion Bar, indicate that a different mechanism must operate in these cold clouds.
However, most of the isomers known in space involve radical CN. In addition to HCN and HNC, the isocyanide isomers of CH3CN (Cernicharo et al. 1988), HC3N (Kawaguchi et al. 1992a, b), and NCCN (Agúndez et al. 2018) have been detected in space. HCCNC and HNCCC, the two isomers of HC3N, have also been detected towards the circumstellar envelope IRC+10216 (Gensheimer 1997a, a). A comparative study of the abundances of isomers in interstellar and circumstellar clouds provide an opportunity to understand the chemical processes leading to their formation, as the chemistry prevailing in cold interstellar clouds (ion-neutral reactions) and in external layers of circumstellar envelopes (radical-neutral and photochemical reactions) are very different. In this letter, we present a systematic study of the HC3N, HC5N, and HC7N isomers, along with their isotopologues, towards TMC-1 and IRC+10216 making use of the observations described in Section 2. In Section 3 we report on the first detection in space of HC4NC111After the original submission of this manuscript and prior to its review, we learned about a parallel effort by Xue et al. (2020) using the GBT at lower frequencies. Their stacked data of three lines present a convicent detection of HC4NC in TMC-1. The column density they derive is consistent with that from our more complete study of the isomers, isotopologues, and chemistry of cyanopolyynes in this source and toward IRC+10216., Isocyanodiacetylene, which is the most stable isomer after HC5N. This new molecular species has been detected only towards TMC-1, whereas a very low upper limit has been obtained towards IRC+10216, which is a rather interesting finding and which we discuss in Section 4.
2 Observations
New receivers, built within the Nanocosmos project222https://nanocosmos.iff.csic.es/ and installed at the Yebes 40m radio telescope, (hereafter, Yebes 40m) were used for the observations of TMC-1. The Q-band receiver consists of two HEMT cold amplifiers covering the 31.0-50.3 GHz band with horizontal and vertical polarizations. Receiver temperatures vary from 22 K at 32 GHz to 42 K at 50 GHz. The spectrometers are GHz FFTs with a spectral resolution of 38.1 kHz providing the whole coverage of the Q-band in both polarizations. The main beam efficiency varies from 0.6 at 32 GHz to 0.43 at 50 GHz. The beam size of the telescope is 56′′ and 36′′ at 31 and 50 GHz, respectively. Pointing errors are always within 2-3′′.
The observations leading to the Q-band line survey towards TMC-1 were performed in several sessions, between November 2019 and February 2020. The observing procedure was frequency switching with a frequency throw of 10 MHz. The nominal spectral resolution of 38.1 kHz was left unchanged for the final spectra. The sensitivity, , along the Q-band varies between 0.6 (31 GHz), 1.0 (43 GHz), and 2.5 mK (50 GHz). It was derived by removing a polynomial baseline in velocity windows of -6.2 to 17.8 km s-1 centered on each observed line.
The intensity scale, antenna temperature (T), was calibrated using two absorbers at different temperatures and the atmospheric transmission model (ATM, Cernicharo 1985; Pardo et al. 2001). Calibration uncertainties are estimated to be within 10 %. All data were analyzed using the GILDAS package333http://www.iram.fr/IRAMFR/GILDAS. The observations in the Q-band of IRC+10216 were previously described by Cernicharo et al. (2019) and Pardo et al. (2020).
3 Results
The sensitivity of our observations towards TMC-1 (see section 2) is a factor of 5-10 better than previously published line surveys of this source at the same frequencies (Kaifu et al. 2004). This has allowed us to detect a forest of weak lines, most of them arising from the isotopologues of abundant species such as HC3N and HC5N. For the observed line parameters of HC3N and its isotopologues, see Appendix B. With regard to HC5N, in addition to its deuterated species, it has five 13C and one 15N isotopologues and is responsible for 50 features detected within our survey with a signal to noise ratio (S/N) between 10 for HCN, 20-40 for the 13C isotopologues, and 1000 for the main isotopologue (see also Appendix B for their observed line parameters). From the seven rotational transitions of HC5N observed within the Q-band (Jup=12 to Jup=18), we obtained a local standard of rest velocity of the source, namely, vLSR, of 5.830.01 km s-1. From the 13C and 15N isotopologes of HC5N, which provide 43 different transitions to estimate this same velocity, we get vLSR = 5.840.01 km s-1. Hence, we adopt a value vLSR of 5.83 km s-1 for further frequency determinations in TMC-1. The value given by Kaifu et al. (2004) is 5.85 km s-1, which is practically identical to our result within the observational uncertainties.
3.1 The isomers of HC3N
The most stable isomers of HC3N are HCCNC and HNCCC. They have been extensively observed in the laboratory. Rotational transitions of HCCNC have been measured up to =33 at a frequency of 327.8 GHz (Guarnieri et al. 1992). HNCCC is a quasi-linear species, with the hydrogen atom slightly bent with respect to the NCCC axis. Its rotational transitions have been measured in the microwave domain (Hirahara et al. 1993) and at millimeter wavelengths (Vastel et al. 2018). Hence, accurate frequencies are available for these species. The =1-0 line of nine HCCNC isotopologue (D, 13C and 15N) was measured in the laboratory by Krüger et al. (1992). The millimeterwave spectrum of DCCNC was measured by Huckauf et al. (1998) up to =51. The microwave spectrum of DNCCC was measured by Hirahara et al. (1993) up to =2, and =19 GHz. The derived rotational constants for all these species have been implemented in the MADEX code (Cernicharo 2012) in order to work for their detection and analysis in interstellar and circumstellar sources.
The HCCNC and HNCCC isomers were previously detected towards TMC-1 by Kawaguchi et al. (1992a, b) and in IRC +10216 by Gensheimer (1997a, b). A detailed study of these two species in L1544, including their relative abundances, formation paths, and comparison with the abundances observed in TMC-1 has been conducted by Vastel et al. (2018) based on observations in the 3 mm domain.
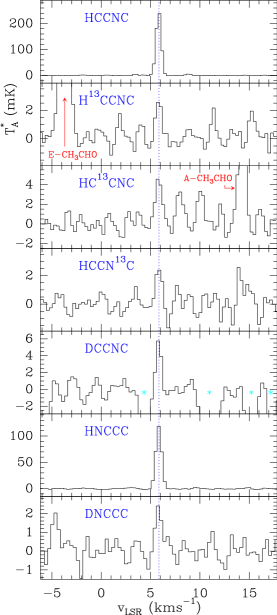
The derived line parameters for the HCCNC and HNCCC transitions observed in TMC-1 are given in Table 3. Selected lines are shown in Fig. 1. The deuterated counterparts DNCCC and DCCNC, together with the three 13C substitutions of HCCNC, have also been detected for the first time in space. Its derived line parameters are given in Table 3 (see also Fig. 1). Improved rotational constants for DNCCC, H13CCNC, HC13CNC, and HCCN13C were obtained from the observed frequencies. They are given in Appendix A. The isotopic abundance ratios of the HC3N isomers are discussed in Appendix B.
Assuming a TMC-1 source size of 40′′ and that the rotational temperature of the observed transitions is identical to the kinetic temperature (10 K), we derive N(HNCCC)=(5.20.3)1011 cm-2, and N(HCCNC)=(3.00.3)1012 cm-2. We can check the validity of the assumed rotational temperature by adopting for the isomers the same collisional rates of HC3N (Wernli et al. 2007), and a value of (4-10)104 cm-3 for the H2 volume density, in the large velocity gradient (LVG) module integrated in MADEX (Cernicharo 2012). For the lowest value of the H2 density, the derived excitation temperatures for the =4-3 and 5-4 transitions are 9.5 and 8.2 K for HCCNC, whereas they are 10 and 7 K for HNCCC. For n(H2)=105 cm-3, these rotational transitions will have excitation temperatures very close to 10 K. For HC3N, we also performed LVG calculations leading to derived excitation temperatures very close to 10 K for the =4-3 and 5-4 transitions. However, these HC3N transitions exhibit line opacity problems due to the high abundance of this molecule in TMC-1. The very weak hyperfine components =4-4 and =3-3 of the =4-3 transition, and the =5-5 and =4-4 of the =5-4 transition, were detected. We used those components to derive N(HC3N)=(2.30.2)1014 cm-2, which is a value 1.5 times larger than the one obtained using only the strongest hyperfine components of the observed rotational transitions. We can also estimate the column density of cyanoacetylene by using its 13C isotopologues (see Table 7) and a 12C/13C abundance ratio of 9310 (derived from all isotopologues of HC5N, see Appendix B). In this case, the result is N(HC3N)=(1.90.2)1014 cm-2. Our value for the isotopic abundance ratio agrees rather well with the one derived by Takano et al. (1998) in the same source. The derived column densities for HNCCC, HCCNC, and HC3N in TMC-1 (see Table 1) are in reasonable agreement with those obtained previously (Kawaguchi et al. 1992a, b; Takano et al. 1998). We note that our assumed rotational temperatures are higher than those reported in the literature (5-7 K), but the differences in the estimated column densities for optically thin lines involving energy levels between 5-8 K is is rather small. For example, for Trot=5 K and N(HNCCC)=1011 cm-2, the expected brightness intensity for its =4-3 transition is 43.5 mK, while for Trot=10 K, it is 50.4 mK.
| Molecule | TMC-1 | IRC+10216 |
|---|---|---|
| N(HC3N) | (2.30.2)1014 | (4.50.2)1014 |
| N(HCCNC) | (3.00.3)1012 | (1.10.1)1012 |
| N(HNCCC) | (5.20.3)1011 | (3.40.2)1011 |
| N(HC5N) | (1.80.2)1014 | (4.20.4)1014 b |
| N(HC4NC) | (3.00.7)1011 | 2.11011 |
| N(HNC5) | 1.51011 | 1.11011 |
| N(HC7N) | (6.40.2)1013 | (1.90.2)1014 c |
| N(HC6NC) | 9.01010 | 2.01011 |
| N(HC3N)/N(HCCNC) | 77.08.0 | 39222 |
| N(HC3N)/N(HNCCC) | 442.070.0 | 130545 |
| N(HCCNC)/N(HNCCC) | 5.81.0 | 4.00.9 |
| N(HC5N)/N(HC4NC) | 60070.0 | 2000 |
| N(HC5N)/N(HNC5) | 1200 | 3800 |
| N(HC4NC)/N(HNC5) | 2 | 1.9 |
| N(HC7N)/N(HC6NC) | 710.0 | 950 |
| N(HC3N)/N(HC5N) | 1.30.2 | 1.10.2 |
| N(HC5N)/N(HC7N) | 2.80.3 | 2.20.5 |
$a$$a$footnotetext: All column densities are given in units of cm-2. $b$$b$footnotetext: For IRC+10216, we adopted the value derived by Pardo et al. (2020), which corresponds to the gas component with Trot=10.1 K. A second component, with similar column density, was found for high- levels with a Trot=24.5 K. $c$$c$footnotetext: For IRC+10216, we adopted the value derived by Pardo et al. (2020), which corresponds to the gas component with Trot=16.8 K. A second component, with a column density 2.5 lower, was found for high- levels with a Trot=31.6 K.
The Q-band survey of IRC+10216 carried out with the Yebes 40m also reached an unprecedented sensitivity, which has allowed the detection of new molecular species such as MgC3N and MgC4H (Cernicharo et al. 2019), and of previously undetected vibrational excited states of abundant species such as HC7N and HC9N (Pardo et al. 2020). In these data, we find two transitions of HNCCC and HCCNC, with their observed line parameters, which are given together with those of HC3N and their isotopologues in Table 4. The isotopologues of the isomers are, however, below the sensitivity limit of the data. We performed an LVG model to derive the column densities of the three HC3N isomers from the observations. The results are given in Table 1. To avoid line opacity effects, the column density of HC3N has been derived from the observed intensities of its three 13C isotopologues using an isotopic abundance ratio of 45 (Cernicharo et al. 2000).
3.2 The isomers of HC5N. Detection of HC4NC
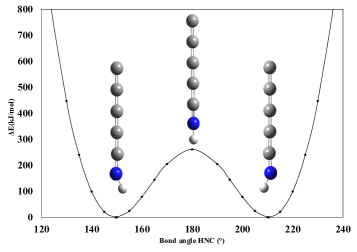
HC5N has different isomers shown in Figure 4. The most stable one, after HC5N, is HC4NC (see Appendix C). Both of them could be formed in TMC-1 through the dissociative recombination of the cation HC5NH+, recently detected in TMC-1 by Marcelino et al. (2020). Through its similarity to HC3N and HNCCC, the isomer HNC5 could also be formed in the dissociative recombination of HC5NH+. While HC4NC has been observed in the laboratory (Botschwina et al. 1998) and precise rotational frequencies are available from the Cologne Database for Molecular Spectroscopy (CDMS) catalogue (Müller et al. 2005) or from the MADEX code (Cernicharo 2012), no laboratory data are available for HNC5. Nevertheless, we estimated, using ab initio calculations, its rotational constants and searched for this species in TMC1 and IRC+10216.
| Ju | Tb | vc | Tdv d | |
|---|---|---|---|---|
| (MHz) | (mK) | (kms-1) | (mK kms-1) | |
| 12 | 33628.1510.010 | 3.60.5 | 0.710.12 | 2.680.3 |
| 13 | 36430.4290.010 | 3.80.5 | 0.660.09 | 2.680.3 |
| 14 | 39232.7300.010 | 3.10.6 | 0.850.12 | 2.760.3 |
| 15 | 42035.0400.010 | 3.71.0 | 0.470.14 | 2.080.4 |
| 16 | 44837.2950.010 | 4.91.2 | 0.420.19 | 2.240.5 |
$a$$a$footnotetext: Observed frequencies for a vLSR of 5.83 km s-1. The =17-16 line has not been detected within a 3 level of 5.7 mK. $b$$b$footnotetext: Antenna temperature in mK. $c$$c$footnotetext: Linewidth at half intensity derived by fitting a Gaussian line profile to the observed transitions (in kms-1). $d$$d$footnotetext: Integrated line intensity in mK kms-1.
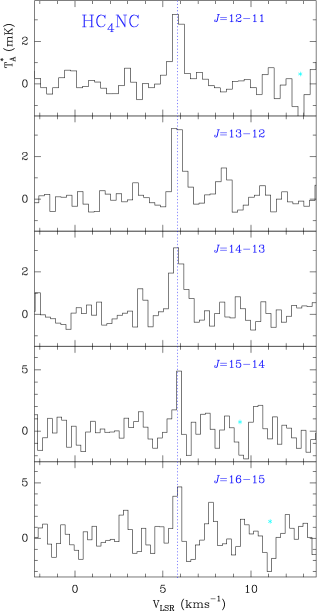
Five lines of HC4NC were detected towards TMC-1 (see Fig 2). This is the first time that this species has been detected in space. From the rotational diagram obtained with its observed line intensities, we derived Trot=9.80.9 K, and N(HC4NC)=(3.00.7)1011 cm-2. In order to compare the derived column density with that of the most stable isomer, HC5N, we used the observed intensities of this last species (see Table LABEL:tab_hc5n_TMC-1) to build another rotational diagram. We obtained Trot=8.60.2 K, and N(HC5N)=(1.80.2)1014 cm-2 (corrected for line opacity effects, see Appendix B). Hence, the HC5N/HC4NC abundance ratio in TMC-1 is 600. Using the observed frequencies of HC4NC in TMC-1 and those obtained in the laboratory (Botschwina et al. 1998), we improved the rotational constants of this species (see Appendix A).
We searched for the lines of HC4NC towards IRC+10216 without success. By averaging all the data from the expected line positions within the Q-band, we derived a column density upper limit of 21011 cm-2. Using the same dataset, the column density of HC5N was recently derived as (4.20.4)1014 cm-2 (Pardo et al. 2020). Hence, in this carbon-rich circumstellar envelope, the HC5N/HC4NC abundance ratio is 2000.
Precise rotational constants were estimated through our ab initio calculations for HNC5 (scaled values =1358.81.0 MHz, 32 Hz; see Appendix C). Although slightly asymmetrical, it is a quasi-linear species (see Appendix C) such that we could expect the series of lines to be in harmonic relation. The =1 lines could be at an energy too high to be detected in TMC1. We searched for such an harmonic pattern around 100 MHz of the predicted line frequencies without success. Using the dipole moment we derived from our calculations, we get N(HNC5)1.51011 cm-2 and 1.11011 cm-2 towards TMC-1 and IRC+10216, respectively.
3.3 The isomers of HC7N
HC7N has 17 rotational transitions within the frequency range of our Q-band data. All of them have been detected in TMC1 and in IRC+10216. For the latter source, the data were presented and analyzed by Pardo et al. (2020); the derived HC7N column density is given in Table 1. From the TMC1 data (see Table LABEL:tab_hc5n_TMC-1), we built a rotational diagram that gives the following results: Trot=7.60.1 K and N(HC7N)=(6.40.4)1013 cm-2.
4 Discussion
The chemistry of HC3N isomers in cold dense clouds has been discussed by Osamura et al. (1999) and Vastel et al. (2018). In the scenario depicted by these authors, the main formation route to the HC3N isomers relies on the dissociative recombination of HC3NH+. The rate constant of this reaction has been measured, using the deuterated variant of the ion, by Geppert et al. (2004). Calculations by Osamura et al. (1999) indicate that rearrangement is possible so that the various linear or nearly-linear isomers of HC3N, that is, HNC3, HCCNC, and HCNCC, can be formed. There is some experimental information on the different fragments that are formed (Geppert et al. 2004), but precise branching ratios for the different exit channels are not known and introduce important uncertainties when modeling the chemistry of HC3N isomers. The chemical models constructed for TMC-1 (Osamura et al. 1999) and for L1544 (Vastel et al. 2018) reproduce quite well the observed abundances of HC3N isomers, although they tend to overestimate the abundances of HNC3 and HCCNC with respect to HC3N. In these models, the most stable isomer, HC3N, is also formed through neutral-neutral reactions, while the different metastable isomers are mostly formed through dissociative recombination of HC3NH+ and, to a lesser extent, of its less stable isomer HCCNCH+. The higher abundance observed for the isomer HCCNC with respect to HNC3 is explained in terms of a higher reactivity of the latter isomer with neutral H and C atoms (Osamura et al. 1999). By way of an analogy with HC3N, the main source of HC5N and its isomers is most likely the dissociative recombination of HC5NH+, recently detected in TMC-1 (Marcelino et al. 2020). However, branching ratios for the formation of the different isomers HC5N, HC4NC, and HNC5 are unknown.
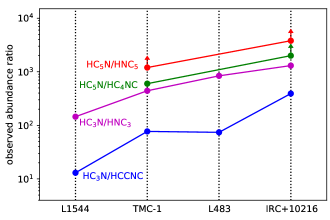
Looking at how the relative abundances of HC3N and HC5N isomers behave in different sources can provide clues on the underlying chemical processes. In Fig. 3, we compare the abundance ratios between HC3N isomers derived here for TMC-1 and IRC +10216 with those obtained in the molecular clouds L1544 and L483. It can be seen that the HC3N/HCCNC and HC3N/HNC3 ratios observed in TMC-1 are similar to those seen in the Class 0 molecular cloud L483, although they are higher than those derived in the starless core L1544 and lower than the values in the C-star envelope IRC +10216. The change in these abundance ratios may be related to the temperature of the source. The low temperature of the starless core L1544 seems to favor the formation of metastable isomers while these are less efficiently formed in the warmer ejecta of IRC +10216. Indeed, as temperature increases, the presence of high-energy isomers is less favorable because chemical reactions, including isomerization, are expected to favor the most stable isomer. The same is expected to be true of isotopic fractionation. For example, in TMC-1, the isotopologue HCC13CN is twice as abundant as H13CCCN and HC13CCN (see also Takano et al. 1998), whereas, in the case of HCCNC, its HC13CNC isotopologue is 1.8 times more abundant than H13CCNC and HCCN13C (see Table 6). A slight overabundance of HCCCC13CN with respect to the other four 13C isotopologues of HC5N has also been observed (see Appendix B). These kinds of isotopic anomalies have been also seen for HC3N in other cold dense clouds (Araki et al. 2016; Taniguchi et al. 2017; Agúndez et al. 2019), but they are not seen in IRC +10216.
The column densities and abundance ratios derived for the isomers of HC3N, HC5N, and HC7N in TMC-1 and IRC +10216 are summarized in Table 1. The abundance ratios given in Table 1 (see also Fig. 3), suggest a trend in which the relative abundance of metastable isomers decreases as we move to larger molecular sizes. In TMC-1, we have (HCN)/(HNC)1, (HC3N)/(HCCNC)77, (HC3N)/(HNC3)442, (HC5N)/(HC4NC)600, and (HC7N)/(HC6NC)710. These ratios are increased by a factor of 4-5 in IRC +10216. This suggests that metastable isomers of longer carbon chains will be hardly detectable in these sources.
Acknowledgements.
The Spanish authors thank Ministerio de Ciencia e Innovación for funding support through project AYA2016-75066-C2-1-P. We also thank ERC for funding through grant ERC-2013-Syg-610256-NANOCOSMOS. MA and CB thanks Ministerio de Ciencia e Innovación for Ramón y Cajal grant RyC-2014-16277 and Juan de la Cierva grant FJCI-2016-27983.References
- Agúndez et al. (2018) Agúndez, M., Marcelino, N., & Cernicharo, J. 2018, ApJ, 861, L22
- Agúndez et al. (2019) Agúndez, M., Marcelino, N., Cernicharo, J., et al. 2019, A&A, 625, A147
- Araki et al. (2016) Araki, M., Takano, S., Sakai, N., et al. 2016, ApJ, 833, 291
- Bizzocchi et al. (2004) Bizzocchi, L., Degli Esposti, C., Botschwina, P., 2004, J. Mol. Spectrosc., 225, 145
- Botschwina et al. (1998) Botschwina, P., Heyl, A., Chen, W., et al., 1998, J. Chem. Phys., 109, 3108
- Cernicharo (1985) Cernicharo, J. 1985, Internal IRAM report (Granada: IRAM)
- Cernicharo et al. (1988) Cernicharo, J., Kahane, C., Guélin, M., Gómez-Gónzalez, J., 1988, A&A, 189, L1
- Cernicharo et al. (2000) Cernicharo, J., Guélin, M., & Kahane, C. 2000, A&AS, 142, 181
- Cernicharo (2012) Cernicharo, J., 2012, in ECLA 2011: Proc. of the European Conference on Laboratory Astrophysics, EAS Publications Series, 2012, Ed.: C. Stehl, C. Joblin, & L. d’Hendecourt (Cambridge: Cambridge Univ. Press), 251; https://nanocosmos.iff.csic.es/?pageid=1619
- Cernicharo et al. (2013) Cernicharo, J., Daniel, F., Castro-Carrizo, A., et al., 2013, ApJ, 778, L25
- Cernicharo et al. (2019) Cernicharo, J., Cabezas, C., Pardo, J. R., et al., 2019, A&A, 630, L2
- Cernicharo et al. (2020) Cernicharo, J., et al., 2020, A&A, doi:(10.1051/0004-6361/202039231)?
- Chen et al. (1991) Chen, W., Bocquet, R., Wlodarczak, G., Boucher, D., Int. J. Infrared and Millimeter Waves, 12, 987
- Cížek (1969) Cížek, J., in ”Advances in Chemical Physics” (P. C. Hariharan, Ed.), Vol.14, 35, Wiley Interscience, New York, 1969
- Creswell & Winnewisser (1977) Creswell, R.A., Winnewisser, G., 1977, J. Mol. Spectrosc., 65, 420
- Cuadrado et al. (2016) Cuadrado, S., J.R. Goicoechea, Roncero, O., et al., 2016, A&A, 596, L1
- De Zafra (1971) De Zafra, R.L., 1971, ApJ, 170, 165
- Fayt et al. (2004) Fayt, A., Vigouroux, C., Willaert, F., et al., 2004, J. Mol. Struct., 695-696, 295
- Frisch et al. (2013) Frisch, M. J., Trucks, G. W., Schlegel, H. B., et al. 2013, Gaussian 09, rev. D.01.
- Gensheimer (1997a) Gensheimer, P.D., 1997a, Astrophysics and Space Science, 251, 199
- Gensheimer (1997b) Gensheimer, P.D., 1997b, ApJ, 479, L75
- Geppert et al. (2004) Geppert, W. D., Ehlerding, A., Hellberg, F., et al. 2004, ApJ, 613, 1302
- Gordy & Cook (1984) Gordy, W., & Cook, R.L., 1984, Microwave Molecular Spectra, Chapter V, Wiley, New York.
- Gronowski & Kałos (2006) Gronowski, M., Kołos, R., 2006, Chem. Phys. Let., 428, 245.
- Gronowski & Kałos (2007) Gronowski, M., Kołos, R. 2007, J. Mol. Struct., 834-836, 102.
- Guarnieri et al. (1992) Guarnieri, A., Hinze, R., Krüger, M., Zerbe-Foese, H., 1992, J. Mol. Spectrosc., 156, 39
- Hacar et al. (2020) Hacar, A., Bosman, A.D., van Dishoeck, E.F., 2020, A&A, 635, A4
- Hirahara et al. (1993) Hirahara, Y., Ohsihima, Y., Endo, Y., 1993, ApJ, 403, L83
- Huckauf et al. (1998) Huckauf, A., Guarnieri, A., Lentz, D., Fayt, A., 1998, J. Mol. Spectrosc., 188, 109
- Kaifu et al. (2004) Kaifu, N., Ohishi, M., Kawaguchi, K., et al., 2004, PASJ, 56, 69
- Kawaguchi et al. (1992a) Kawaguchi, K., Ohishi, M., Ishikawa, S.-I., Kaifu, N. 1992a, ApJ, 386, L51
- Kawaguchi et al. (1992b) Kawaguchi, K., Takano, S., Ohishi, M., Ishikawa, S.-I., et al., 1992b, ApJ, 396, L49
- Krüger et al. (1992) Krüger, M., Stahl, W., Dreizler, H., 1992, J. Mol. Spectrosc., 158, 298
- Mallinson & De Zafra (1978) Mallinson, P.D., De Zafra, R.L., 1978, Mol. Phys., 36, 872
- Marcelino et al. (2020) Marcelino, N., Agúndez, M., Tercero, B., et al., 2020, A&A, in press
- Mbosei et al. (2000) Mbosei, L., Fayt, A., Dréan, P., 2000, J. Mol. Struct., 517, 271
- Møller & Plessset (1936) Møller, C., Plesset, M.S., 1936, Phys. Rev. 46, 618.
- Müller et al. (2005) Müller, H.S.P., Schlöder, F., Stutzki, J., Winnewisser, G., 2005, J. Mol. Struct., 742, 215
- Osamura et al. (1999) Osamura, Y., Fukuzawa, K., Terzieva, R., & Herbst, E. 1999, ApJ, 519, 697
- Pardo et al. (2001) Pardo, J. R., Cernicharo, J., Serabyn, E. 2001, IEEE Trans. Antennas and Propagation, 49, 12
- Pardo et al. (2020) Pardo, J. R., Bermúdez, C., Cabezas, C., et al., 2020, A&A, 640, L13
- Spahn et al. (2008) Spahn, H., Müller, H.S.P., Giesen, T., 2008, Chem. Phys., 346, 132
- Tack & Kukolich (1983) Tack, L.M., Kukolich, S.G., 1983, J. Chem. Phys., 78, 6512
- Takano et al. (1998) Takano, S., Masuda, A., Hirahara, Y., et al., 1998, A&A, 329, 1156
- Taniguchi et al. (2016) Taniguchi, K., Ozeki, H., Saito, M., et al., 2016, ApJ, 817, 147
- Taniguchi et al. (2017) Taniguchi, K., Ozeki, H., & Saito, M. 2017, ApJ, 846, 46
- Taquet et al. (2017) Taquet, V., Wirström, E. S., Charnley, S. B., et al. 2017, A&A, 607, A20
- Thorwirth et al. (2000) Thorwirth, S., Müller, H.S.P., Winnewisser, G., 2000, J. Mol. Spectrosc., 204, 133
- Thorwirth et al. (2001) Thorwirth, S., Müller, H.S.P., Winnewisser, G., 2001, PCCP, 3, 1236
- Vastel et al. (2018) Vastel, C., kawaguchi, K., Quénard, D., et al., 2018, MNRAS, 474, L76
- Wernli et al. (2007) Wernli, M., Wiesenfeld, L., Faure, A., Valiron, P., 2007, A&A, 475, 391
- Xue et al. (2020) Xue et al., 2020, ApJ, 900, L9
- Yamada et al. (1995) Yamada, K.M.T., Moravec, A., Winnewisser, G., 1995, Z. Naturforsch, 50a, 133
Appendix A Improved rotational constants for the isotopologues of HNCCC and HCCNC and for HC4NC
While the rotational spectrum of HCCNC was already measured in the laboratory up to =33 by Guarnieri et al. (1992), only the =1-0 rotational transition of its 13C isotopologues has been measured so far (Krüger et al. 1992). Predictions for the frequencies of their rotational transitions have been obtained by initially assuming a distortion constant similar to that of the main isotopologue. This allows us to derive frequencies with uncertainties of 50-140 kHz for lines in the 31-50 GHz frequency interval. The =4-3 and 5-4 lines of H13CCNC, HC13CNC, and HCCN13C were easily detected in TMC-1 and their frequencies have been obtained with an accuracy better than 10 kHz assuming a vLSR for the source of 5.83 km s-1 (see Section 3). The derived line parameters are given in Table 3 and the spectra are shown in Fig. 1. The observed line parameters for these species in IRC+10216 are given in Table 4
| Molecule | Ju-Jl | T | vb | Tdv c | ||
|---|---|---|---|---|---|---|
| (MHz) | (mK) | (kms-1) | (mK kms-1) | (mK) | ||
| HNCCC | 4-3 | 37346.541(10) | 118.7 | 0.70(1) | 88.8(10) | 0.6 |
| HNCCC | 5-4 | 46683.061(10) | 121.2 | 0.57(1) | 73.5(10) | 1.5 |
| DNCCC | 4-3 | 35204.594(10) | 2.4 | 0.76(9) | 1.95(06) | 0.5 |
| DNCCC | 5-4 | 44005.628(10) | 3.2 | 0.46(9) | 1.64(07) | 1.1 |
| HCCNC | 4-3 | 39742.549(10) | 249.2 | 0.62(1) | 164.7(10) | 0.8 |
| HCCNC | 5-4 | 49678.075(10) | 224.6 | 0.58(1) | 138.4(10) | 1.9 |
| DCCNC | 4-3 | 36786.182(10) | 6.1e | 0.58(9) | 3.74(90) | 0.7 |
| DCCNC | 5-4 | 45982.625(10) | 9.9 | 0.60(8) | 6.38(30) | 1.1 |
| H13CCNC | 4-3 | 38504.813(10) | 2.8 | 0.68(9) | 2.03(30) | 0.6 |
| H13CCNC | 5-4 | 48130.916(10) | 4.5 | 0.45(9) | 2.50(80) | 1.7 |
| HC13CNC | 4-3 | 39595.406(10) | 4.7 | 0.80(9) | 3.97(30) | 0.7 |
| HC13CNC | 5-4 | 49494.139(07) | 4.5f | 1.5 | ||
| HCCN13C | 4-3 | 38438.864(10) | 2.7 | 0.68(9) | 1.92(40) | 0.6 |
| HCCN13C | 5-4 | 48048.449(10) | 5.4 | 0.45(9) | 2.58(70) | 1.8 |
| HCC15NC | 4-3 | 39557.751(50) | 2.2g | 0.7 |
$a$$a$footnotetext: Observed frequencies for a vLSR of 5.83 km s-1. For all entries, values between parentheses represent the uncertainty in units of the last digit.
$b$$b$footnotetext: Linewidth at half intensity derived by fitting a Gaussian line profile to the observed transitions (in kms-1).
$c$$c$footnotetext: Integrated line intensity in mK km s-1.
$d$$d$footnotetext: The sensitivity of the data (root mean square error) has been derived from a baseline to the each line in a velocity window -6.2 to 17.8 km s-1 (in mK).
$e$$e$footnotetext: Blended with a negative feature produced by the frequency switching observing mode.
$f$$f$footnotetext: 3 upper limit. Observed frequency has been replaced by the predicted frequency.
| Molecule | Ju-Jl | Tdv b | |
|---|---|---|---|
| (MHz) | (K kms-1) | ||
| HNCCC | 4-3 | 37346.448(50) | 0.064(07) |
| HNCCC | 5-4 | 46683.020(80) | 0.077(07) |
| HCCNC | 4-3 | 39742.549(30) | 0.075(04) |
| HCCNC | 5-4 | 49678.155(50) | 0.078(06) |
| HCCCN | 4-3 | 36392.327(10) | 21.21(15) |
| HCCCN | 5-4 | 45490.311(10) | 24.20(15) |
| H13CCCN | 4-3 | 35267.369(20) | 0.620(08) |
| H13CCCN | 5-4 | 44084.175(50) | 0.959(07) |
| HC13CCN | 4-3 | 36237.909(50) | 0.621(08) |
| HC13CCN | 5-4 | 45297.243(50) | 0.913(07) |
| HCC13CN | 4-3 | 36241.427(50) | 0.605(08) |
| HCC13CN | 5-4 | 45301.689(50) | 1.046(08) |
$a$$a$footnotetext: Observed frequencies for a vLSR of -26.5 km s-1 (Cernicharo et al. 2000). For all entries, values between parentheses represent the uncertainty in units of the last digit.
$b$$b$footnotetext: Integrated line intensity in K kms-1.
For the deuterated species, DCCNC, the rotational spectrum up to =51 was measured by Huckauf et al. (1998). Its rotational lines within the Q-band are predicted with a high level of accuracy (the derived line parameters are given in Table 3, see Fig. 1). For DNCCC, only the =1-0 and 2-1 lines were measured in the laboratory by Hirahara et al. (1993). In our study, we detected the =4-3 and 5-4 lines in TMC-1 and, again, we determined their central frequencies with an accuracy better than 10 kHz. The derived line parameters are also given in Table 3 and the corresponding spectra are shown in Fig. 1.
As a next step, by combining the laboratory data (Krüger et al. 1992; Hirahara et al. 1993) with the frequencies derived towards TMC-1, we obtained a new set of rotational constants for DNCCC, H13CCNC, HC13CNC, and HCCN13C. The hyperfine structure parameters, nuclear quadrupole, spin-rotation, and spin-spin constants have been fixed to the values derived from laboratory data, that is, we fitted only the rotational and the distortion constants. The results are provided in Table 5. With this new set of constants, the frequencies of the isotopologues can be predicted with accuracies better than 20 kHz at rest frequencies up to 80 GHz, and better than 100 kHz for rest frequencies up to 130 GHz (=15).
For HC4NC, the laboratory data cover lines from =3-2 up to =6-5 (Botschwina et al. 1998). The rotational lines observed in TMC1 add five more rotational transitions, from 12-11 up to =16-15. By fitting the laboratory and astrophysical lines, a new set of rotational constants were obtained for this species (see Table 5). The best improvement is obtained for the distortion constant, , which is derived to be 32.80.4 Hz, compared with the laboratory value of 34.30.9 Hz. Predictions using the new constants have an accuracy better than 20 kHz up to 70 GHz, and better than 100 kHz up to 115 GHz (=41-40).
| Molecule | ||||
|---|---|---|---|---|
| (MHz) | (kHz) | (kHz) | ||
| DNCCC | 4400.5944(4) | 0.63(9) | 5 | 1.7 |
| H13CCNC | 4813.1187(6) | 0.54(4) | 5 | 2.5 |
| HC13CNC | 4949.4462(3) | 0.64(4) | 4 | 1.0 |
| HCCN13C | 4804.8737(5) | 0.56(3) | 5 | 13.8 |
| HCCCCNCc | 1401.18216(6) | 0.0328(4) | 16 | 7.0 |
$a$$a$footnotetext: Values between parentheses represent the uncertainty in units of the last digit.
$b$$b$footnotetext: Standard deviation of the fit.
$c$$c$footnotetext: The fitted value for eQq is 0.97(3) MHz.
Appendix B HC3N, HC5N, and HC7N column densities and isotopic abundance ratios
Rest frequencies for the 13C isotopologues of HC3N were obtained by fitting all the observed rotational transitions in the laboratory (Creswell & Winnewisser 1977; Mallinson & De Zafra 1978; Thorwirth et al. 2001). For the 15N isotopologue, the measured frequencies from these references and those from Fayt et al. (2004) have been used to derive its rotational parameters.
For DC3N, all available laboratory data were used to derive its rotational parameters (Mallinson & De Zafra 1978; Tack & Kukolich 1983; Spahn et al. 2008). The main isotopologue has been extensively observed in the laboratory up to =89 (De Zafra 1971; Mbosei et al. 2000; Creswell & Winnewisser 1977; Chen et al. 1991; Yamada et al. 1995; Thorwirth et al. 2000). The derived rotational parameters were implemented in the MADEX code (Cernicharo 2012). The derived rest frequencies for the observed transitions are given in Table 7.
For HC5N and its 13C, 15N, and D isotopologues we fit the rotational transitions measured in the laboratory by Bizzocchi et al. (2004) and, again, the resulting rotational constants have been implemented in the MADEX code. The rest frequencies for the observed transitions are given in Table LABEL:tab_hc5n_TMC-1.
In order to derive column densities for all isotopologues of HC3N, HNCCC, and HCCNC, for which only two rotational lines (=4-3 and 5-4) have been observed in TMC-1, we assumed that the molecule is thermalized at a kinetic temperature of the cloud of 10 K and a source radius of 40′′ (see Section 3.1). The derived column densities are given in Table 6 and the line parameters for the HC3N rotational transitions used for this analysis are given in Tables 7. We confirm a previous result of Takano et al. (1998) concerning the overabundance of HCC13CN with respect to the other two 13C isotopologues. These authors analyzed the chemical processes that could lead to the enriched abundance for this particular isotopologue and concluded that it is produced during the formation process of HC3N – and not through a reaction of 13C+ with HC3N. This effect also shows up in HCCNC, for which its HC13CNC isotopologue is 1.8 times more abundant than H13CCNC and HCCN13C (see Table 6). We conclude, hence, that the carbon-13 attached to the nitrogen atom has a clear overabundance with respect to the other isotopologues of HCCCN and HCCNC.
| Species | Trota | Nb |
|---|---|---|
| (K) | (cm-2) | |
| HCCCN | 10.0d | (2.30.2)1014c |
| H13CCCN | 10.0d | (2.50.2)1012 |
| HC13CCN | 10.0d | (2.90.2)1012 |
| HCC13CN | 10.0d | (3.60.2)1012 |
| DCCCN | 10.0d | (3.70.2)1012 |
| HCCNC | 10.0d | (3.00.2)1012 |
| H13CCNC | 10.0d | (4.10.4)1010 |
| HC13CNC | 10.0d | (7.30.4)1010 |
| HCCN13C | 10.0d | (4.00.4)1010 |
| DCCNC | 10.0d | (1.00.3)1011 |
| HNCCC | 10.0d | (5.20.3)1011 |
| DNCCC | 10.0d | (1.20.2)1010 |
| HC5N | 8.60.2 | (1.80.2)1014c |
| H13CCCCCN | 7.30.2 | (1.80.2)1012 |
| HC13CCCCN | 6.00.1 | (2.10.2)1012 |
| HCC13CCCN | 6.60.2 | (2.00.4)1012 |
| HCCC13CCN | 7.80.4 | (1.70.3)1012 |
| HCCCC13CN | 7.30.2 | (2.10.2)1012 |
| HCCCCC15N | 8.71.4 | (4.61.0)1011 |
| DCCCCCN | 7.30.4 | (2.20.4)1012 |
| HC7N | 7.60.1 | (6.40.4)1013 |
$a$$a$footnotetext: Derived rotational temperature in K from the data in Tables 7 and LABEL:tab_hc5n_TMC-1.
$b$$b$footnotetext: Derived column density in cm-2.
$c$$c$footnotetext: Corrected for line opacity effects (see text).
$d$$d$footnotetext: Adopted value (see text).
For IRC+10216, the isotopic abundances have been discussed in detail by Cernicharo et al. (2000) who derived a 12C/13C value of 453. It should be pointed out that for the three isotopologues, the intensities of the =4-3, and 5-4 transitions differ by less than 2% and 5%, respectively (see Table 4). Hence, no fractionation effects are observed for HC3N in IRC+10216.
For HC5N, we observed seven lines of each one of its isotopologues towards TMC-1. Consequently, a rotational diagram can be built for each one of them (see Table LABEL:tab_hc5n_TMC-1). The derived rotational temperatures and column densities are given in Table 6. The rotational diagram provides a colum density of (9.00.1)1013 cm-2, which has to be considered as a lower limit because the lines show opacity effects. The weak hyperfine components corresponding to and , which are placed at 1.5-2 MHz from the blended three strongest hyperfine components =1, are detected for =12 up to 16. As an example, the transition has three strong hyperfine components separated by a few kHz and representing a total line strenght of 47.875. The two weak hyperfine components have an added line strenght of 0.125. The theoretical integrated line intensity could have a ratio of 383 between the strong and weak hyperfine components, while the observed value is 153 (see Table LABEL:tab_hc5n_TMC-1). For the =12 transition, the expected ratio is 215, while the observed value is 100.4. Therefore, in order to have a good estimate of the main isotopologue column density, we have to correct the derived column density from the strongest hyperfine components by a factor of 2. Our best estimate for the HC5N column density is, therefore, (1.80.2)1014 cm-2.
| Molecule | Ju-Jl | Fu-Fl | T | v | vb | Tdv d | ||
|---|---|---|---|---|---|---|---|---|
| (MHz) | (K) | (kms-1) | (kms-1) | (mK kms-1) | (mK) | |||
| HCCCN | 4-3 | 4-4 | 36390.8876(5) | 0.444 | 5.81(01) | 0.68(02) | 0.3235(10) | 0.6 |
| HCCCN | 4-3 | 3-2 | 36392.2345(5) | 1.865 | 5.85(02) | 0.65(05) | 1.2943(10) | 0.6 |
| HCCCN | 4-3 | 4-3/5-4e | 36392.3429(5) | 2.981 | 5.78(02) | 0.89(05) | 2.8274(10) | 0.6 |
| HCCCN | 4-3 | 3-3 | 36394.1777(5) | 0.457 | 5.80(01) | 0.67(02) | 0.3258(10) | 0.6 |
| HCCCN | 5-4 | 5-5 | 45488.8387(5) | 0.385 | 5.81(02) | 0.55(03) | 0.2358(10) | 1.3 |
| HCCCN | 5-4 | 4-3 | 45490.2594(5) | 1.669 | 5.83(10) | 0.66(10) | 0.8865(10) | 1.3 |
| HCCCN | 5-4 | 5-4/6-5e | 45490.3222(5) | 2.963 | 5.81(10) | 0.50(10) | 2.0868(10) | 1.3 |
| HCCCN | 5-4 | 4-4 | 45492.1107(5) | 0.383 | 5.80(02) | 0.56(03) | 0.2278(10) | 1.3 |
| H13CCCN | 4-3 | 4-4 | 35265.9791(7) | 0.005 | 5.98(05) | 0.96(10) | 0.0053(10) | 0.5 |
| H13CCCN | 4-3 | 3-2 | 35267.3117(7) | 0.054 | 5.80(02) | 0.73(02) | 0.0415(10) | 0.5 |
| H13CCCN | 4-3 | 4-3/5-4e | 35267.4191(6) | 0.143 | 5.76(02) | 0.78(02) | 0.1185(10) | 0.5 |
| H13CCCN | 4-3 | 3-3 | 35269.2342(7) | 0.006 | 5.66(05) | 0.68(10) | 0.0040(10) | 0.5 |
| H13CCCN | 5-4f | 44084.1622(8) | 0.188 | 5.82(02) | 0.77(02) | 0.1538(10) | 1.3 | |
| HC13CCN | 4-3 | 4-4 | 36236.5139(7) | 0.004 | 5.96(05) | 0.54(10) | 0.0025(10) | 0.6 |
| HC13CCN | 4-3 | 3-2 | 36237.8535(7) | 0.064 | 5.81(03) | 0.65(03) | 0.1343(10) | 0.6 |
| HC13CCN | 4-3 | 4-3/5-4f | 36237.9619(7) | 0.167 | 5.77(03) | 0.75(03) | 0.1327(10) | 0.6 |
| HC13CCN | 4-3 | 3-3 | 36239.7865(7) | 0.006 | 5.75(05) | 0.63(10) | 0.0052(10) | 0.6 |
| HC13CCN | 5-4f | 45297.3345(7) | 0.190 | 5.83(02) | 0.76(02) | 0.1532(10) | 1.3 | |
| HCC13CN | 4-3 | 4-4 | 36240.0100(7) | 0.008 | 5.85(04) | 0.54(02) | 0.0048(10) | 0.6 |
| HCC13CN | 4-3 | 3-2 | 36241.3514(7) | 0.093 | 5.82(03) | 0.68(02) | 0.0674(10) | 0.6 |
| HCC13CN | 4-3 | 4-3/5-4f | 36241.4436(7) | 0.239 | 5.75(03) | 0.72(02) | 0.1820(10) | 0.6 |
| HCC13CN | 4-3 | 3-3 | 36243.2862(7) | 0.007 | 5.73(04) | 0.64(02) | 0.0050(10) | 0.6 |
| HCC13CN | 5-4f | 45301.7069(8) | 0.270 | 5.79(01) | 0.75(02) | 0.2164(10) | 1.3 | |
| HCCC15N | 4-3 | 35333.8879(7) | 0.079 | 5.77(02) | 0.72(02) | 0.0598(10) | 0.5 | |
| HCCC15N | 5-4 | 44167.2678(9) | 0.096 | 5.79(04) | 0.55(02) | 0.0567(10) | 1.3 | |
| DCCCN | 4-3 | 4-4 | 33771.0873(3) | 0.007 | 5.78(10) | 0.78(10) | 0.0060(10) | 0.5 |
| DCCCN | 4-3 | 3-2 | 33772.4373(3) | 0.086 | 5.74(02) | 0.83(03) | 0.0754(20) | 0.5 |
| DCCCN | 4-3 | 4-3/5-4g | 33772.5477(3) | 0.229 | 5.76(02) | 0.79(03) | 0.1917(20) | 0.5 |
| DCCCN | 4-3 | 3-3 | 33774.3772(3) | 0.003 | 5.86(10) | 0.78(05) | 0.0020(05) | 0.5 |
| DCCCN | 5-4f | 42215.5823(9) | 0.320 | 5.84(02) | 0.78(03) | 0.2653(10) | 0.9 |
$a$$a$footnotetext: Adopted rest frequencies (see text).
$b$$b$footnotetext: Local standard of rest velocity of the emission for the adopted rest frequency (in kms-1).
$c$$c$footnotetext: Linewidth at half intensity derived by fitting a Gaussian line profile to the observed transitions (in kms-1).
$d$$d$footnotetext: Integrated line intensity in K kms-1.
$e$$e$footnotetext: The sensitivity of the data (root mean square error) has been derived from a baseline to the each line in a velocity window -6.2 to 17.8 km s-1 (in mK).
$f$$f$footnotetext: Average of the two strongest hyperfine components.
$g$$g$footnotetext: Average of the three strongest hyperfine components.
Unlike the case of HC3N, the 13C isotopologues of HC5N do not show any significant
abundance ratio anomaly.
Nevertheless, the isotopologue HCCCC13CN shows, for all observed
transitions, a slightly larger intensity than the other 13C substitutions. In order to evaluate whether this
variation is statistically relevant, we derived the integrated intensity ratios for
each observed transition, taking H13CCCCCN as reference.
The average
values of these ratios for the =12-11 up to =16-15 lines are:
HC13CCCCN/H13CCCCCN=0.990.04,
HCC13CCCN/H13CCCCCN=1.030.04,
HCCC13CCN/H13CCCCCN=1.010.04,
and
HCCCC13CN/H13CCCCCN=1.150.04.
Takano et al. (1998) reported the detection of H13CCCCCN and HCCCC13CN, claiming an abundance ratio of 1.3 between them. However, our more sensitive data suggest a similar abundance for all 13C isotopologues, with a slightly larger abundance of 15% (within 3.5) for HCCCC13CN. The average value for the column density derived from the five 13C isotopologues is (1.940.08)1012 cm-12. Consequently, the 12C/13C abundance ratio in TMC-1 is 9310, which is very close to the solar value. For the observation of two rotational lines of the five isotopologues, Taniguchi et al. (2016) obtained a similar value for the isotopic ratio, 946. They also concluded that no significant differences do exist between the abundances of the five 13C isotopologues.
Finally, we derived a N/15N isotopic abundance ratio of N(HC5N)/N(HCN)=39185 and a deuterium enrichment N(HC5N)/N(DC5N)=8220. This deuteration enrichment is similar to the one derived from HC3N (60), HNCCC (43), and HCCNC (30).
| Molecule | Ju-Jla | T | v | ve | Tdv c | ||
|---|---|---|---|---|---|---|---|
| (MHz) | (K) | (kms-1) | (kms-1) | (K kms-1) | (mK) | ||
| HC5N | 12-11 | 31951.7764( 4) | 1.925 | 5.83(01) | 0.66(01) | 1.3574(10) | 0.8 |
| =11-11 | 31953.4494( 5) | 0.008 | 5.80(04) | 0.58(06) | 0.0049(10) | 0.8 | |
| =12-12 | 31950.2362( 5) | 0.012 | 5.85(02) | 0.69(06) | 0.0086(10) | 0.8 | |
| HC5N | 13-12 | 34614.3853( 5) | 1.667 | 5.82(01) | 0.73(01) | 1.2858(10) | 0.5 |
| =12-12 | 34616.0526( 5) | 0.007 | 5.85(03) | 0.63(06) | 0.0045(10) | 0.5 | |
| =13-13 | 34612.8403( 5) | 0.009 | 5.77(03) | 1.17(07) | 0.0105(10) | 0.5 | |
| HC5N | 14-13 | 37276.9847( 6) | 1.737 | 5.82(01) | 0.66(01) | 1.2282(10) | 0.5 |
| =13-13 | 37278.6473( 5) | 0.005 | 5.78(05) | 0.62(11) | 0.0031(10) | 0.5 | |
| =14-14 | 37275.4357( 5) | 0.006 | 5.81(04) | 0.80(10) | 0.0051(10) | 0.5 | |
| HC5N | 15-14 | 39939.5741( 6) | 1.769 | 5.84(01) | 0.59(01) | 1.1078(10) | 0.7 |
| =14-14 | 39941.2326( 6) | 0.005 | 5.93(05) | 0.46(06) | 0.0025(10) | 0.7 | |
| =15-15 | 39938.0215( 6) | 0.006 | 5.78(02) | 0.76(09) | 0.0048(10) | 0.7 | |
| HC5N | 16-15 | 42602.1527( 6) | 1.710 | 5.84(01) | 0.54(01) | 0.9735(10) | 1.0 |
| =15-15 | 42603.8075( 6) | 0.005 | 5.88(05) | 0.49(07) | 0.0027(10) | 1.0 | |
| =16-16 | 42600.5968( 6) | 0.005 | 5.92(05) | 0.63(12) | 0.0037(10) | 1.0 | |
| HC5N | 17-16 | 45264.7196( 7) | 1.429 | 5.83(01) | 0.55(01) | 0.8305(10) | 1.3 |
| HC5N | 18-17 | 47927.2743( 7) | 1.213 | 5.84(01) | 0.57(01) | 0.7302(10) | 1.6 |
| H13CCCCCN | 12-11 | 31120.0298(22) | 0.034 | 5.85(14) | 0.65(03) | 0.0236(10) | 1.3 |
| H13CCCCCN | 13-12 | 33713.3286(24) | 0.031 | 5.80(04) | 0.74(01) | 0.0246(10) | 0.6 |
| H13CCCCCN | 14-13 | 36306.6185(26) | 0.031 | 5.81(06) | 0.64(02) | 0.0211(10) | 0.6 |
| H13CCCCCN | 15-14 | 38899.8989(27) | 0.030 | 5.82(06) | 0.63(01) | 0.0201(10) | 0.7 |
| H13CCCCCN | 16-15 | 41493.1690(29) | 0.028 | 5.82(08) | 0.54(02) | 0.0161(10) | 0.8 |
| H13CCCCCN | 17-16 | 44086.4282(30) | 0.022 | 5.82(16) | 0.56(03) | 0.0131(10) | 1.2 |
| H13CCCCCN | 18-17 | 46679.6757(32) | 0.018 | 5.79(19) | 0.61(04) | 0.0117(10) | 1.3 |
| H13CCCCCN | 19-18 | 49272.9109(33) | 0.018 | 5.91(29) | 0.66(06) | 0.0126(10) | 1.9 |
| HC13CCCCN | 12-11 | 31624.3437(20) | 0.039 | 5.88(07) | 0.65(01) | 0.0270(10) | 0.7 |
| HC13CCCCN | 13-12 | 34259.6672(21) | 0.032 | 5.84(05) | 0.71(01) | 0.0239(10) | 0.5 |
| HC13CCCCN | 14-13 | 36894.9814(23) | 0.032 | 5.85(06) | 0.59(02) | 0.0201(10) | 0.6 |
| HC13CCCCN | 15-14 | 39530.2857(24) | 0.030 | 5.88(06) | 0.62(02) | 0.0192(10) | 0.6 |
| HC13CCCCN | 16-15 | 42165.5793(26) | 0.026 | 5.87(10) | 0.54(03) | 0.0149(10) | 0.8 |
| HC13CCCCN | 17-16 | 44800.8615(27) | 0.022 | 5.85(12) | 0.48(03) | 0.0115(10) | 1.2 |
| HC13CCCCN | 18-17 | 47436.1316(28) | 0.013 | 5.86(30) | 0.56(07) | 0.0078(10) | 1.5 |
| HCC13CCCN | 12-11 | 31918.6866(18) | 0.038 | 5.87(08) | 0.65(02) | 0.0258(10) | 0.7 |
| HCC13CCCN | 13-12 | 34578.5381(19) | 0.033 | 5.86(05) | 0.72(01) | 0.0256(10) | 0.6 |
| HCC13CCCN | 14-13 | 37238.3802(21) | 0.033 | 5.86(07) | 0.65(02) | 0.0227(10) | 0.6 |
| HCC13CCCN | 15-14 | 39898.2122(22) | 0.031 | 5.88(06) | 0.60(01) | 0.0199(10) | 0.7 |
| HCC13CCCN | 16-15 | 42558.0335(23) | 0.028 | 5.87(09) | 0.53(02) | 0.0156(10) | 0.8 |
| HCC13CCCN | 17-16 | 45217.8432(24) | 0.025 | 5.89(15) | 0.65(04) | 0.0169(10) | 1.3 |
| HCC13CCCN | 18-17 | 47877.6406(26) | 0.015 | 5.86(30) | 0.49(07) | 0.0079(10) | 1.7 |
| HCCC13CCN | 12-11 | 31922.5700(16) | 0.036 | 5.82(08) | 0.68(02) | 0.0264(10) | 0.7 |
| HCCC13CCN | 13-12 | 34582.7452(17) | 0.032 | 5.81(07) | 0.69(02) | 0.0232(10) | 0.6 |
| HCCC13CCN | 14-13 | 37242.9110(18) | 0.033 | 5.83(08) | 0.67(02) | 0.0234(10) | 0.8 |
| HCCC13CCN | 15-14 | 39903.0667(19) | 0.030 | 5.84(06) | 0.58(01) | 0.0183(10) | 0.7 |
| HCCC13CCN | 16-15 | 42563.2117(20) | 0.027 | 5.84(08) | 0.56(02) | 0.0163(10) | 0.9 |
| HCCC13CCN | 17-16 | 45223.3451(21) | 0.023 | 5.81(12) | 0.53(03) | 0.0128(10) | 1.1 |
| HCCC13CCN | 18-17 | 47883.4663(22) | 0.021 | 5.86(27) | 0.61(06) | 0.0135(10) | 1.7 |
| HCCCC13CN | 12-11 | 31636.1315(14) | 0.042 | 5.86(07) | 0.66(02) | 0.0294(10) | 0.8 |
| HCCCC13CN | 13-12 | 34272.4373(15) | 0.036 | 5.81(05) | 0.72(01) | 0.0277(10) | 0.5 |
| HCCCC13CN | 14-13 | 36908.7338(16) | 0.038 | 5.84(05) | 0.66(01) | 0.0263(10) | 0.6 |
| HCCCC13CN | 15-14 | 39545.0204(17) | 0.033 | 5.85(05) | 0.61(01) | 0.0216(10) | 0.7 |
| HCCCC13CN | 16-15 | 42181.2963(18) | 0.034 | 5.85(06) | 0.54(02) | 0.0193(10) | 0.8 |
| HCCCC13CN | 17-16 | 44817.5608(19) | 0.025 | 5.84(11) | 0.60(03) | 0.0156(10) | 1.0 |
| HCCCC13CN | 18-17 | 47453.8132(20) | 0.020 | 5.86(16) | 0.63(04) | 0.0132(10) | 1.3 |
| HCCCCC15N | 12-11 | 31167.1619(15) | 0.010 | 5.90(35) | 0.61(06) | 0.0064(10) | 0.9 |
| HCCCCC15N | 13-12 | 33764.3882(17) | 0.007 | 5.80(24) | 0.64(07) | 0.0045(10) | 0.5 |
| HCCCCC15N | 14-13 | 36361.6056(18) | 0.010 | 5.75(21) | 0.81(05) | 0.0084(10) | 0.6 |
| HCCCCC15N | 15-14 | 38958.8134(19) | 0.010 | 5.75(22) | 0.83(05) | 0.0087(10) | 0.6 |
| HCCCCC15N | 16-15 | 41556.0109(20) | 0.007 | 5.81(33) | 0.57(07) | 0.0042(10) | 0.8 |
| HCCCCC15N | 17-16 | 44153.1975(21) | 0.007 | 5.84(44) | 0.53(10) | 0.0039(10) | 1.2 |
| HCCCCC15N | 18-17 | 46750.3723(22) | 0.007 | 5.79(27) | 0.54(08) | 0.0039(10) | 1.2 |
| DC5N | 13-12 | 33047.2676(05) | 0.040 | 5.84(01) | 0.66(02) | 0.0284(10) | 0.6 |
| DC5N | 14-13 | 35589.3244(05) | 0.037 | 5.86(01) | 0.66(01) | 0.0260(10) | 0.6 |
| DC5N | 15-14 | 38131.3723(05) | 0.036 | 5.86(01) | 0.62(02) | 0.0238(10) | 0.5 |
| DC5N | 16-15 | 40673.4104(06) | 0.038 | 5.87(01) | 0.51(01) | 0.0205(10) | 0.7 |
| DC5N | 17-16 | 43215.4382(06) | 0.029 | 5.89(01) | 0.49(02) | 0.0151(10) | 1.0 |
| DC5N | 18-17 | 45757.4551(07) | 0.022 | 5.88(02) | 0.70(05) | 0.0167(10) | 1.3 |
| DC5N | 19-18 | 48299.4603(07) | 0.016 | 5.79(04) | 0.56(07) | 0.0097(10) | 1.7 |
| HC7N | 28-27 | 31583.7088(10) | 0.320 | 5.85(02) | 0.63(01) | 0.2147(10) | 0.8 |
| HC7N | 29-28 | 32711.6717(10) | 0.272 | 5.84(02) | 0.67(01) | 0.1946(10) | 0.6 |
| HC7N | 30-29 | 33839.6318(10) | 0.229 | 5.83(02) | 0.71(01) | 0.1722(10) | 0.5 |
| HC7N | 31-30 | 34967.5890(10) | 0.203 | 5.85(02) | 0.69(01) | 0.1480(10) | 0.5 |
| HC7N | 32-31 | 36095.5431(11) | 0.189 | 5.86(02) | 0.64(01) | 0.1298(10) | 0.7 |
| HC7N | 33-32 | 37223.4942(11) | 0.168 | 5.85(02) | 0.63(01) | 0.1134(10) | 0.6 |
| HC7N | 34-33 | 38351.4420(12) | 0.147 | 5.86(02) | 0.60(02) | 0.0938(10) | 0.7 |
| HC7N | 35-34 | 39479.3866(12) | 0.124 | 5.87(02) | 0.58(02) | 0.0766(10) | 0.6 |
| HC7N | 36-35 | 40607.3277(12) | 0.113 | 5.87(02) | 0.52(02) | 0.0624(10) | 0.9 |
| HC7N | 37-36 | 41735.2654(12) | 0.092 | 5.87(03) | 0.49(02) | 0.0476(10) | 1.1 |
| HC7N | 38-37 | 42863.1995(13) | 0.077 | 5.87(03) | 0.51(03) | 0.0415(10) | 0.9 |
| HC7N | 39-38g | 43991.1299(13) | 1.0 | ||||
| HC7N | 40-39 | 45119.0565(13) | 0.047 | 5.87(02) | 0.54(03) | 0.0270(10) | 1.4 |
| HC7N | 41-40 | 46246.9792(13) | 0.043 | 5.87(02) | 0.46(03) | 0.0210(10) | 1.3 |
| HC7N | 42-41 | 47374.8980(14) | 0.022 | 5.88(03) | 0.49(04) | 0.0116(10) | 1.5 |
| HC7N | 43-42 | 48502.8127(14) | 0.018 | 5.78(02) | 0.64(06) | 0.0125(10) | 1.7 |
| HC7N | 44-43 | 49630.7232(14) | 0.013 | 5.95(06) | 0.57(12) | 0.0076(10) | 2.1 |
$a$$a$footnotetext: Except when indicated, it corresponds to the group of the three strongest hyperfine components (F=1).
$b$$b$footnotetext: Adopted rest frequencies (see text).
$c$$c$footnotetext: Local standard of rest velocity of the emission for the adopted rest frequency (in kms-1).
$d$$d$footnotetext: Linewidth at half intensity derived by fitting a Gaussian line profile to the observed transitions (in kms-1).
$e$$e$footnotetext: Integrated line intensity in K kms-1.
$f$$f$footnotetext: The sensitivity of the data (root mean square error) has been derived from a baseline to the each line in a velocity window -6.2 to 17.8 km s-1 (in mK).
$g$$g$footnotetext: Line fully blended with a strong negative feature produced by the frequency switching observing procedure.
Appendix C Quantum chemical calculations for the HC5N isomers
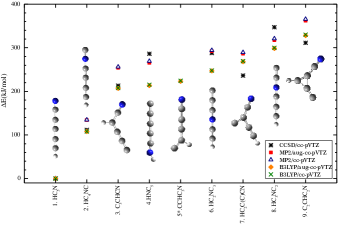
The relative stability between the possible isomers of HC5N has been evaluated by different quantum chemical calculations. As initial values for our calculations, we took the optimized structures present in the literature (Gronowski & Kałos 2006, 2007). We optimized these structures using sequential calculation methods in oder of complexity: first, the density functional theory (DFT) hybrid exchange-correlation variant (B3LYP), then the Møller-Plesset second-order perturbation theory (Møller & Plessset 1936), and, finally, closed-shell coupled cluster with singles and doubles (CCSD) (Cížek 1969). For all these methods, we used the Dunning’s correlation consistent polarized valence triple- basis sets (cc-pVTZ), and, in the case of the DFT and MP2 methods, we increased the basis sets with diffuse functions (aug-cc-pVTZ), see Figure 4.1. Besides the optimization, we have calculated some relevant parameters such as the vibrational energies, IR intensities and the rotational constants at the vibrational ground state, thanks to the frequency calculations using the MP2/cc-pVTZ level of theory under anharmonic corrections (see Table 9). All these calculations were performed using the Gaussian 09 (Frisch et al. 2013) software package.
The energy order of the HC5N isomers does not drastically change as a function of the level of theory assumed. As expected, the two most stable isomers are HC5N (1) and HC4NC (2), separated in energy by 110 kJ/mol. In the 200 -400 kJ/mol range, we found seven different species, including: additional linear structures (or quasi linear) such as: HNC5 (4), HC2NC3 (6), and HC3NC2 (8); a cyclic species (C2CHC2N (9); and branched structures: C3CHCN (3), CCHC3N (5)), HC2C(C)CN (6). In case of the quasi linear structure HNC5 (4), we verified the non-linearity of its structure by calculating the potential well; see Figure 5.2. As pointed out in the literature (Gronowski & Kałos 2006), some branched isomers are more stable that the linear structures. Nevertheless, we found some difficulties in finding the minimum energy potential for some of these branched species: 5 and 7.
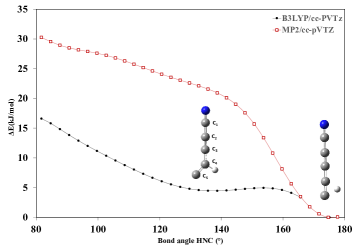
Species 5, CCHC3N, was considered the one with lowest energy among the branched C5HN isomers in the literature (Gronowski & Kałos 2006, 2007). The relative stability of CCHC3N compared to other linear structures has led a number of authors to propose it, together with the two carbon less analogue, CCHCN, as good candidates for searches in space. In our calculations, we could find the optimized structure 5 using the B3LYP method, however, neither the MP2 or CCSD converged to this structure. To understand the non-convergence to this structure, we analyzed the potential energy along the C3 C4 C5 bond angle and we compared the results between the B3LYP and MP2 methods; see Figure 6.3. For the structure in the B3LYP calculation, we found a minimum at a C3 C4 C5 bond angle of 137∘. In contrast, for the MP2 calculations, any potential well was found around this angle. The only stable structure obtained with MP2 and CCSD methods corresponds to a species where the hydrogen is no longer covalently linked to the carbon chain which is linearly bounded.
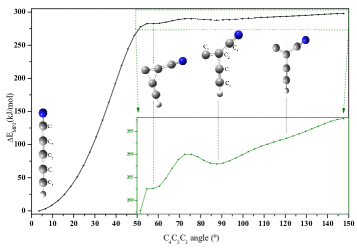
Another isomer that should be pointed out is the species 7,HC2C(C)CN since the bond angle around the branching structure C4 C2 C3 has a non-conventional value of 90∘. A similar structure was proposed between the most stables isomers by Gronowski & Kałos (2006). However, calculations by the same author in 2007 indicated that the bond angle of the optimized structure was 120∘ (Gronowski & Kałos 2007). Our scan along the C4 C2 C3 bond angle (Figure 7.4) at MP2/cc-pVTZ level of theory does not show any potential minima at the 120∘ angle. The only structures that converged in the calculations are those corresponding to zero degrees, that is, the species 1, and the 90∘ one. Neither the cyclic structure or the 120∘ converged with the MP2 methodology. In contrast, CCSD calculations show that the real minima is at 120∘ bond angle, which is the reason why the energy at CCSD is lower than the one at MP2 calculations.
Independently of the level of theory employed in the calculations, the two observed species in space, HC5N (1) and HC4NC (2), are the most stable isomers of cyanodiacetylene.
The rotational constants we have calculated for the different isomers of HC5N are precise enough to search for them in space. However, we could expect very weak lines, which would be well below those of HC4NC. Hence, the possibility to detect them in interstellar clouds without precise laboratory frequencies is rather unlikely.
| (a)𝑎(a)(a)𝑎(a)footnotemark: | (b)𝑏(b)(b)𝑏(b)footnotemark: | (c)𝑐(c)(c)𝑐(c)footnotemark: | (c)𝑐(c)(c)𝑐(c)footnotemark: | (c)𝑐(c)(c)𝑐(c)footnotemark: | (d)𝑑(d)(d)𝑑(d)footnotemark: | (d)𝑑(d)(d)𝑑(d)footnotemark: | ||||
|---|---|---|---|---|---|---|---|---|---|---|
| (kJ/mol) | (kJ/mol) | (MHz) | (MHz) | (MHz) | (MHz) | (MHz) | (D) | 50K | 300K | |
| HC5Ne | 0.0 | 0.0 | 1320.046 | -5.77 | 4.36 | 1.09 | 22.89 | |||
| HC4NCf | 134.7 | 133.8 | 1390.737 | 1.15 | 3.57 | 1.07 | 22.62 | |||
| C3CHCN | 256.1 | 254.5 | 21076.776 | 1689.938 | 1564.496 | -2.73 | -0.41 | 3.09 | 1.10 | 14.18 |
| C5NH | 269.2 | 267.7 | 1348.267 | 2.10 | 0.31 | 9.14 | 1.02 | 8.86 | ||
| HC2NC3 | 294.1 | 292.2 | 1434.147 | 2.96 | 6.58 | 1.01 | 8.06 | |||
| HC2C(C)CN | 289.3 | 284.2 | 10693.657 | 2526.651 | 2038.799 | -4.72 | -0.20 | 3.27 | 1.06 | 15.93 |
| HC3NC2 | 320.8 | 316.2 | 1435.856 | 0.91 | 7.15 | 1.03 | 15.46 | |||
| C2CHC2N | 365.5 | 361.3 | 11195.360 | 2552.013 | 2073.245 | -5.24 | -0.14 | 4.48 | 1.15 | 15.16 |
$b$$b$footnotetext: Relative energy including the zero-point correction energy calculated for each species.
$c$$c$footnotetext: Rotational constants at the ground state evaluated using the vibration-rotation interaction constants obtained using the anharmonic corrections. In the case of the quasi linear C5NH, the effective rotational constant, , is provided.
$d$$d$footnotetext: Vibrational partition function calculated using the expression (Gordy & Cook 1984), where and represent the energy and the degeneracy of each vibrational mode. The energies for the vibrational modes are taken from the results of ab initio calculations evaluated at MP2/cc-pVTZ level of theory, under the anharmonic correction. At the temperature of TMC1 ( 10K), the vibrational partition function for isomers is equal to one.
$e$$e$footnotetext: The experimental value is =1331.332690.00002 (Bizzocchi et al. 2004). The ratio is 1.0086.
$f$$f$footnotetext: The experimental value is =1401.182160.00006 (this work, see Table 5. The ratio is 1.0075.